Article

Stratigraphy, Paleogeography and Depositional Setting of the K–Mg Salts in the Zechstein Group of Netherlands—Implications for the Development of Salt Caverns

SEDISOR, Place Copernic, 29280 Plouzané, France
Minerals 2022, 12(4), 486; https://doi.org/10.3390/min12040486
Submission received: 3 March 2022 / Revised: 3 April 2022 / Accepted: 12 April 2022 / Published: 16 April 2022

Abstract

:
The 1 km thick evaporitic Permian Zechstein group in the Netherlands is subdivided into 5 halite rich evaporitic sequences including K–Mg salts (polyhalite, kieserite, sylvite, carnallite and bischofite) for which the position in the Zechstein stratigraphy is still poorly constrained. Understanding the repartition of K–Mg salts is especially important for the development of salt caverns which require a salt as pure as possible in halite. By compiling well log and seismic data in the offshore and onshore domains of the Netherlands, regional cross-sections and isopach maps were performed in order to update the lithostratigraphy of the Zechstein group by including the K–Mg salts. Results enable (i) to propose paleogeographic maps representing the spatial repartition and the thickness variations of one to two K–Mg rich intervals in each evaporite cycle, (ii) to constrain the depositional setting of the different type of salts and the hydrological conditions which influenced the Zechstein stratigraphic architecture and (iii) to develop over the Netherlands risking maps assessing the risk of encountering K–Mg salts in salt pillows or salt diapirs eligible in term of depth and thickness for the development of salt caverns.

1. Introduction

The Netherlands subsurface displays large accumulation of salt belonging to the Zechstein group. The evaporites deposited during the Permian over a salt giant basin that was extending from the east of the Scottish coasts to the westernmost Belarus and southern Latvia in the east (Figure 1A) [1,2,3]. The Zechstein group was up to 2 km thick and drove intensive halokinetic deformations since the Late Triassic [4,5]. The Zechstein evaporites include four main types of lithologies which are marking 5 to 7 basin-scale evaporite sequences: shale, carbonate, sulfate, halite and K–Mg salts (dominantly including polyhalite, kieserite, carnallite and bischofite) (Figure 1B) [6,7,8]. Carbonate and sulphate deposits formed prograding platforms in the marginal part of the basins, whereas halite accumulated in basin centers during drawdown periods. K–Mg salts accumulated in time periods marked by drawdown maxima at salinity concentrations that were more than 70–90 times that of the original seawater [9]. The Zechstein group played a key role for many petroleum systems: it acts as the main seal of pre-salt reservoirs, intra-salt petroleum systems have been reported with the Zechstein carbonates acting as the main reservoirs and the halokinetic deformations of the salt shaped the structural trap of many post-salt reservoirs [10]. Magnesium and potash mineral resources are also exploited from the mining and leaching of K–Mg salts in the Zechstein [11,12,13].
For the storage of oil and natural gas, salt caverns have also been successfully created in diapirs of the Zechstein evaporites, such as in the Zuidwending salt dome, where five salt caverns about 550,000 m3 each (radius ~25 m ∗ height ~300 m) have been developed at 1000 m depth and are able to provide a working gas volume of ~45 million m3 of natural gas per cavern [15,16]. In the coming decades, several scenarios may cause the development of more salt caverns in the Zechstein, for the storage of green hydrogen especially (hydrogen produced by electrolysis of water) [16,17]. Indeed, H2 is a promising energy resource, allowing us to significantly reduce the emission of greenhouse gas. The production of green H2 would rely on an eolian electricity resource, dependent of climate conditions, and thus prone to intermittency availability. Salt caverns would then offer the opportunity to (i) store the excess of produced H2 in periods marked by favorable wind conditions and (ii) use the stored H2 to compensate the deficit of produced H2 in periods marked by unfavorable wind conditions [17,18]. To date, all existing salt caverns were developed onshore. However, recent studies highlighted the opportunity of developing salt caverns in the offshore domain [19,20,21] in the Netherlands, especially where half of the storage potential is located offshore (>50 km away from the coast [18]). Offshore storage in salt caverns could have the benefits of (i) increasing the potential number of salt caverns without being embarrassed by surface installation already in place; (ii) reducing the environmental and human risks, in case of leakage, earthquake-induced events, H2 contamination of underground drinking water or any operational issues; (iii) avoiding the long-term monitoring of the salt cavern once they are abandoned and (iv) increasing the social acceptability of underground H2 storage [22].
Salt cavern development can be performed in bedded or diapiric evaporites, provided that some geological safety criteria are fulfilled. The most important ones are (i) an evaporite thickness of at least ~200 m [17,18,23], (ii) a depth of the top salt not exceeding 1700–2000 m [24] and (iii) a composition as pure as possible in halite [25,26]. Modern seismic imaging tools are relatively efficient to constrain the thickness, shape and depth of salt deposits and salt structures. However, constraining the intrasalt lithologies requires a good knowledge of the targeted evaporite formation and of its stratigraphic architecture especially [27,28]. In the case of the Zechstein group, a very large number of publications constrained the primary stratigraphic architecture of the evaporites, their composition, their spatial repartition and their halokinetic deformations [29,30,31,32,33,34,35,36]. However, if marginal platforms have been the focus of many stratigraphic and sedimentologic studies [35,37,38,39,40,41,42,43], the spatial distribution and thickness variations of the K–Mg salts within halite remain poorly constrained. This is illustrated by the fact that, in the published stratigraphic charts of the Zechstein group in the Netherlands, K–Mg salts and halite are always undifferentiated (Figure 1B). However, predicting the occurrence of K–Mg salts in bedded or diapiric salt is critical when dealing with the development of salt cavities as this can influence the shape and stability of the cavern during leaching and storage operations.
Accordingly, this study uses bibliographical, well log and seismic data to propose a geological synthesis of the Zechstein salt basin in the Netherlands with a focus on the K–Mg salt deposits. The main goals of this data synthesis are (i) to improve the stratigraphy of the Zechstein salts by constraining the spatial architecture of the halite and K–Mg salts in the onshore and offshore domains of Netherlands, (ii) to review the depositional model of the Zechstein salts by discussing the influence of tectonic and hydrological conditions on the stratigraphic architecture and (iii) to provide maps allowing us to assess the risks of encountering hyper-soluble K–Mg salts in salt structures eligible for salt cavern development.

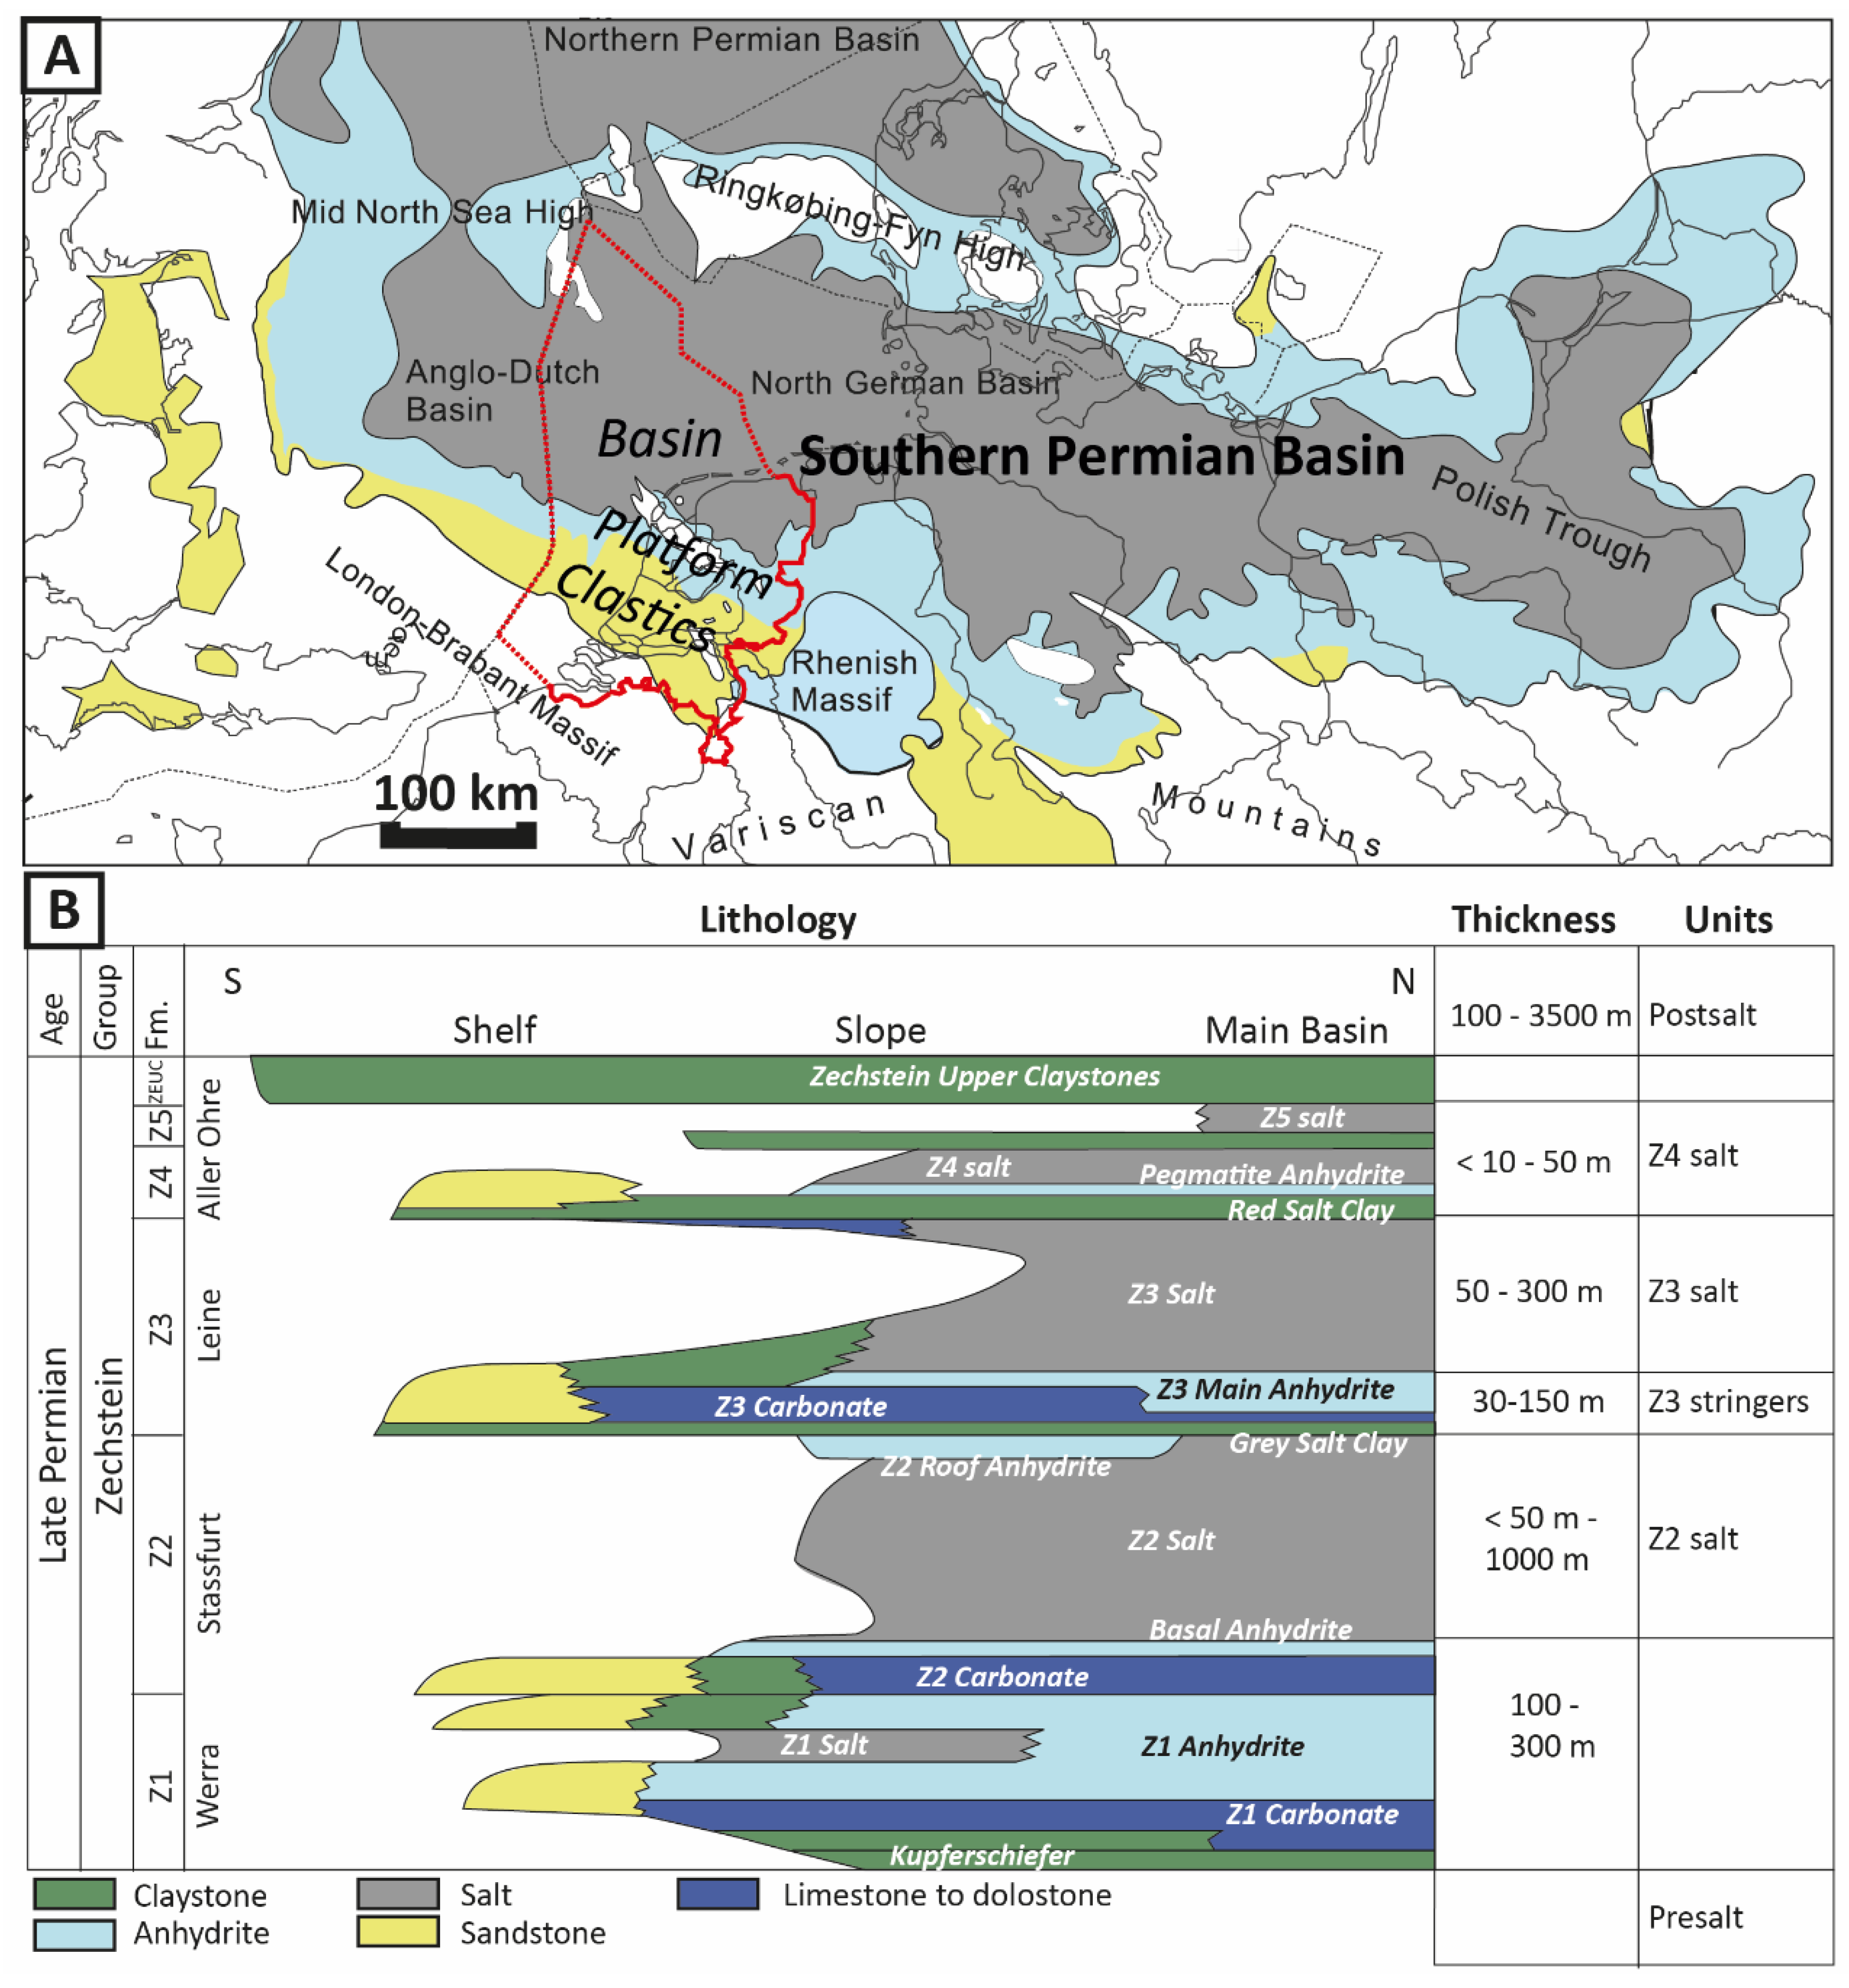
2. Geological Setting

2.1. Tectono-Stratigraphic Setting

The Central European Basin developed from the End of the Variscan Orogeny with a post-orogenic collapse and a following rifting [3,44]. Crustal cooling drove a regional subsidence during the Permian coupled with minor and localized extensional faulting [45,46]. In the Dutch area, this Permo-Carboniferous tectonics activity subdivided the study area in structural lows and highs bounded by large Variscan fault zones which strongly influenced facies and thickness variations of the Permian to Mesozoic deposits [5,47,48,49].
Early to Late Permian facies (Rotliegend Formation) deposited in lacustrine to fluvial and arid continental depositional environments [50]. The Zechstein salt basin developed in the Late Permian, when a global glacio-eustatic sea-level rise, coupled with active rifting in the North Sea, allowed the development of a seaway between the Permian Basin and the Artic Ocean. During 2.8 to 7 My [3,44,51,52,53], marine influxes in the Central European Basin provided the brines necessary for the development of the Zechstein group and the thick accumulation of evaporites under arid conditions. The Zechstein evaporite factory was influenced by eustatic variations which subdivided the stratal architecture of the formation in five evaporites cycles commonly named Z1 to Z5 and further detailed below (Figure 1B).
Post-salt sedimentation includes up to 4000 m of Triassic to Neogene marine and continental deposits. Halokinesis of the Zechstein initiated in the Early Triassic under extensional strains. An important Late Jurassic uplift event induced the erosion of Triassic to Zechstein deposits above structural high, especially at the Texel Ijsselmeet High [47] and in the northern salt province of the Netherlands offshore domain. Compressive strains occurred from the Late Cretaceous and induced the deformation and quizzing of many salt structures [4,33]. Finally, a Cenozoic inversion reactived the halokinetic deformations [54]. Nowadays, this multi-phased halokinesis results in a large number of salt pillows, diapirs and walls all over the Permian Basin [5,54] (Figure 2).

2.2. Stratal Architecture of the Zechstein group in Netherland—State of the Art

The Zechstein evaporites display a succession of shales, carbonates, sulfates, halite and K–Mg salts organized in evaporite sequences which were at first order controlled by the amount of the seawater inflows in the basin, itself linked to third or fourth-order sequences of eustatic variations [55,56,57]. Three formation boundaries act as maximum flooding surfaces: base Z1 with the Coppershale Member; base Z3 with the Gray Salt Clay Member and base Z4 with the Red Salt Clay Member (Figure 1B). The carbonates represent the high-stand system tracks. The sulfate and capping halite and K–Mg salt represent the lowstand system tracks. The depositional thickness of the Zechstein group ranges from less than 50 m in the southern Netherlands to more than 1200 m in the northern offshore area [8]. It is hereafter sum up the stratigraphy of the 5 Zechstein sequences reported in the Netherlands, based on [8,58] and references therein.

2.2.1. Z1—Werra Fm

The Z1 comprises the basal Coppershale (Z1E), the Z1 Carbonate (Z1B), Z1 Anhydrite (Z1A) and Z1 Salt (Z1H). The formation starts with a 0.5 m thick, finely laminated claystone (Coppershale or Kupferschiefer), capped by the Z1 Carbonate, a carbonate platform up to 200 m thick which developed onshore-ward and along the Mid North Sea High [30] and which was laterally grading to 8–10 m thick limestones and dolomite in sediment-starved basinal setting [35]. With increasing saline conditions due to the lowering of the sea level, the Z1 carbonates graded at the basinward side to an anhydrite platform which was locally up to 300 m thick. Offshore ward, in the main basin, the precipitation rate of sulphates was limited under bottom anoxic conditions by bacterial sulphate consumption and the anhydrite was ~40 m thick. On the anhydrite platform, a series of fault bounded depressions allowed the local accumulation of up to 300 m of halite during the last evaporitic stages [4]. K–Mg salts in the Z1 were locally reported in the eastern Netherlands [59]. A sheet-like upper anhydrite unit, developed in shallow water to sub-aerial conditions, ends the Z1 and marks the marine transgression of the following Z2 evaporite cycle.

2.2.2. Z2—Stassfurt Fm

The Z2 comprises the Z2 Carbonate (Z2C), the Z2 Basal Anhydrite (Z2A), the Z2 Salt (Z2H) and the Z2 Roof Anhydrite (Z2T). It is represented in the southern onshore by anhydrite bearing claystones, against sandstone deposits in the western offshore [60]. The Z2 carbonate unit is a large platform, up 80 m thick and 70 km wide, having prograded northward on the Z1 platform [61] and grading to ~10 m thick bituminous limestone/dolomite in the main basin. With increasing salinities, the Z2 anhydrite formed a platform up to 40 m thick laterally grading to a 3 m thick layer in basin center. More than 600 m of halite interlayered with K–Mg salts accumulated in the main basin, filling the depression beyond the former carbonate-anhydrite platform, above which salt deposits remained relatively thin (10 to 100 m thick). Based on intrasalt correlative markers, Geluk and Rohling [34] subdivided the Z2 salt in three members that they named the Lower, Middle and Upper Z2 salts. During the depositional stages of Lower and Middle salt member, water depth in the central basin was on the order of 140–200 m [62,63] and “deep-water” polyhalite and carnallite have been reported [8]. During the last stages of halite infill, the basin was flattened and sylvite and carnallite salts regionally developed at the top of the Z2 salt. Finally, the Z2 ends with an anhydrite layer (Z2 Roof Anhydrite), recording the progressive inflow of seawater.

2.2.3. Z3—Leine Fm

The Z3 comprises the Gray Salt Clay (Z3G), Z3 Carbonate (Z3C), Z3 Main Anhydrite (Z3A) and Z3 Salt (Z3H). The Gray Salt clay is 5 to 10 m thick. The Z3 carbonate platform developed in a lowered topography as compared to the previous Z2 carbonate [30]. Slope facies thickness reach 40 m whereas basinal organic-rich limestones are only few meters-thick. The Z3 Main Anhydrite form a platform up to 100 m thick north of the Z3 Carbonate and about 50 m thick all over the basin center. The Z3 salt is estimated to have been up to 400 m thick. It includes a basal part made up of halite and an upper part involving K–Mg salt deposits with kieserite, carnallite and sylvite. It also includes bischofite deposits up to 10 m thick, but only reported in the north-eastern onshore and north-western offshore area [14]. In the onshore domain, part of the depocenters in the Z3 were controlled by salt tectonics activity and related salt movements of the Z2 salt [36].

2.2.4. Z4—Aller Fm

The Z4 comprises the Red Salt Clay (Z4R), the Z4 Pegmatite Anhydrite (Z4A) and the Z4 Salt (Z4H). The two basal units, about 2 m thick each, are regional whereas the Z4 salt, up to 150 m thick, is only found in depocenters which were possibly controlled by tectonic movements [36,64]. The Z4 includes K–Mg salt in its middle part, whereas the upper part is characterized by an alternation of halite and claystone marking the evolution of the salt basin into playa-type conditions [8]. Along the southern basin margin, the Z4 grades to sabkhas deposits and fluvial sandstones.

2.2.5. Z5—Ohre Fm

The Z5 comprises a several meters-thick basal claystone (Z5R), followed by up to 15 m thick halite deposits (Z5H). Z5 deposits are limited to very local occurrence in the northeast of the country and to the north-western offshore, outlining the last depocenters [65].
The Zechstein evaporites are finally disconformably capped by the Zechstein Upper Claystone Fm (ZEUC), up to 50 m thick and composed of red and gray anhydritic claystones and sandstones, deposited in a lacustrine to mudflat setting.

3. Materials and Methods

The following study relies on wirelines logs, drilling reports, seismic data and structural to isopach maps provided by the Geological Survey of the Netherlands and freely available on https://www.nlog.nl/ (11 April 2022). The 2110 wells which reached the Zechstein group were investigated. A set of wireline log including gamma ray (GR, especially useful to identify K–Mg salts because of the radioactivity of the 40K), caliper, density, sonic (DT) and neutron porosity were interpreted on the Schlumberger’s Petrel software for the identification of the intra-salt lithologies. These interpretations also considered the descriptions of cuttings produced during well drilling operations and reported in well reports.
The lithological interpretation coupled with the electrofacies patterns were used to perform well-by-well strata correlations. Considering the intensive halokinetic deformations which affected the Zechstein salts, none of the studied Zechstein intervals with thick halite deposits could be considered as being strictly undeformed. However, I have selected 518 wells for which the internal stratigraphy, over the entire Zechstein group, or in some strata intervals only, was estimated as being relevant for the study (Figure 2). This sorting considered: (i) the reference stratigraphic succession established by the bibliographical review in the Netherlands and extended from well to well, (ii) anomalous symmetric stratigraphic intervals suggesting the occurrence of folds [66], (iii) localized facies or thickness anomalies which could not be reported in surrounding nearby wells, (v) the isopach map and top salt depth map of the Zechstein group, allowing me to localize the main diapirs and welds [5], and (vi) 2D and 3D seismic lines passing through the wells, allowing me to assess the instrasalt halokinetic deformations.
The correlated beds were then used to establish isopach maps of the investigated stratigraphic intervals. The isopach maps do not involve the stratigraphic intervals that were identified as highly anomalous, thus limiting the influence of halokinetic deformations as much as possible. The spatial thickness variations of these maps were built following the isochore interpolation algorithm proposed by the Petrel software. This method is a control-point orientated algorithm that converges upon the solution iteratively, adding more resolution with each iteration. With this method, general trends are retained in areas with little thickness data, while detail is retained in areas where the data exist. Each map is presented with its constraining points, thus allowing me to assess the precision of the maps over the study area.

4. Results: Stratal Evolution and Facies Repartition the Zechstein Salt Units

Two representative cross-sections complemented by isopach maps in the different subunits composing the cycles are hereafter presented (Figure 3, Figure 4, Figure 5 and Figure 6). As illustrated, it was possible to identify and correlate the Z1 to Z4 evaporite cycles of the Zechstein group over most of the study area. However, significative stratigraphic interpretations could not be performed in the half eastern part of the offshore domain, due to intensive halokinetic deformations coupled with a lack of representative wells in the evaporites. We used the isopach maps and cross-sections to detail the stratal evolution of the Zechstein group in the halite and K–Mg-rich intervals. As previously noted in the methodology section, the data compilation cannot clearly identify stratigraphic intervals in which nondestructive salt inflation or deflation occurred due to post- or syn-depositional flow. Accordingly, it is important to note that only the large-scale thickness and facies variations of the evaporites cycles were of interest. Small-scale localized anomalies in each section and map are beyond the scope of this study and were not investigated.

4.1. Z1 Salt Unit

The isopach map of the Z1 salt reproduces the previously published spatial and thickness repartition of this unit in the central onshore domain of the Netherlands [8] (Figure 3; Figure 5B). In the main depocenters, the unit is relatively halite-pure with the occurrences of K–Mg salt layers reported in three wells only (Figure 5B). These K–Mg salts form a strata interval named Z1K, which is up to ~70 m thick in the middle part of the halite member (see well WSK 01 on Figure 3). Laterally, away from the thickest depocenters, the wireline interpretations highlight a high proportion of clay and anhydrite interbedded or mixed with the halite (e.g., well P5-2 on Figure 4).

4.2. Z2 Salt Unit

Based on polyhalite regional markers, the three salt depositional stages previously highlighted by Geluk and Röhling [34] in the Z2 salt could be correlated over the cross-sections (Figure 3; Figure 4). The Lower Z2 salt member, hereafter named Z2H1, is about 400 m thick in the eastern side of the Texel Ijsselmeet High, on the onshore domain, and ~100 m thick in the northwestern offshore domain (Figure 5B), resulting in a sigmoidal platform-like shape on the cross sections. In the lower proportion, the Z2H1 also seems more developed in the southern part of the offshore domain (Figure 4). The cross sections also highlight that the Z2H1 is relatively pure halite southward, where it is thick, whereas it includes thin alternations of halite, polyhalite and, in a lower proportion, anhydrite in the basinal offshore domain.
The Middle Z2 salt member includes a basal halite-dominated member, hereafter named Z2H2, capped by a potash-rich interval named Z2K1. The Z2H2 is once again thickening southward, where it is ~200 m thick and ~100 m thick in the distal domain (Figure 3; Figure 4). The cross-section correlations also suggest that the Z2H2 aggraded over the Z2H1 and the anhydrite platform (Z2A) in the southern domain. The Z2K1 is up to 260 m thick and only well developed in the central part of the offshore domain, along an E–W oriented trend (Figure 5C). Wireline log responses suggest very local and thin occurrences of bischofite in the uppermost part of this subunit (Figure 4; Figure 5C).
Figure 3. Correlative cross-section 1.
Minerals 12 00486 g003
Figure 4. Correlative cross-section 2.
Minerals 12 00486 g004
Figure 5. (A): Composite lithologic log of the Zechstein group with the identification of the subunits for which the isopach maps are illustrated in (BD) and in Figure 6.
Minerals 12 00486 g005
Figure 6. Isopach maps of Z2K2 (A), Z3K1 (B), Z3K2 (C) and Z4K (D) units of the Zechstein group (see Figure 6A for the localization of the strata intervals on the lithologic column).
Minerals 12 00486 g006
The Upper Z2 salt member includes a third halite interval named Z2H3, capped by a second potash-rich interval named Z2K2. On the opposite of the Z2H1 and Z2H2, the Z2H3 is further developed distal-ward with thickness reaching ~300 m in the offshore, against ~70 m on the onshore domain (Figure 4). Finally, the Z2K2 forms a widespread deposit, up to ~90 m thick in the offshore domain and subdivided in 1 to 50 m thick more or less isolated depocenters in the southern part of the study area, especially above the platform domain (Figure 6A).

4.3. Z3 Salt Unit

The Z3 salt unit includes three halite-dominated subunits, named Z3H1, Z3H2 and Z3H3, interlayered with two potash-rich subunits, named Z3K1 and Z3K2 (Figure 5A). Z3 salts are lacking in the central offshore domain above the Clever Bank High (Figure 4). This area was significantly uplifted during the Late Jurassic [5] and the lack of Z3 salts there probably results from post-salt erosion rather than non-deposition on topographic high. The Z3H1 subunit tends to thicken offshore-ward, where it is ~200 m thick and locally interlayered with very thin layers of anhydrite to potassic salts (Figure 3). The Z3K1 is few meters to ~50 m thick and dominantly developed in the northwestern offshore and in the northeastern onshore, around the Lauwerszee Trough and Groningen High area (Figure 6B). In accordance with previous publications [7,31], well log data highlight the occurrence of several meters-thick bischofite-rich layers in the main depocenters of this interval (Figure 3).
The Z3H2 halite subunit is relatively tabular and ~25 m thick. The Z3K2 interval is well extended over the study area, with a thickness up to ~90 m in the northwestern offshore and the northeastern part of the onshore (Figure 6C). In the western part of the offshore domain, cutting data suggests the potassic salt to be relatively shale rich. This shale content gives sonic log response which can be confused with bischofite layers. However, the latter are suspected to be locally present (Figure 3; Figure 6). The capping Z3H3 subunit displays a large extension, is up to 90 m thick and is also characterized a high shale content, according to well log and cutting data.

4.4. Z4 Salt Unit

The Z4 salt unit is ~60 m thick over the main basin domain. The basal halite-dominated member, named Z4H1, is ~20 m thick and locally interlayered with two to three, few meters-thick potassic salt layers, mostly in the offshore domain ( Figure 3; Figure 4). The central K–Mg-rich interval, hereafter named Z4K, is regionally correlative and can be up to 40 m thick in restricted depocenters in the southern part of the offshore and in the east of the onshore (Figure 6C). The capping shale-rich halite member, named Z4H2, is ~25 m thick when complete.

5. Discussion

5.1. Controlling Factors of the Stratal Evolution in the Z2, Z3 and Z4 Salt Units

Based on the stratigraphic correlations performed in this study, it is possible to propose an updated lithostratigraphic chart of the Zechstein group in the Netherlands including the repartition of the main K–Mg salts (Figure 7). Moreover, it is hereafter proposed and discussed new facies maps representing the depositional setting of each K–Mg salt deposits (Figure 8, Figure 9, Figure 10 and Figure 11).
The presented geometries of halite and K–Mg salt bodies might have been controlled by (i) sedimentary processes linked to hydroclimatic conditions or eustatic variations (e.g., [67,68]), (ii) syn- to post-salt halokinetic deformations (e.g., [30,69]) and/or (iii) basement tectonic activity (e.g., [70]). The alignment of the Z1H unit with NW–SE faults (Figure 2) and seismic observations already demonstrated the tectonic control on this halite depocenter (Figure 8A) [4]. We hereafter focus the discussion on the stratigraphic architecture of the Z2, Z3 and Z4 salt units in order to understand (i) the origin of the halite thickness variations in the Z2H1 and Z2H2 subunits, (ii) the origin of the anhydrite and polyhalite deposits in the Z2H1, (iii) the depositional setting of the K–Mg salts in the Z2, Z3 and Z4.

5.1.1. Origin of Thickness Variations in the Z2H1 and Z2H2 Units

The Z2 salt unit filled a large basin trough, having remained relatively sediment-starved throughout the development of the Z1–Z2 carbonate and sulphate platforms [4]. East of the Texel-IJsselmeer high, the large thickening of the Z2H1 and Z2H2, resulting in their sigmoidal shape under the N–S cross-sections, was interpreted by Geluk and Röhling [34] as a depositional halite platform, having prograded over the previously exiting relief. East of Southern England, in the stratigraphically equivalent Z2 interval, a similar platform geometry was reported by Colter and Reed [71] and Taylor and Colter [72]. There, the authors suggested that the halite platform formed due to a higher precipitation rate in the shelf domain, induced by higher temperatures, evaporation and, thus, salinities. Outside the English and Dutch basins, halite platform-like geometries have never been reported in the Zechstein basin, and neither in other ancient salt giant basins, where halite deposits tend to form aggrading tabular geometries in basin depocenters [24,42,55,67,73,74]. Moreover, recent studies in the 300 m deep Dead Sea have highlighted that, due to downward saline flux transfers in the water mass, the halite precipitation rate in deep basins should be increased in the deep water domain, at the expense of dissolution in the shallow basin margins [75], i.e., the very opposite of what should drive the development of a halite platform. Nevertheless, in the southern side of the Dead Sea, a modern platform-like geometry of halite has recently been recognized [68]. There, it developed because of a salinity gradient (and related precipitation rate gradient) decreasing from the south to the north due to freshwater influxes provided by the Jordan River in the northern side of the lake [68]. Accordingly, by analogy, I suggest that the Z2H1 and Z2H2 units accumulated under a deep-water setting, with the influence of freshwater inflows having reduced the halite precipitation rate in the western offshore domain of Netherlands (and in the basin domain of England), as compared to the onshore one (Figure 8B). Freshwater influxes could be sourced from continental river water or, more probably, by marine waters coming from the northern North Sea. The Texel-IJsselmeer high probably also acted as a structural barrier, having further confined the eastern onshore area, contributing to higher salinity conditions there.
Finally, following the stratigraphic correlations, the aggradation of the Z2H2 unit over the Z2H1 suggests that the Z2H2 developed during or after a marine recharge having risen the brine level, and probably linked to a slight increase of the eustatic sea level (Figure 7).

5.1.2. Origin of the Anhydrite and Polyhalite Layers in the Z2H1

In the Z2H1 unit, stratigraphic correlations highlight that the thick halite platform of the onshore domain is grading to a thinner halite interval thinly interlayered with polyhalite and anhydrite, to the origins of which must be assessed. Anhydrite can be primary when precipitated from sulfate or halite-saturated conditions, but is more commonly interpreted as resulting from the diagenetic dehydration of primary gypsum beds [76,77,78,79,80]. Similarly, polyhalite can be primary when formed as the first K–Mg salts [81,82,83] or secondary when formed through back-reaction between sulphates and evaporation-derived K–Mg-SO4-rich brines [84,85,86]. In the onshore domain of the Netherlands, Biehl et al. [6] argued that the anhydrite and polyhalite interlayered with halite in the Z2H1 were both depositional. However, in a stratigraphically equivalent interval in the English basin, Colter and Reed [71] reported clear petrographic evidence of both primary and secondary polyhalite. Accordingly, in the halite of the Z2H1, the gypsum-anhydrite probably formed during freshwater events, whereas polyhalite formed as a secondary to primary phase during drawdown events, while the halite platform could be emerged.
Considering the deep water setting during the deposition of the Z2H1, it also seems very likely that part of the anhydrite beds reported in the offshore domain mark turbiditic lobe deposits derived from the dismembering of the marginal anhydrite platform (Z2A, e.g., [87,88,89]. Indeed, several studies have already documented these types of basinal deposits in the Zechstein Basin, but only during the development of the Z1, Z2 or Z3 sulfate platforms [42,90,91]. However, the dismembering of the Z2 sulphate platform is not expected to have stopped at the first stages of the basin halite infill, because a topographic relief was still well-developed between the marginal domain and the basin trough. Accordingly, the occurrence of anhydrite turbiditic lobes interlayered in the distal Z2H1 halite deposits is also a very likely scenario (as illustrated on Figure 8B). Finally, such clastic anhydrite could have been lately transformed into secondary polyhalite, similarly to what was recently reported by Shang et al. [83] in halite deposits of the Sichuan Basin, SW China.

5.1.3. Depositional Setting of the Z2, Z3 and Z4 K–Mg Salts Deposits

The intervals of K–Mg salts interlayered with the halite in the Z1 to Z4 salt units record successive drawdown evaporite cycles. Considering the influence of the third-to-fourth order eustatic variations on the large-scale evaporite cycles, the smaller-scale halite-potash alternation hereafter documented are probably linked with fourth-to-fifth order sequences of eustatic variations (Figure 7). Lateral thickness and facies variations reported on the stratigraphic correlations may enable us to decipher the hydrological conditions which favored the deposition of such hyper-saline deposits.
After the deposition of the Z2H1 and Z2H2 halite platform in deep water setting, a probable drop of the eustatic sea-level decreased the seawater influxes, leading to the basin drawdown coupled with the emersion of the halite platform and, ultimately, to the progressive infill of the distal topographic low by the K–Mg-salts of the Z2K1 unit (Figure 9A). If the K–Mg salt started to precipitate under a relatively deep-water setting (>15–20 m deep), the local occurrence of bischofite in the uppermost part of the potash layer suggests an almost complete desiccation stage reached at the end of the drawdown event. Indeed, bischofite is the last mineral able to precipitate from the evaporation of seawater [9,92], but due to its very high ability to be dissolved under atmospheric conditions, the accumulation and preservation of bischofite must have involved the deepest depocenters devoid of any outflow and with perennial subaqueous conditions [24,93]. Laterally, direct precipitation of carnallite, sylvite or kieserite could occur in ephemeral salt ponds or as subaerial crusts by crystallization of subsurface brines (e.g., [94,95]).
After a new marine flooding rose the brine level and returned the saturation stage to the halite one, the remaining topography was flattened by the deposition of Z2H2 halite unit. A second potash-saturation stage was then reached during the Z2K2 unit because of (i) a new drop of the eustatic level and/or (ii) newly developed hydrological conditions. Indeed, the new very flat configuration of the basin allowed the brine level to lie over an extended surface, promoting shallow-water condition all over the basin, net evaporation, and thus, higher salinities (the so-called “fill and spill” stage, sensu Warren [24]). Accordingly, the Z2K2 unit distributed over a widespread area and bischofite precipitation occurred in the deepest depocenters during the uppermost drawdown maxima (Figure 9B). This interpretation is in accordance with the depositional setting already inferred for Z2 potash deposits stratigraphically equivalent in Poland and England [72,96].
During the deposition of the Gray Salt Clay, Z3 Carbonate and Z3 Main Anhydrite, the basin trough that had developed by subsidence was quickly filled by the deposition of the Z3H1 halite unit, as evidenced by its thickening offshore-ward. The Z3H1 thus probably started to develop in deep water setting (~100–150 m deep [63]), but ended in shallow water to subaerial conditions, as at the end of the Z2. As a result, the Z3K1, Z3H2, Z3K2 and Z3H3 also developed in a relatively flat and shallow depositional setting, in accordance with that inferred for the Z3 potashes reported in Poland, Germany and England [97,98,99,100].
Around the Groningen High area, Raith et al. [31] demonstrated that the restricted bischofite-rich depocenters of the Z3K1 subunit developed with the influence of basement tectonic movements coupled with early halokinetic deformations of the Z2 salt member. Barabasch et al. [36], Strozyk et al. [101] and Biehl et al. [6] also argued that there was significant tectonic and halokinetic movement during the deposition of the Z3 cycle in the onshore domain. Accordingly, at the scale of the entire Z3K1 depocenters, the limited extension of this K–Mg salt possibly results from similar larger scale tectono-halokinetic movements (Figure 10A). However, the paleogeography and very shallow depositional setting probably also influenced the basin salinity there. Indeed, the marine influxes coming from the north (i.e., the Barent Sea) were progressively pre-concentrated during their thousand kilometers-long flow among the Zechstein sub-basins [99]. Accordingly, potash and bischofite deposits might have been especially promoted in the onshore domain of the Netherlands because it acted as among the most distal and sheltered depocenter for marine water influxes. Following this hypothesis, the Z3K1 depocenter was laterally equivalent with halite syn-depositionally developed in salt pans or isolated salt ponds.
The more regional extension of the Z3K2 unit, as compared to the Z3K1, highlights a basin having become uniformly potash saturated with an overall brine level probably slightly higher than this of the Z3K1. Shallow water conditions coupled with subtle tectonic and halokinetic movements probably promoted the development of a mosaic of depocenters more or less interconnected and with lateral facies and thickness variations (Figure 10B). Finally, this depositional setting must have remained stable up to the end of the Zechstein, before post-salt dissolution and halokinesis (Figure 11).

5.2. Implications and Recommendation for the Development of Salt Caverns in the Zechstein Group

Using the isopach map of the Zechstein group and the depth map of the top Zechstein, it is possible to constrain the areas where the top of the Zechstein group is not deeper than 1700 m and where the salt is thicker than 200 m, two basic criteria for the development of salt caverns in salt deposits (Figure 12). In the Zechstein, insoluble materials are dominantly represented by (i) the shale, carbonate and anhydrite layers marking the base of the Z3 unit (Z3G, C and A) and (ii) shale contents in the Z3H3 and Z4 halite deposits. These units being regionally present in the basin, they are expected to compose almost all the eligible salt structures. Regarding the K–Mg salts, thanks to the understanding of their spatial repartition, it is possible to assess the risk of encountering them in eligible salt structures. This is illustrated on Figure 12 by superposing the eligible salt structures for salt cavern and the K–Mg salt depocenters in the Z1 to Z3 cycles.
Bedded evaporites and salt structures located in the southeastern corner of the study area only involve the Z1 salt unit. This unit is halite-dominated and K–Mg salt layers are limited spatially. However, the occurrence of K–Mg salts in the middle part of a halite unit, which is only few hundred meters-thick, remains quite problematic for the development of a salt cavern [103] and potash deposits can still be involved in complex layer-parallel folds in bedded halite deposits [104]. Accordingly, developing salt cavern in the Z1 salts should be relatively safe outside the K–Mg depocenters only.
Further north, eligible salt structures involve the Z2 to Z4 salt units, each of them possibly involving up to two intervals of K–Mg salts. Assessing the risk of encountering K–Mg salts will thus depend on the (i) the spatial localization of the salt structure, (ii) the depth localization of the salt cavern and (ii) the type of salt structure.
Salt pillows dominantly involve salt inflation, brecciation, boudinage and large-scale folding [105,106]. As a result, intra-salt deformations may relatively preserve the primary stratigraphic architecture of the Zechstein in pillow structures. Because of this relative continuity of the bedding, thick K–Mg-rich intervals and the Z3 carbonate-anhydrite layer usually remain well identifiable under seismic images [7,31,102,105,107], even if high amplitude folds develop [101] (Figure 13A). Accordingly, with good seismic data and the repartition maps of the K–Mg salts, it should be possible to anticipate, with a certain amount of confidence, the safest depth intervals and spatial locations for the development of salt caverns in pillow structures.
Intrasalt deformations in vertical diapiric structures are far more difficult to anticipate, especially due to seismic images remaining blind with the occurrence of sub vertical dips and complex three-dimensional curtain folds [108]. In these structures, intrasalt deformations will depend on several factors, including the stress fields during the different phase of salt flow, the primary stratigraphic architecture of the salt section (e.g., thickness and number of K–Mg rich intervals), the composition of the evaporites, the sedimentation rate during diapir growth or the shape of the diapir. Without performing numerous exploration wells, defining the best location for the creation of a salt cavern in a diapiric structure is, thus, a serious challenge for geoscientists. However, field observations in mined salt domes and numerical to analogical models highlight that, as a general rule of thumb, in diapirs remaining close from an anticlinal shape, the lowermost salt layers tend to rise upward and push outward the uppermost salt layers [27,101,104,109,110]. This deformation pattern was notably observed in mined German diapirs of the Zechstein (Figure 13B–F) which are cored by the lowermost Z2 halite unit, surrounded by Z3 salts, whereas the Z4 salts are restrained to the outer limit of the diapir.
The Z2 salt involves the Z2K1 and the Z2K2 K–Mg salt units, but the Z2K1 is the most problematic: as it is relatively thick and located in the middle part of the Z2, its occurrence in the core of diapirs is very likely and its ability to develop complex folds with the halite is very high. However, as the Z2K1 is spatially restricted to the offshore domain (Figure 12A), the risk of encountering this potash layer concerns the offshore diapirs only.
The Z2K2 is further regional but has the advantage of being thinner and at the uppermost part of the Z2, topped by the Z3 carbonate-anhydrite. Because the Z3 carbonate-anhydrite has a limited ability to fold and mix with other salts, its occurrence atop the Z2K2 may limit the ability of the K–Mg salts to develop a complex folding pattern with the Z2 of Z3 halite, as observed in the German Gorleben salt dome (Figure 13E). As a result, the Z2K2 is not expected to be a major risk in the central part of diapirs conventionally cored by the Z2 halite.
In the Z3 cycle, the Z3H1 should be the thickest halite unit and, thus, the best interval to safely develop a salt cavern. However, in diapirs cored by the Z2 salt, the Z3 salt unit might be less inflated than the Z2 salt and complex folds might develop with the two Z3K1 and Z3K2 intervals interbedded with halite in the half upper part of the Z3 cycle. Finally, the Z4 salts and its shale and K–Mg salt content should not be problematic as commonly restricted to the outer borders of the diapirs structures.
Figure 13. (A): Seismic cross section and interpretation (5× exaggerated) of salt pillows in onshore Netherlands (modified from [101]). Seismic interpretation is based on [31,101] works. (A) to (F): Illustration of internal structures constrained by subsurface mine data in German diapirs formed by the Zechstein salts and for which the core area is composed by the Z2. (B): Horizontal sections of the Benthe salt dome at a depth of 600 m below the surface (after [104]). (C): Cross section of the Salzdetfurth mine (after [111]). (D): Cross section of the Benthe salt dome (after [112]). (E): Cross-section of the Gorleben salt dome (from [113]). (F): Cross-section of the Asse salt anticline (after [114,115]).
Minerals 12 00486 g013
Unfortunately, all diapiric stems are not conventionally cored by the lower-most halite unit. Indeed, there are also numerous examples of large Zechstein diapirs for which the flowage and folding have been so complexed that the internal structures are not respecting any first order deformation pattern (Figure 14). For this structure, the use of several exploration wells and geophysical tools become mandatary to target the best location for the development of a salt cavern. As a first order approximation, we might expect highly complex internal deformations for (i) diapirs with several km high vertical extensions, commonly bounded by welded salt stocks, (ii) several tens of km large diapirs with complex external shapes under map view, (iii) diapirs involved in compressional thrust sheet and (iii) vertical diapirs which, in the cross-section view, display a mushroom shape, salt sheets, a welded stem or evidence of collapse structures.

6. Conclusions

In this study, bibliographical, seismic and well data were compiled to perform a geological synthesis of the Zechstein group in the Netherlands, with an emphasis on the K–Mg salts, which until now were poorly constrained in term of thickness and spatial repartition. The results enable us to update the litho-stratigraphy of the Zechstein and contribute towards improving our understanding of its depositional history. The main conclusions of this study can be summed up as follows:
-
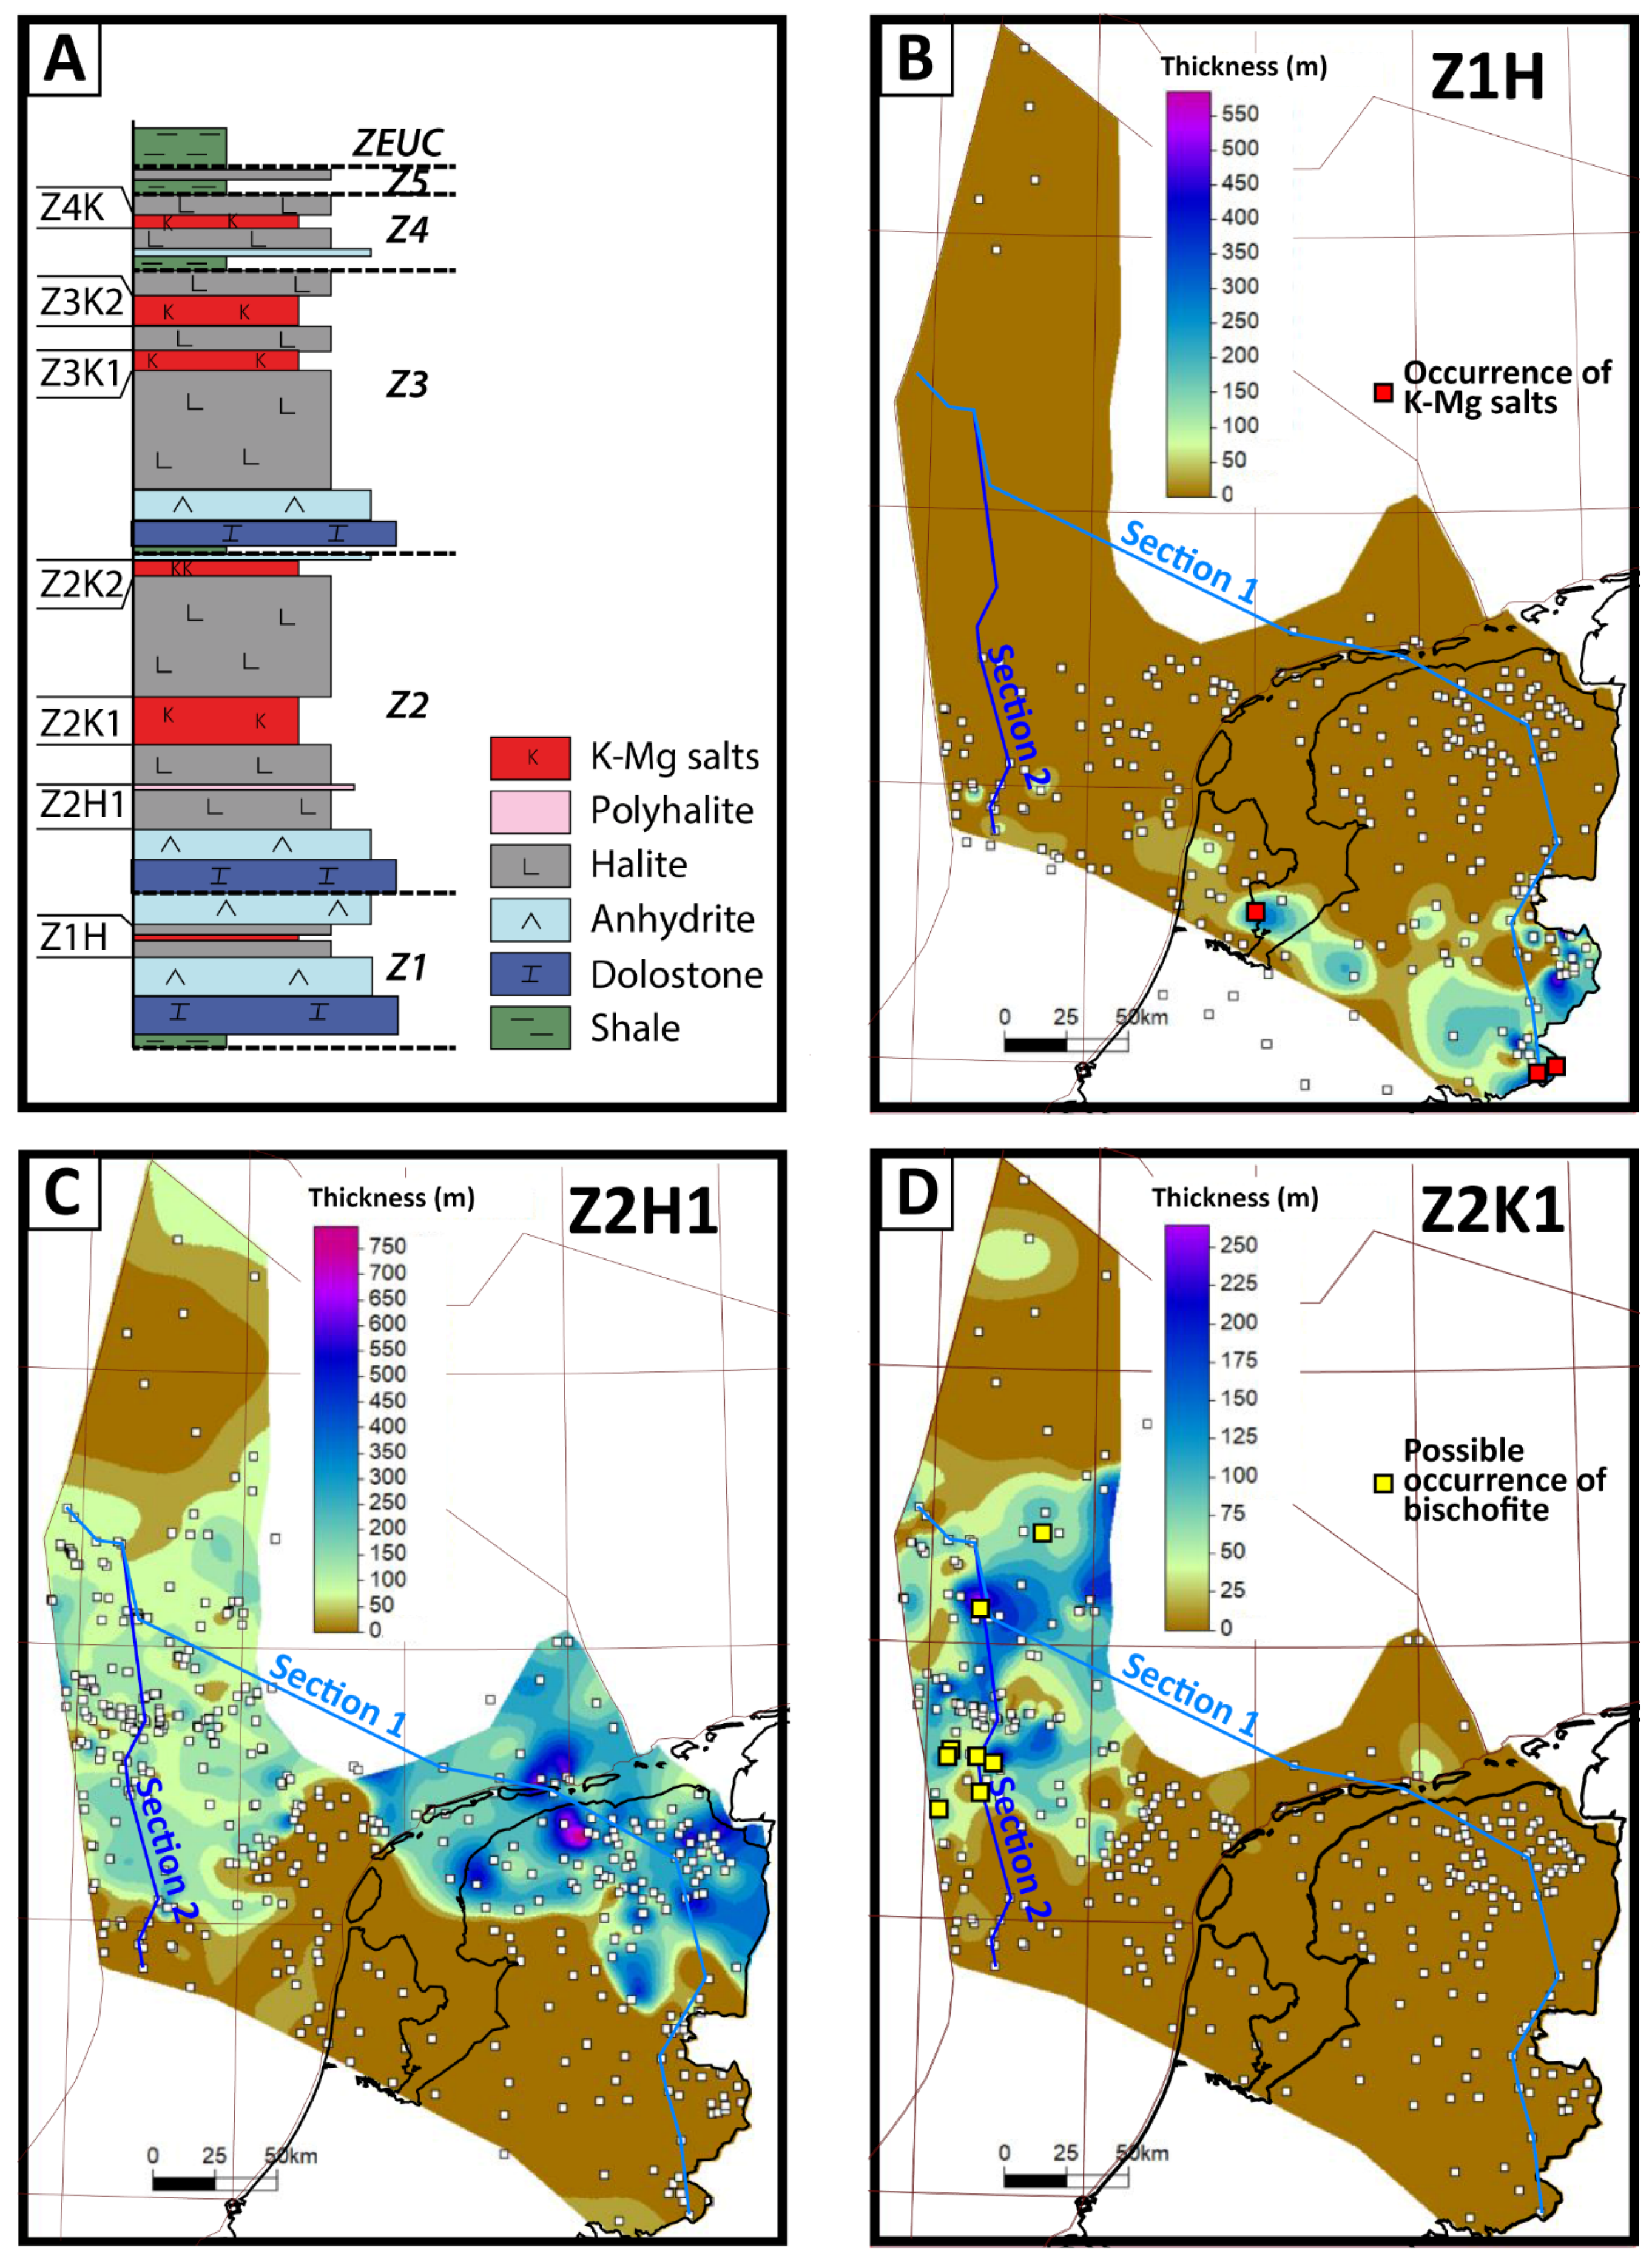
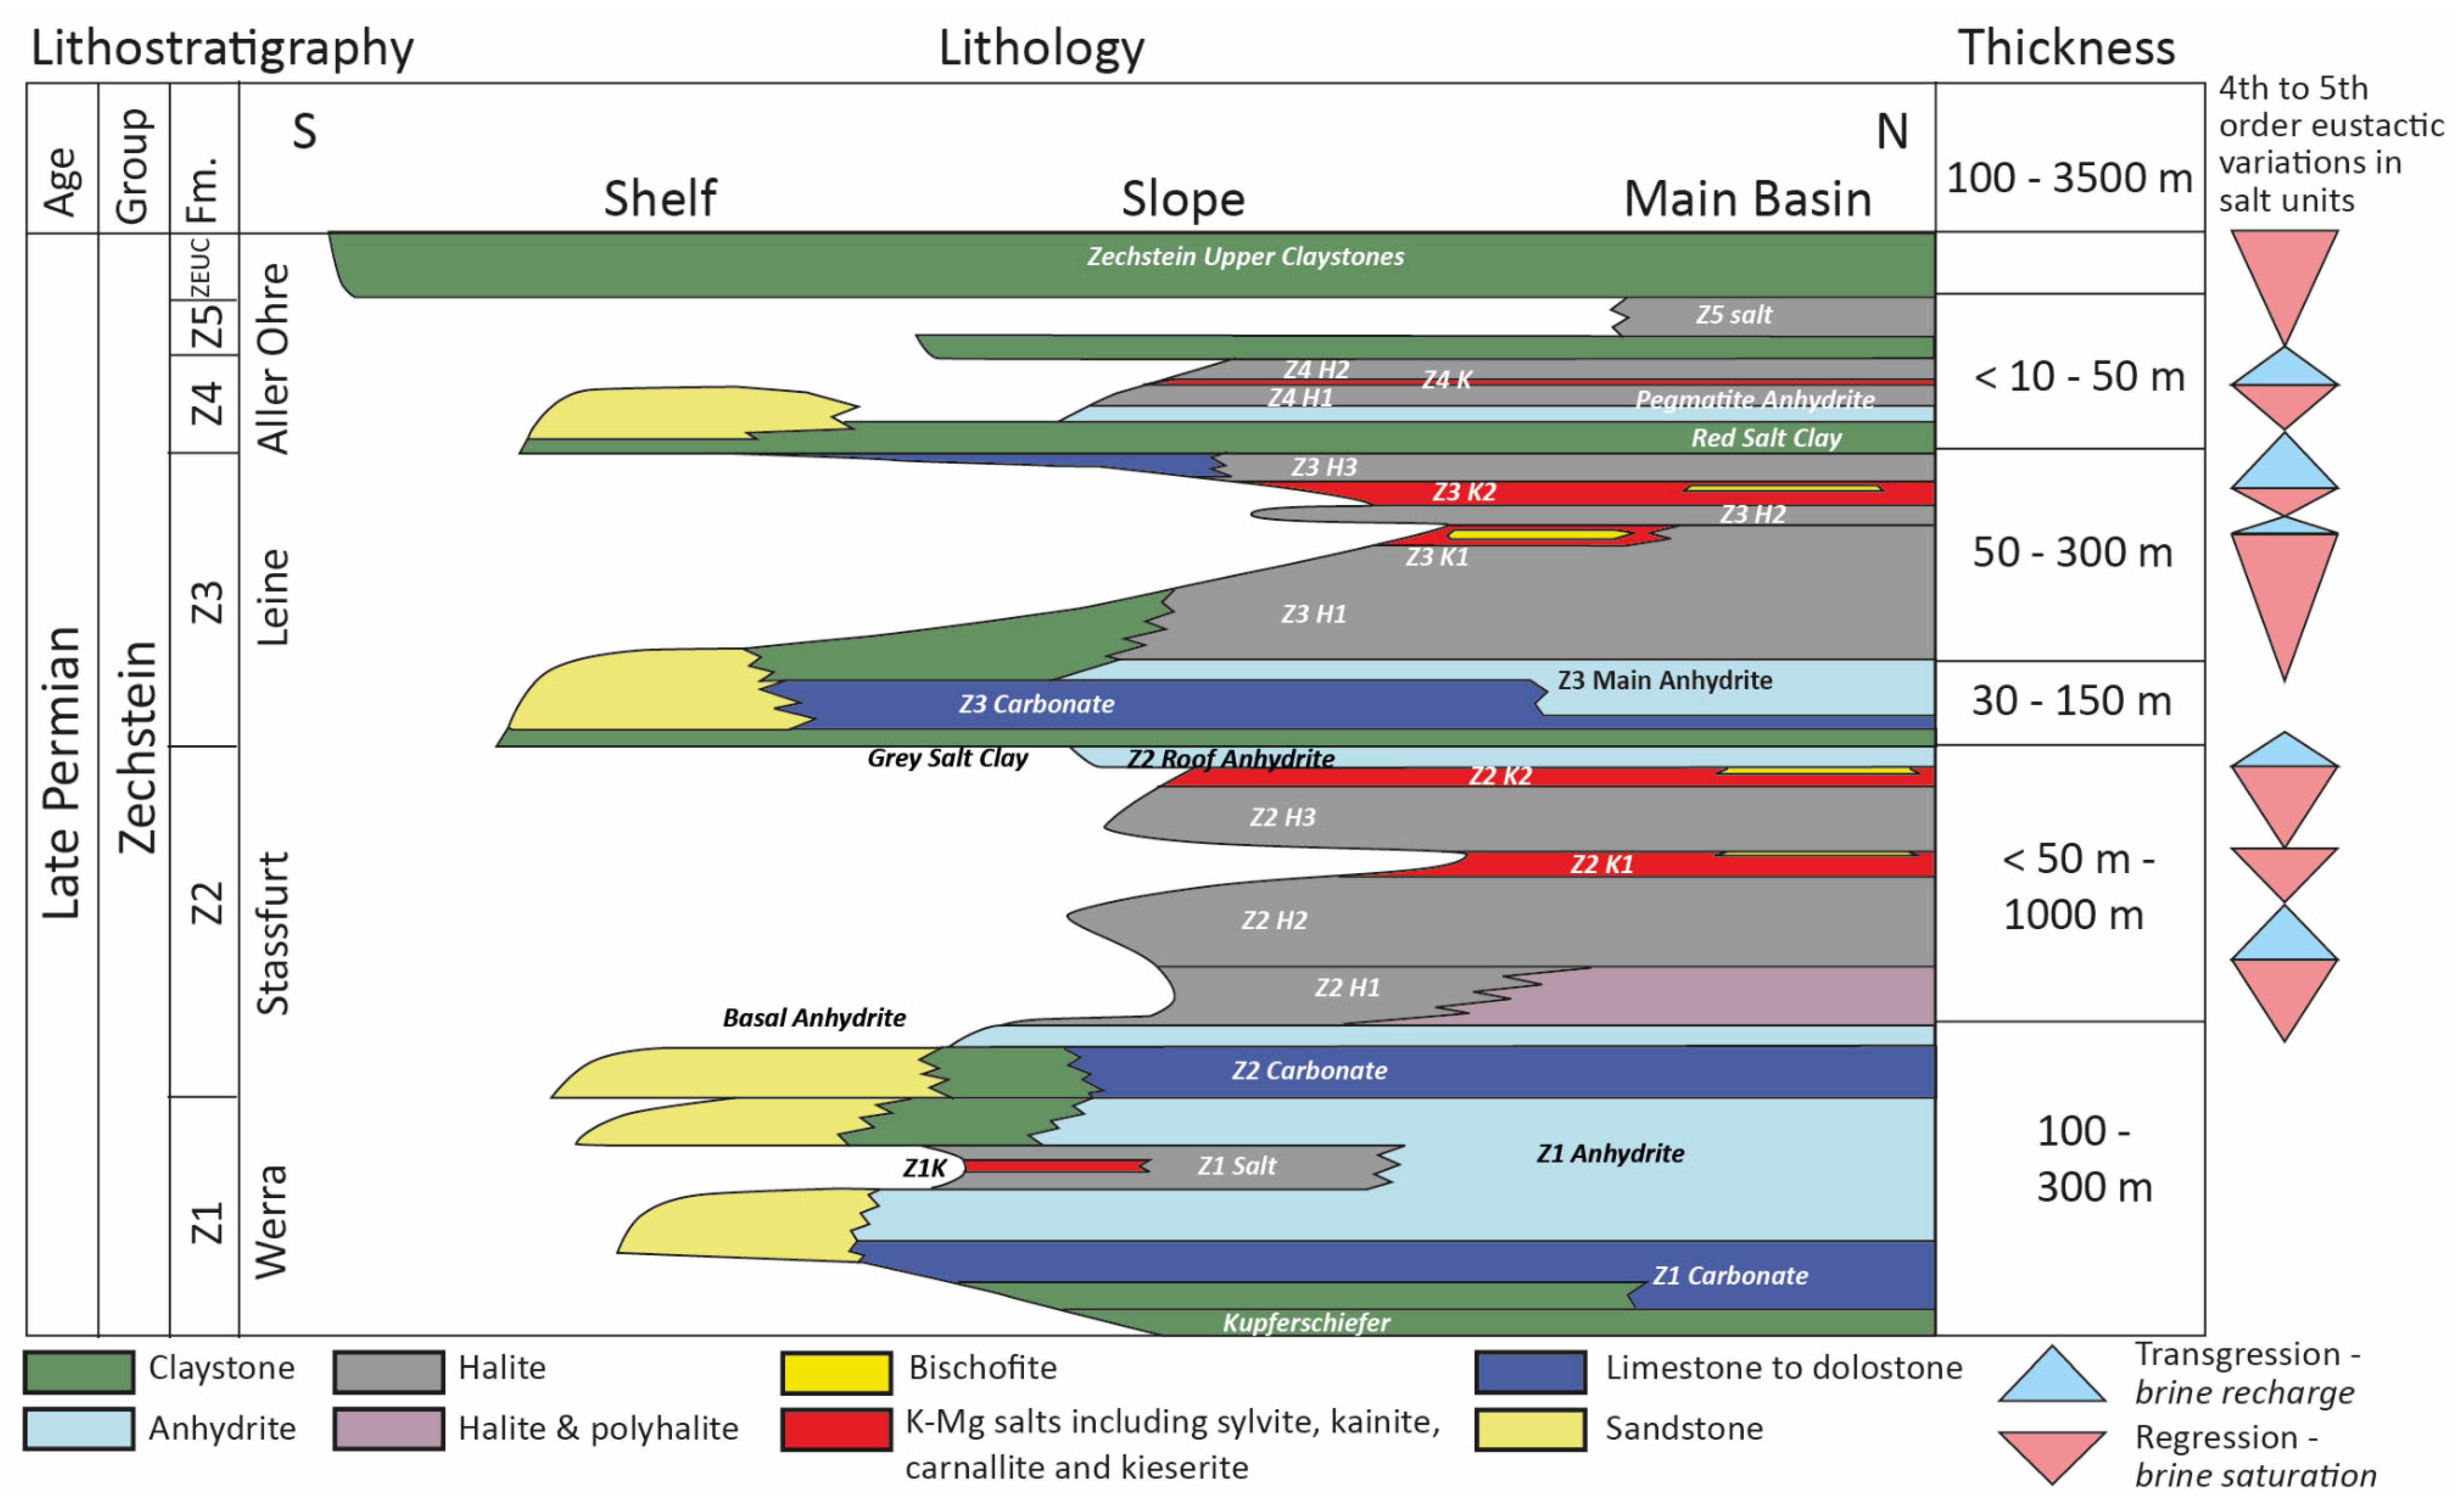
Each Zechstein evaporite cycle (Z1 to Z4) includes one to two intervals rich in K–Mg salts which were named Z1K, Z2K1, Z2K2, Z3K1, Z3K2 and Z4K.
-
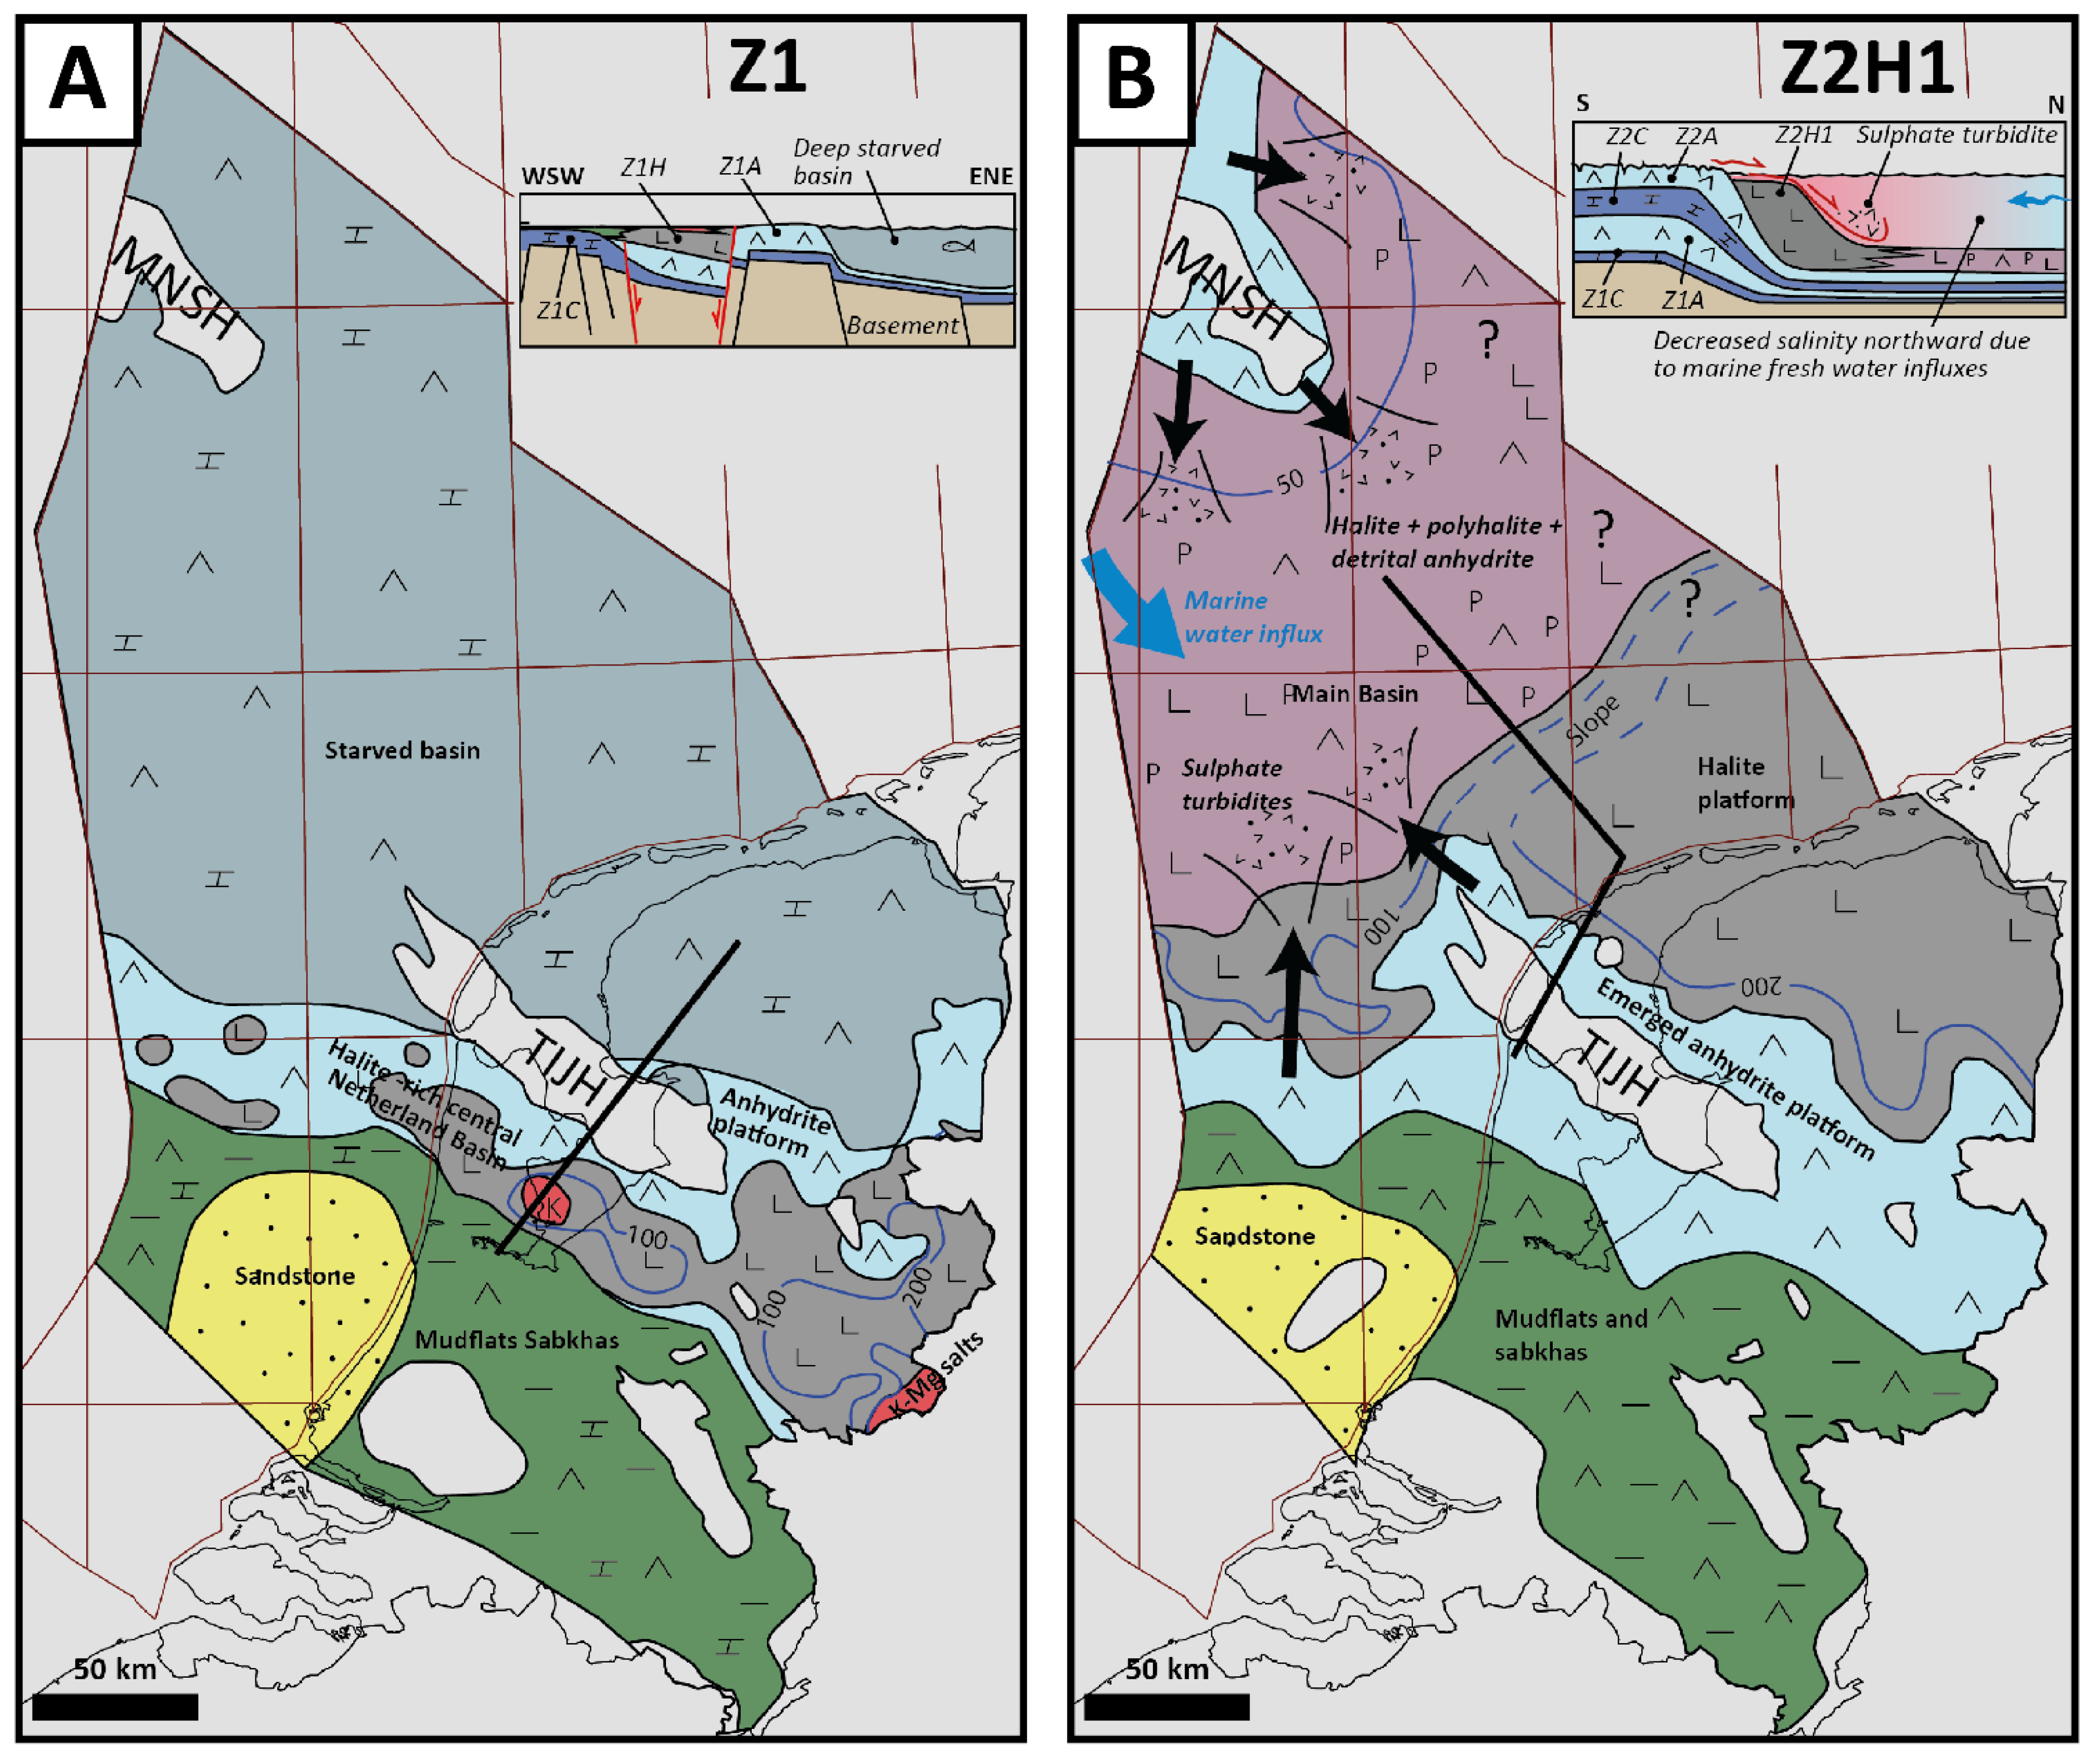
The Z1K was spatially limited to the tectonically controlled deepest depocenters of the Z1 salt unit.
-
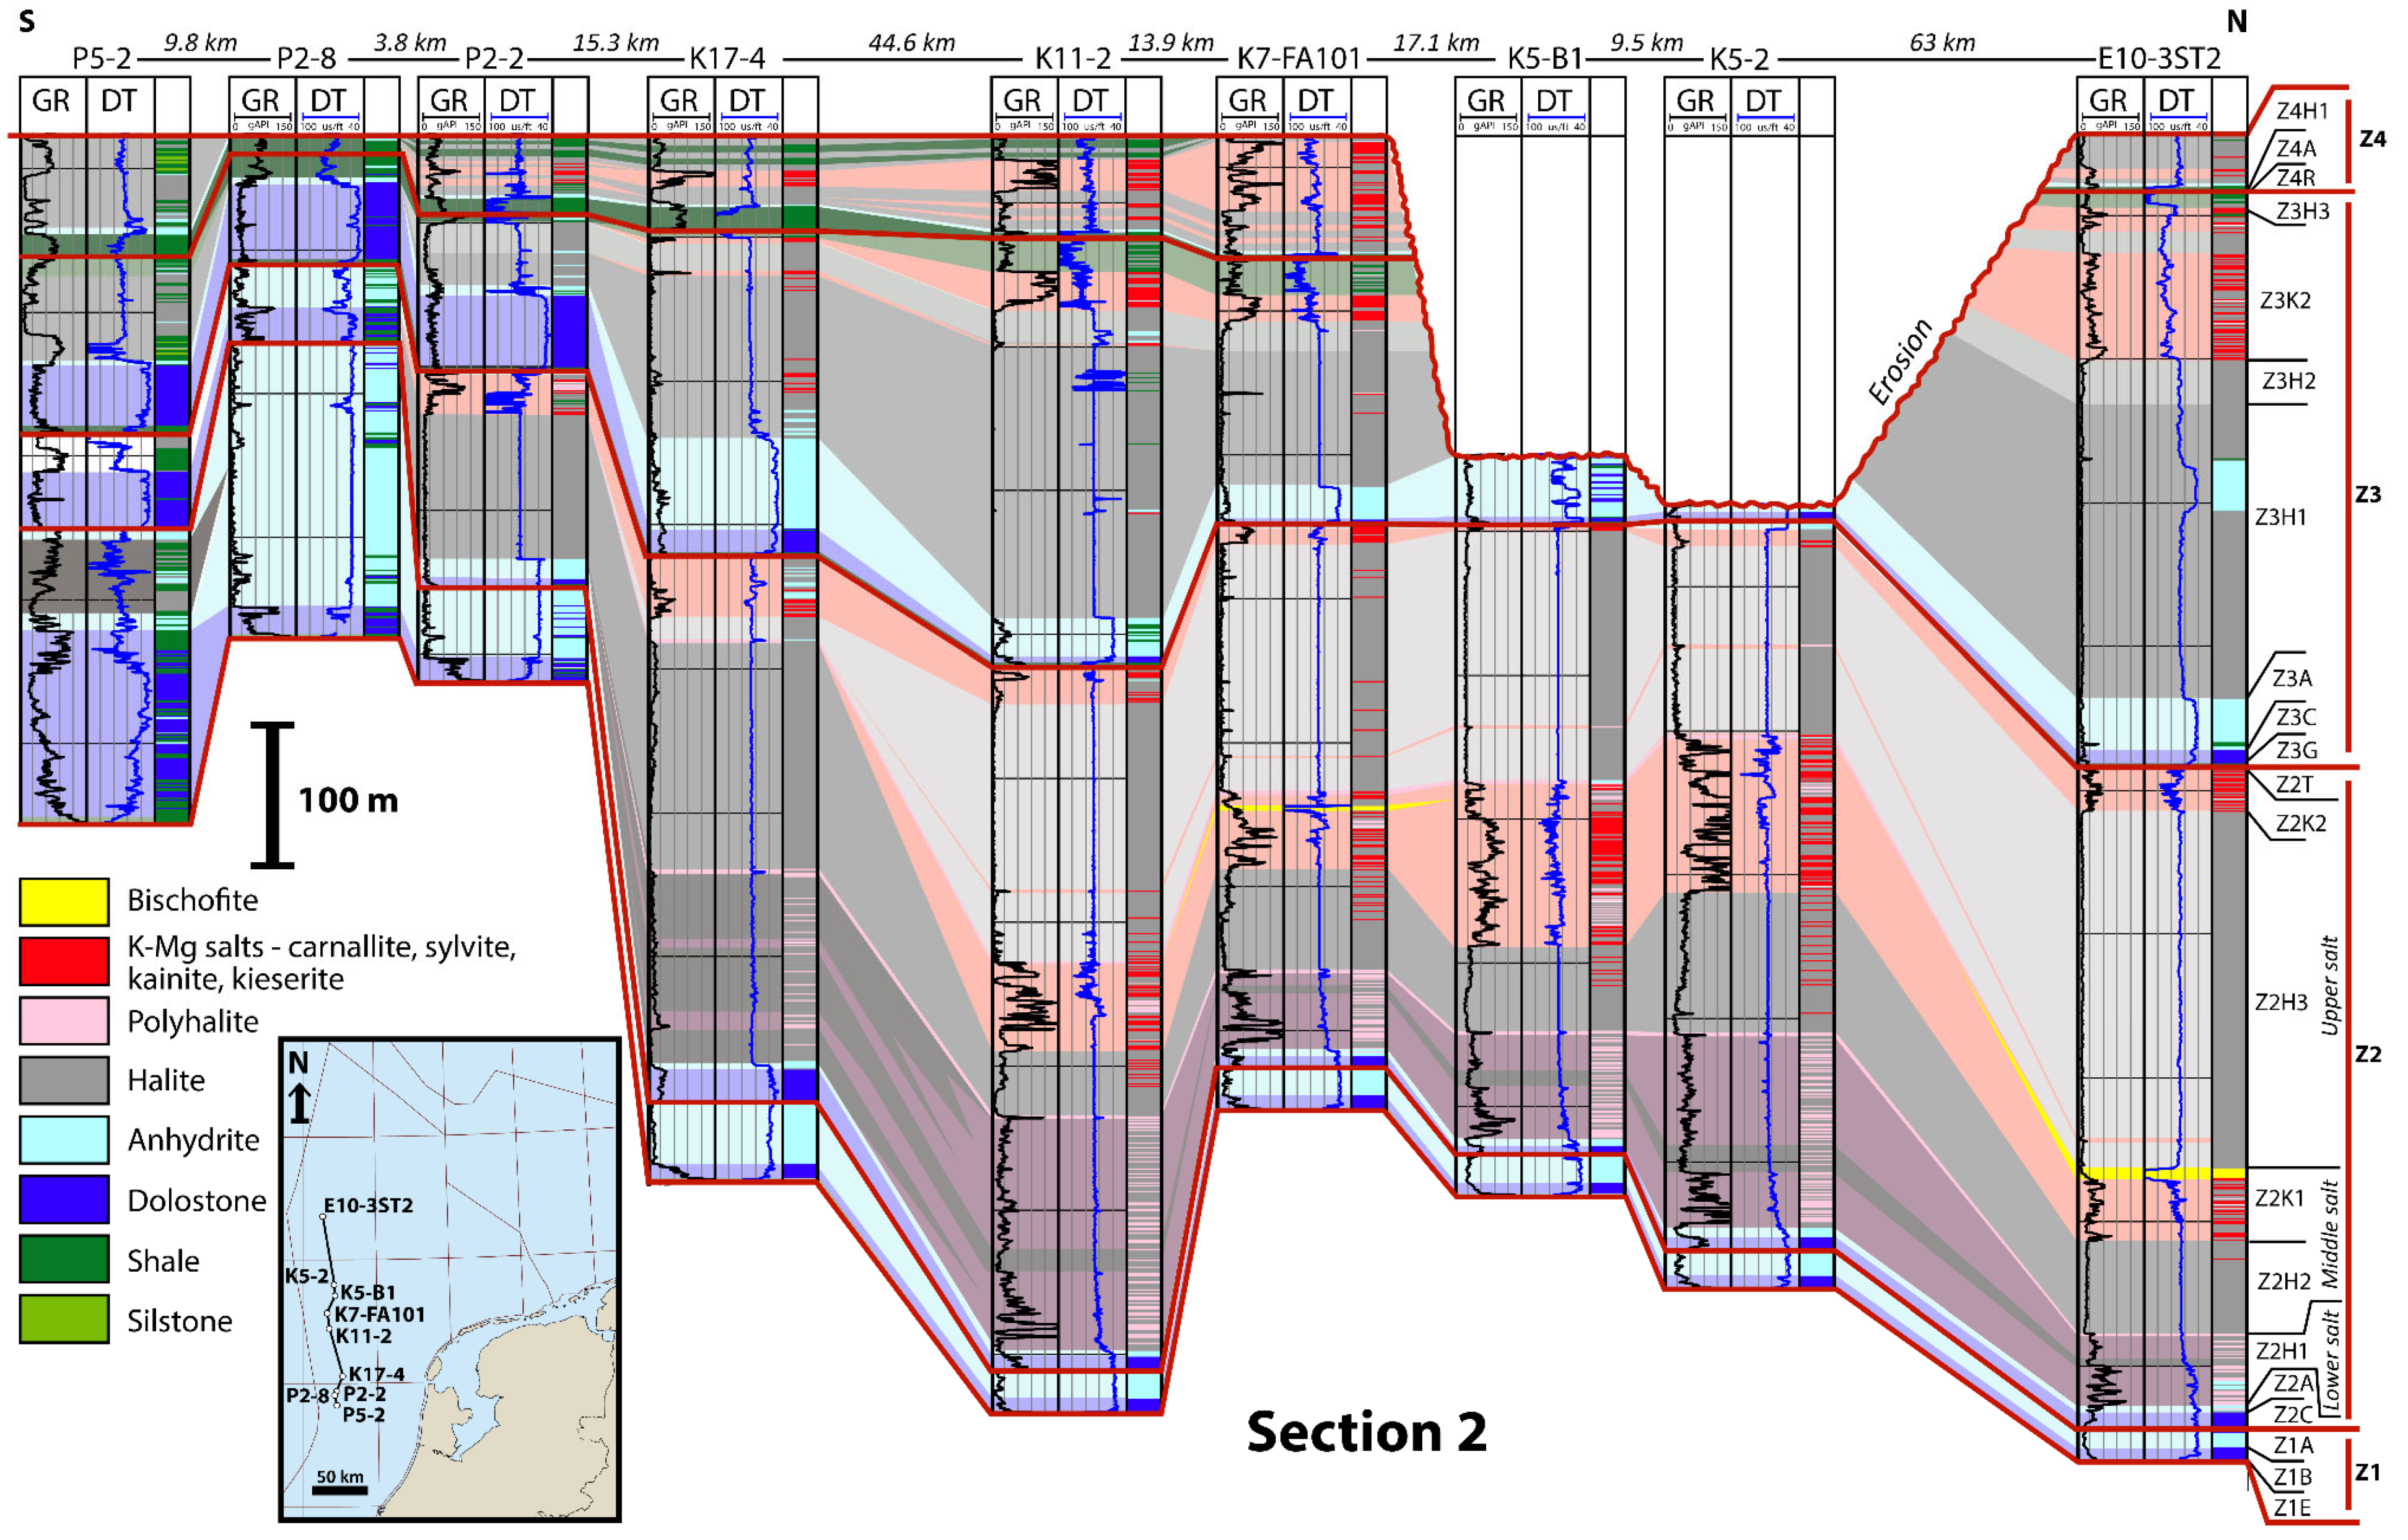
During the first halite precipitation stage of the Z2, deep hydrological conditions coupled with marine freshwater influxes sourced from the northwest induced a higher precipitation rate of halite in the eastern onshore domain of Netherlands, resulting in the development of a 200 m thick halite platform. Basin-ward, the halite was ~100 m thick and interlayered with primary to secondary polyhalite and anhydrite, some of which were also turbidite deposits sourced from the marginal Z2 anhydrite platform.
-
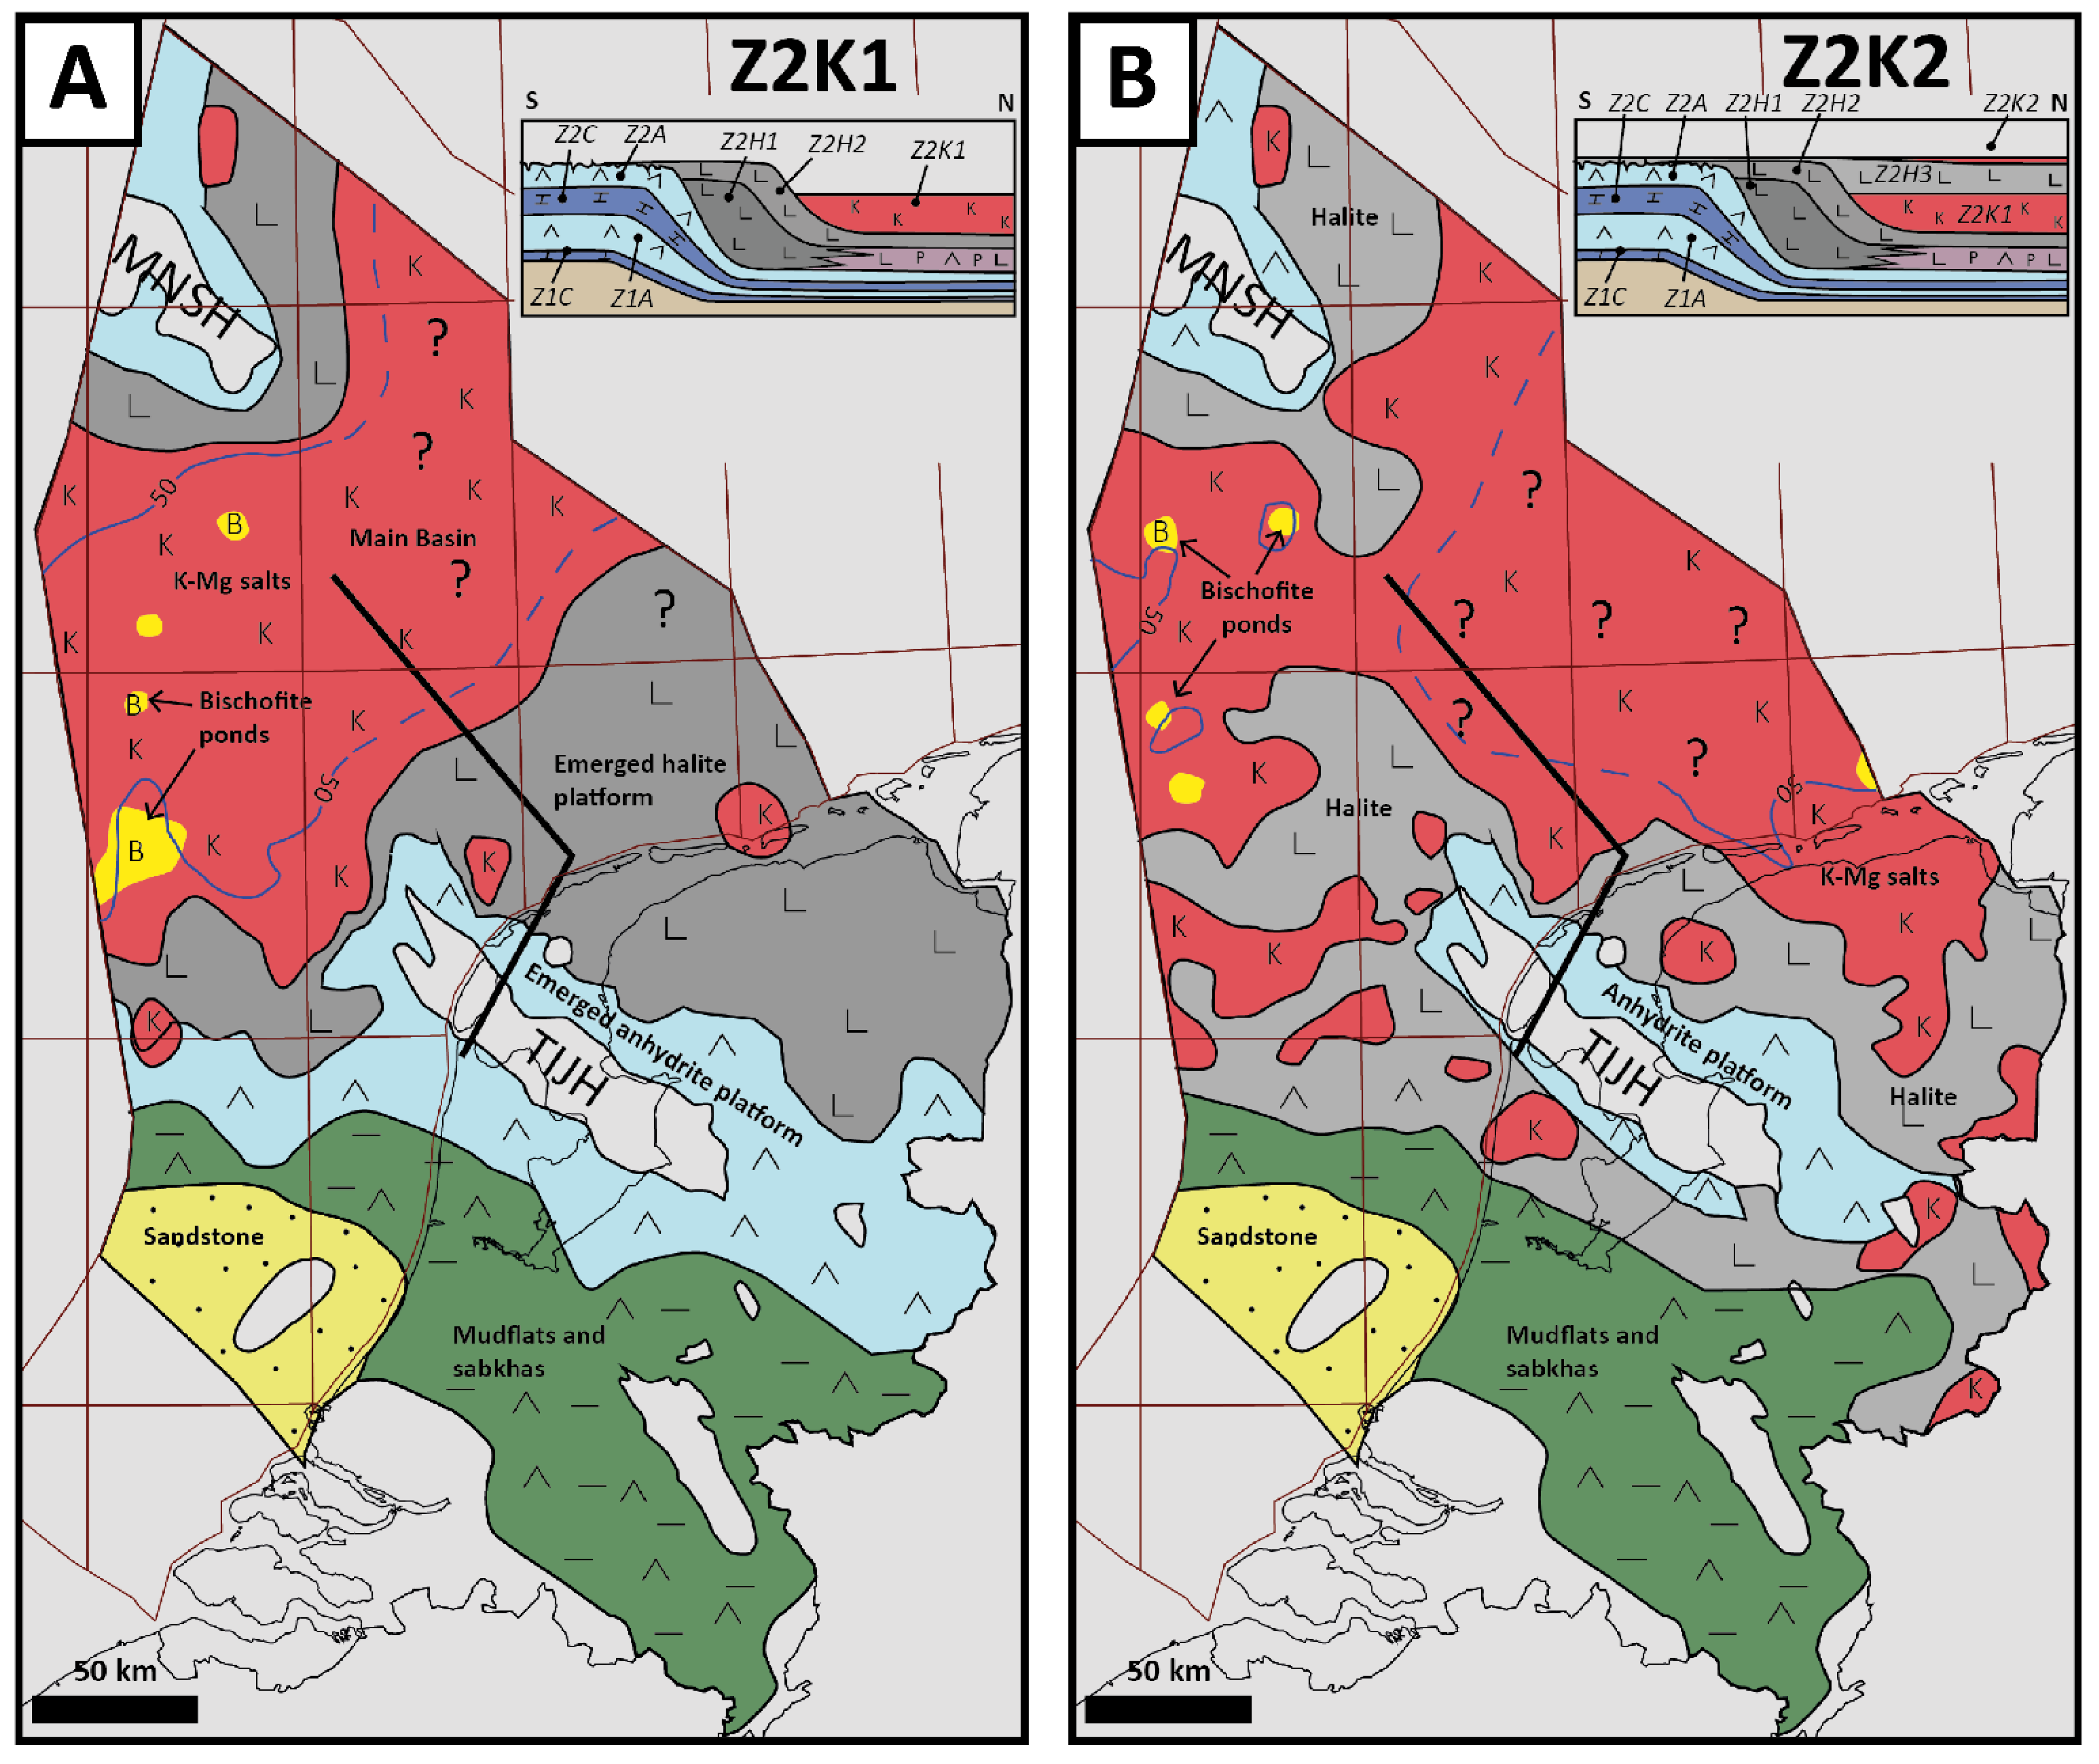
The Z2K1 accumulated from relatively deep to shallow water conditions in the distal topographic low created during the previous halite saturation stage, i.e., north of the halite platform which was emerged during the maximum drawdown.
-
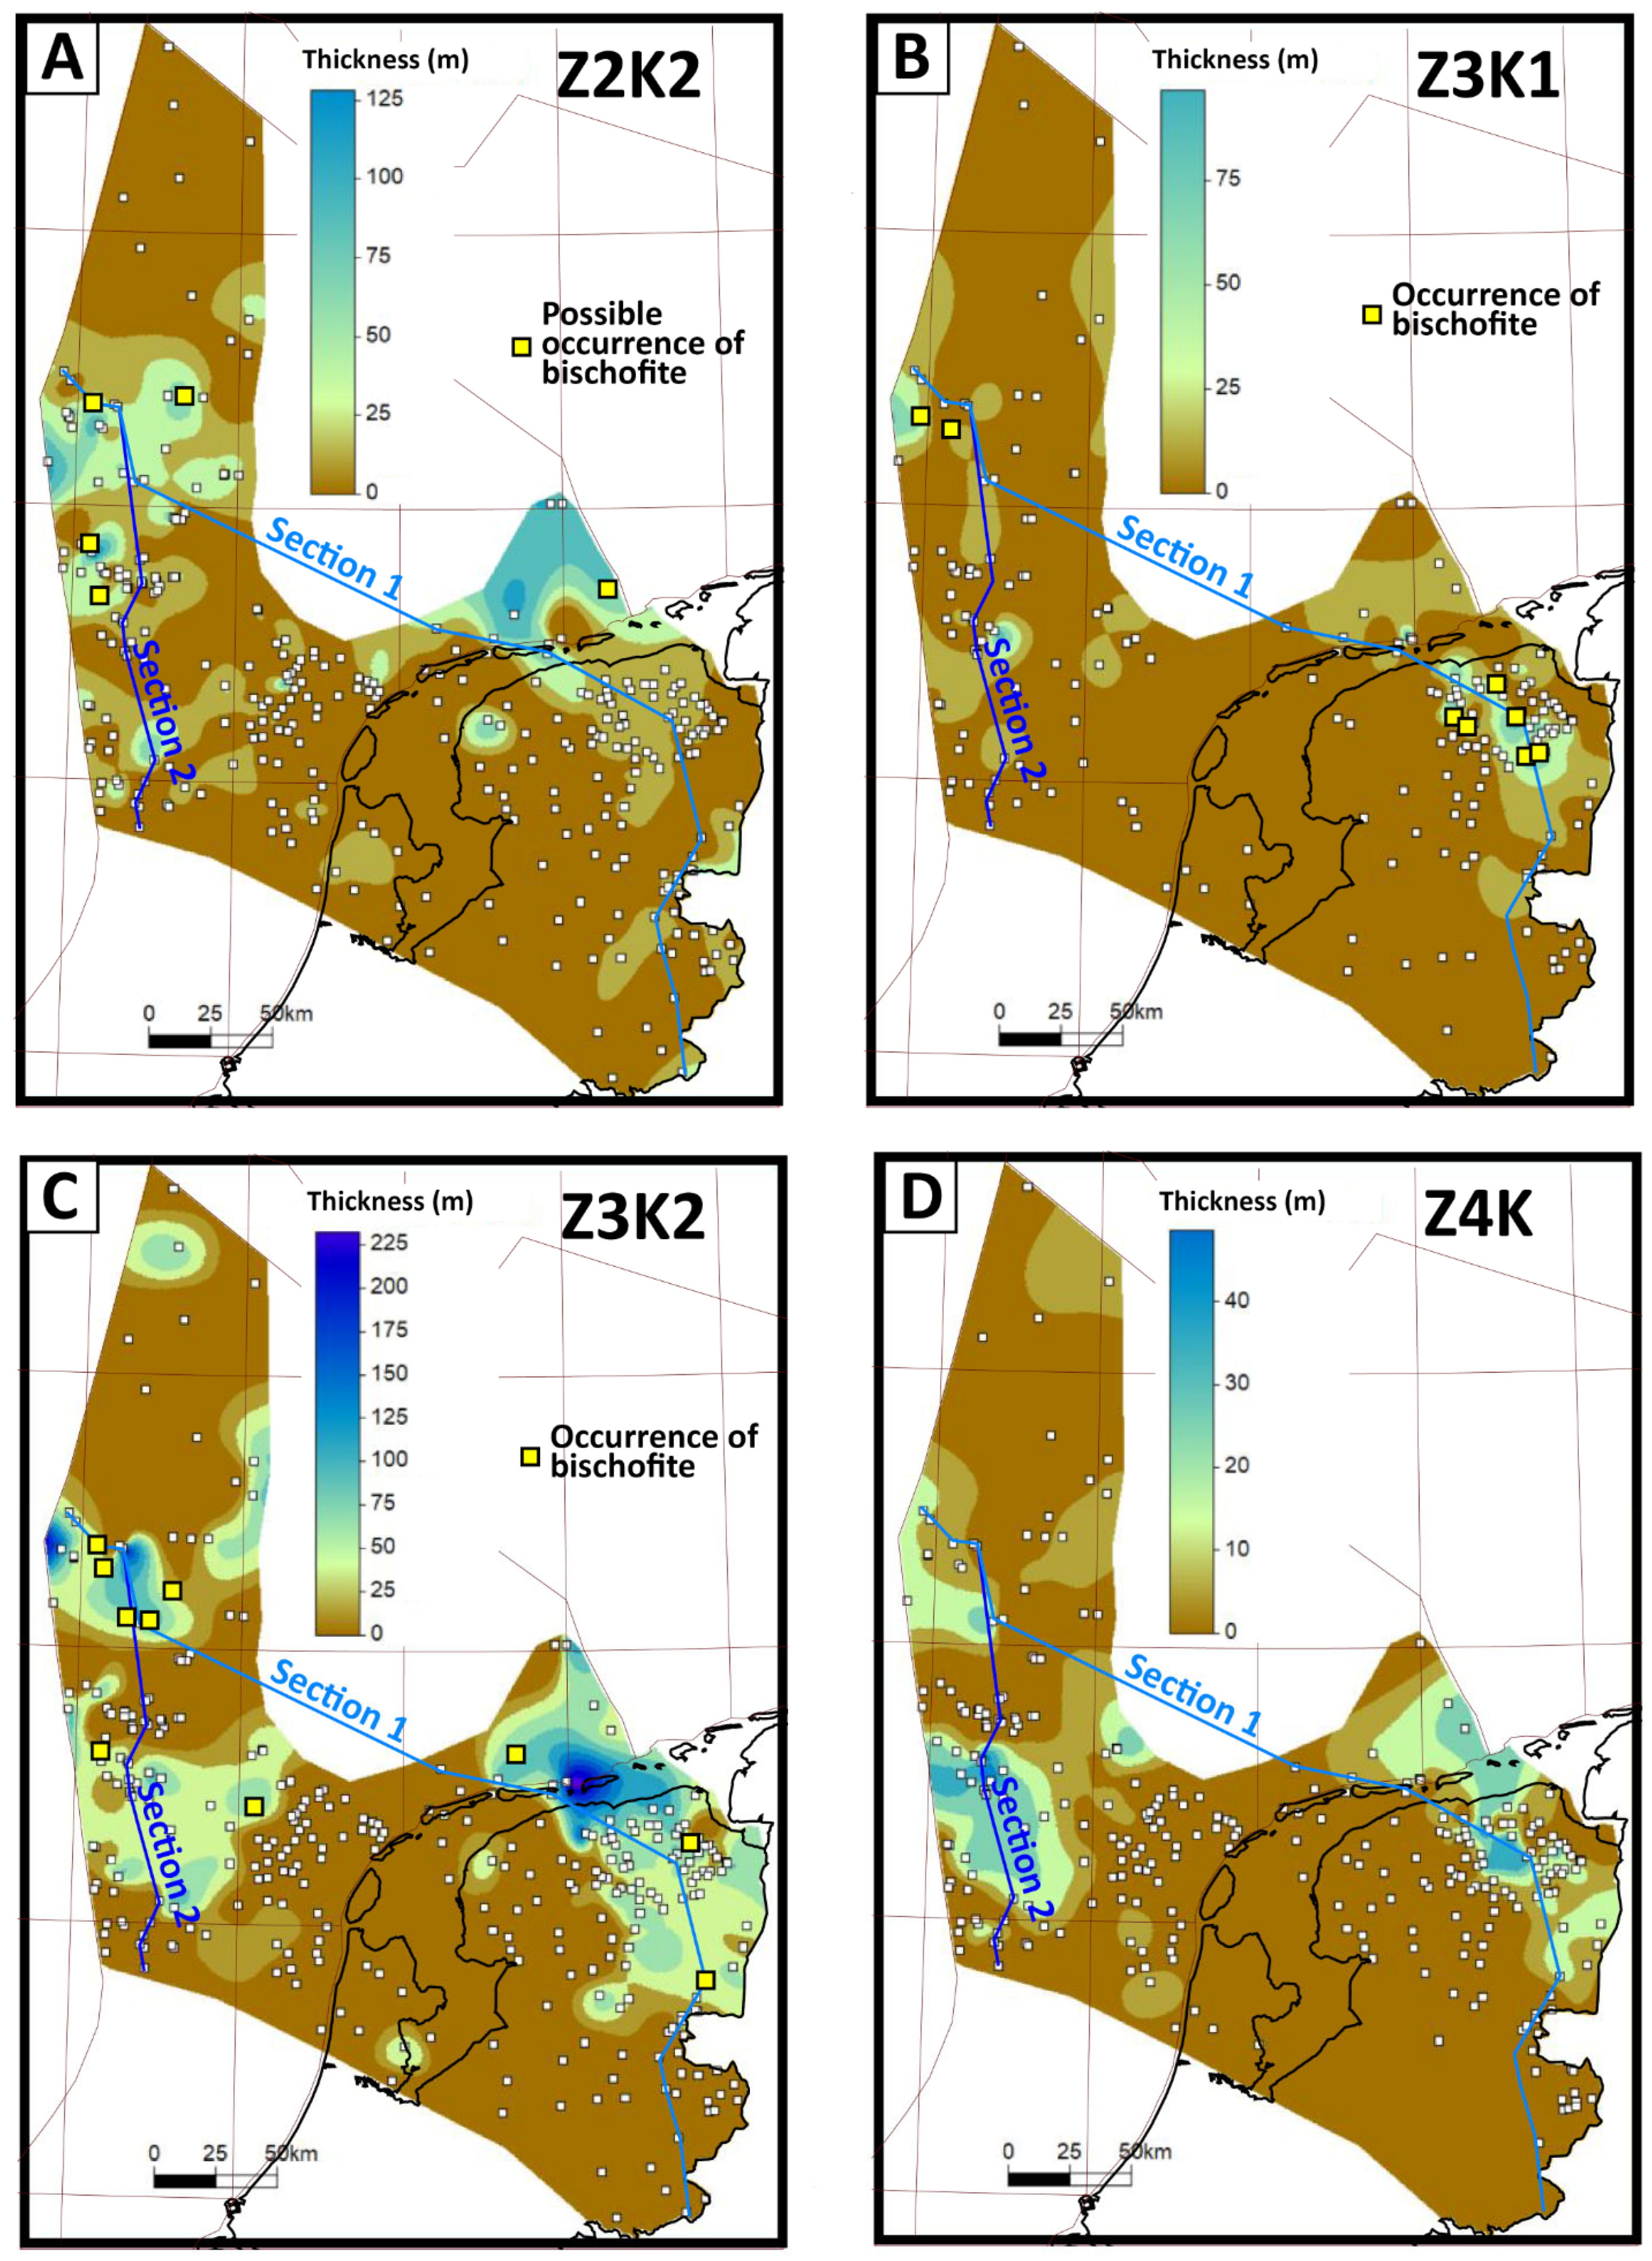
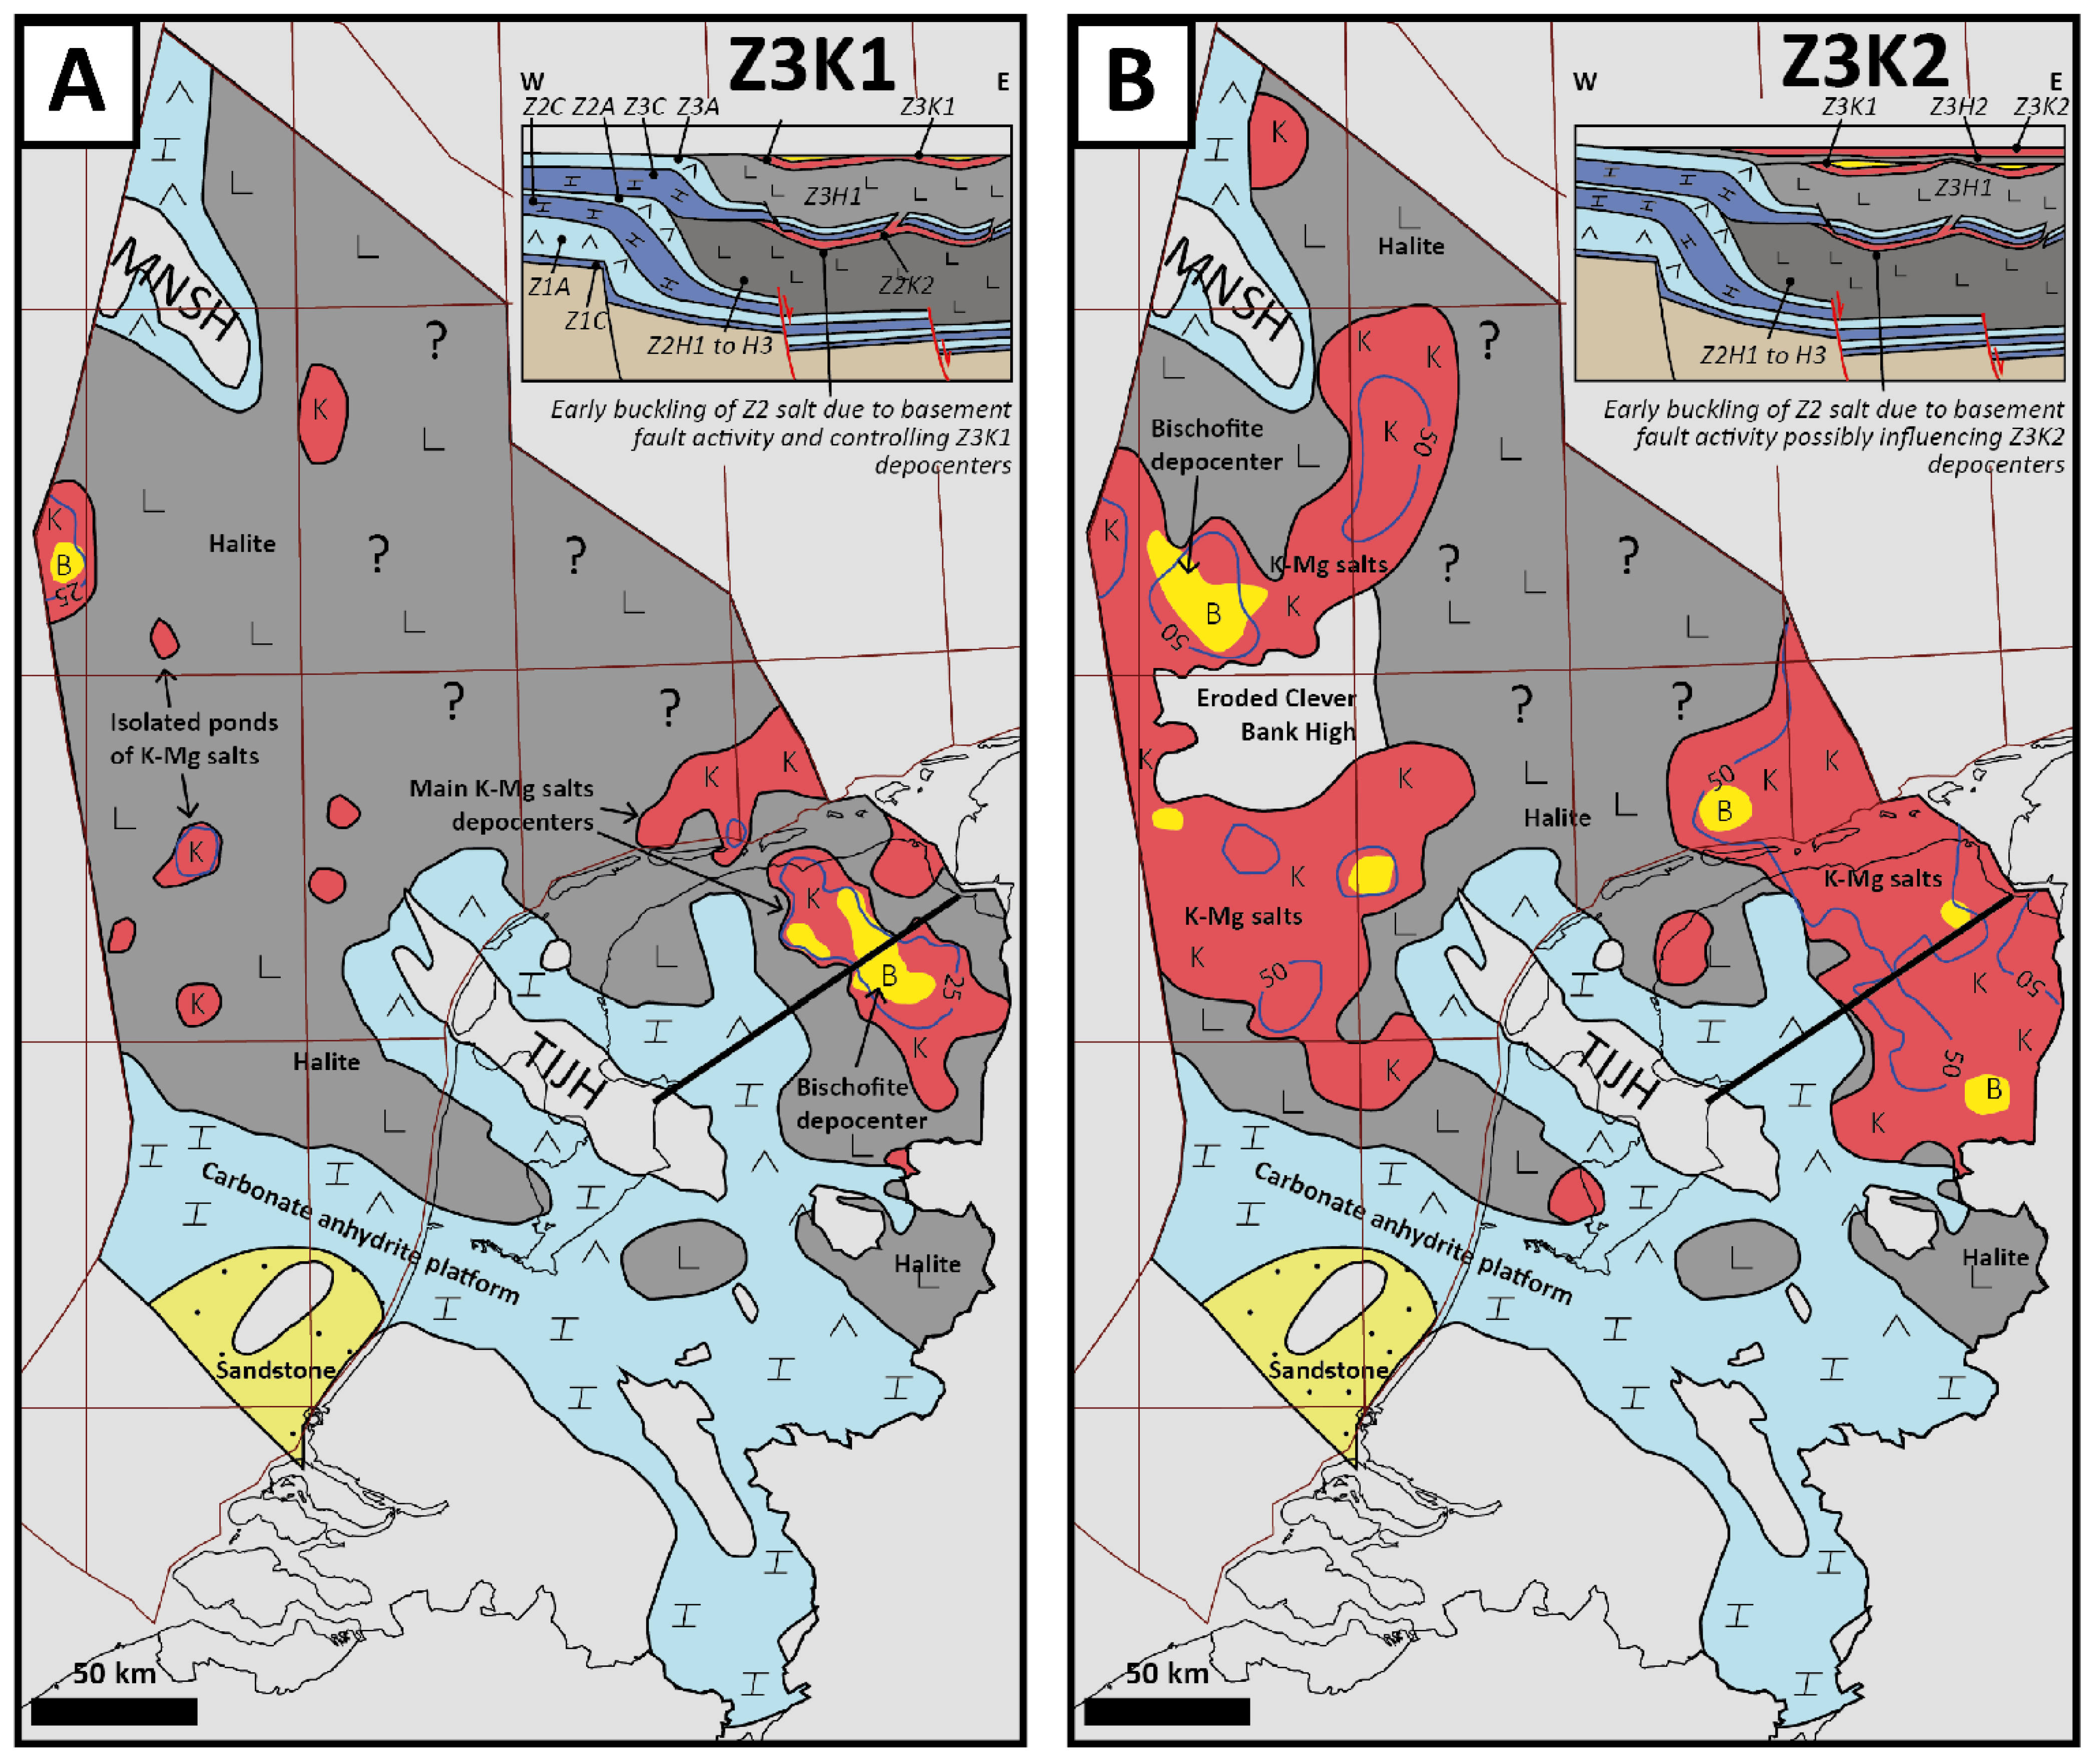
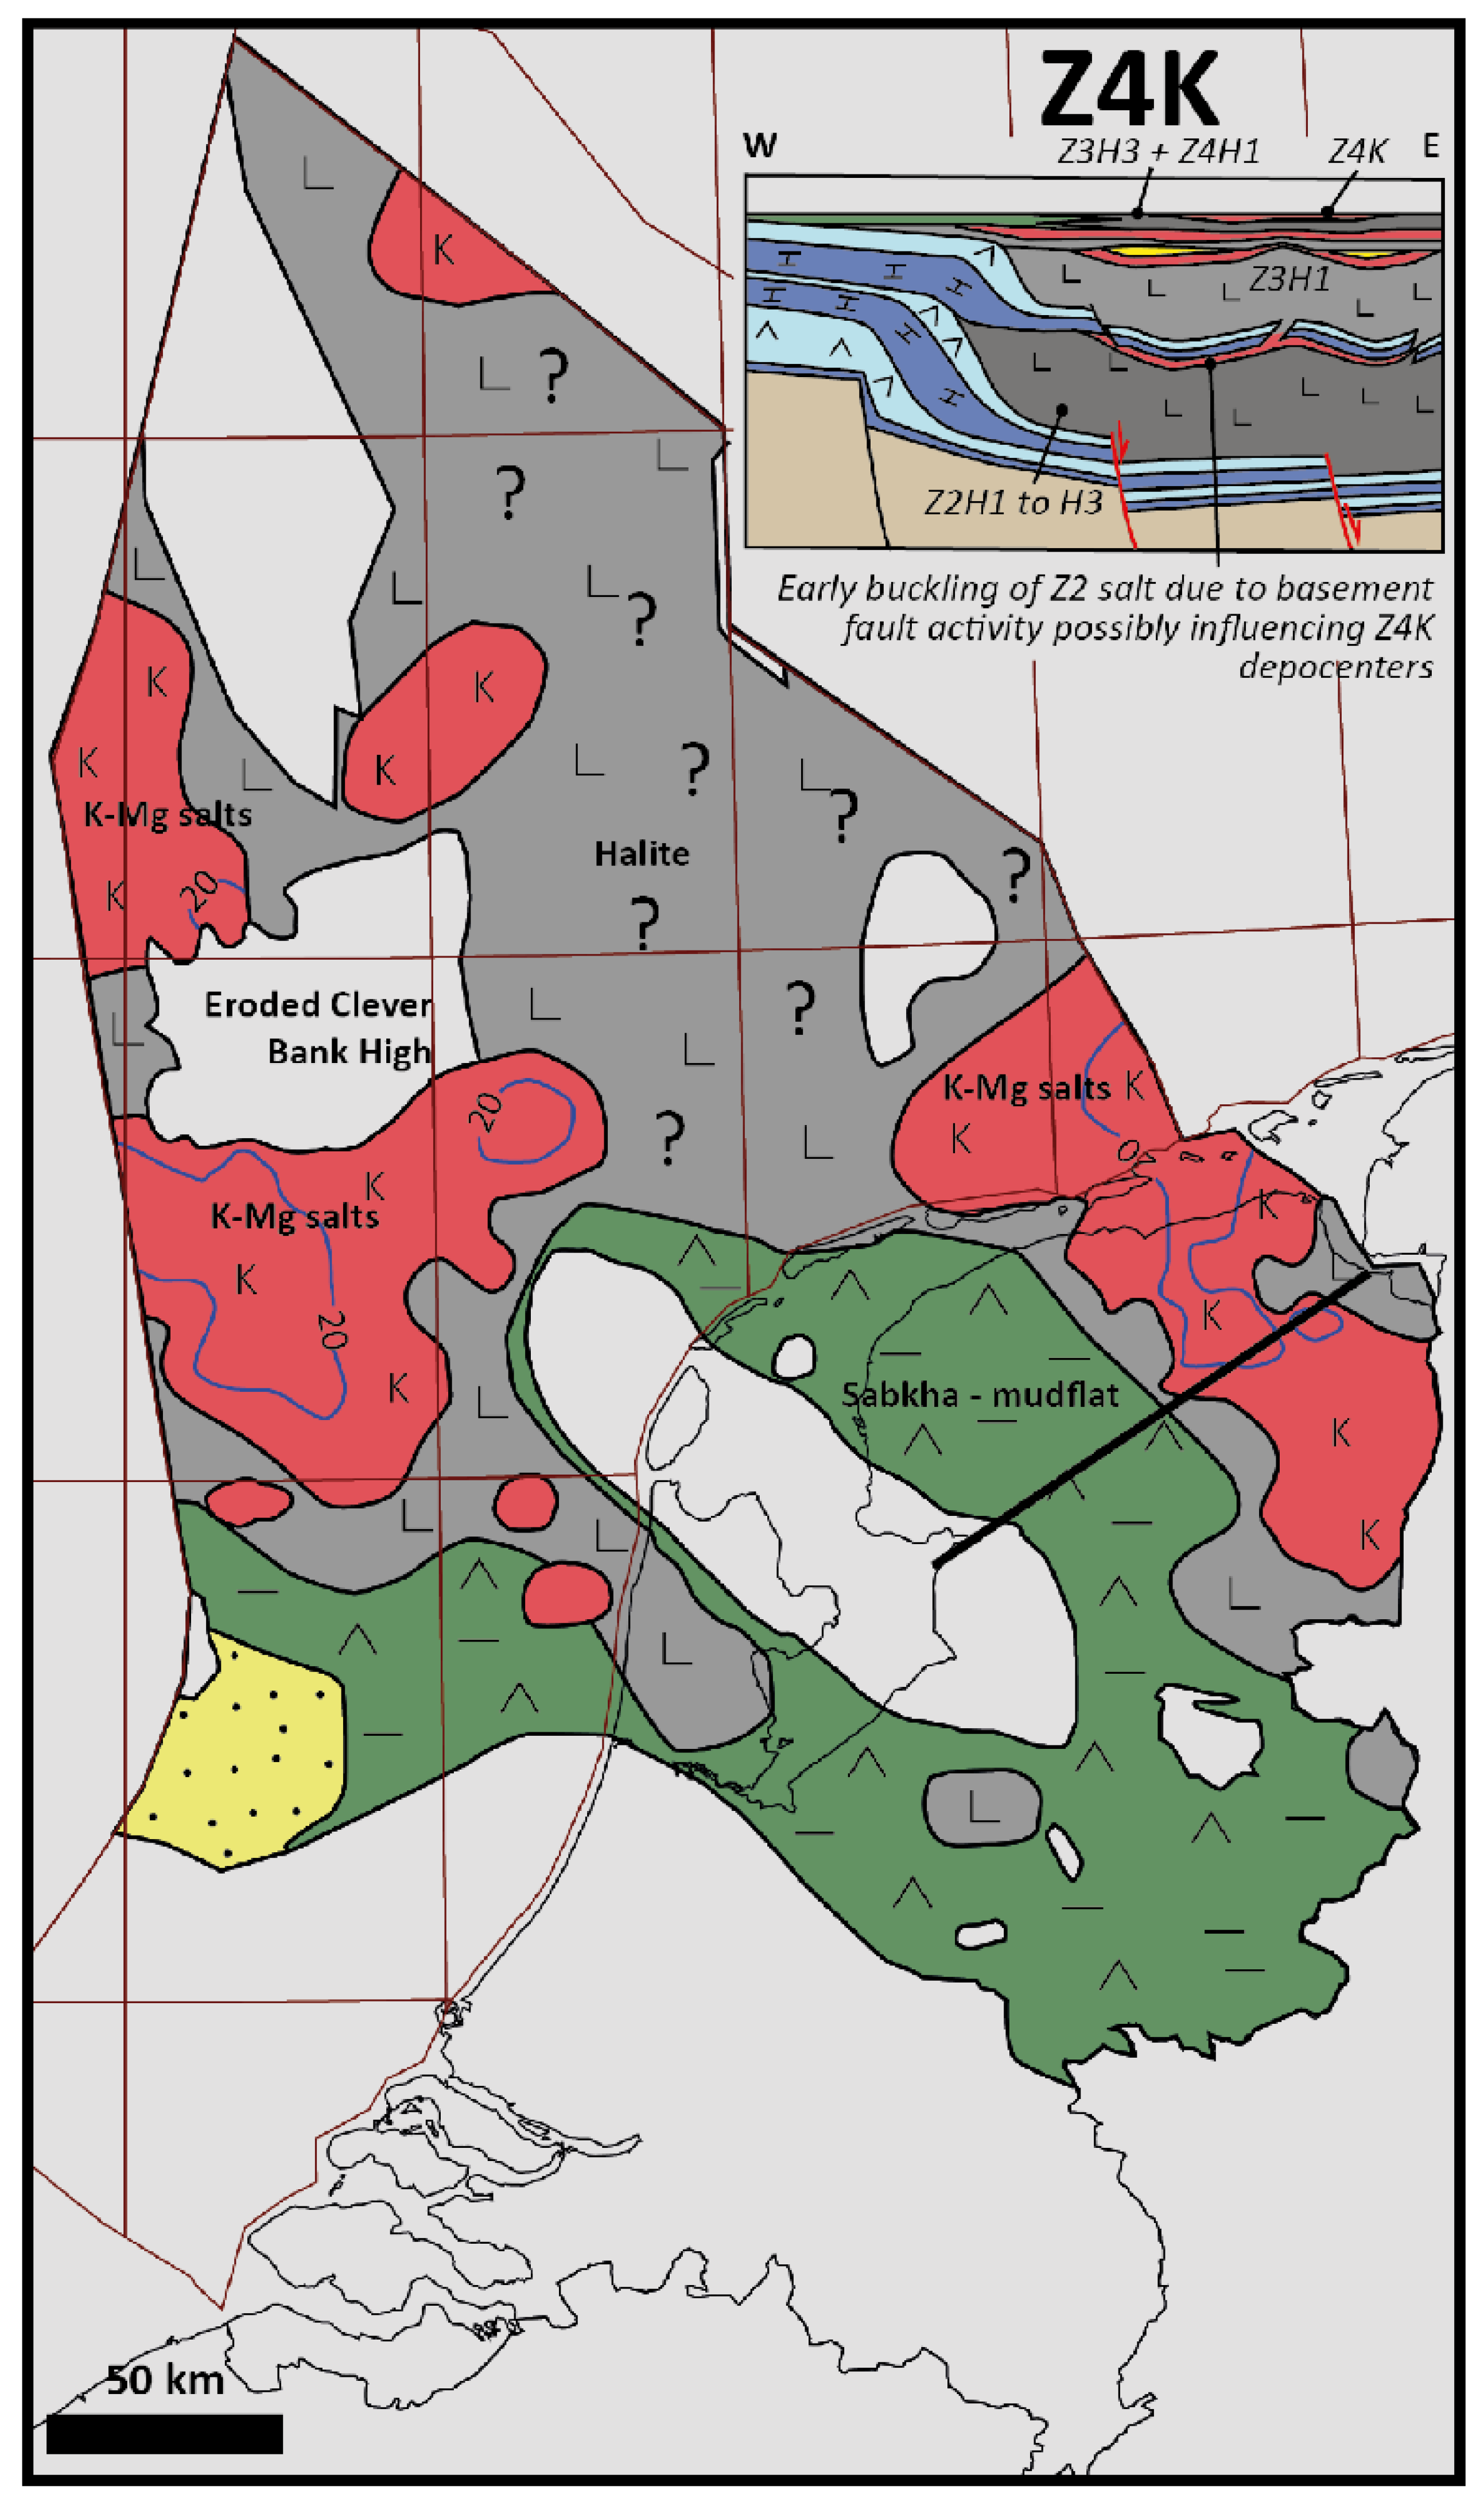
The Z2K2, Z3K1, Z3K2 and Z4K had a more regional extension as they rather developed on a very flat basin, under shallow water to subaerial conditions marked by a mosaic of depocenters, some of which had been controlled by tectonic activity and related salt movements.
-
Wireline log data suggest that the four K–Mg-rich intervals in the Z2 and Z3 include local occurrences of bischofite developed in perennial subaqueous and hypersaline conditions, in the deepest depocenters around which complete desiccation probably occurred.
-
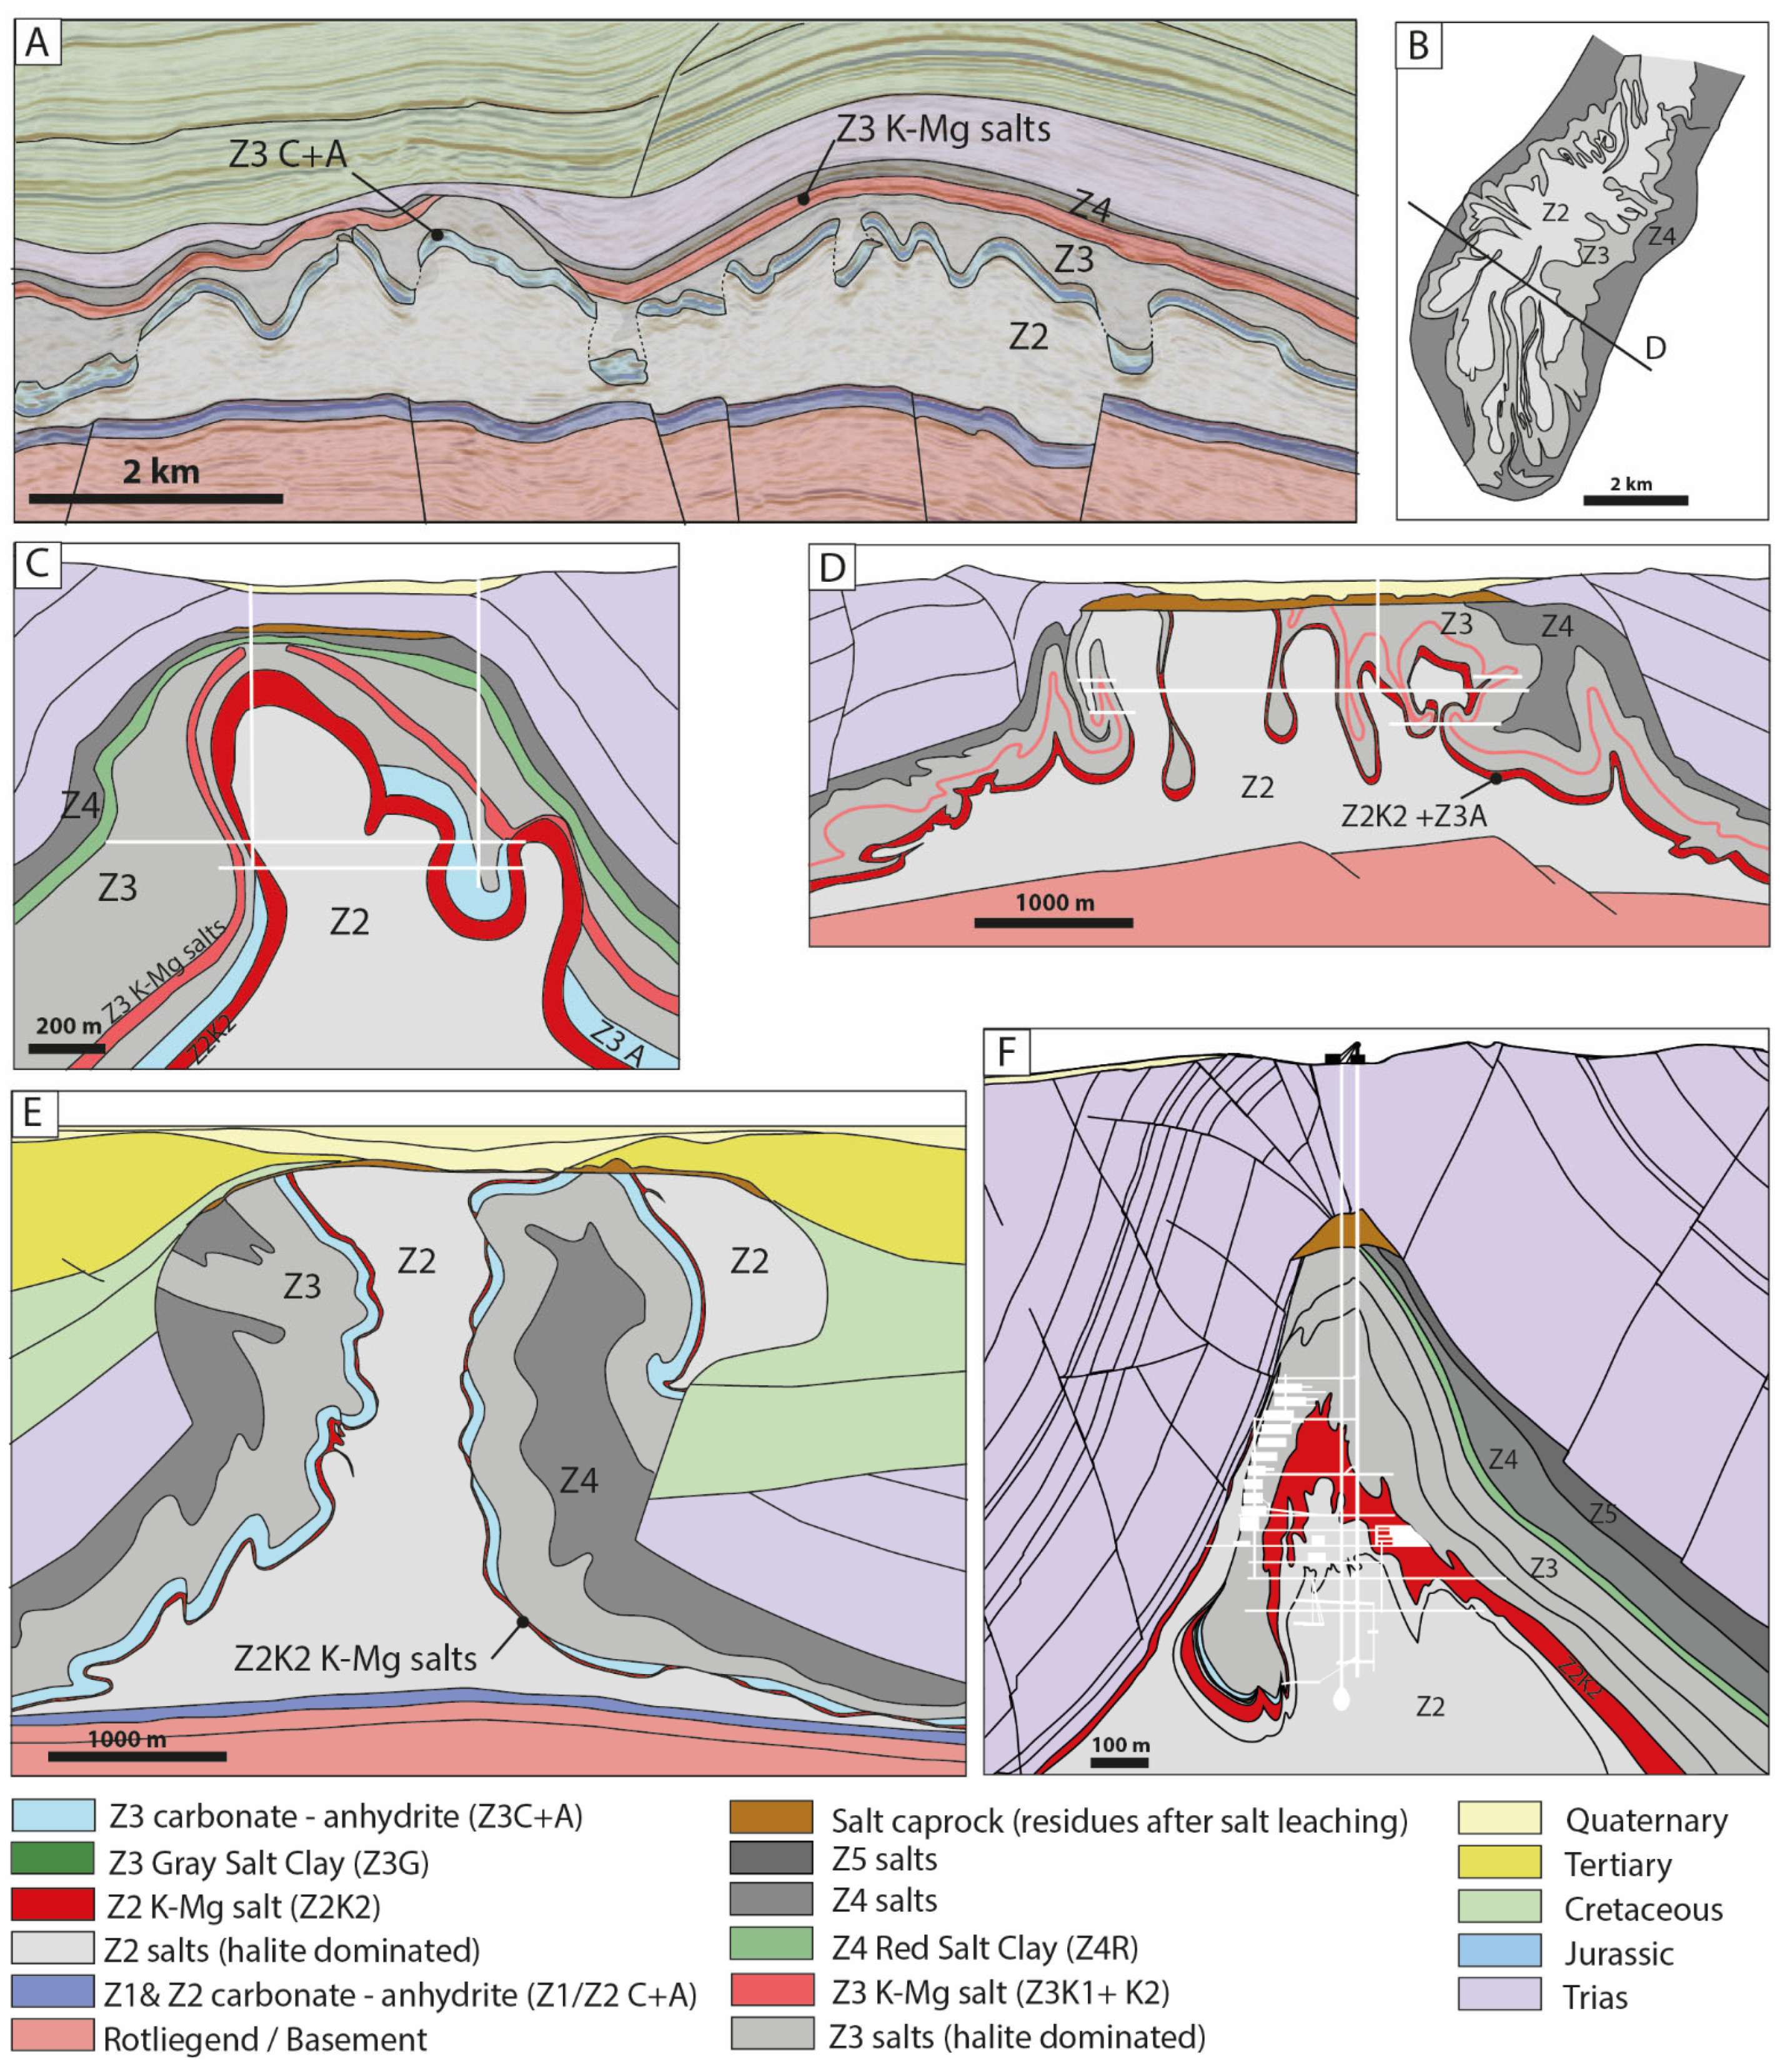
Finally, the constrained spatial repartition of the K–Mg salts in the Zechstein group, coupled with the structural characterization of the halokinetic deformations, enable us to assess the risk of encountering K–Mg rich salts in salt structures eligible in term of depth and thickness for the development of salt caverns.
-
The updated litho-stratigraphic architecture of the Zechstein group in Netherlands could be useful for other industrial purposes, such as oil and gas drilling operations or for the mining and leaching of K–Mg salts.

Funding

This research was funded by TotalEnergies through R&D projects on H2 storage.

Data Availability Statement

All data used in this study are freely available on https://www.nlog.nl/ (11 April 2022).

Acknowledgments

I thank TotalEnergies for their financial support and the supply of working software. I also warmly thank Sidonie Réveillon, Sabine Delahaye and Rene Geluk for their technical support during the study. I finally thank the four anonymous reviewers for their corrections and remarks which improved the final manuscript.

Conflicts of Interest

The author declares no conflict of interest. The funders had a role in the design of the study. The funders had no role on the collection, analyses, or interpretation of data; in the writing of the manuscript, or in the decision to publish the results.

References

  1. McKie, T.; Soto, J.I.; Flinch, J.F.; Tari, G. Paleogeographic evolution of latest Permian and Triassic salt basin in Northwest Europe. In Permo-Triassic Salt Provinces of Europe, North Africa and the Atlantic Margins: Tectonics and Hydrocarbon Potential; Soto, J.I., Flinch, J., Tari, G., Eds.; Elsevier: Amsterdam, The Netherlands, 2017; pp. 159–173. ISBN 9780128114506. [Google Scholar]
  2. Stollhofen, H.; Bachmann, G.H.; Barnasch, J.; Bayer, U.; Beutler, G.; Franz, M.; Kaestner, M.; Legler, B.; Mutterlose, J.; Radies, D. Upper Rotliegend to Early Cretaceous Basin Development. In Dynamics of Complex Intracontinental Basins: The Central European Basin System; Littke, R., Bayer, U., Gajewski, D., Nelskamp, S., Eds.; Springer: Berlin/Heidelberg, Germany, 2008; pp. 181–210. [Google Scholar]
  3. Soto, J.I.; Flinch, J.; Tari, G. Permo-Triassic Basins and Tectonics in Europe, North Africa and the Atlantic Margins: A Synthesis. In Permo-Triassic Salt Provinces of Europe, North Africa and the Atlantic Margins: Tectonics and Hydrocarbon Potential; Soto, J.I., Flinch, J., Tari, G., Eds.; Elsevier: Amsterdam, The Netherlands, 2017; pp. 3–41. ISBN 9780128114506. [Google Scholar]
  4. Geluk, M.C. Permian. In Geology of the Netherlands; Wong, T.E., Batjes, D.A.J., Jager, J., de van Wetenschappen, K.N.A., Eds.; Royal Netherlands Academy of Arts and Sciences: Amsterdam, The Netherlands, 2007; pp. 63–83. [Google Scholar]
  5. Duin, E.J.T.; Doornenbal, J.C.; Rijkers, R.H.B.; Verbeek, J.W.; Wong, T.E. Subsurface structure of the Netherlands-results of recent onshore and offshore mapping. Neth. J. Geosci. 2006, 85, 245–276. [Google Scholar] [CrossRef] [Green Version]
  6. Biehl, B.C.; Reuning, L.; Strozyk, F.; Kukla, P.A. Origin and deformation of intra-salt sulphate layers: An example from the Dutch Zechstein (Late Permian). Int. J. Earth Sci. 2014, 103, 697–712. [Google Scholar] [CrossRef] [Green Version]
  7. Raith, A.F.; Urai, J.L.; Visser, J. Structural and microstructural analysis of K-Mg salt layers in the Zechstein 3 of the Veendam Pillow, NE Netherlands: Development of a tectonic mélange during salt flow. Geol. En Mijnb. Neth. J. Geosci. 2017, 96, 331–351. [Google Scholar] [CrossRef] [Green Version]
  8. Geluk, M.C. Stratigraphy and tectonics of Permo-Triassic basins in the Netherlands and surrounding areas. Doctoral Dissertation, University Utrecht, Heidelberglaan, Utrecht, 2007. [Google Scholar]
  9. Harvie, C.E.; Weare, J.H.; Hardie, L.A.; Eugster, H.P. Evaporation of sea water; calculated mineral sequences. Science 1980, 208, 498–500. [Google Scholar] [CrossRef]
  10. Pletsch, T.; Appel, J.; Botor, D.; Clayton, C.; Duin, E.; Faber, E.; Górecki, W.; Kombrink, H.; Kosakowski, P.; Kuper, G.; et al. Petroleum genereation and migration. In Petroleum Geological Atlas of the Southern Permian Basin Area; Doornenbal, H., Stevenson, A., Eds.; EAGE Publications b.v: Houten, The Netherlands, 2010; pp. 225–253. [Google Scholar]
  11. Garrett, D.E. Potash: Deposits, Processing, Properties and Uses; Chapman & Hall: London, UK, 1996; ISBN 9789401071895. [Google Scholar]
  12. Geluk, M.C.; Paar, W.A.; Fokker, P.A. Salt. In Geology of The Netherlands; Wong, T.E., Batjes, D.A.J., Jager, J., de van Wetenschappen, K.N.A., Eds.; Royal Netherlands Academy of Arts and Sciences: Amsterdam, The Netherlands, 2007; pp. 283–294. [Google Scholar]
  13. Coelewij, P.; Haug, G.; van Kuijk, H. Magnesium-salt exploration in the northeastern Netherlands. Geol Mijnb. 1978, 57, 487–502. [Google Scholar]
  14. van Adrichem Boogaert, H.A.; Kouwe, W.F.P. Stratigraphic nomenclature of the Netherlands; revision and update by RGD and NOGEPA, Section D Permian. Mededelingen Rijks Geologische Dienst. 1994, 50, 1–42. [Google Scholar]
  15. Hoelen, Q.; van Pijkeren, G.; Teuben, B.; Steenbergen, B.; Breuning, P. Gas Storage in salt caverns—“Aardgasbuffer Zuidwending”—The Netherlands. In Proceedings of the 23rd World Gas Conference, Amsterdam, The Netherlands, 5–9 June 2006; pp. 1–12. [Google Scholar]
  16. Juez-Larré, J.; van Gessel, S.; Dalman, R.; Remmelts, G.; Groenenberg, R. Assessment of underground energy storage potential to support the energy transition in the Netherlands. First Break 2019, 37, 57–66. [Google Scholar] [CrossRef]
  17. Lankof, L.; Tarkowski, R. Assessment of the potential for underground hydrogen storage in bedded salt formation. Int. J. Hydrog. Energy 2020, 45, 19479–19492. [Google Scholar] [CrossRef]
  18. Caglayan, D.G.; Weber, N.; Heinrichs, H.U.; Linßen, J.; Robinius, M.; Kukla, P.A.; Stolten, D. Technical potential of salt caverns for hydrogen storage in Europe. Int. J. Hydrog. Energy 2020, 45, 6793–6805. [Google Scholar] [CrossRef]
  19. Da Costa, A.M.; Costa, P.V.; Miranda, A.C.; Goulart, M.B.; Udebhulu, O.D.; Ebecken, N.F.; Azevedo, R.C.; Eston, S.M.; de Tomi, G.; de Mendes, A.B.; et al. Experimental salt cavern in offshore ultra-deep water and well design evaluation for CO2 abatement. Int. J. Min. Sci. Technol. 2019, 29, 641–656. [Google Scholar] [CrossRef]
  20. Barnett, H.; Ireland, M.T.; Acikalin, S. Assessing the Feasibility of Large-Scale Hydrogen Storage in Salt Caverns on the UKCS Using 3D Seismic Data. In Proceedings of the EGU General Assembly Conference Abstracts, Vienna, Austria, 19–30 April 2021. [Google Scholar]
  21. Eradus, D.S. The Techno-Economic Feasibility of Green Hydrogen Storage in Salt Caverns in the Dutch North Sea. Master’s Thesis, Delft University of Technology, Delft, The Netherlands, 2022. [Google Scholar]
  22. Hassanpouryouzband, A.; Joonaki, E.; Edlmann, K.; Haszeldine, R.S. Offshore Geological Storage of Hydrogen: Is This Our Best Option to Achieve Net-Zero? ACS Energy Lett. 2021, 6, 2181–2186. [Google Scholar] [CrossRef]
  23. Ozarslan, A. Large-scale hydrogen energy storage in salt caverns. Int. J. Hydrog. Energy 2012, 37, 14265–14277. [Google Scholar] [CrossRef]
  24. Warren, J.K. Evaporites: A Geological Compendium; Springer: Berlin/Heidelberg, Germany, 2016; ISBN 978-3-319-13512-0. [Google Scholar]
  25. Allen, R.D.; Doherty, T.J.; THoms, R.L. Geotechnical Factors and Guidelines for Storage of Compressed Air in Solution Mined Salt Cavities; No. PNL-4242, 1982; Pacific Northwest Lab: Richland, WA, USA, 1982. [Google Scholar]
  26. Xue, T.; Yang, C.; Shi, X.; Hongling, M.; Li, Y.; Ge, X.; Liu, X. The formation mechanism of irregular salt caverns during solution mining for natural gas storage. Energy Sources Part A Recovery Util. Environ. Eff. 2020, 1–17. [Google Scholar] [CrossRef]
  27. Jackson, C.A.L.; Jackson, M.P.; Hudec, M.R.; Rodriguez, C.R. Enigmatic structures within salt walls of the Santos Basin-Part 1: Geometry and kinematics from 3D seismic reflection and well data. J. Struct. Geol. 2015, 75, 135–162. [Google Scholar] [CrossRef] [Green Version]
  28. Dooley, T.P.; Jackson, M.P.; Jackson, C.A.; Hudec, M.R.; Rodriguez, C.R. Enigmatic structures within salt walls of the Santos Basin—Part 2: Mechanical explanation from physical modelling. J. Struct. Geol. 2015, 75, 163–187. [Google Scholar] [CrossRef] [Green Version]
  29. Stewart, S.A.; Clark, J.A. Impact of salt on the structure of the Central North Sea hydrocarbon fairways. In Petroleum Geology of Nortwest Europe: Proceeding of the 5th Conference; Fleet, A.J., Boldy, S.A.R., Eds.; Geological Society: London, UK, 1999; pp. 179–200. [Google Scholar]
  30. Taylor, J. Upper Permian—Zechstein. In Petroleum Geology of the North Sea: Basic Concepts and Recent Advances; Glennie, K.W., Ed.; John Wiley & Sons: Hoboken, NJ, USA, 1998; pp. 174–212. [Google Scholar]
  31. Raith, A.F.; Strozyk, F.; Visser, A.F.; Urai, J.L. Evolution of rheologically heterogeneous salt structures: A case study from the NE Netherlands. Solid Earth 2016, 7, 67–82. [Google Scholar] [CrossRef] [Green Version]
  32. Harding, R.; Huuse, M. Salt on the move: Multi stage evolution of salt diapirs in the Netherlands North Sea. Mar. Pet. Geol. 2015, 61, 39–55. [Google Scholar] [CrossRef]
  33. Mohr, M.; Kukla, P.A.; Urai, J.L.; Bresser, G. Multiphase salt tectonic evolution in NW Germany: Seismic interpretation and retro-deformation. Int. J. Earth Sci. 2005, 94, 917–940. [Google Scholar] [CrossRef]
  34. Geluk, M.C.; Rohling, H.G. High-resolution sequence stratigraphy of the Lower Triassic ’Buntsandstein’ in the Netherlands and northwestern Germany. Geol. Mijnb. 1997, 76, 227–246. [Google Scholar] [CrossRef]
  35. Geluk, M.C. Late Permian (Zechstein) carbonate-facies maps, the Netherlands. Geol. En Mijnb. 2000, 79, 17–27. [Google Scholar] [CrossRef] [Green Version]
  36. Barabasch, J.; Urai, J.L.; Raith, A.F.; de Jager, J. The early life of a salt giant: 3D seismic study on syntectonic zechstein salt and stringer deposition on the Friesland platform, Netherlands. Z. Der Dtsch. Ges. Fur Geowiss. 2019, 170, 1–16. [Google Scholar] [CrossRef]
  37. Dyjaczyński, K.; Peryt, T.M. Controls on basal Zechstein (Wuchiapingian) evaporite deposition in SW Poland. Geol. Q. 2014, 58, 475–492. [Google Scholar] [CrossRef]
  38. Betzler, C.; Pawellek, T. Facies, stratigraphic architecture and high-resolution sequence stratigraphy of the Zechstein anhydrite (Werra Anhydrite) in Menslage area (Lower Saxony, N Germany). Z. Der Dtsch. Ges. Für Geowiss. 2014, 165, 331–344. [Google Scholar] [CrossRef]
  39. Mawson, M.; Tucker, M. High-frequency cyclicity (Milankovitch and millennial-scale) in slope-apron carbonates: Zechstein (Upper Permian), North-east England. Sedimentology 2009, 56, 1905–1936. [Google Scholar] [CrossRef]
  40. van de Sande, J.M.M. Prediction of Reservoir Parameters from 3-D Seismic Data for the Zechstein 2 Carbonate Play in the Northeast Netherlands. In AAPG Studies in Geology No. 42 and SEG Geophysical Developments Series No. 5; Weimer, P., Davis, T.L., Eds.; AAPG/SEG: Tusla, OK, USA, 1996; pp. 197–204. [Google Scholar]
  41. Reijers, T.J.A. Sedimentology and diagenesis as ’hydrocarbon exploration tools’ in the Late Permian Zechstein-2 Carbonate Member (NE Netherlands). Geologos 2012, 18, 163–195. [Google Scholar] [CrossRef]
  42. Grant, R.J.; Underhill, J.R.; Hernández-Casado, J.; Barker, S.M.; Jamieson, R.J. Upper Permian Zechstein Supergroup carbonate-evaporite platform palaeomorphology in the UK Southern North Sea. Mar. Pet. Geol. 2019, 100, 484–518. [Google Scholar] [CrossRef]
  43. Becker, F.; Bechstädt, T. Sequence stratigraphy of a carbonate-evaporite succession (Zechstein 1, Hessian Basin, Germany). Sedimentology 2006, 53, 1083–1120. [Google Scholar] [CrossRef]
  44. Menning, M.; Alekseev, A.S.; Chuvashov, B.I.; Davydov, V.I.; Devuyst, F.X.; Forke, H.C.; Grunt, T.A.; Hance, L.; Heckel, P.H.; Izokh, N.G.; et al. Global time scale and regional stratigraphic reference scales of Central and West Europe, East Europe, Tethys, South China, and North America as used in the Devonian-Carboniferous-Permian Correlation Chart 2003 (DCP 2003). Palaeogeogr. Palaeoclimatol. Palaeoecol. 2006, 240, 318–372. [Google Scholar] [CrossRef]
  45. De Jager, J.; Visser, C. Geology of the Groningen field–an overview. Neth. J. Geosci. 2017, 96, s3–s15. [Google Scholar] [CrossRef] [Green Version]
  46. van Wees, J.D.; Stephenson, R.A.; Ziegler, P.A.; Bayer, U.; Mccann, T.; Dadlez, R.; Gaupp, R.; Narkiewicz, M.; Bitzer, F.; Scheck, M. On the origin of the Southern Permian Basin, Central Europe. Mar. Pet. Geol. 2000, 17, 43–59. [Google Scholar] [CrossRef]
  47. Rijkers, R.; Geluk, M.C. Sedimentary and structural history of the Texel-IJsselmeer High, the Netherlands. In Geology of Gas and Oil under the Netherlands: Selection of Papers Presented at the 1993 International Conference of the American Association of Petroleum Geologists, Held in The Hague; Rondeel, H.E., Batjes, D., Nieuwenhuijs, W.H., Eds.; Springer: Berlin/Heidelberg, Germany, 1996; pp. 265–284. [Google Scholar]
  48. Schroot, B.M.; de Haan, H.B. An improved regional structural model of the Upper Carboniferous of the Cleaver Bank High based on 3D seismic interpretation. Geol. Soc. Spec. Publ. 2003, 212, 23–37. [Google Scholar] [CrossRef]
  49. Scheck-Wenderoth, M.; Lamarche, J. Crustal memory and basin evolution in the Central European Basin System—New insights from a 3D structural model. Tectonophysics 2005, 397, 143–165. [Google Scholar] [CrossRef]
  50. Gast, R.E.; Dusar, M.; Breitkreuz, C.; Gaupp, R.; Schneider, J.W.; Stemmerik, L.; Geluk, M.C.; Geißler, M.; Kiersnowski, H. Rotliegend. In Petroleum Geological Atlas of the Southern Permian Basin Area; Doornenbal, H., Stevenson, A., Eds.; EAGE Publications b.v: Houten, The Netherlands, 2010; pp. 101–121. [Google Scholar]
  51. Menning, M. A numerical timescale for the Permian and Triassic periods: An integrated time analysis. In The Permian of Northern Pangea; Scholle, P., Peryt, T., Ulmer-Scholle, D.S., Eds.; Springer: Berlin/Heidelberg, Germany, 1995; pp. 77–97. [Google Scholar]
  52. Menning, M.; Gast, R.; Hagdorn, H.; Käding, K.C.; Simon, T.; Szurlies, M.; Nitsch, E. Zeitskala für Perm und Trias in der Stratigraphischen Tabelle von Deutschland 2002, zyklostratigraphische Kalibrierung der höheren Dyas und Germanischen Trias und das Alter der Stufen Roadium bis Rhaetium 2005. Newsl. Stratigr. 2006, 41, 174–210. [Google Scholar] [CrossRef]
  53. Denison, R.E.; Peryt, T.M. Strontium isotopes in the Zechstein anhydrites of Poland: Evidence of varied meteoric contributions to marine brines. Geol. Q. 2009, 53, 159–166. [Google Scholar]
  54. Remmelts, G. Fault-related salt tectonics in the Southern North Sea, The Netherlands. In Salt Tectonics: A global Perspective; Jackson, M., Roberts, D.G., Snelson, S., Eds.; Memoir 65; American Association or Petroleum Geologists: Tulsa, OK, USA, 1995; pp. 261–272. [Google Scholar]
  55. Tucker, M.E. Sequence stratigraphy of carbonate-evaporite basins: Models and application to the Upper Permian (Zechstein) of northeast England and adjoining North Sea. J. Geol. Soc. 1991, 148, 1019–1036. [Google Scholar] [CrossRef]
  56. Goodall, I.G.; Harwood, G.M.; Kendall, A.C.; McKie, T.; Tucker, M.E. Discussion on sequence stratigraphy of carbonate-evaporite basins: Models and application to the Upper Permian (Zechstein) of northeast England and adjoining North Sea. J. Geol. Soc. 1992, 149, 1050–1054. [Google Scholar] [CrossRef]
  57. Mitchum, R.M.; van Wagoner, J.C. High-frequency sequences and their stacking patterns: Sequence-stratigraphic evidence of high-frequency eustatic cycles. Sediment. Geol. 1991, 70, 131–160. [Google Scholar] [CrossRef]
  58. Peryt, T.M.; Geluk, M.C.; Mathiesen, A.; Paul, J.; Smith, K. Zechstein. In Petroleum Geological Atlas of the Southern Permian Basin Area; EAGE Publications b.v: Houten, The Netherlands, 2010. [Google Scholar]
  59. NITG. Geological Atlas of the Subsurface of The Netherlands, Explanation to Map Sheet X Almelo–Winterswijk (1:250,000); Netherlands Institute for Applied Geoscience TNO—National Geological Survey: Amsterdam, The Netherlands, 1998. [Google Scholar]
  60. Geluk, M.C.; Plomp, A.; van Doorn, T.H. Development of the Permo-Triassic succession in the basin fringe area, southern Netherlands. In Geology of Gas and Oil under The Netherlands: Selection of Papers Presented at the 1993 International Conference of the American Association of Petroleum Geologists, held in The Hague; Rondeel, H.E., Batjes, D.A.J., Nieuwenhuijs, W.H., Eds.; Springer Science & Business Media: Dordrecht, Germany, 1996; pp. 57–78. [Google Scholar]
  61. Strohmenger, C.; Antonini, M.; Jäger, G.; Rockenbauch, K.; Strauss, C. Zechstein 2 carbonate reservoir facies distribution in relation to zechstein sequence stratigraphy (upper Permian, northwest Germany): An integrated approach. Bull. Des Cent. De Rech. Elf Explor. Prod. 1996, 20, 1–35. [Google Scholar]
  62. van den Belt, F.J.G.; de Boer, P.L. An intra-basinal Mechanism for marine-evaoprite cyclicity. J. Geol. Soc. Lond. 2014, 171, 461–464. [Google Scholar] [CrossRef]
  63. van den Belt, F.J.; de Boer, P.L. A shallow-basin model for ‘saline giants’ based on isostasy-driven subsidence. In Sedimentary Processes, Environments and Basins: A Tribute to Peter Friend; Nichols, G., Williams, E., Paola, C., Eds.; John Wiley & Sons: Hoboken, NJ, USA, 2009; pp. 241–252. [Google Scholar]
  64. Geluk, M. Late Permian (Zechstein) rifting in the Netherlands: Models and implications for petroleum geology. Pet. Geosci. 1999, 5, 189–199. [Google Scholar] [CrossRef]
  65. TNO-GDN. Z5 Salt Member, 2022. Stratigraphic Nomenclature of The Netherlands, TNO—Geological Survey of The Netherlands. Available online: http://www.dinoloket.nl/en/stratigraphic-nomenclature/z5-salt-member (accessed on 4 February 2022).
  66. Hirlemann, G. Pendagemétrie directe et indirecte—Comparaison et contribution à la résolution de la gîtologie des niveaux sylvinitiques dans la série du bassin côtier congolais. Géologues 1993, 100–101, 42–48. [Google Scholar]
  67. Sarg, J.F. The sequence stratigraphy, sedimentology, and economic importance of evaporite±carbonate transitions: A review. Sediment. Geol. 2001, 140, 9–42. [Google Scholar] [CrossRef]
  68. Sirota, I.; Ouillon, R.; Mor, Z.; Meiburg, E.; Enzel, Y.; Arnon, A.; Lensky, N.G. Hydroclimatic Controls on Salt Fluxes and Halite Deposition in the Dead Sea and the Shaping of “Salt Giants”. Geophys. Res. Lett. 2020, 47, e2020GL090836. [Google Scholar] [CrossRef]
  69. Clark, J.A.; Stewart, S.A.; Cartwright, J.A. Evolution of the NW margin of the North Permian Basin, UK North Sea. J. Geol. Soc. 1998, 155, 663–676. [Google Scholar] [CrossRef]
  70. Martins, G.S.; Mohriak, W.U.; Destro, N. Synrift evaporite deposition and structural characterization of the onshore Alagoas subbasin. Interpretation 2019, 7, 19–31. [Google Scholar] [CrossRef]
  71. Colter, V.S.; Reed, G.E. Zechstein 2 Fordon Evaporite of the Atwick No. 1 borehole, surrounding areas of the N.E England and the adjacent southern North Sea. In The Zechstein Basin with Emphasis on Carbonate Sequences, 9th ed.; Füchtbauer, H., Peryt, T.M., Eds.; Schweizerbart: Stuttgart, Germany, 1980; pp. 115–129. [Google Scholar]
  72. Taylor, J.C.M.; Colter, V.S. Zechstein of the English sector of the Southern North Sea Basin. In Petroleum and the Continental Shelf of North West Europe: Volum 1: Geology; Woodland, A.W., Ed.; Applied Science Publishers Ltd: Barking, Essex, 1975; pp. 249–263. [Google Scholar]
  73. Hovorka, S.; Nava, R. Characterization of bedded salt for storage caverns-A case study from the Midland Basin, Texas. Natl. Pet. Technol. Off. Tulsa OK (US); No. DOE/BC; National Energy Technology Lab: Tulsa, OK, USA, 2000. [Google Scholar]
  74. Raup, O.B.; Hite, R.J. Lithology of Evaporite Cycles and Cycle Boundaries in the Upper Part of the Paradox Formation of the Hermosa Group of Pennsylvanian Age in the Paradox Basin, Utah and Colorado; US Government Printing Office: Washington, DC, USA, 1992.
  75. Sirota, I.; Enzel, Y.; Lensky, N.G. Halite focusing and amplification of salt layer thickness: From the Dead Sea to deep hypersaline basins. Geol. Soc. Am. 2018, 2, 851–854. [Google Scholar] [CrossRef]
  76. Kovalevych, V.M.; Peryt, T.M.; Shanina, S.N. Geochemical aureoles around oil and- gas accumulations in the Zechstein (Upper Permian) of Poland: Analysis of fluid inclusions in halite and bitumens in salt. J. Pet. Geol. 2008, 31, 245–262. [Google Scholar] [CrossRef]
  77. Peryt, T.M.; Kasprzyk, A.; Czapowski, G. Basal Anhydrite and Screening Anhydrite (Zechstein, Upper Permian) in Poland. Bull. Pol. Acad. Sci. 1996, 44, 131–134. [Google Scholar]
  78. Kasprzyk, A. Sedimentological and diagenetic patterns of anhydrite deposits in the Badenian evaporite basin of the Carpathian Foredeep, southern Poland. Sediment. Geol. 2003, 158, 167–194. [Google Scholar] [CrossRef]
  79. Pichat, A.; Hoareau, G.; Callot, J.-P.; Ringenbach, J.-C. Characterization of Oligo-Miocene evaporite-rich minibasins in the Sivas Basin, Turkey. Mar. Pet. Geol. 2019, 110, 587–605. [Google Scholar] [CrossRef]
  80. Schreiber, B.C.; Helman, M.L. Criteria for Distinguishing Primary Evaporite Features from Deformation Features in Sulfate Evaporites. J. Sediment. Res. 2005, 75, 960–963. [Google Scholar] [CrossRef]
  81. Da Gong, X.; Xiao, B.; Bagas, L.; Li, D.; Zhou, J.Y.; Zou, H. Origin of the Early to Middle Triassic polyhalite minerals in the Sichuan Basin, SW China: New evidence from calcium and sulphur isotopes and microfabrics. Ore Geol. Rev. 2021, 139, 104439. [Google Scholar] [CrossRef]
  82. Steward, F.H. The Permian lower evaporites of Fordon in Yorkshire. Proc. Yorks. Geol. Soc. 1963, 34, 1–44. [Google Scholar] [CrossRef]
  83. Shang, W.J.; Zheng, M.P.; Zhang, Y.S.; Zhong, J.A.; Xing, E.Y.; Peng, Y.; Gui, B.L.; Li, K. Characteristics and origin of a new type of polyhalite potassium ore in the Lower Triassic Jialingjiang Formation, Puguang area, northeastern Sichuan Basin, SW China. J. Palaeogeogr. 2021, 10, 1–13. [Google Scholar] [CrossRef]
  84. Peryt, T.M.; Pierre, C.; Gryniv, S.P. Origin of polyhalite deposits in the Zechstein (Upper Permian) Zdrada platform (northern Poland). Sedimentology 1998, 45, 565–578. [Google Scholar] [CrossRef]
  85. Peryt, T.M.; Tomassi-Morawiec, H.; Czapowski, G.; Hryniv, S.P.; Pueyo, J.J.; Eastoe, C.J.; Vovnyuk, S. Polyhalite occurrence in the Werra (Zechstein, Upper Permian) peribaltic basin of Poland and Russia: Evaporite facies constraints. Carbonates Evaporites 2005, 20, 182–194. [Google Scholar] [CrossRef]
  86. Holser, W.T. Diagenetic polyhalite in recent salt from Baja California. American Mineralogist. J. Earth Planet. Mater. 1966, 51, 99–109. [Google Scholar]
  87. Peryt, T.M. Resedimentation of basin centre sulphate deposits: Middle Miocene Badenian of Carpathian Foredeep, southern Poland. Sediment. Geol. 2000, 134, 331–342. [Google Scholar] [CrossRef]
  88. Pichat, A.; Hoareau, G.; Lopez, M.; Callot, J.P.; Ringenbach, J.C. Sedimentology and depositional environment of the Late Eocene marine siliciclastic to evaporite transition in the Sivas Basin (Turkey). Mar. Pet. Geol. 2021, 131, 105151. [Google Scholar] [CrossRef]
  89. Manzi, V.; Lugli, S.; Lucchi, F.R.; Roveri, M. Deep-water clastic evaporites deposition in the Messinian Adriatic foredeep (northern Apennines, Italy): Did the Mediterranean ever dry out? Sedimentology 2005, 52, 875–902. [Google Scholar] [CrossRef]
  90. Schlager, W.; Bolz, H. Clastic accumulation of sulphate evaporites in deep water. J. Sediment. Petrol. 1977, 47, 600–609. [Google Scholar]
  91. Peryt, T.M.; Orti, F.; Rosell, L. Sulfate platform-basin transition of the Lower Werra Anhydrite (Zechstein, Upper Permian), western Poland: Facies and petrography. J. Sediment. Petrol. 1993, 63, 646–658. [Google Scholar] [CrossRef]
  92. Shalev, N.; Lazar, B.; Köbberich, M.; Halicz, L.; Gavrieli, I. The chemical evolution of brine and Mg-K-salts along the course of extreme evaporation of seawater—An experimental study. Geochim. Et Cosmochim. Acta 2018, 241, 164–179. [Google Scholar] [CrossRef]
  93. Sanford, W.E.; Warren, W.W. Brine evolution and mineral deposition in hydrologically open evaporite basin. Am. J. Sci. 1991, 291, 687–710. [Google Scholar] [CrossRef]
  94. Casas, E.; Lowenstein, T.K.; Spencer, R.J.; Pengxi, Z. Carnallite Mineralization in the Nonmarine, Qaidam Basin, China: Evidence for the Early Diagenetic Origin of Potash Evaporites. J. Sediment. Res. 1992, 62, 881–898. [Google Scholar] [CrossRef]
  95. Gindre-Chanu, L.; Pichat, A.; Delhaye-Prat, V.; Vis, C.; Ringenbach, R.; Schlund, J.-M. Depositional and diagenetic model of the Aptian potash-bearing Loémé evaporites in onshore Congo. Sediment. Geol. 2022, 427, 106038. [Google Scholar] [CrossRef]
  96. Czapowski, G. Kontynentalne osady chlorkowe w górnym cechsztynie Polski. Prz. Geol. 1990, 38, 370–374. [Google Scholar]
  97. Bornemann, O.; Schramm, M.; Tomasssi-Morawiec, H.; Czapowski, G.; Misiek, G.; Kolonko, P.; Janiow, S.; Tadych, J. Standard bromine profiles of the Polish Standard bromine profiles of the Polish and German Zechstein salts (a case study from the Kłodawa and Görleben salt mines). Geologos 2008, 14, 73–90. [Google Scholar]
  98. Czapowski, G. Facies characteristics and distribution of the Zechstein (Upper Permian) salt deposits of PZ3 (Leine) cycle in Poland. Bull. Pol. Acad. Earth Sci. 1993, 41, 229–237. [Google Scholar]
  99. Smith, D.B. The evolution of the English Zechstein basin. In The Zechstein Basin with Emphasis on Carbonate Sequences, 9th ed.; Füchtbauer, H., Peryt, T.M., Eds.; Schweizerbart: Stuttgart, Germany, 1980; pp. 7–34. [Google Scholar]
  100. Smith, D.B.; Crosby, A. The regional and stratigraphical context of Zechstein 3 and 4 potash deposits in the British sector of the southern North Sea and adjoining land areas. Econ. Geol. 1979, 74, 397–408. [Google Scholar] [CrossRef]
  101. Strozyk, F.; Urai, J.L.; van Gent, H.; de Keijzer, M.; Kukla, P.A. Regional variations in the structure of the Permian Zechstein 3 intrasalt stringer in the northern Netherlands: 3D seismic interpretation and implications for salt tectonic evolution. Interpretation 2014, 2, SM101–SM117. [Google Scholar] [CrossRef]
  102. Lokhorst, A. The Northwest European Gas Atlas; TNO; Netherlands Institute of Applied Geoscience: Amsterdam, The Netherlands, 1998. [Google Scholar]
  103. Keime, M.; Charnavel, Y.; Lampe, G.; Theylich, H. Obstruction in a salt cavern: Solution is dissolution. In Proceedings of the 25th world gas conference, Kuala Lumpur, Malaisia, 6 June 2012. [Google Scholar]
  104. Richter-Bernburg, G. Salt tectonics, interior structures of salt bodies. Bull. Cent. Rech. Explor. Prod. Elf Aquitaine 1980, 4, 373–393. [Google Scholar]
  105. van Gent, H.; Urai, J.L.; de Keijzer, M. The internal geometry of salt structures—A first look using 3D seismic data from the Zechstein of the Netherlands. J. Struct. Geol. 2011, 33, 292–311. [Google Scholar] [CrossRef]
  106. Rowan, M.G.; Urai, J.L.; Fiduk, J.C.; Kukla, P.A. Deformation of intrasalt competent layers in different modes of salt tectonics. Solid Earth 2019, 10, 987–1013. [Google Scholar] [CrossRef] [Green Version]
  107. Strozyk, F.; Reuning, L.; Scheck-Wenderoth, M.; Tanner, D.C. The tectonic history of the Zechstein Basin in the Netherlands and Germany. In Permo-Triassic Salt Provinces of Europe, North Africa and the Atlantic Margins: Tectonics and Hydrocarbon Potential; Soto, J.I., Flinch, J., Tari, G., Eds.; Elsevier: Amsterdam, The Netherlands, 2017; pp. 221–241. ISBN 9780128114506. [Google Scholar]
  108. Hudec, M.; Jackson, M.P.A. Salt Tectonics: Principles and Practice; Cambridge University: Cambridge, UK, 2017; ISBN 9781139003988. [Google Scholar]
  109. Chemia, Z.; Schmeling, H.; Koyi, H. Tectonophysics The effect of the salt viscosity on future evolution of the Gorleben salt diapir, Germany. Tectonophysics 2009, 473, 446–456. [Google Scholar] [CrossRef]
  110. Jackson, M.; Cornelius, R.R.; Craig, C.H.; Gansser, A.; Stöcklin, J.; Talbot, C.J. Salt Diapirs of the Great Kavir, Central Iran. Mem. Geol. Soc. Am. 1990, 177, 1–139. [Google Scholar] [CrossRef] [Green Version]
  111. Smith, J.P. Notes on the Geology of the Potash Deposits of Gernany, France and Spain. Am. Inst. Min. Metall. Eng. Trans. 1951, 187, 117–121. [Google Scholar]
  112. Richter-Bernburg, G. Deformation within salt bodies. In Dynamical Geology of Salt and Related Structures; Lerche, I., Ed.; Elsevier: Amsterdam, The Netherlands, 1987; pp. 39–75. [Google Scholar]
  113. Bornemann, O.; Behlau, J.; Fischbeck, R.; Hammer, J.; Jaritz, W.; Keller, S.; Mingerzahn, G.; Schramm, M. Description of the Gorleben Site Part 3: Results of the Geological Surface and Underground Exploration of the Salt Formation; Bundesanstalt für Geowissenschaften und Rohstoffe: Hannover, Germany, 2008; ISBN 9783510959648. [Google Scholar]
  114. Szymaniak, T.; Schäfer, M. Geologisch-Tektonische Kartierung der Salzstruktur Asse im Subhercynen Becken; Technische Universität Clausthal, Institut für Geologie und Paläontologie: Clausthal-Zellerfeld, Germany, 2002. [Google Scholar]
  115. Thömmes, A.; Gömmel, R. Schachtanlage Asse (leaflet); GSF-Forschungszentrum für Umwelt und Gesundheit: Schlesheim, Germany, 2004. [Google Scholar]
  116. Fulda, E. Die Geologie der Kalisalzlagerstätten. In Das Kali. Die Gewinnung, Verarbeitung und Verwertung der Kalisalze; ihre Geschichte und Wirtschaftliche Bedeutung. Zwei Teile. II. Teil: Die Chemie und Mineralogie der Kalisalze; die Geologie der Kalisalzlagerstätten; die Gewinnung, Verarbeitung und Verwertung der Kalisalze; Vanino, L., Ed.; Enke’s Bibliothek für Chemie und Technik, unter Berücksichtigung der Volkswirtschaft: Stuttgart, Germany, 1928; pp. 24–136. [Google Scholar]
  117. Mayrhofer, H. World reserves of mineable potash salts based on structural analysis. Sixth Int. Symp. Salt 1985, 2, 141–160. [Google Scholar]
  118. Hofrichter, E. Probleme der Endlagerung radioaktiver Abfälle in Salzformazionen. J. Appl. Reg. Geol. 1980, 131, 409–430. [Google Scholar]
  119. Schachl, E. Kali-und Steinsalzbergwerk Niedersachsen-Riedel der Kali und Salz AG, Schachtanlage Riedel. Zechsteinstratigraphie und Innenbau des Salzstockes von Wathlingen-Hänigsen. In Proceedings of the Internationales Symposium Zechstein, Wiesbaden, Germany, 1987; pp. 69–100. [Google Scholar]
Figure 1. (A): Facies map of the Zechstein group (Z2 Carbonate) in the Southern Permian Basin (after [4] and reference therein) and localization of the Netherlands onshore and offshore domain (red line). (B): General lithostratigraphic chart of the Zechstein in Netherlands (after [14]).
Minerals 12 00486 g001
Figure 2. Isopach map of the Zechstein (after [5]) with the localization of the exploited wells in the course of this study and the performed correlative cross-sections (Sections 1 and 2). Capital letters refer to structural domains, CBH: Clever Bank High, LT: Lawerszee Trough, GR: Groningen High, TIJH: Texel-Ijsselmeer High, ESH: Embow Spit High.
Minerals 12 00486 g002
Figure 7. Updated general lithostratigraphic chart of the Zechstein in the Netherlands (modifier from [14]).
Minerals 12 00486 g007
Figure 8. Facies and isopach map of the Z1H (A) and Z2H1 (B) units (modified after [8]) with conceptual sections illustrating the depositional setting (upper right).
Minerals 12 00486 g008
Figure 9. Facies and isopach map of the Z2K1 (A) and Z2K2 (B) units (modified after [8]) with conceptual sections illustrating the depositional setting (upper right).
Minerals 12 00486 g009
Figure 10. Facies and isopach map of the Z3K1 (A) and Z3K2 (B) units (modified after [8]) with conceptual sections illustrating the depositional setting (upper right).
Minerals 12 00486 g010
Figure 11. Facies and isopach map of the Z4K unit (modified after [8]) with a conceptual section illustrating the depositional setting (upper right).
Minerals 12 00486 g011
Figure 12. Maps identifying eligible salt structures for salt cavern development in the Zechstein and allowing us to assess the risk of encountering K–Mg salts in the Z1 and Z2 cycles (A) and in the Z3 cycle (B). The identification of the salt pillow and salt diapirs is modified from [102].
Minerals 12 00486 g012
Figure 14. Illustration of very complex internal structures constrained by subsurface mine data in salt diapirs formed by the Zechstein salts in Germany. (A): Horizontal sections of the Sarstedt salt dome at a depth of 750 m below the surface (after [113]). (B): Cross section of the Bartensleben diapir (after [116]). (C): Cross section of a diapir hosting the Mariglück Mine (after [117]). (D): Cross section of a unnamed diapir (after [118]). (E): Cross section of the Hänigsen-Wathlingen salt dome (after [119]).
Minerals 12 00486 g014
Publisher’s Note: MDPI stays neutral with regard to jurisdictional claims in published maps and institutional affiliations.

