Article

Microencapsulation of Red Banana Peel Extract and Bioaccessibility Assessment by In Vitro Digestion

by
Morayma Ramírez Damián
1,
Ofelia Gabriela Meza-Márquez
1,*,
Guillermo Osorio-Revilla
1,*,
Tzayhri Gallardo-Velázquez
2,
Darío Iker Téllez-Medina
1 and
Oswaldo Arturo Ramos-Monroy
1
1
Departamento de Ingeniería Bioquímica, Escuela Nacional de Ciencias Biológicas-Zacatenco, Instituto Politécnico Nacional, Av. Wilfrido Massieu S/N, Esq. Cda. Miguel Stampa. Col. Unidad Profesional Adolfo López Mateos, Zacatenco. Alcaldía Gustavo A. Madero. C.P., Mexico City 07738, Mexico
2
Departamento de Biofísica, Escuela Nacional de Ciencias Biológicas-Santo Tomás, Instituto Politécnico Nacional, Prolongación de Carpio y Plan de Ayala S/N, Col. Santo Tomás. Alcaldía Miguel Hidalgo. C.P., Mexico City 11340, Mexico
*
Authors to whom correspondence should be addressed.
Processes 2022, 10(4), 768; https://doi.org/10.3390/pr10040768
Submission received: 13 March 2022 / Revised: 6 April 2022 / Accepted: 11 April 2022 / Published: 14 April 2022

Abstract

:
The use of food agricultural wastes as a source of bioactive compounds is an alternative to reduce their environmental impact and generate the possibility of producing value-added products as functional foods. This study aimed to extract and microencapsulate the bioactive compounds from the red banana peel (Musa acuminata Colla AAA “Red”) by spray drying and to evaluate the bioaccessibility of the bioactive compounds by in vitro digestion. The microencapsulation of bioactive compounds was carried out using two wall materials gum arabic (GA) and soy protein isolate (SPI). Microencapsulation using GA and SPI proved to be an effective technique to protect the phenolic compounds, flavonoids and antioxidant capacity of banana peel extract under in vitro digestion conditions. The extract without the encapsulation process suffered a significant (p ≤ 0.05) decrease in bioactive compounds and antioxidant capacity after in vitro digestion. Although microcapsules with SPI held the bioactive compounds for longer in the matrix, no significant difference (p ≤ 0.05) in bioactive compounds retention after in vitro digestion was observed between the microcapsules with GA or SPI. These results indicate that the microcapsules obtained may be used in the food industry as potential ingredients for developing functional foods to promote health benefits.

1. Introduction

People have increased their interest in including foods that provide specific benefits beyond nutritional value in their diet. Because of this, a large amount of research has been carried out on bioactive compounds and the development of functional foods that positively impact health [1].
Phenolic compounds are bioactive compounds produced in fruits and vegetables as secondary metabolites which are involved in plant defense mechanisms, acting as antioxidants, antimicrobials and modulators of enzymatic expression. The consumption of phenolic compounds has been associated with the prevention of various diseases [2]. They are found mainly in leaves, roots, stems, shells, seeds and flowers, so agro-industrial residues are considered an excellent source of these compounds. Therefore, their use would also reduce the waste generated and their environmental impact. As a source of bioactive compounds, food agricultural waste has been widely used; for example, rice by-products [3] grape pomace [4], pomegranate husk [5], pomegranate peel [6], Rambutan peel [7], cactus pear peel [8], plum peel [9].
Most of these phenolic compounds are sensitive to temperature, light, pH, humidity, enzymes and oxygen, making them susceptible to degradation during process and storage, and even in the gastrointestinal tract. Therefore, protection mechanisms, such as microencapsulation, are required to preserve these bioactive compounds. Among the different microencapsulation techniques, spray drying has been the most common approach to keep the stability and antioxidant activity of phenolic compounds. The main advantage of this process is that can be applied to both to heat-sensitive or heat-resistant materials [10].
It is also essential to determine if the compounds related to the antioxidant capacity are still available after the digestive process to have a beneficial effect on the human body. Thus, the beneficial effects of the antioxidant compounds can be evaluated through the analysis of bioaccessibility (amount of nutrients or compounds released from the food matrix in the gastrointestinal tract, which is available for absorption). Bioaccessibility is usually evaluated by in vitro digestion processes simulating gastric and intestinal digestion; assessing bioaccessibility also provides knowledge of the extent to which bioactive compounds can be released in stable conditions, since, after consumption, these compounds undergo structural changes caused by metabolism [11].
Banana (Musa spp.) peel is a good source of various phenolic compounds, which are natural antioxidants beneficial for health [12,13]. Different studies have been published on bioactive compounds of banana peel varieties [13,14,15,16,17], where the antioxidant capacity of extracts of this waste has been reported. Baskar et al. [17] compared banana peels of nine varieties and reported that red banana peel (Musa acuminata Colla) had a higher concentration of phenolic compounds, flavonoids, anthocyanins and antioxidant capacity than yellow varieties. Red banana peel also contains large amounts of dopamine and L-dopa, catecholamines, carotenes, tocopherols and ascorbic acid, which have substantial antioxidant activity [2,14]. Many studies have shown that red banana peel extracts possess a stronger antioxidant activity than pulps [18,19]. Red banana peel extracts also have a high capacity to scavenge DPPH and ABTS free radicals [14].
Red banana (M. acuminata Colla) is a wild species of banana that has a relatively wide distribution, and Southeast Asia is considered the primary center of origin. At present, M. acuminata Colla is grown in many countries worldwide, and the major producers are Brazil, China, India, Ecuador, Columbia and Venezuela. The global distribution of M. acuminata Colla has already been reported [18,19].
There are few studies on the red banana peel (M. acuminata Colla) and the research that has been carried out on this variety is not focused on the microencapsulation of its bioactive compounds. To date, no studies have reported the microencapsulation of extracts obtained from red banana peel by spray drying, and the bioaccessibility in vitro of the microencapsulated bioactive compounds has not been evaluated. The present study aimed to extract and microencapsulate bioactive compounds from the red banana peel (Musa acuminata Colla) by spray drying using gum arabic (GA) and soy protein isolate (SPI) as encapsulating agents, and to evaluate the bioaccessibility of microencapsulated compounds using an in vitro digestion model.

2. Materials and Methods

2.1. Chemical and Reagents

1,1-diphenyl-2-picrylhydrazyl (DPPH); 2,2′-azino-bis-3-ethylbenzthiazoline-6-sulfonic acid (ABTS); 6-hydroxy-2,5,7,8-tetramethylchroman-2-carboxylic acid (Trolox), Folin–Ciocalteu reagent; gallic acid; catechin; pancreatin (8× USP); and porcine pepsin (≥250 U/mg protein) were acquired from Sigma-Aldrich Chemical Company (St. Louis, MO, USA). Soy protein isolate was obtained from Condimentos Naturales Tres villas, S.A. de C.V. (Mexico City, Mexico) and gum arabic from Agricurama S.P.R. de R.L. de C.V. (Mexico City, Mexico). All reagents were of analytical grade.

2.2. Samples

Red bananas were obtained from a local market (Milpa Alta’s market, Mexico City, Mexico). Fruits were obtained fully ripe, with no evident mechanical damage, pathogens or damage caused by insects.

2.3. Sample Preparation and Optimization of Extraction Conditions

Red banana peel (RBP) was removed manually and dried in a convection oven (Blue Lindberg V0914A, Thermo Scientific, Waltham, MA, USA) at 40–45 °C for 48 h and grounded to a fine powder. To determine the number of extractions needed to obtain more than 90% of the total phenolic content (TPC), four consecutive extractions were carried out with 1.5 g of banana peel powder in 15 mL ethanol–water 50%, at 30 °C, for 1 h each.
Then, the optimization of the extraction process was carried out with 1.5 g of peel powder in 15 mL in ethanol–water at 30, 50, and 70% (v/v) and 30, 40, and 50 °C to assess the effect of solvent concentration and temperature, using a multilevel factorial design 32 with replicates at all points. Variance analysis was performed using Minitab 18 (Minitab Inc., State College, PA, USA.). Once the best extraction conditions were obtained from the abovementioned factorial design, the extraction was carried out, for 15, 30, 45, 60, 90, and 120 min in triplicate, to evaluate the effect of extraction time on the TPC. The extracts were centrifuged at 2598× g for 10 min, filtered with a Whatman® filter paper #3 (6 µm) and stored in refrigeration until use.

2.4. Analytical Methods

2.4.1. Total Phenolic Content (TPC)

The TPC was determined based on a method described by González-Montelongo et al. [14]. Briefly, 40 μL of water, 10 μL of the sample, and 10 μL of Folin–Ciocalteu reagent were mixed. After 6 min, 100 μL of 7% sodium carbonate solution and 100 μL of water were added to the mixture, and it was left in the dark at room temperature for 1 h. The absorbance was read at 765 nm against a blank sample. Gallic acid was used as a standard to generate a calibration curve (0–1 mg/mL, n = 8, R2 = 0.991), and TPC was expressed as g of gallic acid equivalents/100 g red banana peel on a dry matter basis (g GAE/100 gDW).

2.4.2. Total Flavonoid Content (TFC)

The TFC was determined based on a method described by Herald et al. [20]. Briefly, 100 µL of distilled water was mixed with 10 µL of NaNO2 (50 g/L) and 25 µL of the sample. After 5 min, 15 µL de AlCl3 (100 g/L) was added to the mixture; 6 min later, 50 µL de NaOH (1 M) and 50 µL of distilled water were added. The samples were shaken for 30 s before absorbance measurement at 510 nm against a blank sample. Catechin was used as a standard to generate a calibration curve (0.01–0.7 mg/mL, n = 10, R2= 0.985), and TFC was expressed as g of catechin equivalents/100 g red banana peel on a dry matter basis (g CE/100 gDW).

2.4.3. Antioxidant Capacity (AC)

The ABTS radical cation inhibition activity was performed according to Toh et al. [15]. ABTS+ was produced by the reaction of ABTS 7 mM (5 mL) with potassium persulfate 140 mM (88 μL) in the dark at room temperature for 18 h. Before the assay, this solution (1 mL) was diluted in ethanol (90 mL) to obtain an absorbance of 0.70 ± 0.05 measured at 734 nm. A quantity of 10 μL of the sample was added to 200 μL of ABTS+. After 6 min, the absorbance was read at 734 nm against a blank sample. Trolox was used as a standard to generate a calibration curve (0–78 mg/mL, n = 8, R2 = 0.998) against % inhibition. Results were expressed as g of Trolox equivalents/100 g red banana peel on a dry matter basis (g TE/100 gDW). Percentage inhibition of the ABTS+ radical was calculated based on Equation (1):
%   Inhibition = Abs blank   at   min   0 Abs sample   at   min   6   Abs blank   at   min   0 × 100
where Abs: absorbance.
The DPPH radical scavenging activity was performed according to González-Montelongo et al. [14]. A quantity of 200 µL of a methanolic solution of DPPH (0.2 mM) was added to 5 μL of the sample. The absorbance was read at 515 nm after 30 min against a blank sample. Trolox was used as a standard to generate a calibration curve (0–83 mg/mL, n = 9, R2 = 0.998) against % inhibition. Results were expressed as g of Trolox equivalents/100 g red banana peel on a dry matter basis (g TE/100 gDW). Percentage inhibition of the DPPH radical was calculated based on Equation (2):
%   Inhibition = Abs blank   at   min   0 Abs sample   at   min   30   Abs blank   at   min   0 × 100
where Abs: absorbance.

2.5. Microencapsulation by Spray Drying

Microencapsulation was performed according to Boyano-Orozco et al. [7], who optimized the drying conditions for the maximum retention of phenolic compounds and antioxidant capacity of rambutan peel extract. Since red banana peel extract contains similar bioactive compounds, the optimal drying conditions of 160 °C inlet temperature and 60 °C outlet temperature using a GEA-NIRO MOBILE MINOR spray drier (Shanghai, China) were adopted. Red banana peel (RBP) extract was concentrated (5×) using a Rotavapor® (BUCHI R-300, Flawil, Switzerland) to increase the TPC and remove the ethanol completely to avoid wall material precipitation. A 30% w/w GA solution was prepared at 40 °C and left for 2 h in a vacuum oven (OV-12 Lab Companion, Seoul, Korea) at 40 °C to eliminate air bubbles. A quantity of 33.33 g of 30% w/w GA solution was mixed with 66.66 g of RBP concentrated extract to obtain a final concentration of 10% of GA in the solution to be dried (the quantities used were calculated with a mass balance).
For microencapsulation with soy protein isolate (SPI), 9% w/w SPI solution was prepared at 40 °C and pH 9 (adjusted with a 4 M NaOH solution) and was left to stand for 2 h in a vacuum oven (OV-12 Lab Companion, Seoul, Korea) at 40 °C to eliminate air bubbles. A quantity of 33.33 g of 9% w/w SPI solution was mixed with 77.77 g of RBP concentrated extract to obtain a final concentration of 7% of SPI in the solution to be dried (the quantities used were calculated with a mass balance).
Extract-GA solution was sprayed using a two-fluid nozzle in a spray dryer (GEA-NIRO Atomizer, Mobile Minor, Copenhagen, Denmark), and extract-SPI solution due to its high viscosity was sprayed using a rotary disc atomizer in a Niro Atomizer spray dryer (Mobile Minor MM, Copenhagen, Denmark). Both solutions were dried with inlet air temperature (Ti) of 170 °C and outlet air temperature (To) of 80 °C based on the conditions reported by Boyano-Orozco et al. [7]. A 10%w GA solution and a 7%w SPI solution without RBP extract were dried at the same drying conditions, to be used as a blank sample in the TPC, TFC, and AC determinations.

2.6. Characterization of the Microcapsules

2.6.1. Retention and Encapsulation Efficiency

The microcapsules obtained with GA and SPI were reconstituted at the same solids’ concentration and the same conditions as in the initial solution before spray drying (Section 2.5), i.e., for GA microcapsules, they were dissolved in water at 40 °C and SPI microcapsules were dissolved in water pH 9 at 40 °C and vortex mixed until complete dissolution. This procedure allowed the release of TPC into the solution to be quantified by analysis. TPC was determined in both solutions (reconstituted microcapsules and the initial solution before spray drying). Retention efficiency (%RE) was calculated based by Equation (3):
% RE = TPC reconstituted   microcapsules / g DW TPC initial   solution   before   spray   drying   / g DW × 100
To calculate encapsulation efficiency (%EE), TPC on the surface of the microcapsules was also determined. It was performed according to Robert et al. [21]. A quantity of 0.4 g of the microcapsules was vortex mixed with 4 mL of ethanol:methanol (1:1) for 1 min. The mixture was filtered and TPC was determined in the filtrated. Encapsulation efficiency was calculated based on Equation (4):
% EE = TPC reconstituted   microcapsules / g DW TPC surface   of   the   microcapsules / g DW TPC initial   solution   before   spray   drying / g DW × 100

2.6.2. Moisture Content and Water Activity (aw)

Moisture content was determined using a thermobalance (OHAUS MB200, Montville, NJ, USA), placing 0.5 g of the sample at 110 °C until no change in weight less than 0.01 g in 90 s was obtained. Water activity (aw) was measured using an AquaLab Cx-2 (Decagon, Pull-man, WA, USA). Both determinations were performed in triplicate.

2.6.3. Particle Size Distribution

Particle size and particle size distribution were obtained with a Malvern laser diffraction particle size analyzer (IM 026 2006 series, Malvern, UK) using a 100 mm lens. As dispersant fluid, hexane (REASOL) was used, and the equivalent spherical diameter (D[4,3]), and Sauter diameter (D[3,2]) were obtained.

2.6.4. Morphology of Microcapsules

Microcapsules were observed by scanning electron microscopy (SEM) (JSM-5800LV, Jeol, Peabody, MA, USA) operating at 5 kV. Microcapsules were fixed in double-faced adhesive tape stubs, coated with gold and, finally, observed using a 2500× magnification.

2.7. In Vitro Digestion

In vitro digestion was simulated following the methodology described by Minekus et al. [11] with some modifications. For each phase of digestion, a control (sample without enzymes) was prepared to differentiate the effects due to the presence of enzymes from those that may be caused by the chemical environment in the assay.
Since SPI is a protein concentrate and GA is a complex mixture of glycoproteins and polysaccharides mainly constituted by arabinose and galactose, which cannot be digested by α-amylase, the oral phase was adapted [22]. To simulate oral phase, the sample (1 mL extract or 1 g microcapsules) was mixed with 4 mL of simulated salivary fluid; then, the mixture was maintained at 37 ± 2 °C for 2 min. To simulate gastric phase, the sample (1 mL extract or 1 g microcapsules diluted in 4 mL of simulated salivary fluid) was mixed with 3.75 mL of simulated gastric fluid, 0.8 mL of porcine pepsin to reach 2000 U in the final mixture, 2.5 μL of CaCl2 (0.3 M), 0.1 mL of HCl (1 M) to reach pH 3, and 347 μL of Milli-Q water. The mixture was incubated for 2 h at 37 ± 2 °C. After, an aliquot was collected and immersed on ice for 10 min, then the pH was adjusted to 9 with NaOH (1 M) to stop enzymatic activity. The aliquot was centrifuged for 5 min at 21,100× g. The supernatant was used to determine TPC, TFC, and AC. To simulate small intestinal phase, 5 mL of gastric chyme was mixed with 3.75 mL of simulated intestinal fluid, 1.25 mL of pancreatin to reach 4000 U of trypsin activity in the final mixture, CaCl2 (0.3 M), 37.5 µL of NaOH (1 M) to reach pH 7, and 327.5 µL of Milli-Q water. The mixture was incubated for 2 h at 37 ± 2 °C. Since samples did not contain fat, bile was omitted, as its function is emulsification of fat for lipase action and of fatty acids absorption. After the intestinal phase, an aliquot was collected and immersed on ice for 10 min. The aliquot was centrifuged for 5 min at 21,100× g. The supernatant was used to determine TPC, TFC, and AC.
To evaluate the protecting effect of wall materials on the changes undergone by the TPC, TFC, and AC during in vitro digestion, the bioaccessibility index (BI) in each phase (gastric, intestinal) was calculated. Results were compared with a non-digested sample (free extract or microencapsulated extract). BI was calculated according to Equation (5):
BI = A B × 100
where A is the amount of each compound (TPC, TFC) or antioxidant capacity (ABTS, DPPH) quantified after each digestion phase (gastric, intestinal), and B is the amount of each compound (TPC, TFC) or antioxidant capacity (ABTS, DPPH) quantified in the undigested food matrix (unencapsulated extract or microencapsulated extract before digestion).

2.8. Statistical Analysis

The results are presented as the mean ± standard deviation. Minitab 18 software (Minitab Inc., State College, PA, USA) was used to perform the one-way analysis of variance (ANOVA) with a significance level of 0.05. The Tukey test was used to compare the means.

3. Results and Discussion

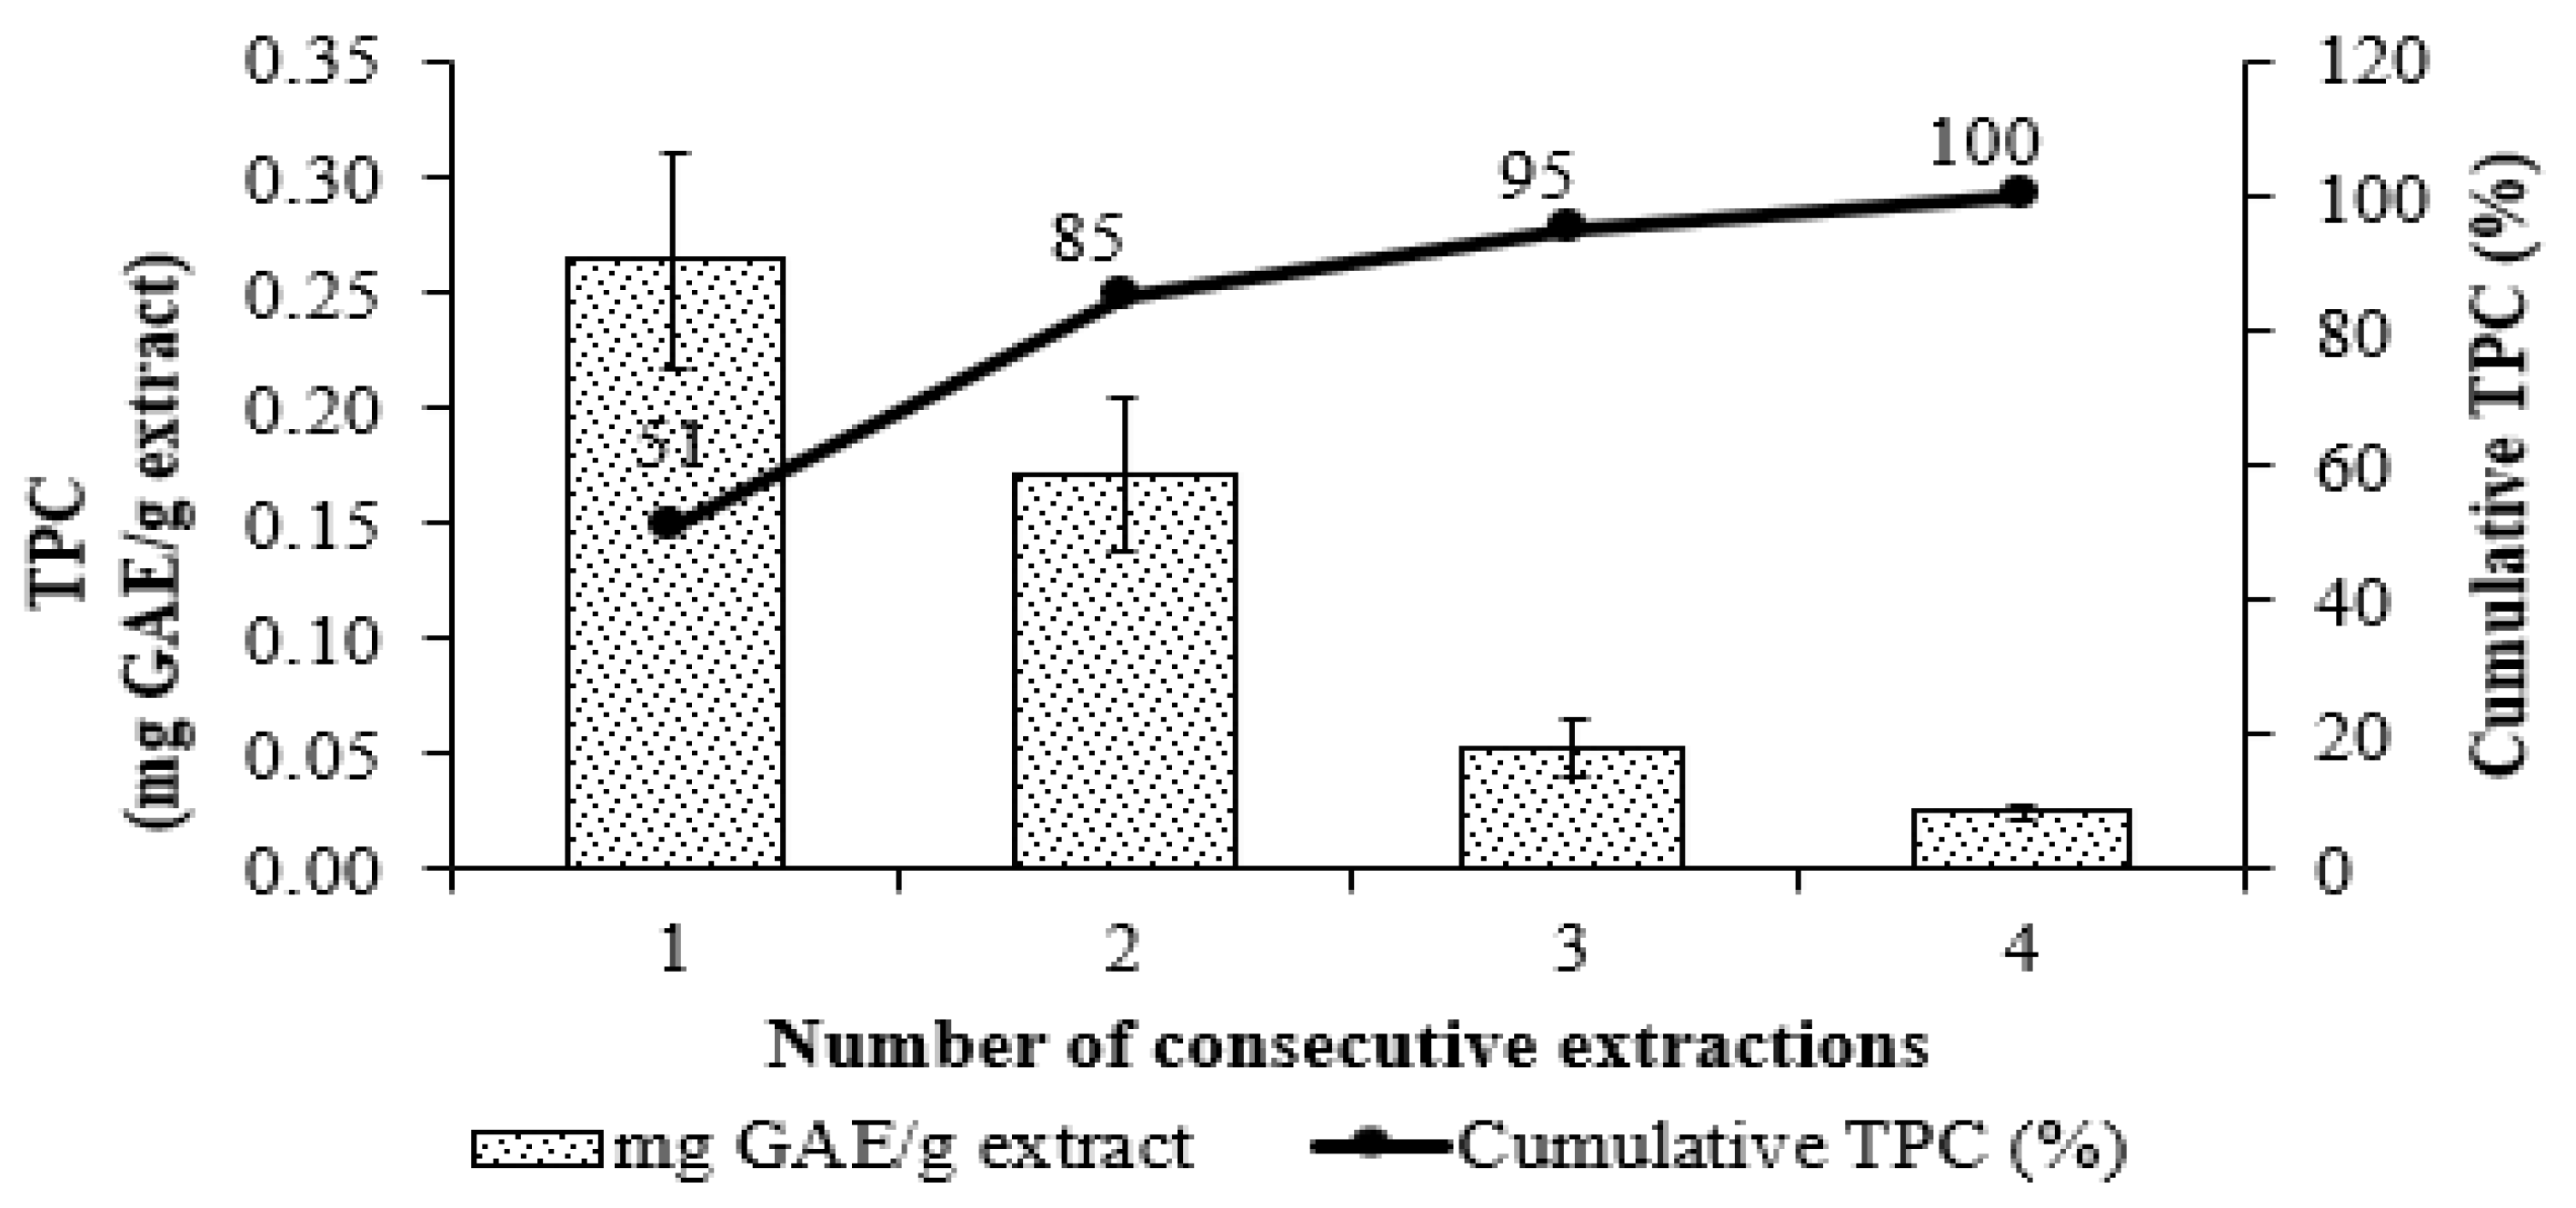
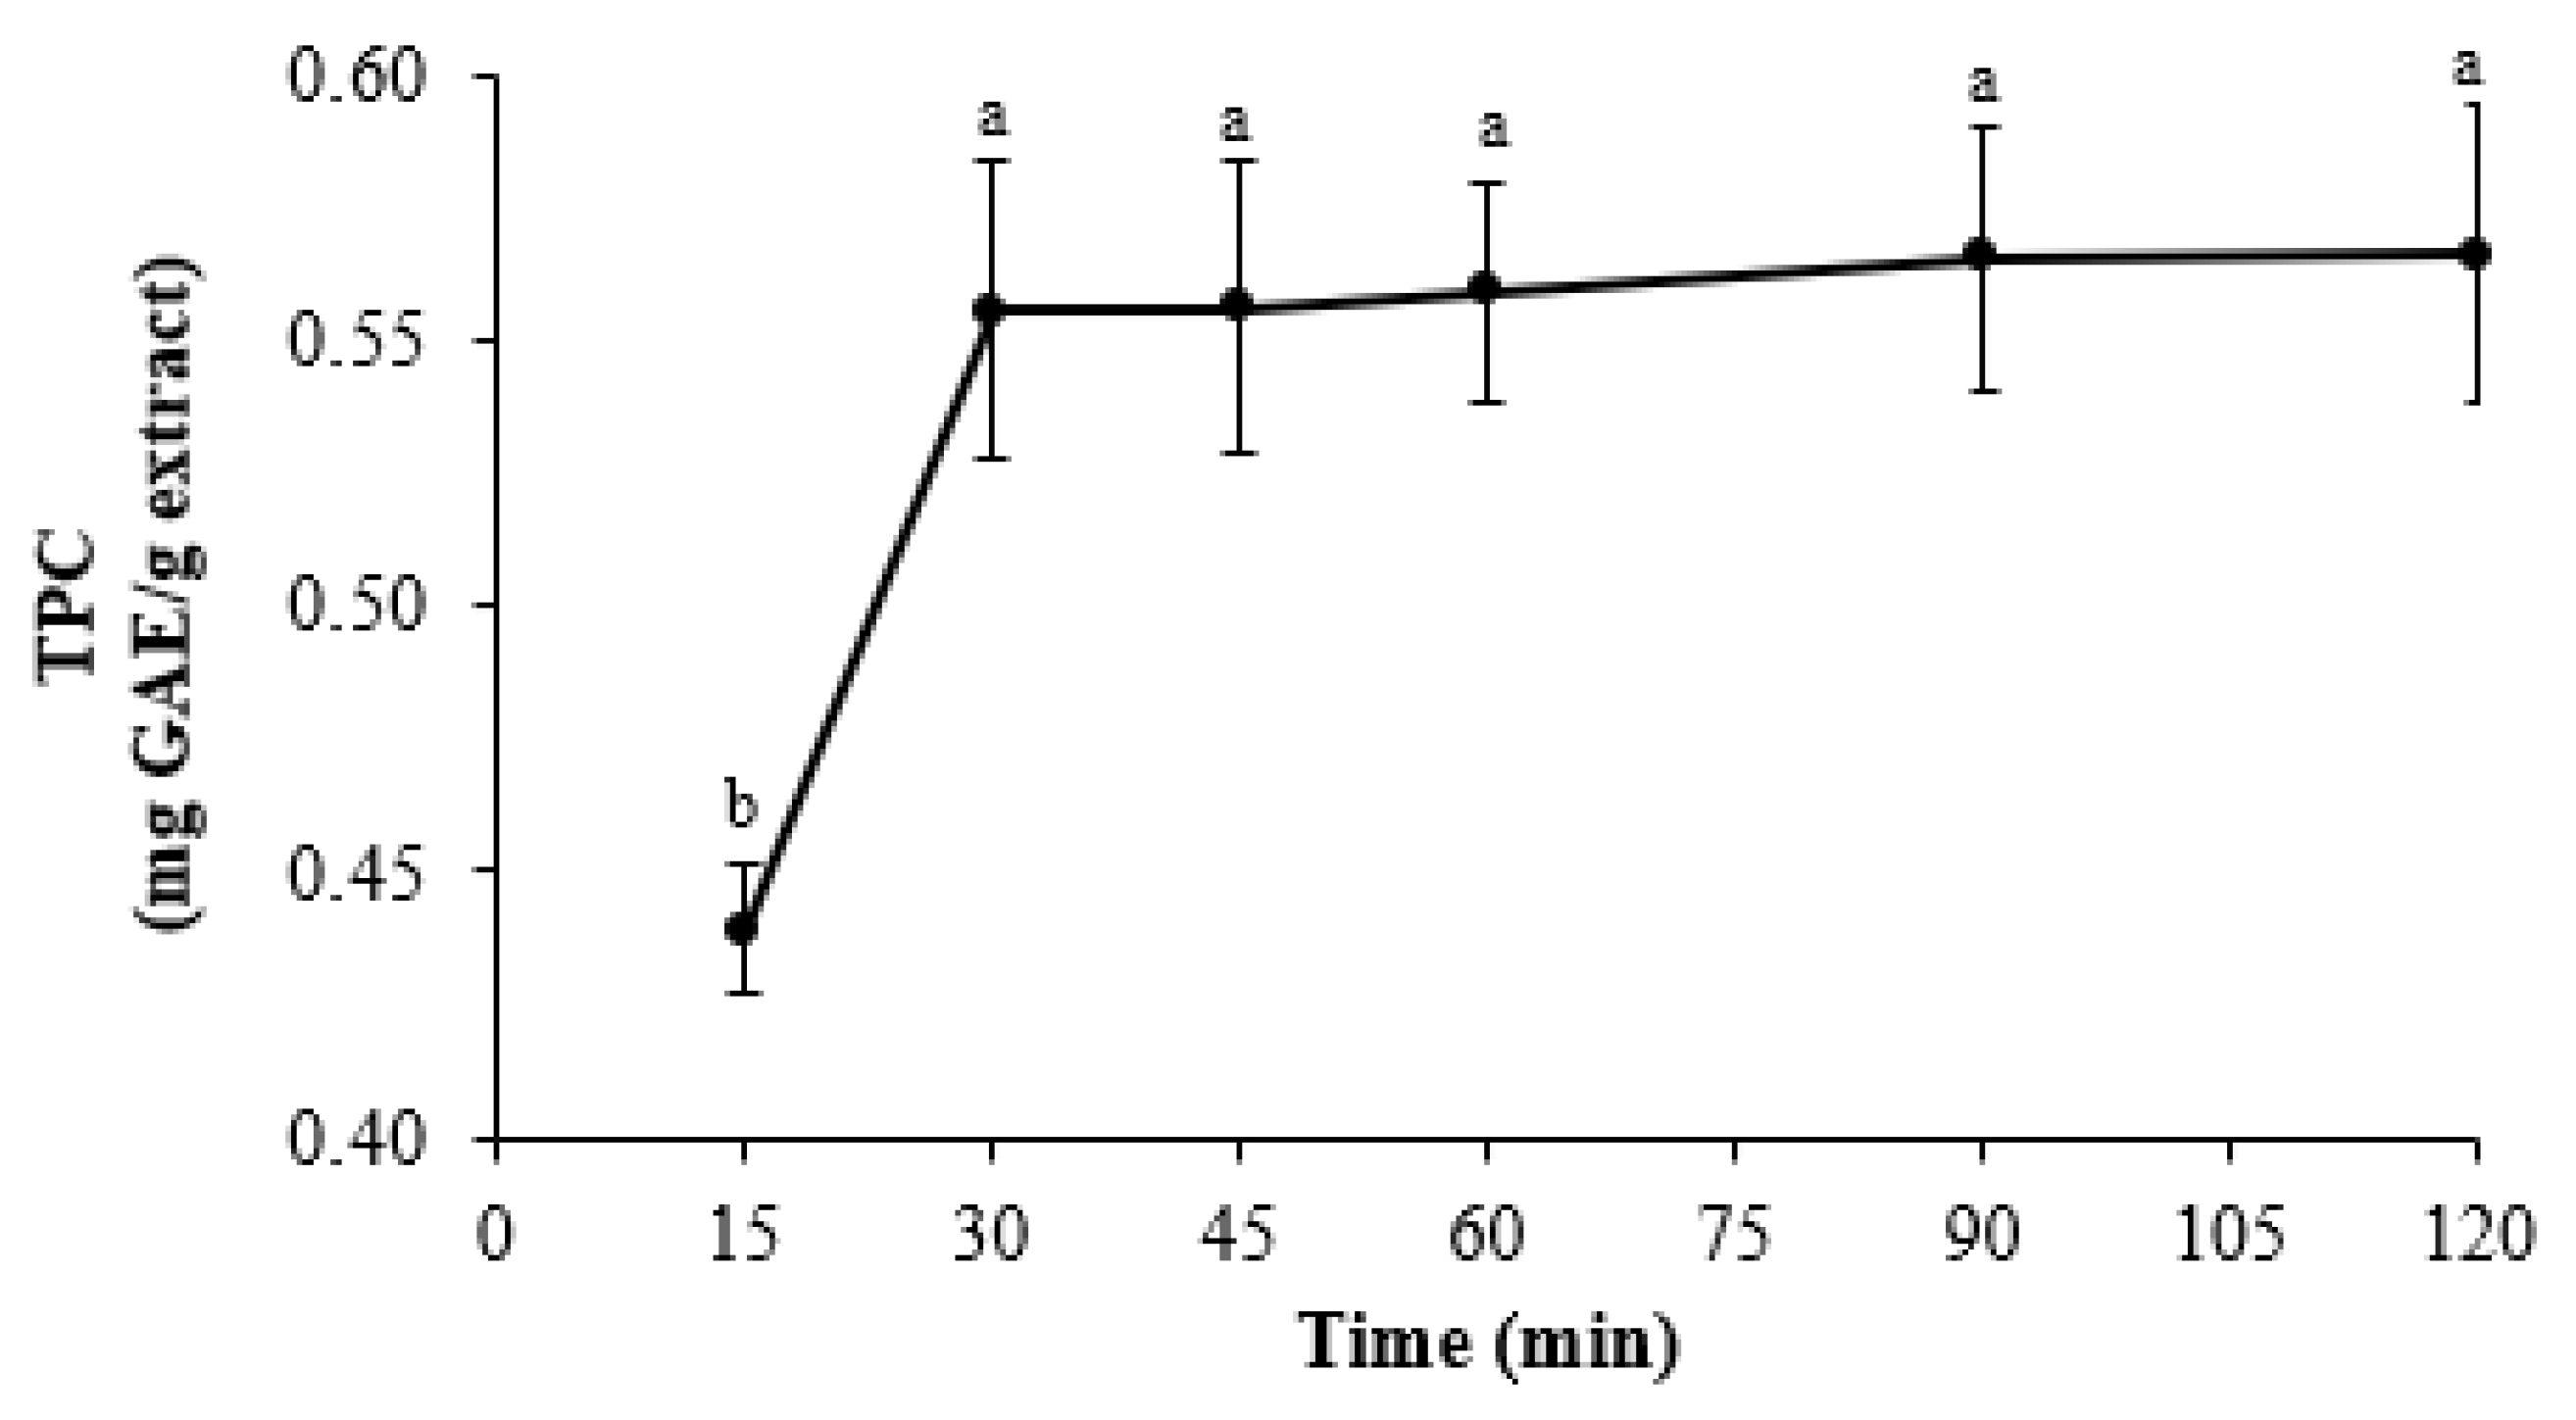
3.1. Optimization of Extraction Conditions for TPC

Four consecutive extractions were performed with 50% ethanol at 30 °C for 1 h based on the conditions described by González-Montelongo et al. [14] as mentioned in the Methodology section. A share of 95% of the TPC was obtained with three consecutive extractions (Figure 1). Therefore, it was decided to use three consecutive extractions for the next determinations.
Based on this result, three consecutive extractions were performed with 50% ethanol, at 30 °C, for 15, 30, 45, 60, 90, and 120 min. From 30 min to 120 min, no significant difference (p ≤ 0.05) was observed between the concentration of TPC (0.56 ± 0.003–0.57 ± 0.003 mg GAE/g extract) (Figure 2). Therefore, the extraction time was set to 30 min.
Finally, a factorial design 32 was performed, where the RBP extract was carried out using, as independent variables, temperature (30, 40, and 50 °C) and the solvent concentration (aqueous ethanol: 30, 50, and 70% v/v) (Figure 3). According to the ANOVA, no significant difference (p ≤ 0.05) was observed between temperature (p = 0.082) or ethanol concentration (p = 0.058) on TPC.
However, based on the optimization plot (Figure 4), the maximum value obtained was 0.5460 mg GAE/g extract at 40 °C and 50% ethanol; therefore, these conditions were chosen as the optimum extraction conditions.

3.2. Red Banana Peel Characterization

TPC in RBP obtained at optimum extraction conditions (three consecutive extractions with 50% EtOH at 40 °C for 30 min) was 0.55 ± 0.01 g GAE/100 gDW (equivalent to 0.5 mg GAE/mL extract) (Table 1). Since there are no reported works on red banana peel content of TPC and TFC, the results obtained were compared with the content of other banana peels reported by other authors, even though other solvents were used (water, aqueous methanol solutions). The TPC quantified in the red banana peel was higher than those reported by Hernández-Carranza et al. [23] (0.41 ± 0.009 g GAE/100 g peel) and Babbar et al. [24] (0.38 ± 0.024 g GAE/100 g peel) for yellow banana from Mexico and India, respectively. TFC obtained was 0.22 ± 0.02 g CE/100 gDW; this value is similar to that reported by Fatemeh et al. [25] for a Cavendish variety with 0.226 ± 0.009 g CE/100 gDW. The TPC and TFC obtained in the red banana peel show that is a better source of bioactive compounds than other banana peel varieties.
The RBP was able to scavenge free radicals such as ABTS and DPPH. A share of 84.9 ± 6.1% of the ABTS radical was inhibited (0.95 ± 0.07 g TE/100 gDW) (Table 1). This value was higher than that obtained in the yellow banana peel “Grande Naine” reported by Ortiz et al. [26], who obtained 0.85 ± 0.06 g TE/100 g BPDW. On the other hand, only an inhibition rate of 42.3 ± 3.7% of the DPPH radical was obtained (1.97 ± 0.14 g TE/100 gDW) (Table 1). This value is higher than those reported in the yellow banana peel. Ortiz et al. [26] reported 0.78 ± 0.01 g of TE/100 g BPDW for the “Grande Naine” variety, whereas Hernández-Carranza et al. [23] quantified 0.923 ± 0.008 g TE/100 g BPDW for a local Mexican yellow variety, and González-Montelongo et al. [14] reported 0.70 ± 0.08 g TE/100 g BPDW for the “Gruesa” variety.

3.3. Microencapsulation by Spray Drying

Microencapsulation with GA was performed with a GEA-Niro Atomizer spray drier using a two-fluid nozzle. The process had a yield of 78.26%. The microcapsules obtained were analyzed, and the TPC content was compared with that in the original solution to be dried (9.05 ± 0.2 mg GAE/gDW). Encapsulation efficiency of TPC was 98.3% (8.94 ± 0.05 mg GAE/gDW), and the retention efficiency was 98.8% (9.1 ± 0.1 mg GAE/gDW) (Figure 5).
Microencapsulation with SPI required different equipment (rotary disc in a Niro Atomizer spray dryer model Mobile Minor) than that used for microencapsulation with GA due to the SPI solution’s viscosity, as it promoted the obstruction of the GEA-Niro Atomizer dryer nozzle. The process had a lower yield (37.26%) than that obtained with GA due to SPI solution viscosity and stickiness. Jansen-Alves et al. [27] also reported lower yield when higher protein concentrations were used because of the sticky films formed by the proteins. The microcapsules obtained were analyzed, and the TPC was compared with that in the original solution to be dried (5.03 ± 0.5 mg GAE/gDW). The encapsulation efficiency was 97.9% (4.92 ± 0.3 mg GAE/g BPDW), and the retention efficiency was 98.2% (4.94 ± 0.5 mg GAE/g BPDW) (Figure 5). According to these results, most of the phenolic compounds retained were encapsulated with both wall materials. No statistical difference in retention efficiency was found between GA and SPI microcapsules.

3.4. Moisture Content and Water Activity (aw)

Moisture content and water activity (aw) are shown in Table 2. Microcapsules with gum arabic and soy protein isolate had a moisture content of 4.09 ± 0.18% and 4.14 ± 0.15%, respectively. No significant difference (p < 0.05) was observed. These results agreed with other studies [7,9] and the moisture content of the powders obtained is typical for spray dried products. Studies have reported that values between 1 and 6% are desirable to preserve the stability of microcapsules during their storage [28].
Microcapsules with gum arabic and soy protein isolate had values of aw of 0.33 ± 0.39 and 0.38 ± 0.53, respectively (Table 2). No significant difference (p < 0.05) was observed. These results agreed with other studies [7,9]. Several authors have reported that aw values below 0.6 indicate stability of a food product because of the low amount of free water available for biochemical reactions [29]. According to the low values of moisture content and aw of the encapsulated powders with gum arabic and soy protein isolate, good stability of these could be expected.

3.5. Particle Size Distribution and Morphology of Microcapsules

The particle size distribution of microcapsules obtained is shown in Figure 6 for both wall materials. As can be seen, particle size varied for both wall materials between 2 and 55 µm; nevertheless, the spread of particle distribution for SPI (Figure 6b) was wider than that for GA (Figure 6a), obtaining an equivalent sphere diameter (D[4,3]) of 18.37 μm and a Sauter diameter (D[3,2]) of 14.04 μm. For Ga, the equivalent sphere diameter (D[4,3]) was 14.1 μm and the Sauter diameter was (D[3,2]) 9.2 μm.
Regarding the particle shape of the microcapsules, images of the particle surface morphology obtained by SEM are shown in Figure 7. As it is shown in the micrographs obtained, both microcapsules presented a shrunk surface, which is due to the diffusion of water vapor out of the particles during drying; nevertheless, SPI microcapsules (Figure 7b) have a smoother surface and a more spherical shape than those obtained with GA (Figure 7a). This could be due to the difference in permeability to water vapor between the two wall materials; as SPI is less permeable, it is more difficult to release water vapor and some swelling occurs, producing less shrinking and a smoother surface. Broken or cracked particles are not appreciated, which is convenient for the protection of bioactive compounds.

3.6. In Vitro Digestion

The oral phase was not quantified because, structurally, GA is a complex heteropolysaccharide with a low protein content, with main and side chains linked by β-glycosidic bonds. Formulated digestive fluids usually contain α-amylases and α-glucosidases. Thus, in this case, GA is minimally digested. In contrast, SPI is a protein concentrate, which is digested at different rates in the upper gastrointestinal (gastric phase) and lower gastrointestinal (intestinal phase) tracts. Polypeptides are broken down into oligopeptides and are generally absorbed in the intestines [22].
Importantly, control digestions (sample without enzymes) showed similar results for TPC, TFC, ABTS and DPPH (data not shown), indicating that the observed effects were due to the enzymatic and pH conditions of the assay.
The bioaccessibility index (BI) of TPC, TFC and antioxidant capacity (ABTS, DPPH) are shown in Figure 8. BI of TPC in the unencapsulated extract was 58.91% (gastric phase) and 16.57% (intestinal phase) (Figure 8a). These results indicate a TPC degradation of 41.09% in the gastric phase, while, during the intestinal phase, 83.43% of the TPC was lost. According to Chen et al. [30], this loss is because phenolic compounds are sensitive to the simulated alkaline conditions during the intestinal phase. Correa-Betanzo et al. [31] also reported lower bioaccessibility of phenolic compounds after the digestion process because of the change in pH in the intestinal phase.
Similarly, in the unencapsulated extract, a significant decline in the TFC was observed (Figure 8b). BI was 59.84% (gastric phase) and 22.69% (intestinal phase). Phenolic compounds are mainly affected by chemical conditions as structural changes are induced by the ionization of hydroxyl groups [32]. The low percentage of bioaccessible compounds in the RBP extract is attributed to different factors, such as enzymes, pH and oxygen, and their interaction with other compounds during the in vitro digestion process.
Phenolic compounds and flavonoids bioaccessibility increased with the microencapsulation process. After the intestinal phase, BI of TPC was 53.87% and 56.82% in the microencapsulated extracts with GA and SPI, respectively (Figure 8a), and the BI of TFC was 61.75% and 55.73% in the microencapsulated extracts with GA and SPI, respectively (Figure 8b). Based on statistical analysis, there was no significant difference (p ≤ 0.05) between the wall materials used, indicating similar protection of phenolic compounds and flavonoids in microencapsulated extract with GA and SPI.
An increase in the intestinal phase of the digestion process was obtained, indicating that bioactive compounds are gradually released from microcapsules. During the gastric phase, this release is attributed to the low pH and pepsin, which promote a slow release of phenolic compounds and flavonoids attached to carbohydrates and proteins; while during the intestinal phase, these compounds increase because the polymeric matrices undergo structural modifications such as the breakage of glycosidic and peptide bonds by enzymatic hydrolysis, which allows the release of microencapsulated compounds [33,34]. Moreover, Flores et al. [22] indicate that GA is composed of the principal and lateral chains bound by β-glycosidic bonds, so it is minimally digested by enzymes in simulated digestive fluids with α-amylase and α-glucosidase, whereas proteins in SPI are digested at different rates in the gastrointestinal tract.
Both wall materials allow microcapsules to gradually release their content, preserving phenolic compounds and flavonoids from the in vitro digestion conditions. Thus, microencapsulated extract with GA or SPI would be more bioavailable than free extract and have beneficial health effects.
Regarding radical scavenging capacity of unencapsulated extract, a decrease after the intestinal phase was also observed. For ABTS, BI varied from 31.22% (gastric phase) to 7.05% (intestinal phase) (Figure 8c), whereas BI for DPPH varied from 88.03% (gastric phase) to 46.99% (intestinal phase) (Figure 8d). ABTS scavenging, which is related to hydrophilic, lipophilic and highly pigmented compounds, was more sensitive than DPPH radicals related to lipophilic compounds [35], which is probably due to a greater number of hydrophilic compounds than lipophilic compounds in RBP extract, due to the extraction with aqueous ethanol.
A significant difference (p ≤ 0.05) was observed between GA and SPI. For ABTS, BI with microencapsulated extract with GA varied from 38.01% (gastric phase) to 17.62% (intestinal phase), whereas microencapsulated extract with SPI was 5.99% (gastric phase) and 4.89% (intestinal phase) (Figure 8c). The loss of this antioxidant capacity between phases indicates the degradation of hydrophilic and lipophilic compounds, or their interaction with some other compounds, such as proteins, as SPI showed lower BI. The interaction with proteins from the SPI may keep these compounds in the SPI matrix, causing a slower release.
By comparison, for DPPH, BI with microencapsulated extract with GA varied from 21.87% (gastric phase) to 24.03% (intestinal phase), whereas microencapsulated extract with SPI was 63.79% (gastric phase) and 77.32% (intestinal phase) (Figure 8d). It shows that lipophilic compounds, which tend to degrade or interact with other compounds, are protected by SPI, since after the intestinal phase, a high BI was obtained. With GA, apparently the compounds remain bound to GA, showing practically the same low antioxidant capacity after both gastric and intestinal phases.
Bioaccessibility index observed with the RBP extract confirm the importance of protecting these bioactive compounds by microencapsulation during in vitro digestion to maintain the compounds’ highest concentration and, therefore, the highest antioxidant activity (See Supplementary material).
Microencapsulation of the bioactive compounds from red banana peel is an excellent option to extend its shelf life and present them in a powdered product that can be used as an ingredient rich in natural antioxidants for the food, pharmaceutical, and cosmetic industry. In the food and pharmaceutical industries, no applications of encapsulated red banana peel extract have been reported; however, microcapsules could be incorporated into food matrices (for example, yogurt or jellies, due to their healthy image and wide consumption), offered as food supplements, or included in cosmetic and personal care products such as shower and bath gels, lotions, and creams. Future studies (in vivo) are needed to confirm the biological activities of the powder.
Food applications of several microencapsulated phytochemicals are currently being investigated [7,36,37]. For example, microencapsulated rambutan (Nephelium lappaceum) peel extract is used to help prevent different diseases [7], microencapsulated polyunsaturated (ω-3) fish oils are used to fortify dairy products (yogurt, cheese), bread, cereals and animal food [36], and microencapsulated muicle (Justicia spicigera) extract has been used to fortify yogurt [37].

4. Conclusions

Spray drying microencapsulation of RBP with GA and SPI showed high retention and encapsulation percentages, indicating that both wall materials effectively protect RBP bioactive compounds. After in vitro digestion, microencapsulated extract with GA and SPI showed higher bioaccesibility for TPC, TFC, ABTS and DPPH than in the digested unencapsulated extract, indicating that GA and SPI have good protective properties against in vitro digestion. Based on this, microcapsules obtained from red banana peel (Musa acuminata Colla) may be used in the food industry as a potential ingredient to develop functional food to promote health benefits. However, further work is required, such as in vivo experiments, to assess the protective properties of bioactive compounds by wall materials, and the effect of the bioactive compounds microencapsulated from RBP on human health.

Supplementary Materials

The following are available online at https://www.mdpi.com/article/10.3390/pr10040768/s1, Table S1: Content of phenolic compounds.

Author Contributions

Conceptualization, M.R.D., O.G.M.-M. and G.O.-R.; Methodology, M.R.D., O.G.M.-M. and G.O.-R.; Formal Analysis, M.R.D., O.G.M.-M., G.O.-R., T.G.-V., D.I.T.-M. and O.A.R.-M.; Investigation, M.R.D., O.G.M.-M. and G.O.-R.; Resources, O.G.M.-M. and G.O.-R.; Writing—Original Draft Preparation, M.R.D., O.G.M.-M. and G.O.-R.; Writing—Review and Editing, O.G.M.-M. and G.O.-R.; Visualization, O.G.M.-M., G.O.-R., T.G-V., D.I.T.-M. and O.A.R.-M.; Supervision, O.G.M.-M. and G.O.-R.; Project Administration, O.G.M.-M. and G.O.-R.; Funding Acquisition, O.G.M.-M. and G.O.-R. All authors have read and agreed to the published version of the manuscript.

Funding

Authors thank the Instituto Politécnico Nacional for the financial support through the project SIP-20190034. M.R.-D. wishes to express her gratitude to Consejo Nacional de Ciencia y Tecnología (CONACyT) for the scholarship provided.

Institutional Review Board Statement

Not applicable.

Informed Consent Statement

Not applicable.

Data Availability Statement

Data used to support the findings of this study can be requested from correspondence author.

Acknowledgments

The authors wish to express their gratitude to Escuela Nacional de Ciencias Biológicas-Instituto Politécnico Nacional (ENCB-IPN) for providing the financial support for the present study.

Conflicts of Interest

The authors declare no conflict of interest.

References

  1. Neto, J.J.L.; de Almeida, T.S.; de Medeiros, J.L.; Vieira, L.R.; Moreira, T.B.; Maia, A.L.V.; Ribeiro, P.R.V.; Brito, E.S.; Farias, D.F.; Calvalho, A.F.U. Impact of bioaccessibility and bioavailability of phenolic compounds in biological systems upon the antioxidant activity of the ethanolic extract of Triplaris gardneriana seeds. Biomed. Pharm. 2017, 88, 999–1007. [Google Scholar] [CrossRef] [PubMed]
  2. Passo Tsamo, C.V.; Herent, M.F.; Tomekpe, K.; Happi Emaga, T.; Quetin-Leclercq, J.; Rogez, H.; Larondelle, Y.; Andre, C. Phenolic profiling in the pulp and peel of nine plantain cultivars (Musa sp.). Food Chem. 2015, 167, 197–204. [Google Scholar] [CrossRef] [PubMed]
  3. Peanparkdee, M.; Iwamoto, S. Bioactive compounds from by-products of rice cultivation and rice processing: Extraction and application in the food and pharmaceutical industries. Trends Food Sci. Technol. 2019, 86, 109–117. [Google Scholar] [CrossRef]
  4. Theagarajan, R.; Malur Narayanaswamy, L.; Dutta, S.; Moses, J.A.; Chinnaswamy, A. Valorisation of grape pomace (cv. Muscat) for development of functional cookies. Int. J. Food Sci. Technol. 2019, 54, 1299–1305. [Google Scholar] [CrossRef]
  5. Amyrgialaki, E.; Makris, D.; Mauromoustakos, A.; Kefalas, P. Optimisation of the extraction of pomegranate (Punica granatum) husk phenolics using water/ethanol solvent systems and response surface methodology. Ind. Crops Prod. 2014, 59, 216–222. [Google Scholar] [CrossRef]
  6. Ismail, T.; Sestili, P.; Akhtar, S. Pomegranate peel and fruit extracts: A review of potential anti-inflammatory and anti-infective effects. J. Ethnopharmacol. 2012, 28, 397–405. [Google Scholar] [CrossRef]
  7. Boyano-Orozco, L.; Gallardo-Velázquez, T.; Meza-Márquez, O.G.; Osorio-Revilla, G. Microencapsulation of rambutan peel extract by spray drying. Foods 2020, 9, 899. [Google Scholar] [CrossRef]
  8. Toledo-Madrid, K.; Gallardo-Velázquez, T.; Osorio-Revilla, G. Microencapsulation of Purple Cactus Pear Fruit (Opuntia Ficus Indica) Extract by the Combined Method W/O/W Double Emulsion-Spray Drying and Conventional Spray Drying: A Comparative Study. Processes 2018, 6, 189. [Google Scholar] [CrossRef] [Green Version]
  9. Aguilera-Chávez, S.L.; Gallardo-Velázquez, T.; Meza-Márquez, O.G.; Osorio-Revilla, G. Spray drying and spout-fluid bed drying microencapsulation of Mexican plum fruit (Spondias purpurea L.) extract and its effect on in vitro gastrointestinal bioaccessibility. Appl. Sci. 2022, 12, 2213. [Google Scholar] [CrossRef]
  10. Fang, Z.; Bhandari, B. Spray drying, freeze drying, and related processes for food ingredient and nutraceutical encapsulation. In Encapsulation Technologies and Delivery Systems for Food Ingredients and Nutraceuticals; Garti, N., McClements, D.J., Eds.; WP Woodhead Publishing: Oxford, UK, 2012; pp. 73–109. [Google Scholar]
  11. Minekus, M.; Alminger, M.; Alvito, P.; Balance, S.; Bohn, T.; Bourlieu, C.; Carrière, F.; Boutrou, R.; Corredig, M.; Dupont, D.; et al. A standardised static in vitro digestion method suitable for food-an international consensus. Food Funct. 2014, 5, 1113–1124. [Google Scholar] [CrossRef] [Green Version]
  12. Babbar, N.; Oberoi, H.S. Potential of agro-residues as sources of bioactive compounds. In Biotransformation of Waste Biomass into High Value Biochemicals; Brar, S., Dhillon, G.S.C., Eds.; Springer: New York, NY, USA, 2014; pp. 261–295. [Google Scholar]
  13. Blasco, G.; Gómez, F.J. Propiedades funcionales del plátano (Musa sp). Rev. Med. Univ. Ver. 2014, 14, 22–26. [Google Scholar]
  14. González-Montelongo, R.; Gloria, L.M.; González, M. Antioxidant activity in banana peel extracts: Testing extraction conditions and related bioactive compounds. Food Chem. 2010, 119, 1030–1039. [Google Scholar] [CrossRef]
  15. Toh, P.Y.; Leong, F.S.; Chang, S.K.; Khoo, H.E.; Yim, H.S. Optimization of extraction parameters on the antioxidant properties of banana waste. Acta Sci. Pol. Technol. Aliment. 2016, 15, 65–78. [Google Scholar] [CrossRef]
  16. Navghare, V.V.; Dhawale, S.C. In vitro antioxidant, hypoglycemic, and oral glucose tolerance test of banana peels. Alex. J. Med. 2017, 53, 237–243. [Google Scholar] [CrossRef] [Green Version]
  17. Baskar, R.; Shrisakthi, S.; Sathyapriya, B.; Shyampriya, R.; Nithya, R.; Poongodi, P. Antioxidant Potential of Peel Extracts of Banana Varieties (Musa sapientum). Food Nutr. Sci. 2011, 2, 1128–1133. [Google Scholar]
  18. Mathew, N.S.; Negi, P.S. Traditional uses, phytochemistry and pharmacology of wild banana (Musa acuminata Colla): A review. J. Ethnopharmacol. 2017, 196, 124–140. [Google Scholar] [CrossRef]
  19. Singh, B.; Singh, J.P.; Kaur, A.; Singh, N. Bioactive compounds in banana and their associated health benefits—A review. Food Chem. 2016, 206, 1–11. [Google Scholar] [CrossRef]
  20. Herald, T.J.; Gadgil, P.; Tilley, M. High-throughput microplate assays for screening flavonoid content and DPPH-scavenging activity in sorghum bran and flour. J. Sci. Food Agric. 2012, 92, 2326–2331. [Google Scholar] [CrossRef]
  21. Robert, P.; Gorena, T.; Romero, N.; Sepulveda, E.; Chavez, J.; Saenz, C. Encapsulation of polyphenols and anthocyanins from pomegranate (Punica granatum) by spray drying. Int. J. Food Sci. Technol. 2010, 45, 1386–1394. [Google Scholar] [CrossRef]
  22. Flores, F.P.; Singh, R.K.; Kerr, W.L.; Pegg, R.B.; Kong, F. Total phenolics content and antioxidant capacities of microencapsulated blueberry anthocyanins during in vitro digestion. Food Chem. 2014, 153, 272–278. [Google Scholar] [CrossRef]
  23. Hernández-Carranza, P.; Ávila-Sosa, R.; Guerrero-Beltrán, J.A. Optimization of antioxidant compounds extraction from fruit by-products: Apple pomace, orange and banana peel. J. Food Process Preserv. 2016, 40, 103–115. [Google Scholar] [CrossRef]
  24. Babbar, N.; Oberoi, H.S.; Uppal, D.S.; Patil, R.T. Total phenolic content and antioxidant capacity of extracts obtained from six important fruit residues. Food Res. Int. 2011, 44, 391–396. [Google Scholar] [CrossRef]
  25. Fatemeh, S.R.; Saifullah, R.; Abbas, F.M.A.; Azhar, M.E. Total phenolics, flavonoids, and antioxidant activity of banana pulp and peel flours: Influence of variety and stage of ripeness. Int. Food Res. J. 2012, 19, 1041–1046. [Google Scholar]
  26. Ortiz, L.; Dorta, E.; Gloria Lobo, M.; González-Mendoza, L.A.; Díaz, C.; González, M. Use of banana (Musa acuminata Colla AAA) Peel Extract as an antioxidant source in orange juices. Plant Foods Hum. Nutr. 2017, 72, 60–66. [Google Scholar] [CrossRef]
  27. Jansen-Alves, C.; Fernandes, K.F.; Crizel-Cardozo, M.M.; Krumreich, F.D.; Borges, C.D.; Zambiazi, R.C. Microencapsulation of Propolis in Protein Matrix Using Spray Drying for Application in Food Systems. Food Bioprocess Technol. 2018, 11, 1422–1436. [Google Scholar] [CrossRef]
  28. Zhang, J.; Zhang, C.; Chen, X.; Quek, Y.S. Effect of spray drying on phenolic compounds of cranberry juice and their stability during storage. J. Food Eng. 2020, 269, 109744–109754. [Google Scholar] [CrossRef]
  29. Eroglu, E.; Tontul, İ.; Topuz, A. Optimization of aqueous extraction and spray drying conditions for efficient processing of hibiscus blended rosehip tea powder. J. Food Processing Preserv. 2018, 42, 13643–13650. [Google Scholar] [CrossRef]
  30. Chen, G.L.; Chen, S.G.; Zhao, Y.Y. Total phenolic contents of 33 fruits and their antioxidant capacities before and after in vitro digestion. Ind. Crops Prod. 2014, 57, 150–157. [Google Scholar] [CrossRef]
  31. Correa-Betanzo, J.; Allen-Vercoe, E.; McDonald, J.; Schroeter, K.; Corredig, M.; Paliyath, G. Stability and biological activity of wild blueberry (Vaccinium angustifolium) polyphenols during simulated in vitro gastrointestinal digestion. Food Chem. 2014, 165, 522–531. [Google Scholar] [CrossRef]
  32. Tagliazucchi, D.; Verzelloni, E.; Bertolini, D.; Conte, A. In vitro bio-accessibility and antioxidant activity of grape polyphenols. Food Chem. 2010, 120, 599–606. [Google Scholar] [CrossRef]
  33. Qin, Y.; Wang, L.; Liu, Y.; Zhang, Q.; Li, Y.; Wu, Z. Release of phenolic compounds from Rubus idaeus L. dried fruits and seeds during simulated in vitro digestion and their bioactivities. J. Funct. Foods 2018, 46, 57–65. [Google Scholar] [CrossRef]
  34. Ruiz Canizales, J.; Heredia, J.B.; Domínguez Avila, J.A.; Madera Santana, T.J.; Villegas Ochoa, M.A.; Robles Sánchez, R.M.; González Aguilar, G.A. Microencapsulation of blue maize (Zea mays L.) polyphenols in two matrices: Their stability during storage and in vitro digestion release. Food Meas. 2018, 13, 892–900. [Google Scholar] [CrossRef]
  35. Floegel, A.; Kim, D.-O.; Chung, S.-J.; Koo, S.I.; Chun, O.K. Comparison of ABTS/DPPH assays to measure antioxidant capacity in popular antioxidant-rich US foods. J. Food Compos. Anal. 2011, 24, 1043–1048. [Google Scholar] [CrossRef]
  36. Hermida, L.G.; Gallardo, G. Food applications of microencapsulated omega-3 oils. In Microencapsulation and Microspheres for Food Applications; Sagis, L., Ed.; Academic Press: Oxford, UK, 2015; pp. 271–299. [Google Scholar]
  37. Castro-Alatorre, N.C.; Gallardo-Velázquez, T.; Boyano-Orozco, L.C.; Téllez-Medina, D.I.; Meza-Márquez, O.G.; Osorio-Revilla, G. Extraction and Microencapsulation of Bioactive Compounds from Muicle (Justicia spicigera) and Their Use in the Formulation of Functional Foods. Foods 2021, 10, 1747. [Google Scholar] [CrossRef]
Figure 1. Total phenolic content (mg GAE/g extract) in the RBP extracts and cumulative percentage of total phenolic content in the consecutive extractions.
Processes 10 00768 g001
Figure 2. Total phenolic content (mg GAE/g extract) in the RBP extract at different extraction times. Different letters indicate significant differences (p ≤ 0.05).
Processes 10 00768 g002
Figure 3. Total phenolic content (mg GAE/g extract) in the RBP extract at different temperatures and solvent concentrations. Same letters are not significantly different (p ≤ 0.05).
Processes 10 00768 g003
Figure 4. Optimization plot for total phenolic content (mg GAE/g extract) in the RBP extract at three temperatures (30, 40, and 50 °C) and three solvent concentrations (30, 50, and 70% v/v).
Processes 10 00768 g004
Figure 5. Retention and encapsulation efficiency of phenolic compounds (%) in the RBP microcapsules with gum arabic and soy protein isolate.
Processes 10 00768 g005
Figure 6. Particle size distribution of the microcapsules obtained with: (a) GA as wall material and (b) SPI as wall material.
Processes 10 00768 g006
Figure 7. Images of microcapsules of red banana peel extract microencapsulated by spray drying with: (a) GA and (b) SPI. All at 5 kV and 2500× magnification.
Processes 10 00768 g007
Figure 8. Bioaccessibility index (BI) after in vitro digestion: (a) total phenolic content (TPC); (b) total flavonoid content (TFC); (c) ABTS; (d) DPPH. Uppercase letters indicate significant differences (p ≤ 0.05) between unencapsulated extract or microencapsulated extract after gastric phase. Lowercase letters indicate significant differences (p ≤ 0.05) between unencapsulated extract or microencapsulated extract after the intestinal phase.
Processes 10 00768 g008
Table 1. Characterization of the red banana peel.
ParameterContent
TPC (g GAE/100 gDW)0.55 ± 0.01
TFC (g CE/100 gDW)0.22 ± 0.02
ABTS (g TE/100 gDW)0.95 ± 0.07
DPPH (g TE/100 gDW)1.97 ± 0.14
Moisture content (%)3.51
Results are expressed as the mean ± standard deviation, n = 3. TPC: Total phenolic content. TFC: Total flavonoid content.
Table 2. Moisture content (%) and water activity (aw) of microcapsules with gum arabic and soy protein isolate.
Encapsulated PowdersMoisture Content (%)Water Activity (aw)
Microcapsules with gum arabic4.09 ± 0.18 a0.33 ± 0.39 a
Microcapsules with soy protein isolate4.14 ± 0.15 a0.38 ± 0.53 a
Results are expressed as the mean ± standard deviation, n = 3. Different letters per column indicate significant difference (p ≤ 0.05).
Publisher’s Note: MDPI stays neutral with regard to jurisdictional claims in published maps and institutional affiliations.

