Abstract
This article presents the creation of bathymetric cartography for San Andrés, Providencia, Santa Catalina, and the Colombian Caribbean to find suitable areas for implementing an ocean thermal energy conversion (OTEC) system. The methodology to obtain the bathymetry uses data collection, digitization, and interpolation. The data are processed using the Surfer® software; in this way, the digital terrain model (DTM) maps are generated for each sector. The objective is to find the minimum distance to reach a depth of 1000 m since this is the distance where a temperature difference of 20 C is obtained. Thus, it is possible to identify suitable areas to locate an onshore or offshore plant in Santa Marta, Barranquilla, southwestern and northwestern San Andrés, the western part of Santa Catalina, and the southwestern part of Providencia.
1. Introduction
In the last century, the quality of life has had a remarkable improvement thanks to industrialization, primarily due to the invention and exploitation of new energy sources [1]. As an energy source, electricity is essential for the use of modern technologies. Therefore, it can be said that electricity consumption per capita is directly proportional to the economic development of a country; in this sense, it can be inferred that the population of a country has a better quality of life due to more electricity consumption [2,3]. The primary reason is that electricity improves the safety of cities, and provides means for new forms of education and entertainment, among others [4]. Furthermore, a constant electricity supply is necessary to achieve economic growth [5] because all companies, whether manufacturing products or providing services, require the conversion of matter or energy, and for this purpose, it is necessary to use energy [6].
Both the generation and consumption of electricity must be carried out in a sustainable way to avoid harm to the environment and society [7,8]. On the one hand, a sustainable electricity supply requires long-term availability, which allows current demands to be sustained without jeopardizing the energy supply of future generations. However, on the other hand, the generation of electricity has traditionally involved the generation of greenhouse gases, contributing to global warming and climate change, which is directly related to health problems in the population and may cause floods or droughts, destruction of biodiversity, and put food generation systems at risk, to mention just a few concerns [6,9].
The electrical system in the Colombian Caribbean is characterized by being of low quality and intermittent. In the cases of San Andrés, Providencia, and Santa Catalina, electricity is obtained through fossil fuel plants. One of the causes of poor electricity generation is the government and the private sector’s lack of necessary investment to maintain an optimal generation and distribution system. As a result, it has been very complex to have a transformation path to renewable energies in the energy matrix. The Colombian Caribbean’s electrical network can only guarantee the availability of less than 80% of the supply per year. July–August and December–January are the months with the most intermittence due to the increase in tourism [10]. Current Colombia government policies aim to increase its electricity supply from renewable sources. Currently, the energy matrix depends mainly on hydroelectric power (70%). The other sources are divided into thermal (27%) and the rest in renewable energies, solar being the most used.
An unconventional renewable energy source is obtained through the thermal gradient of the sea. These systems are called Ocean Thermal Energy Conversion Systems (OTEC). The great advantage of this energy is that its supply is continuous, and the volume of raw material is substantial [11]. On the other hand, its most significant problem is the high implementation costs and low efficiency. Developing this technology nowadays is challenging due to affordable fossil fuels, making it difficult to compete at the level of electricity production costs since every OTEC project has a high financial cost. However, considering that fossil fuels are finite and the increasing necessity to have a clean energy supply, the government needs to support the development of OTEC systems. Therefore, it is appropriate to propose the development of an OTEC generation system for the Colombian Caribbean since the location in the tropics allows obtaining a temperature difference of at least 20 C between the surface and 1000 m-depth all year round, as discussed in Section 3.1.
Site selection is an essential factor in OTEC planning. Many studies have analyzed one or some of the factors involved in the selection of the sites, including energy resource factors using frequency and harmony analysis [12], assessment of the temperature, and/or bathymetric gradients [13,14]. Other studies consider an integrative approach, including the evaluation of the thermal power potential, sea surface temperature, assessment of feasibility, environmental and socioeconomic criteria, multicriteria decision analysis [15,16], and sensitivity analysis to select optimal sites [17].
This work presents a preliminary localization of an OTEC system based on the bathymetry for the Colombian Caribbean, San Andres, and Santa Catalina. The main objective for the location is to reduce the pipes’ route and civil engineering works as much as possible. In addition, the main aim is to contribute to the knowledge and possible limitations of implementing an OTEC system in the Colombian Caribbean.
The paper is organized as follows. Section two presents the problem formulation where a brief description of the OTEC system and bathymetry in the Colombian Caribbean is presented. The third Section presents the methodology to perform bathymetry, and the fourth Section exposes the possibilities location of OTEC systems. Finally, the major conclusions are presented in the fifth Section.
2. Problem Formulation
This section presents a brief description of an OTEC system and a synthesis of bathymetry in the Colombian Caribbean.
2.1. OTEC Systems
Obtaining electrical energy from ocean thermal energy is based on the Rankine cycle [18], in which the vapor of a liquid is used to move a turbine. At a practical level, in an OTEC system, a liquid is heated using the surface water through a heat exchanger, followed by cooling the steam in the deep waters of the sea, restarting the generation cycle. It should be noted that an essential factor is the temperature differential, which should be approximately 20 C. Both closed and open cycles are at the implementation level, including hybrid cycles.
2.1.1. Types of OTEC Plants
An open-loop OTEC system uses a vacuum (air or other gases pressure are close to zero) for its operation. The low-pressure water vapor has a high specific volume, a fact that makes the open-cycle OTEC system need a large flow area to reduce the speed of the steam [19,20]. An advantage of this cycle is that it can generate desalinated water as a subproduct. A closed-cycle OTEC system uses a coolant that is heated by surface water passing through the turbine and then cooled by taking advantage of the low temperatures found in deep water [21]. This system is cheaper to implement but does not generate desalinated water. Finally, a hybrid cycle OTEC system combines both the characteristics of a closed cycle and an open cycle; hot seawater evaporated in a vacuum chamber. This water vapor, in turn, evaporates a refrigerant, which then expands in the turbine. The main advantage of the hybrid cycle is that the vaporized water is condensed in a heat exchanger and can produce desalinated water [22].
2.1.2. Location of an OTEC System
An OTEC system can be located on land (onshore) or at sea (offshore). An onshore location has the advantage of lower civil infrastructure costs, and the operation and maintenance of the system are easier to carry out. Strategies can be implemented to avoid damage caused by storms. Finally, given its location, electricity and water generated are more easily distributed [23]. On the other hand, the most significant disadvantage of an onshore implementation is to achieve a temperature differential more outstanding than 20 C since it is required to access depths close to 1000 m, which means that depending on the topology of the land, an extensive infrastructure is needed to transport water [24,25].
An offshore OTEC system is recommended to be installed at a maximum depth of 100 m.
An offshore OTEC system can be moored with systems reaching 1000 m, and some are even floating. In this way, enormous civil works costs are avoided in the installation and the harmful waves are avoided. Finally, depending on the land topology, it could be closer to 1000 m-deep [26]. However, the disadvantage of an offshore installation is that power cables are required for the distribution of the energy produced to reach the electricity distribution network [27]. Furthermore, in the case of an open or hybrid system, bringing desalinated water requires transport from the plant to the coast, increasing operating costs [25].
Bathymetry or cartography of the seabed is a topographic survey of the relief of the seabed surface. The knowledge of this relief allows for making decisions when locating an OTEC system since these systems generally need to access a depth of 1000 m to obtain the necessary thermal gradient. The following are the variables of the bathymetric study:
- is the distance from the coast to reach 1000 m-depth;
- is the size of the marine platform, and it is the distance from the coast to where the platform break is generated;
- is the depth where the platform break starts;
- is the distance from the beginning of the break of the platform until reaching a depth of 1000 m.
In this way, it is possible to identify which is the best location to reduce, on the one hand, the implementation costs associated with the construction of the platform; on the other hand, knowing the slopes and the break of the platform, it is possible to have optimal locations that reduce the flow of water, thus increasing efficiency. In the case of onshore installations, it is essential to know the travel distance to reach a depth of 1000 m. In the case of offshore installations, the installation can generally be built near the break of the platform (if there is a steep slope) or floating near 1000 m-depth. In this way, it is also necessary to know the depth in this location and the distance until it reaches 1000 m.
2.2. Bathymetry in the Colombian Caribbean
There is a wide variety of bathymetric information on the Colombian Caribbean and the insular zone. However, it is not possible to find a bathymetry that allows the location of OTEC systems. Therefore, some studies carried out on the bathymetry of the Colombian Caribbean are presented below.
The Colombian platform is located on the Colombian Coast with a width of approximately 900 km and depth of 200 m [28]. In [29], six areas of the Colombian Caribbean were studied through multibeam probes. The platform break studied these areas with a slope about 30 or 57 km from the coast. As a result, a diversity of geoforms were found in the seabed. Among them are the submarine canyons. These canyons were identified with lengths between 24 and 38 km. On the other hand, canyons in the Gulf of Morrosquillo originate in areas with a high slope, where eleven canyons were identified as between 4 and 16 km-long. As a result, 15% of the seabed was classified as Mass Removal Complex (MRC) zones, corresponding to approximately 9400 km, with areas ranging from 0.17 to 1500 km.
Different structural deformations such as hills were also identified; a total of 88 were identified, representing 7% of the study area. Although escarpments have a preferential SW–NE orientation, according to the study by [30], scarps have no spatial relationship with the faults. These scarps can have two causes: (i) changes in lithology in the stratigraphic succession or (ii) coastal processes associated with rising sea levels on the coast; 67 intraslope sub-basins with lengths between 0.5 and 60 km and depths between 9 and 940 m were also identified.
In [31], it identified, in the Canal del Dique, that the sediment trend between 1961 and 2009 had an accretion phenomenon with a rate of 4.17 m/year. The period with the most significant accumulation was between 2005 and 2009, generating a change in the shape and channel length. The total accumulated sediments in the 48 years were approximately 1,025,386.67 m. On the other hand, the total lost sediments were 5264.85 m.
Within the geomorphology of San Andrés and Providencia, it is possible to find that the depressions in an NNE direction make up the natural division that separates the Perlas Continental Slope from the submarine mountain range where the two islands intercept. The Providencia depression has an extension of 92 km, a width of 13 km, and a maximum depth of 2400 m. The San Andrés depression has an extension of 31 km with a maximum depth of 1900 m and a width of 7 km [28].
As observed, the previous studies dealt with the topography of the seabed surface. However, these works do not present relevant information when locating an OTEC system for the Colombian Caribbean since, for instance, they do not provide information on , , , or , which are crucial in the location of an OTEC system. Therefore, due to the above, it is necessary to generate a bathymetry and an analysis that allows for generating some location points of an OTEC system, as carried out in this work.
3. Methodology to Perform Bathymetry
For this research, locations close to populated centers were selected. Next, the bathymetry was performed at those previously selected points, and it was defined, depending on the bathymetric profile, which would be the best location for an OTEC system. It was also defined if the location was onshore or offshore. Here, it should be clarified that in this study, only the distance at which 1000 m of depth is reached is taken into account since it is necessary to have a temperature gradient more significant than 20 C, which is required for the optimal operation of an OTEC system. Other variables, such as extreme environmental conditions, land price, and installation costs, are not considered as these must be precisely obtained based on the preliminary location and are outside this study’s scope. The following steps were carried out for the development of this research.
- 1.
- Temperature difference in the Colombian Caribbean throughout the year.
- 2.
- Data collection.
- 3.
- Digitization of data.
- 4.
- Interpolation by Kriging method.
- 5.
- Creation of profiles.
- 6.
- Identification of suitable areas.
These steps are commented on thoroughly in the following subsections.
3.1. Temperature Difference in the Colombian Caribbean throughout a Year
The differences between surface and background temperatures were analyzed using Google Earth Engine (GEE), a cloud computing platform for processing Earth observation satellite imagery that combines a public data catalog with a large-scale computational facility for geospatial data [32]. The GEE catalog contains a collection of several petabytes of earth observation datasets and climate models for environmental monitoring of the oceans [33]. For this study, seasonal changes associated with the difference in surface 0 m and bottom water temperatures in the territorial sea of the Colombian Caribbean Sea were evaluated. Using the GEE API, daily images of the Hybrid Ocean General Circulation Model were filtered, creating monthly mosaics of the average depth difference from 0 and 1000 m, as can be seen in Figure 1.
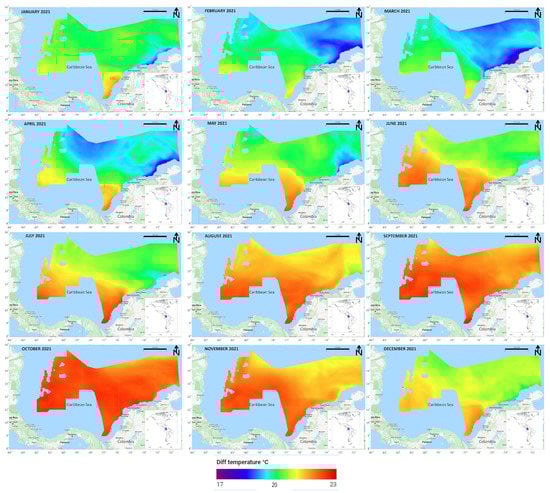
Figure 1.
Temperature difference in the Colombian Caribbean throughout 2021.
The multitemporal study of the surface–bottom depth gradient showed differences with temperatures between 17 and 23 C over the Colombian Caribbean territorial sea in 2021. These differences presented a marked seasonality with lower temperatures from February to April on the north coast due to coastal upwelling that determines the presence of deeper and colder water upwelling along with the Guajira and Maddalena departments (Figure 1). The upwelling was caused by the effect of the direction of trade winds in the coastal zone with greater intensity in March 2021 (Figure 1). The months where a more significant temperature differential was observed were from August to November, corresponding to the primary rainy season on the northern coast of Colombia. The southern Colombian Caribbean near the Gulf of Urabá presented the most significant temperature differential throughout both climatic seasons, with temperatures between 22 and 23 C.
The places selected to study the potential locations of the OTEC system are all located where the temperature gradient is larger than 20 C all year round (as shown in Figure 1) since they are placed near the coast where temperature differences range between 18.5 and 22.3 C throughout the year. Thus, the temperature gradient necessary to ensure the operation of the OTEC plant is guaranteed.
3.2. Data Collection
The cartographic and bathymetric base was acquired by downloading navigation charts of 34 m/pixel in resolution from Navionics.com—SonarChart™, included in the SAS. A planet bathymetric chart and visualization software were downloaded. With this information, 16 images of a mosaic were assembled by georeferencing each chart using four control points using Surfer 7.0™ software (Figure 2).
Figure 2.
Mosaic of Navionics Sonar Chart bathymetric maps in SAS.Planet.
3.3. Digitization of Data
From the generated mosaic, the coastline, bathymetric points, and isobaths (2–10–20–100–200–1000 and 2000 m) were digitized to point maps to which the corresponding Z datum was assigned with the Digitize tool in Surfer 7.0™. Insular zones, shallows, and deep slope areas from 1 to 2720 m-depth were included.
3.4. Interpolation by Kriging Method
Experimental results have shown that, in a general setting, the Spline method frequently provides a more accurate interpolation within the sample space to work with skewed and normalized data than the Inverse Distance Weighted and Kriging methods [34]. However, in this research, the Kriging method presents a more precise fit than other models included in the Surfer software. This fact along with the great grid flexibility provided by the Kriging method makes it the best option to interpolate the data.
Grids were obtained from the interpolation of bathymetric points using the Kriging point option in the Surfer Software, which estimates the values of the points at the grid nodes. A linear variogram model was specified by autofitting the data.
3.5. Creation of Profiles
A cross-section or profile was added to the map in different sections of the Caribbean shelf to represent the shallow and deep shelf of the Colombian Caribbean. This section was obtained using the Surfer 7 profiler tool, and the data were represented in a spreadsheet.
3.6. Identification of Suitable Areas
When obtaining the bathymetric maps, analysis of the areas closest to the Caribbean Sea depths with diff temperatures between 17 C and 20 C was carried out. Additionally, it is necessary to identify a nearby population center within the suitable areas. An example of bathymetry used for the location of an OTEC system is presented in Figure 3. It can be seen how the platform rupture is generated at km 96.57, and the distance to a depth of 1000 m is achieved at km 112.25. Therefore, if an OTEC plant is located on land, pipes would have to be installed for more than 112 km, making the system and the costs associated with installing the pipe inefficient. On the other hand, if an offshore OTEC system is installed right at the break in the platform, the route of the pipes would be 15.69 km, the installation would have to be anchored at a depth of 127 m, and electrical wiring would need to have a minimum length of 96 km. The parameters shown in Figure 3 and introduced in Section 2.1.2 are thus used to discuss the location of the OTEC system.
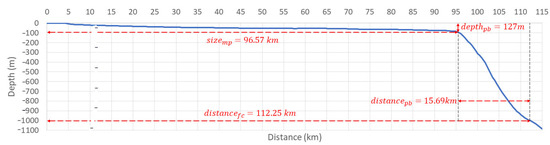
Figure 3.
Bathymetric variables used in a profile and employed to propose suitable locations for the OTEC system.
Initially, the relationship between the temperature difference and depth was established. According to Section 3.1, the temperature gradient of at least 20 C was obtained in the studied points of the Caribbean at a depth of 1000 m. Once the temperature gradient was related to the depth of 1000 m, the decision problem to decide among the different locations was solved by observing how this depth can be reached. The work [16] proposed the criterion of locating the OTEC plant at most 15 km from the cold water source. In this sense, the following criteria are used for the location decision:
- Criterion 1. The OTEC system is located onshore if km.
- Criterion 2. The OTEC system is located offshore near the platform break around if km and km.
- Criterion 3. The OTEC system is located offshore floating or with mooring at 1000 depth if km and km, in order to reduce the pipe route.
4. Results
The results obtained for the Caribbean region, San Andrés, Providencia, and Santa Catalina are presented below. Some points are preselected near the populated centers to carry out the bathymetry. Once the profiles are reviewed, those that present the best condition for an OTEC system location are chosen. At this point, it should be noted that the criterion for selecting the best location is the shortest distance to a depth of 1000 m since, for this region, a temperature differential of at least 20 C is achieved.
4.1. Caribbean
Figure 4 shows the Colombian Caribbean bathymetry to approximately 1000 m-deep. From this image, it is possible to identify some suitable areas for implementing an OTEC system taking into account the width of the continental shelf and the slope in order to obtain temperature gradients of 20 C at least with the minimum depth.
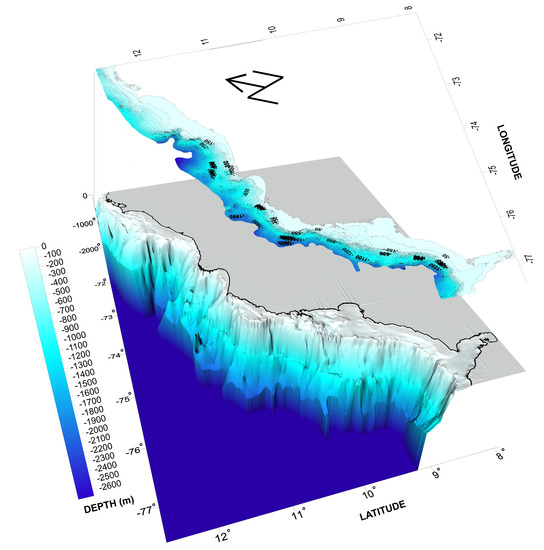
Figure 4.
Bathymetry of the Colombian Caribbean.
The main population centers of the Colombian Caribbean were studied to find the optimal places for the OTEC plant location. For this part, 16 points divided into four zones were selected: Colombian Caribbean Zone 1 (CCZ1), Colombian Caribbean Zone 2 (CCZ2), Colombian Caribbean Zone 3 (CCZ3), and Colombian Caribbean Zone 4 (CCZ4); these can be seen in Figure 5. The continental shelf of the Colombian Caribbean has a great variety of amplitudes along the coast, with an average extension of the shelf of 30 km, as shown in Figure 6. Therefore, the breakpoint between the shelf and the continental slope varies along the coast.
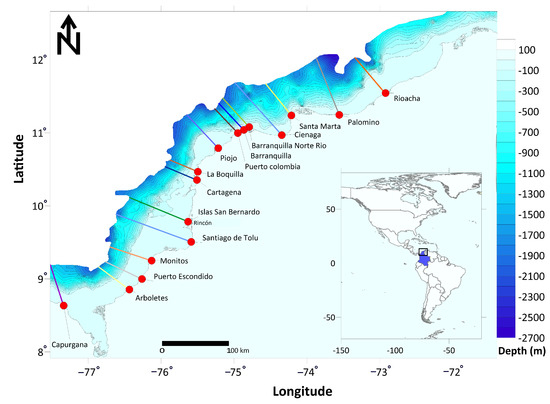
Figure 5.
Location of profiles of 16 points in the Colombian Caribbean.
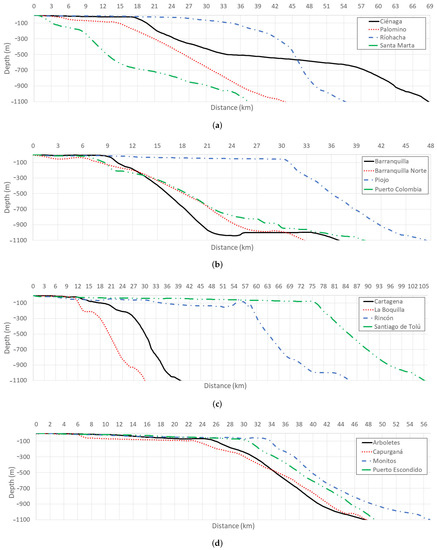
Figure 6.
Profiles of 16 points in the Colombian Caribbean. (a) CCZ1, (b) CCZ2, (c) CCZ3, and (d) CCZ4.
Figure 6 shows that there are seven points where the platform width is less than 20 km; in CCZ1 are Cienaga (19.14 km), Palomino (15.22 km), and Santa Marta (1.84 km); in CCZ2 are Barranquilla (9.43 km), Barranquilla Norte (6.53), and Puerto Colombia (7.42 km); in CCZ3 is La Boquilla (11.45); while in CCZ4, all platform widths are greater than 20 km. Table 1 presents a resume of the results of Figure 6. The first column shows the four zones previously described; the third column shows the distance in kilometers until the break of the platform is reached; the fourth column shows at what depth the break is found; the fifth column shows the distance from the coast that reaches a depth of 1000 m; the sixth column presents the slope that is obtained between the break of the platform and a depth of 1000 m; finally, the seventh and eighth columns present the temperature differentials, minimum () and maximum (), respectively, between the surface and 1000 m-depth.

Table 1.
Continental platform break at 16 points in the Colombian Caribbean.
As an example, it can be seen that Cienaga, located in CCZ1, finds the break at 19.14 km; at that point, it has a depth of 79.1221 m and reaches a depth of 1000 m at 20.7097 km from the coast.
From Table 1, it can be seen that the area with the slightest inclination of the slope is Santa Marta with 29. This is the continental shelf with a smaller width (approximately 1 km), starting the slope at a depth of approximately 50 m below sea level. In the Puerto Colombia case, there is a slope of 34, the slope begins at a depth of 42 m, and the continental shelf has a width of 6.5 km. In the slope geometry, there are plain areas with widths between 6 and 7 km. In the Barranquilla profile, there is a 35 slope; in the first 12 km from the platform break, the highest slope of this profile has a value of 88, while at 19 km from the coast until the profile end, there is a flatter area with only 21 and the continental shelf has a width of 6.6 km.
4.1.1. Best Location of an OTEC System for the Colombian Caribbean Z1
In CCZ1, Santa Marta, with coordinates 7412 W and 1114 N, the profile is taken from the coast of the populated center. Using Criterion 3, Santa Marta is the best location for an OTEC offshore plant; it is observed that the depth of 1000 m is reached at = 35.42 km. Palomino is another option, but in this case, km, which is greater than the previous one in more than 3 km. Rioacha and Cienaga are ruled out because a distance of more than 50 km must be made to reach a depth of 1000 m.
4.1.2. Best Location of an OTEC System for the Colombian Caribbean Z2
In CCZ2, using Criterion 2 Barranquilla with coordinates 7453 W and 112 N is the best option. An offshore OTEC plant can be located around km, where a pipe would be extended for about km to reach the cold water. Barranquilla Norte and Puerto Colombia have a similar topography, but the 1000 m-depth requires a longer trajectory. On the other hand, on Piojo, the platform has a width of 30 km, and the depth at the break of the platform is 58 m, presenting the worst conditions for a location.
4.1.3. Best Location of an OTEC System for the Colombian Caribbean Z3
In CCZ3, using Criterion 3, La Boquilla is the best location, where an open-cycle OTEC offshore plant with moorings at 1000 m-depth can be located at km. In Cartagena, the width of the platform is 25.79 km and the break of the platform of 233 m below sea level could be viable since it has a steep slope, reaching a depth of 1000 km with an additional 10.45 km; the problem with Cartagena is that the station would require civil infrastructure to reach 233 m-depth. In Figure 6c, it can be seen that in Santiago de Tolú, there is a platform of approximately 76 km; from there, it gives way to the continental slope that begins from 125 m below sea level and reaches depths of 1900 m with an extension of approximately 47 km. Another area with a wide continental shelf is off the coast of the Rincón corregimiento in San Onofre, Sucre, where the width of the shelf reaches approximately 54 km, passing near San Bernardo Island. The shelf reaches a slight elevation of 100 m and is 5 km in diameter. Later, the slope descends 38 km from a depth of 240 m below sea level to 1500 m; Rincón and Santiago de Tolú are ruled out due to their distance from the coast.
4.1.4. Best Location of an OTEC System for the Colombian Caribbean Z4
In CCZ4, the four profiles are similar in all cases; the break of the platform is generated after 20 km. However, using Criterion 3, a possible location is Arboletes, where an OTEC offshore plant with moorings at 1000 m-depth can be located at km.
4.2. San Andrés
Figure 7a shows the bathymetry for the western area of San Andrés. It is identified that the continental shelf is narrower, with an average width of 0.5 km. The depth can reach up to 2000 m below sea level at an average of 6 km from the coast. On the other hand, Figure 7b shows the bathymetry of the eastern area of San Andrés. In this area, the width of the platform is more remarkable, with an average of 2.5 km. The slope reaches 1200 m at an average distance of 8 km from the coast.
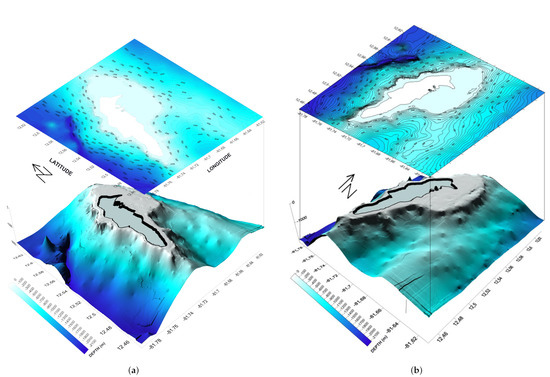
Figure 7.
Bathymetry of San Andrés. (a) Western. (b) Eastern.
The continental shelf of San Andrés has an average width of 1.74 km. The point’s location is presented in Figure 8, where seven points are divided into two zones, San Andrés Z1 (SAZ1) and San Andrés Z2 (SAZ2). In SAZ1, points are the Gustavo Rojas Pinilla International Airport runway entrance, Barrio Obrero, beach Rocky Cay, and Barrio San José. SAZ2 have three points: Hans Dive Shop diving area, the Casa Museo Isleña hotel (La Loma), and the Tana road.
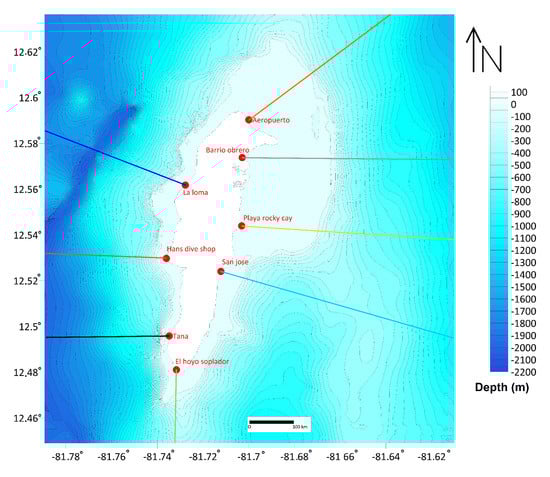
Figure 8.
Location of the profiles in 7 points of San Andrés.
Figure 9 shows the geometry of the profiles of the areas identified, which present platforms with widths of 0.75 km in the north and 0.33 km in the south, with depths at the break of the platform of 75 and 22 m below sea level, respectively. The northern area slope reaches a depth of 2000 m at a distance of 3.6 km from the coast; the southern area slope reaches a depth of 1650 m at a distance of 3.4 km from the coast. Table 2 presents a resume of the results of Figure 9.
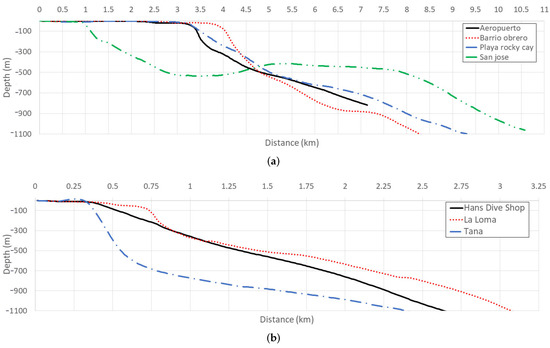
Figure 9.
Profiles in 7 points of San Andrés. (a) SIZ1 and (b) SIZ2.
Table 2.
Break of the continental platform in 8 points of San Andrés.
4.2.1. Best Location of an OTEC System for San Andrés Z1
The continental shelves at these points are variable, where the place with the most significant amplitude is found in the Barrio Obrero with a value of approximately 4 km and, later, the break of the shelf occurs (Figure 9) at 58 m-depth. At Rocky Cay Beach, the width of the platform is 3.3 km, the same as at the Airport, reaching the break of the platform at depths of 36 and 39 m, respectively. In San José, the platform does not exceed 1 km-wide; the break of the platform occurs at 41 m below sea level and 1 km-wide. Therefore, using Criterion 1, it is possible to establish one suitable area to locate an OTEC onshore on the northwestern coast of San Andrés, near the end of the Gustavo Rojas Pinilla International Airport runway with coordinates 8143 W and 1234 N. Taking into account the land problem in San Andres, since it is a small and densely populated island, it is possible to locate an offshore plant in Barrio Obrero for km and install pipes for 4 km to reach 1000 m-depth.
4.2.2. Best Location of an OTEC System for San Andrés Z2
In La Loma, the platform is 0.75 km in width; the most significant depth is observed in the break here with a value of 113 m-depth. Lastly, at Hans Dive Shop and Tana, there are platforms 0.42 km- and 0.35 km-wide, respectively, with depths at the break of the platform of 38 and 43 m. Therefore, using Criterion 1, it is possible to establish one suitable area to locate an OTEC onshore on the southwestern coast, at coordinates 8144 W and 1229 N between the western exit of the Tana road and El Hoyo Soplador.
4.3. Providencia and Santa Catalina
Figure 10a shows the bathymetry of western Providencia and Santa Catalina islands with an average continental shelf width of 2.83 km. The continental slope reaches maximum depths of 1000 m at an average of 3.4 km. Likewise, Figure 10b shows the bathymetry of the eastern area of Providencia with an average amplitude on the continental shelf of 3.6 km. The continental slope reaches maximum depths of 980 m below sea level at an average distance from the slope of 5.5 km.
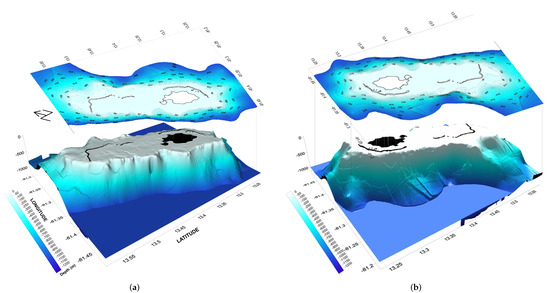
Figure 10.
Bathymetry of Providencia and Santa Catalina. (a) Western. (b) Eastern.
The continental shelf along the eastern, western, and southern coasts does not exceed 5 km in width, at 3.2 km max. In Providencia, profiles were taken at three points and one in Santa Catalina, as shown in Figure 11; the points are Providencia, San Felipe, Santa Catalina and South West Bay, all located on the western side of the island.
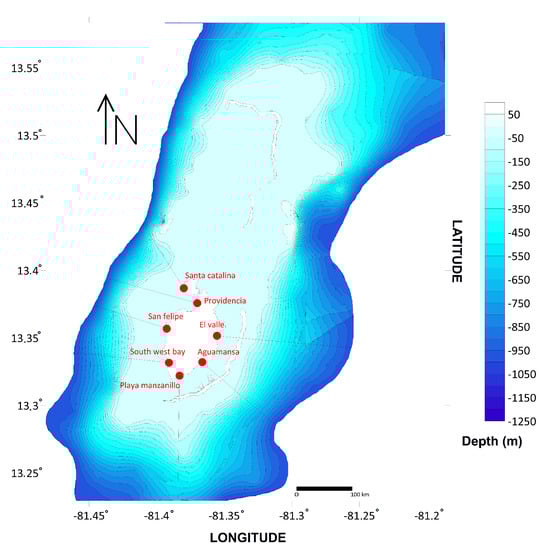
Figure 11.
Location of the profiles at seven points of Providencia and Santa Catalina.
Providencia has a shelf 4.5 km-wide with a depth at the shelf break of 36 m below sea level (Figure 12). While in South West Bay and San Felipe, the platform has a width of 2.6 km with depths in the break of 18 and 13 m-depth. Finally, in Santa Catalina, the platform has a width of 1.6 km with a depth break of 16 m below sea level.
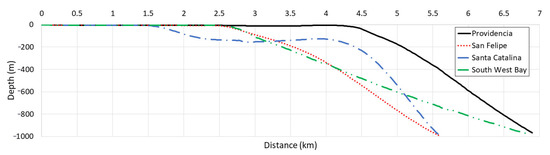
Figure 12.
Profiles at seven points of Providencia and Santa Catalina.
Best Location of an OTEC System for Providencia and Santa Catalina
According to Figure 12, Table 3, and using Criterion 1, all points are viable to locate an OTEC onshore plant. However, it is possible to identify two suitable areas for the implementation of the OTEC system offshore in Providencia and San Felipe: (i) in Providencia, at km with a km pipe to reach the cold water; (ii) in San Felipe, at km with a km pipe to reach the cold water.
Table 3.
Break of the continental platform at four points of Providencia and Santa Catalina.
In Santa Catalina, the platform has an amplitude of 1.47 km, beginning the break of the platform at a depth of 4.97 m below sea level and reaching depths of the slope of 977 m with a distance of 4.2 km approximately. In the Providencia case, the rupture of the continental shelf occurs 2.8 km from the coast with a depth of 6.7 m. In both cases, the slope has an approximate distance of 4.7 km, reaching a maximum depth of 980 m.
The bathymetry in the Colombian Caribbean, San Andrés, Providencia, and Santa Catalina present variability in the geomorphology of the seabed with different geoforms; suitable areas were found from the data collected for the bathymetric study that allow establishing the areas for implementation of the OTEC system both onshore as offshore, it is essential to note that these areas took into account the proximity to population centers.
5. Conclusions
This work presents a methodology to select potential locations to install OTEC facilities, both onshore and offshore, on the Colombian Caribbean coasts and the San Andrés and Providencia Islands.
The methodology starts studying the temperature gradient along the Caribbean Sea in order to be able to guarantee the appropriate temperature difference for the correct operation of the OTEC system. It is concluded that the special situation of the Colombian Caribbean within the tropics allows ensuring the adequate temperature gradient of at least 20 C in locations near Colombian coast all year round. Once the temperature gradient has been guaranteed, some initial potential locations for OTEC facilities were selected by choosing points close to large metropolitan areas. At this set of initially selected points, bathymetric profiles were presented, providing detailed information on the shelf, the break of the shelf, and the continental slope. These values were used to propose a decision procedure to select from the originally considered points those that represent the best choice to locate the plant.
Given the high installation costs of OTEC systems, substantial studies must be further carried out to reduce installation costs as much as possible. In this sense, an open line of research is to study the sites presented; from an environmental, technical, and financial point of view. Studies must be carried out over a reasonable period, which allows determining the climatic and environmental conditions; it must also be determined how the marine ecosystems are made up and carry out the respective environmental feasibility studies. Regarding the technical feasibility, the conditions of the seabed and the conditions to transport the generated energy must be studied in detail. Finally, it is essential to study the cost functions associated with the location—for example, the cost of installation and the cost of land, since these functions undoubtedly vary depending on the distance from the coast.
Author Contributions
Conceptualization, J.H., N.A. and A.F.; investigation, L.F. and H.H.-H.; writing—original draft preparation, J.H., H.H.-H., L.F., N.A., A.F. and A.I.; writing—review and editing, J.H., H.H.-H., L.F., N.A., A.F. and A.I.; funding acquisition, J.H., A.F. and A.I. All authors have read and agreed to the published version of the manuscript.
Funding
This work was partially supported by the ERANET-LAC project, which has received funding from the European Union Seventh Framework Programme; has been funded by the Ministry of Science, Innovation, Universities through the Spanish Research Agency (PCI2019-103376, ERANet17/ERY 0168); and has been funded by the Facultad de Ciencias Económicas y Administrativas de la Universidad de Bogotá Jorge Tadeo Lozano.
Institutional Review Board Statement
Not applicable.
Informed Consent Statement
Not applicable.
Data Availability Statement
The temperature data was obtained from the Hycom GEE catalogue, which is available with no restrictions in https://developers.google.com/earth-engine/datasets/catalog/HYCOM_sea_temp_salinity?hl=en#terms-of-use, accessed on 10 March 2022.
Conflicts of Interest
The authors declare no conflict of interest.
Abbreviations
The following abbreviations are used in this manuscript:
| DTM | Digital Terrain Model |
| GHG | Global Emissions of Greenhouse Gases |
| MRC | Mass Removal Complex |
| OTEC | Ocean Thermal Energy Conversion |
| SDG | Sustainable Development Goals |
| UN | United Nations Organization |
References
- Smil, V. Creating the Twentieth Century: Technical Innovations of 1867–1914 and Their Lasting Impact; Oxford University Press: New York, NY, USA, 2005. [Google Scholar]
- Ghali, K.H.; El-Sakka, M.I. Energy use and output growth in Canada: A multivariate cointegration analysis. Energy Econ. 2004, 26, 225–238. [Google Scholar] [CrossRef]
- Ullah, N.; Ali, M.A.; Ibeas, A.; Herrera, J. Adaptive fractional order terminal sliding mode control of a doubly fed induction generator-based wind energy system. IEEE Access 2017, 5, 21368–21381. [Google Scholar] [CrossRef]
- Adom, P.K.; Opoku, E.E.O.; Yan, I.K.M. Energy demand–FDI nexus in Africa: Do FDIs induce dichotomous paths? Energy Econ. 2019, 81, 928–941. [Google Scholar] [CrossRef]
- Jumbe, C.B. Cointegration and causality between electricity consumption and GDP: Empirical evidence from Malawi. Energy Econ. 2004, 26, 61–68. [Google Scholar] [CrossRef]
- Khan, S.A.R.; Qianli, D. Does national scale economic and environmental indicators spur logistics performance? Evidence from UK. Environ. Sci. Pollut. Res. 2017, 24, 26692–26705. [Google Scholar] [CrossRef]
- Sun, H.; Edziah, B.K.; Kporsu, A.K.; Sarkodie, S.A.; Taghizadeh-Hesary, F. Energy efficiency: The role of technological innovation and knowledge spillover. Technol. Forecast. Soc. Chang. 2021, 167, 120659. [Google Scholar] [CrossRef]
- Tobón, A.; Peláez-Restrepo, J.; Montano, J.; Durango, M.; Herrera, J.; Ibeas, A. MPPT of a photovoltaic panels array with partial shading using the IPSM with implementation both in simulation as in hardware. Energies 2020, 13, 815. [Google Scholar] [CrossRef]
- Gohar Ali, H.; Vilanova Arbos, R.; Herrera, J.; Tobón, A.; Peláez-Restrepo, J. Non-linear sliding mode controller for photovoltaic panels with maximum power point tracking. Processes 2020, 8, 108. [Google Scholar] [CrossRef]
- Díaz, W.L.; Mejía, A.P. Experiences of citizenship in precarization: An ethnography from northern Colombia in the time of COVID-19. Heliyon 2021, 7, e07659. [Google Scholar] [CrossRef]
- Herrera, J.; Sierra, S.; Ibeas, A. Ocean Thermal Energy Conversion and Other Uses of Deep Sea Water: A Review. J. Mar. Sci. Eng. 2021, 9, 356. [Google Scholar] [CrossRef]
- Yoon, D.Y.; Choi, H.W.; Lee, K.S.; Park, J.S.; Kim, K.H. Comparison of Two Methods for Estimating the Appearance Probability of Seawater Temperature Difference for the Development of Ocean Thermal Energy. J. Korean Assoc. Geogr. Inf. Stud. 2010, 13, 94–106. [Google Scholar]
- Devis-Morales, A.; Montoya-Sánchez, R.A.; Osorio, A.F.; Otero-Díaz, L.J. Ocean thermal energy resources in Colombia. Renew. Energy 2014, 66, 759–769. [Google Scholar] [CrossRef]
- de Souza, R.V.; Marques, W.C. Energy budget of the thermal gradient in the Southern Brazilian continental shelf. Renew. Energy 2016, 91, 531–539. [Google Scholar] [CrossRef]
- Abudeif, A.; Moneim, A.A.; Farrag, A. Multicriteria decision analysis based on analytic hierarchy process in GIS environment for siting nuclear power plant in Egypt. Ann. Nucl. Energy 2015, 75, 682–692. [Google Scholar] [CrossRef]
- Garduño-Ruiz, E.P.; Silva, R.; Rodríguez-Cueto, Y.; García-Huante, A.; Olmedo-González, J.; Martínez, M.L.; Wojtarowski, A.; Martell-Dubois, R.; Cerdeira-Estrada, S. Criteria for optimal site selection for ocean thermal energy conversion (Otec) plants in Mexico. Energies 2021, 14, 2121. [Google Scholar] [CrossRef]
- Zhang, J.; Xu, C.; Song, Z.; Huang, Y.; Wu, Y. Decision framework for ocean thermal energy plant site selection from a sustainability perspective: The case of China. J. Clean. Prod. 2019, 225, 771–784. [Google Scholar] [CrossRef]
- Yang, M.H.; Yeh, R.H. Analysis of optimization in an OTEC plant using organic Rankine cycle. Renew. Energy 2014, 68, 25–34. [Google Scholar] [CrossRef]
- Heydt, G.T. An assessment of ocean thermal energy conversion as an advanced electric generation methodology. Proc. IEEE 1993, 81, 409–418. [Google Scholar] [CrossRef]
- Cavrot, D. Economics of ocean thermal energy conversion (OTEC). Renew. Energy 1993, 3, 891–896. [Google Scholar] [CrossRef]
- Yasunaga, T.; Ikegami, Y.; Monde, M. Performance Test of OTEC with Ammonia/water as Working Fluid Using Shell and Plate Type Heat Exchangers, Effects of Heat Source Temperature and Flow Rate. Trans. JAME B 2008, 74, 445–452. [Google Scholar] [CrossRef][Green Version]
- Claude, G. Power from the tropical seas. Mech. Eng. 1930, 52, 1039–1044. [Google Scholar]
- Vega, L.; Nihous, G. At-sea test of the structural response of a large-diameter pipe attached to a surface vessel. In Proceedings of the Offshore Technology Conference. Offshore Technology Conference, Houston, TX, USA, 2–5 May 1988. [Google Scholar]
- Sverdrup, H.U.; Johnson, M.W.; Fleming, R.H. The Oceans: Their Physics, Chemistry, and General Biology; Prentice-Hall: New York, NY, USA, 1942; Volume 7. [Google Scholar]
- Thomas, A.; Hillis, D. Biofouling and Corrosion Research for Marine Heat Exchangers; Technical Report; Argonne National Lab.: Lemont, IL, USA, 1989. [Google Scholar]
- Hubbard, H.M. The real cost of energy. Sci. Am. 1991, 264, 36–43. [Google Scholar] [CrossRef]
- Quinby-Hunt, M.S.; Wilde, P.; Dengler, A. Potential environmental impacts of open-cycle thermal energy. Environ. Impact Assess Rev. 1986, 6, 77–93. [Google Scholar] [CrossRef]
- Tabares, N.; Soltau, J.M.; Díaz, J. Caracterización geomorfológica del sector suroccidental del mar Caribe. Boletín Cientifico CIOH 1996, 17, 3–16. [Google Scholar] [CrossRef]
- Cendales, M.H.; Zea, S.; Díaz, J.M. Geomorfología y unidades ecológicas del complejo de arrecifes de las Islas del Rosario e Isla Barú (Mar Caribe, Colombia). Rev. Acad. Colomb. Cienc. Exactas Físicas Nat. 2002, 26, 497–511. [Google Scholar]
- Restrepo, I.C.; Ojeda, G.Y.; Correa, I.D. Geomorfología de la plataforma somera del departamento de córdoba, costa caribe colombiana. Boletín Cienc. Tierra 2007, 20, 39–52. [Google Scholar]
- Rocha, L.M.; Hernández, J.P.E. Análisis de la evolución del fondo marino y cambios en la línea de costa, en el área de influencia de la desembocadura del Canal del Dique. Boletín Científico CIOH 2011, 29, 158–178. [Google Scholar] [CrossRef]
- Hansen, M.C.; Potapov, P.V.; Moore, R.; Hancher, M.; Turubanova, S.A.; Tyukavina, A.; Thau, D.; Stehman, S.V.; Goetz, S.J.; Loveland, T.R.; et al. High-resolution global maps of 21st-century forest cover change. Science 2013, 342, 850–853. [Google Scholar] [CrossRef]
- Gorelick, N.; Hancher, M.; Dixon, M.; Ilyushchenko, S.; Thau, D.; Moore, R. Google Earth Engine: Planetary-scale geospatial analysis for everyone. Remote Sens. Environ. 2017, 202, 18–27. [Google Scholar] [CrossRef]
- Ikechukwu, M.N.; Ebinne, E.; Idorenyin, U.; Raphael, N.I. Accuracy assessment and comparative analysis of IDW, spline and kriging in spatial interpolation of landform (topography): An experimental study. J. Geogr. Inf. Syst. 2017, 9, 354–371. [Google Scholar] [CrossRef]


Publisher’s Note: MDPI stays neutral with regard to jurisdictional claims in published maps and institutional affiliations. |
© 2022 by the authors. Licensee MDPI, Basel, Switzerland. This article is an open access article distributed under the terms and conditions of the Creative Commons Attribution (CC BY) license (https://creativecommons.org/licenses/by/4.0/).