Article

Applying a Set of Potential Methods for the Integrated Assessment of the Marine Eco-Environmental Carrying Capacity in Coastal Areas

1
Third Institute of Oceanography, Ministry of Natural Resources, Xiamen 361005, China
2
Key Laboratory of Marine Ecological Conservation and Restoration, Ministry of Natural Resources, Xiamen 361005, China
3
Fujian Province Key Laboratory of Marine Ecological Conservation and Restoration, Xiamen 361005, China
*
Author to whom correspondence should be addressed.
Sustainability 2022, 14(8), 4416; https://doi.org/10.3390/su14084416
Submission received: 2 March 2022 / Revised: 2 April 2022 / Accepted: 5 April 2022 / Published: 7 April 2022

Abstract

:
The accelerated socioeconomic development has placed the coastal ecosystems under stress, which influences the sustainable development of coastal areas. Marine eco-environmental carrying capacity assessment (MECCA) can provide a scientific basis for coordinating coastal socioeconomic development and eco-environmental protection, ensuring a more effective marine ecosystem-based management approach toward sustainability. However, accurate assessment methods are still in the exploratory stage, as there has been a lack of systematic research and applications combining integrated MECCA with a unified method to underpin coastal management processes. In light of this issue, this study applied the marine eco-environmental carrying capacity in coastal waters (MECCCW) conceptual framework to support the establishment of an assessment indicator system for MECCA and used the regularization method and entropy method to determine weights. This study also applied the simplified state space model to comprehensively evaluate and analyze the marine eco-environmental carrying capacity (MECC) of coastal areas. Focusing on the coastal area of Sanya Bay, southern China, as the study area, we assessed the MECC for the period from 2015 to 2020. The state of the MECC was divided into three grades: load capacity, full-load capacity, and overload capacity. The results showed that (1) the MECCA indicator system in Sanya Bay included a total of three criteria and eight assessment indicators and (2) the weights of the environmental carrying capacity (ECC) and human activities (HA) were both relatively higher than that of ecological resilience (ER). The latter result indicates that either ECC or HA could play a more predominant role in the changes of the MECC state in Sanya Bay. The results also indicated that (3) for each criterion, ECC, ER, and HA were at load capacity from 2015 to 2020. In this instance, ECC and HA presented similar change trends in relation to the MECC state of Sanya Bay. Finally, (4) the overall Sanya Bay’s MECC was also at load capacity and weakened, fluctuating between 2015 and 2020. These findings indicate that the coastal area of Sanya Bay is capable of sustainable development, but that there is a need for further eco-environmental improvement. The results of this study can serve as a reference when decisions have to be made about coastal management from an environmental and ecological perspective. Furthermore, this method may provide a feasible approach for integrated MECCA in other coastal areas.

1. Introduction

Coastal habitats, which provide resources that support more than 40% of the world’s population, are among the most productive ecosystems in the world [1,2]. Unfortunately, with the rapid socioeconomic development and global change, limited trade-offs between human exploitation and environmental protection have resulted in increasingly undesirable impacts on shoreline and near-shore habitats, leading to the degradation and even the collapse of some coastal ecosystems [3,4,5,6]. Hence, the sustainable development of coastal zones has become a major concern and the focus of sustainable development worldwide [7,8]. Some efforts have targeted the improvement of coastal socioeconomic development, which can be viewed as sustainable when a coastal ecosystem is at normal carrying capacity [8,9]. As the carrying capacity is a useful and practicable instrument that can be used to assess and achieve sustainability, it is essential to seek scientific approaches to evaluate and analyze it.
Carrying capacity was originally defined as the maximum number of individuals that a habitat can support in a certain area [10]. After being introduced to the field of ecology in 1870, the concept of carrying capacity was expanded from a single-entity notion (e.g., population carrying capacity, resource carrying capacity, environmental carrying capacity, ecological carrying capacity, etc.) to a more general one, i.e., comprehensive carrying capacity (e.g., resource-environmental carrying capacity, social and ecological carrying capacity, eco-environmental carrying capacity, etc.) [11,12,13,14,15]. The marine eco-environmental carrying capacity assessment (MECCA) can be viewed as a special application and practice of the carrying capacity assessment (CCA) in marine or coastal areas. Focusing on the ecological and environmental perspectives, MECCA offers a feasible way to comprehensively evaluate the synergistic effects of three predominant impact factors (environmental factor, ecological factor, and human activities factor) on the carrying capacity and characterize how sustainable development may be impacted by the coupling of human activities and the eco-environment of marine or coastal areas [16]. Here, the environmental factor refers to physical or non-physical elements (e.g., water quality, hydrology, salinity, etc.) that have an impact on plants, animals, and people who live in the area affected by that factor [17]; the ecological factor refers to the elements (e.g., community composition and area, species diversity, etc.) that reflect the morphology, physiology, and distribution of living organisms [18]; the human activities factor refers to human social and economic activities (e.g., coastal reclamation, marine aquaculture, environmental protection measures, etc.) that positively or negatively affect the ecological environment [19,20]. In summary, MECCA can provide a scientific basis for coordinating the relationship between coastal socioeconomic development and eco-environmental protection, thus ensuring a more effective marine ecosystem-based management of sustainability [21,22,23,24].
In the past decade, great strides have been made in techniques for the development and application of CCA [13,14,25,26,27,28,29,30,31]. However, the most current CCAs are limited to terrestrial areas, and there is a lack of systematic research on MECCA. Many studies have been conducted on MECCA [9,26,32,33,34,35,36,37], but thus far all have focused on introducing related concepts and technical procedures, discussing the establishment of an assessment indicator system, and developing evaluations on single-element carrying capacities (e.g., coastal socioeconomic carrying capacity, marine aquaculture carrying capacity, coastal tourism carrying capacity, marine resources or environmental carrying capacity, etc.). Unfortunately, single-element carrying capacities cannot fully reflect the eco-environmental status of a coastal area and are not able to meet the requirements for protection and management of coastal areas [15]. Moreover, the development period of MECCA studies thus far has been relatively short, and thus they lack maturity [23]. With the exception of a handful or recent related works [21,22,23], few studies have been conducted on integrated MECCA (i.e., integrating the establishment of an assessment indicator system, indicator weighting, and comprehensive evaluation into a compound assessment system) with a systematic and unified method to underpin coastal management. It is therefore advisable to strengthen systematic research on integrated MECCA of coastal areas.
Methods such as the analytic hierarchy process, expert judgment, and principal component analysis (PCA) are often used to determine indicator weight in current CCA processes [21,22]. The analytic hierarchy process and expert judgment approaches are relatively subjective in terms of criterion selection and weight distribution for analyzer preference [7,38]; PCA is a relatively objective method for indicator weighting based on multivariable analysis. However, because the definition of the principal component is somewhat vague, the indicator weighting results that are obtained when using this method are only reasonable and effective when the cumulative contribution rate of the various variables reflecting the principal component reach a superior level [22]. This implies that the fewer the variables that are identified in the process of selecting the principal component, the more difficult it is to determine the actual carrying capacity, particularly in coastal areas. The current analytical techniques for CCA mainly include the ecological footprint method [14], the index evaluation method [31], the system dynamics method [35], the fuzzy comprehensive assessment model [23], and the matter-element extension method [30]. These methods are mostly limited by their referring to related methods that are predominantly oriented to terrestrial CCAs and have both advantages and disadvantages. For example, the ecological footprint method highlights the ecological consequences of human consumption but ignores the effect of humans on eco-environmental conditions during production [14]. Although the index evaluation method is relatively flexible, there is a lack of systematic research on its theoretical framework [29]. The other three methods are suitable for compound systems but they typically require a large amount of detailed information in addition to specific data for complicated calculations. It is also difficult to determine standards for the assessment indicator. The implementation of these methods is thus difficult during integrated MECCA processes due to a usual lack of data, regionality, and uncertainty for coastal areas [23,30,35,38,39,40]. In addition, although the matter–element extension method can further improve and specialize the indicator grading standard, the basis for the boundary value for each grade is still contingent on local development plans for coastal areas, as well as on criteria for the coastal ecosystem, the judgment of relevant referential data, and recommendations from experts and local authorities [30,41]. The uncertainty involved in the creation of a specialized rating standard using the matter-element extension method has still not been effectively resolved. Consequently, reasonable and feasible evaluation methods for the marine eco-environmental carrying capacity (MECC) of coastal areas need further exploration.
Sustainable development has become the most important principle for the regional development of coastal areas [42]. Recently, “The Second World Ocean Assessment” emphasized that pro-active marine eco-environmental protection and sustainable development should be given more attention. The report also proposed that coastal countries and regions around the world should enhance carrying capacity assessment in particular [24]. China is one of the world’s major maritime powers and is currently upgrading its “Marine Ecological Civilization” and “Coastal Sustainable Development” policies to a national strategic level [36]. The construction of an ecological civilization is an approach through which China can implement the 2030 Agenda for Sustainable Development [43]. In this context, “The Implementation Plan of National Ecological Civilization Pilot Zone (Hainan Province, China)” and “The Pilot Project of Total Amount Control for Pollutant Discharge in Key Coastal Areas of China” were proposed in 2019. Sanya City, an internationally renowned coastal city in Hainan Province in southern China, is leading the pilot project. The integrated MECCA is one of the main research topics of this work.
In this study, a set of potential methods for integrated MECCA, including the marine eco-environmental carrying capacity in coastal waters (MECCCW) conceptual framework, the regularization method, the entropyweight method, and the simplified state space model, were applied to the case of Sanya Bay, southern China. The purposes of this study were to (1) comprehensively evaluate and analyze the MECC in the coastal area of Sanya Bay; (2) demonstrate the practicality of potential methods through a case study application; (3) offer an empirical reference and insights for related research in more coastal areas in the future.

2. Materials and Methods
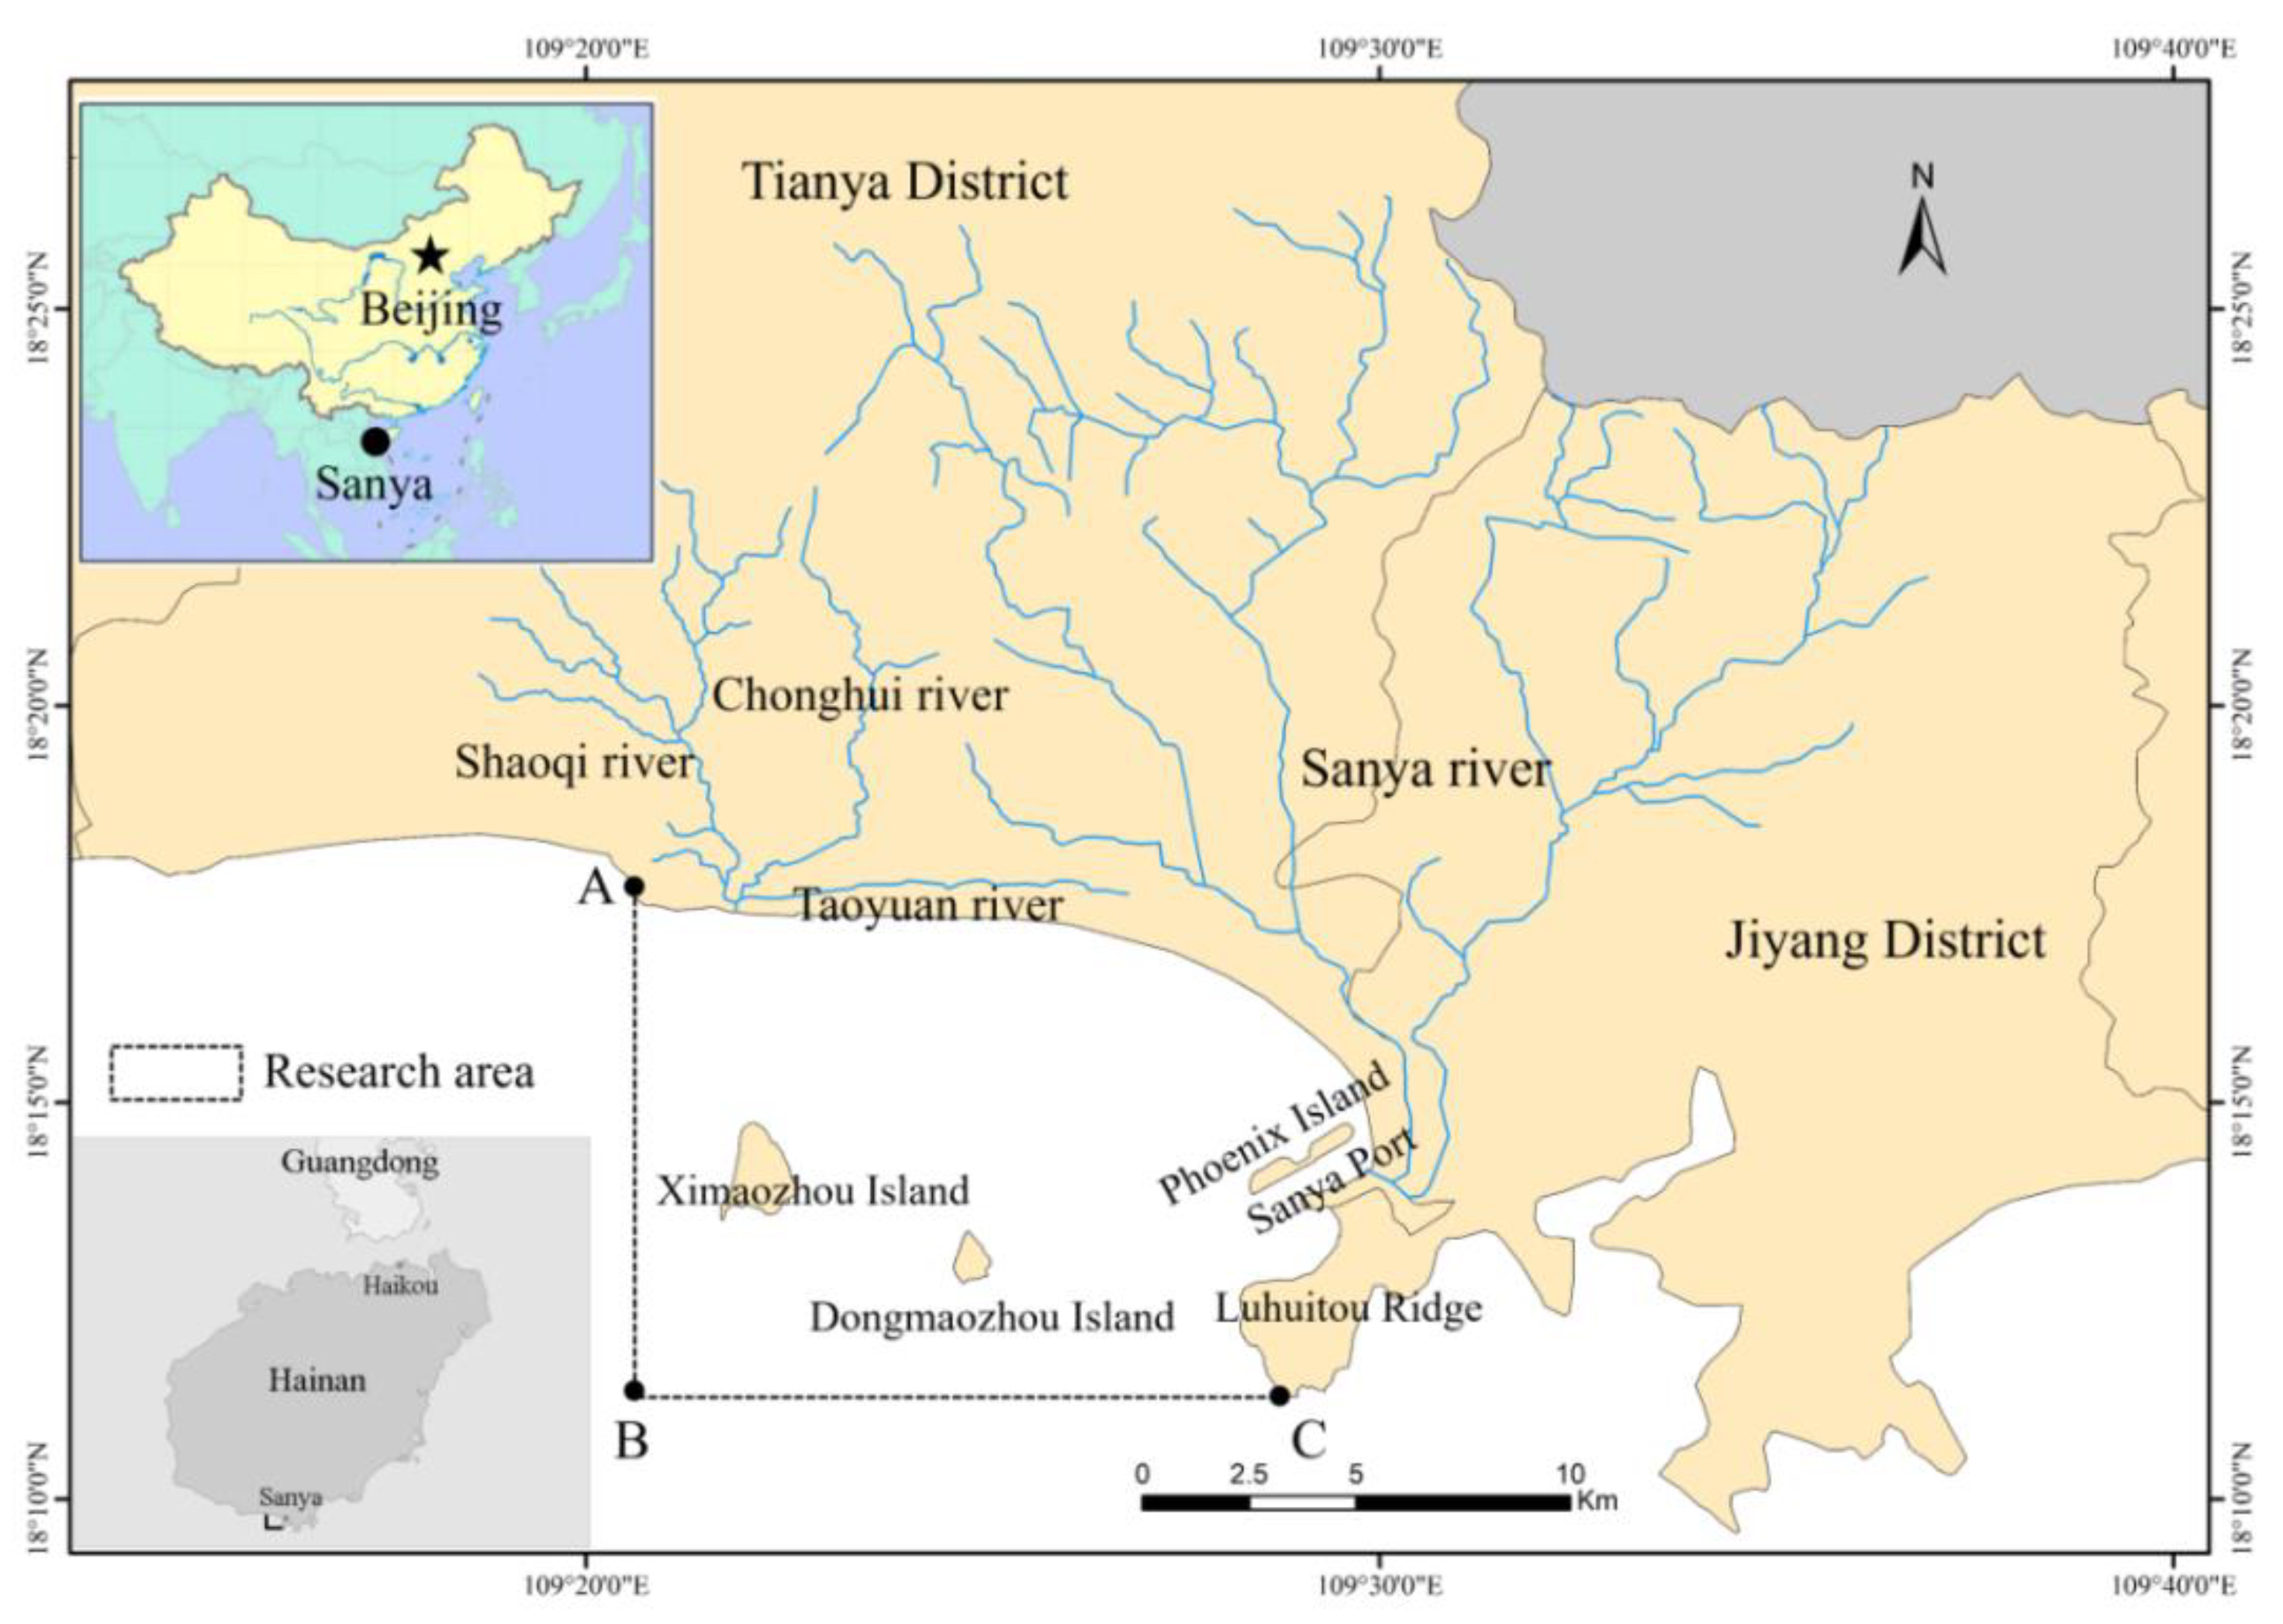
2.1. Study Area

Sanya City is located in the southernmost part of Hainan Province, China. It has become an internationally renowned coastal tourism city with attractive seascapes and abundant marine biodiversity, particularly coral reef ecosystems [44]. Sanya Bay is located in the south of Sanya City and has total coastal area and coastline lengths of 6.9 square kilometers and 27 km, respectively [45]. The area enclosed within points A (109°20′21″ E,18°18′02″ N), B (109°20′21″ E,18°11′18″ N), and C (109°28′55″ E,18°11′18″ N) comprise the special research scope of Sanya Bay for integrated MECCA (Figure 1), along with the north-side coastline [45].
Sanya Bay mainly includes the coastal area of the Tianya District of Sanya City and the partial coastal area of the Jiyang District (the sea area to the west of Luhuitou Ridge), as well as the Sanya Port, Dongmaozhou Island, Ximaozhou Island, and Phoenix Island. Additionally, four rivers—Shaoqi, Chonghui, Taoyuan, and Sanya—enter the ocean via this area. With the increasing intensity of human exploitation activities, the coastal area of Sanya Bay is now facing significant eco-environmental challenges, including the discharge of land-sourced pollutants, the deterioration of sea water quality, the partial degradation of coral reef ecosystems, and the increasing risk of red tide events.

2.2. Procedure and Methods

The process of integrated MECCA generally involves the following steps [21]: (1) the establishment of an assessment indicator system; (2) the normalization and weighing of the assessment indicator; (3) the comprehensive evaluation and analysis of the MECC. Accordingly, a set of potential methods was introduced in three different steps.

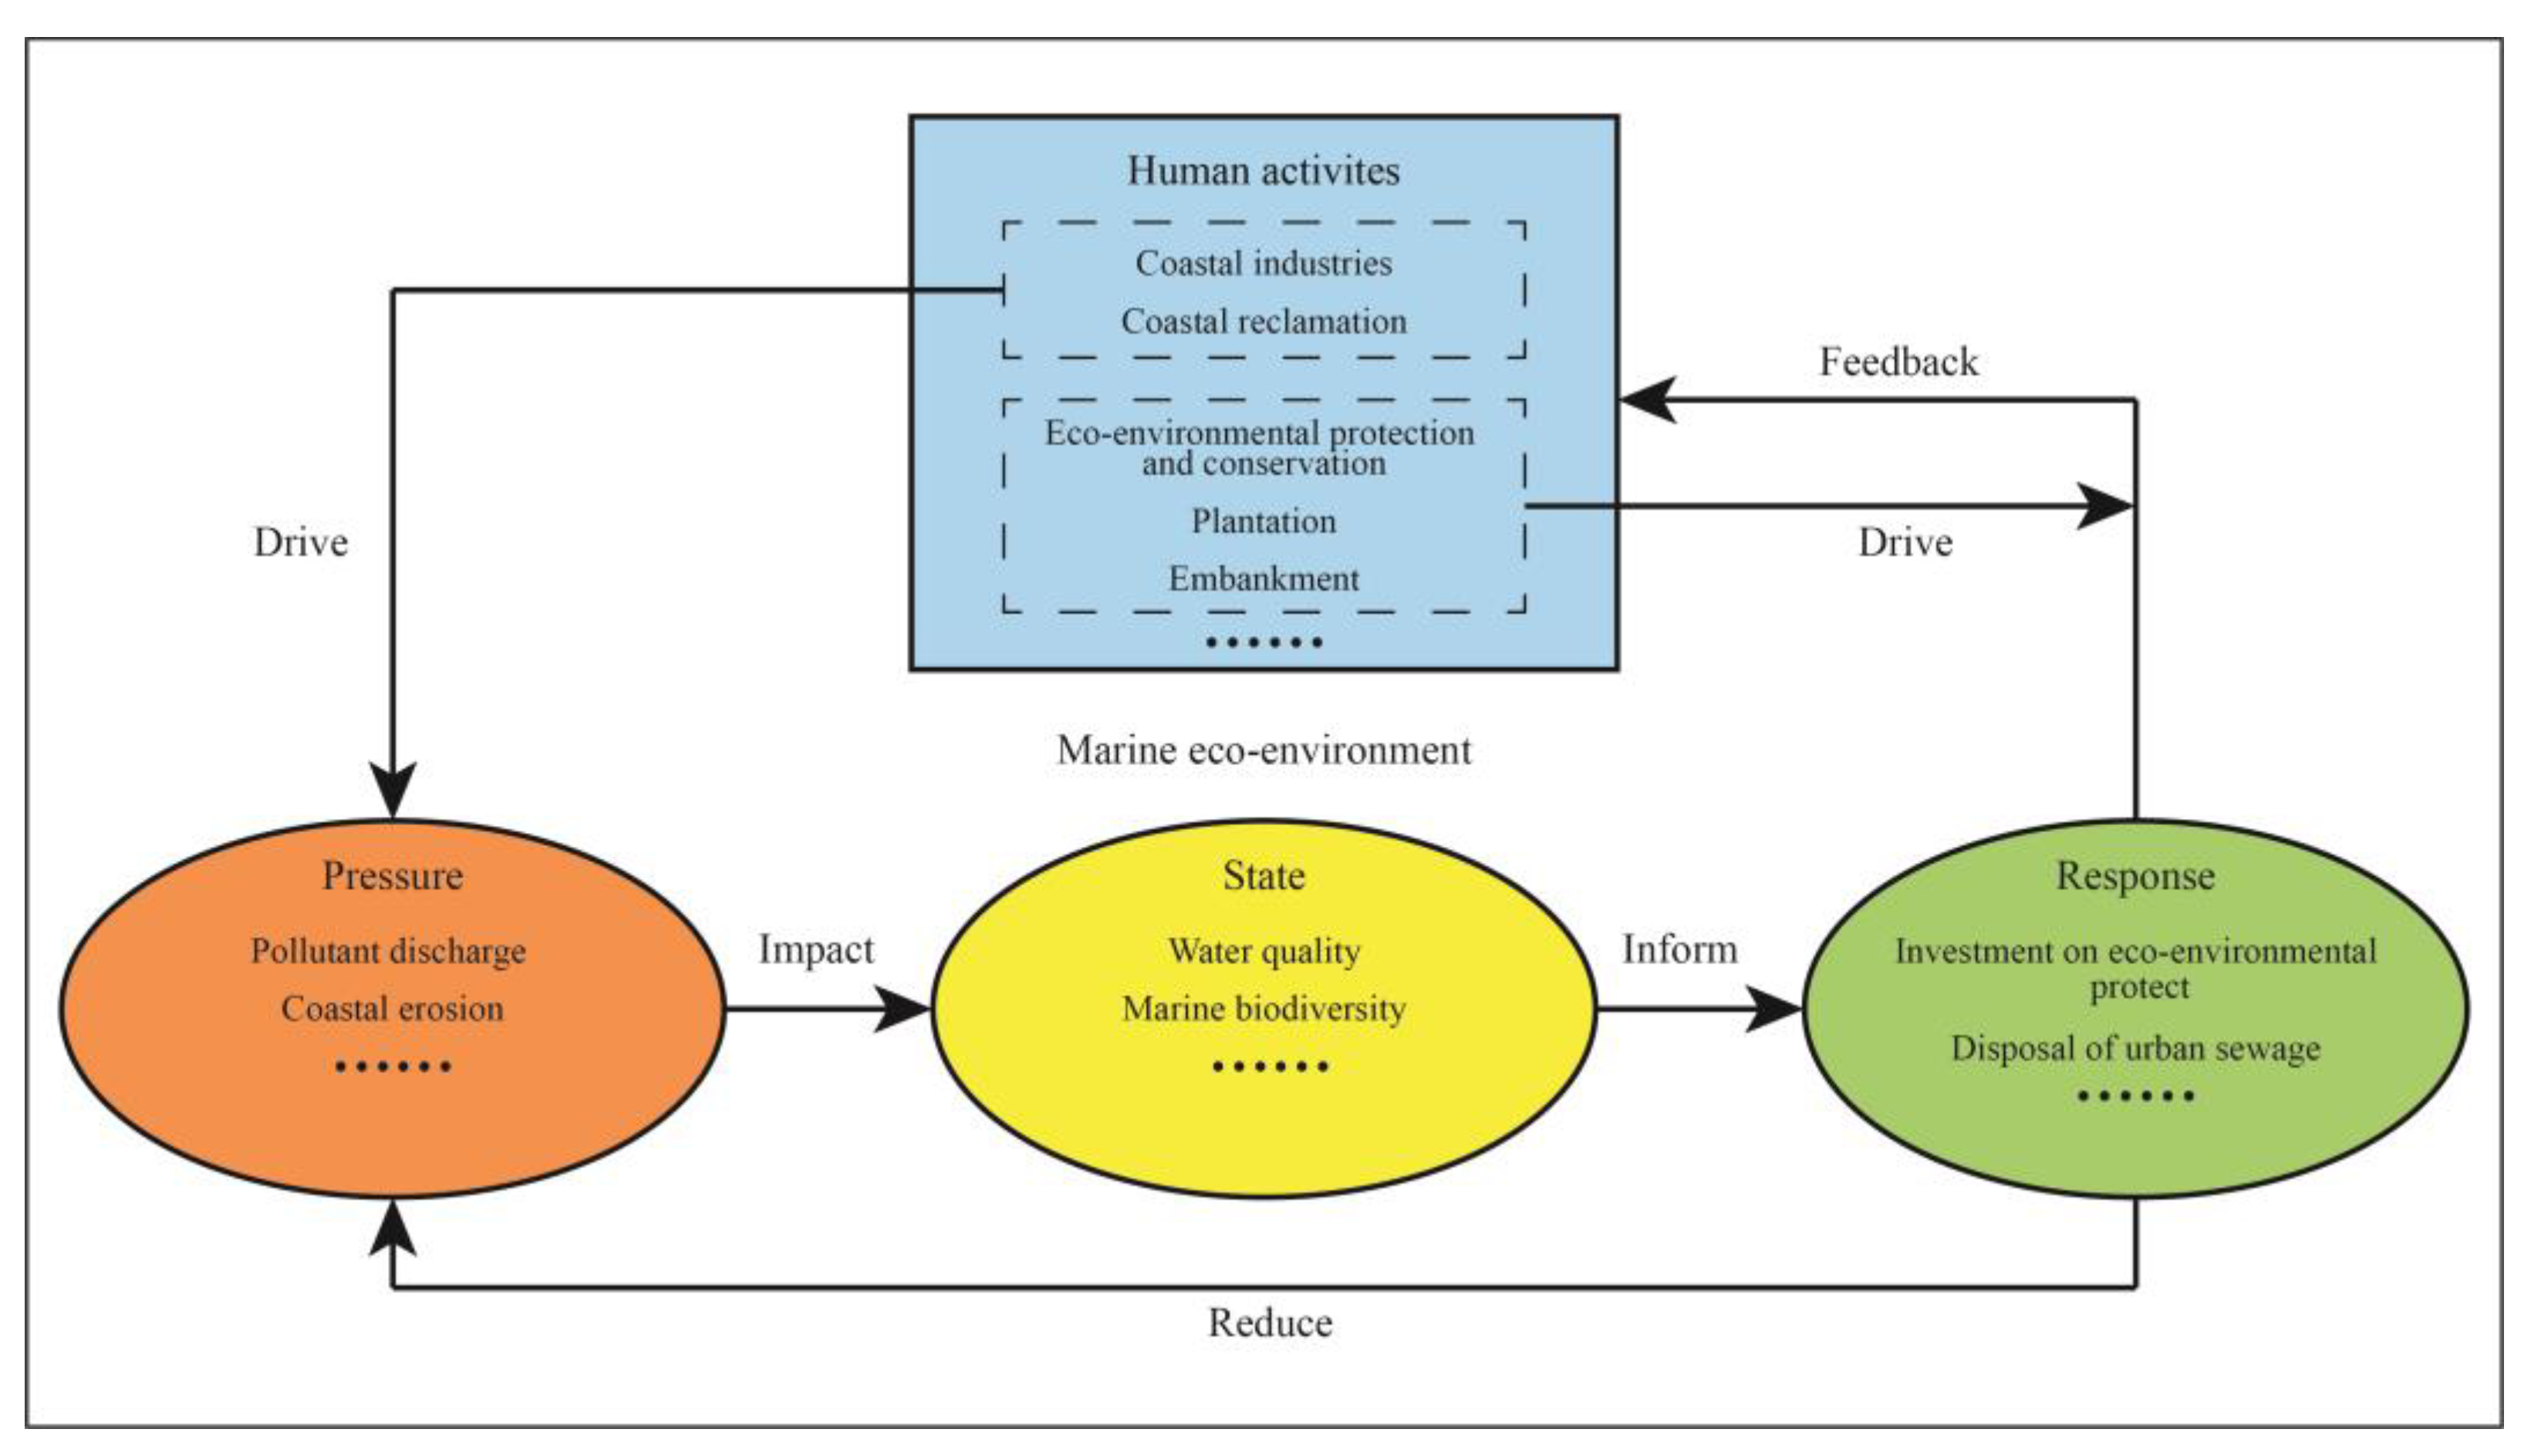
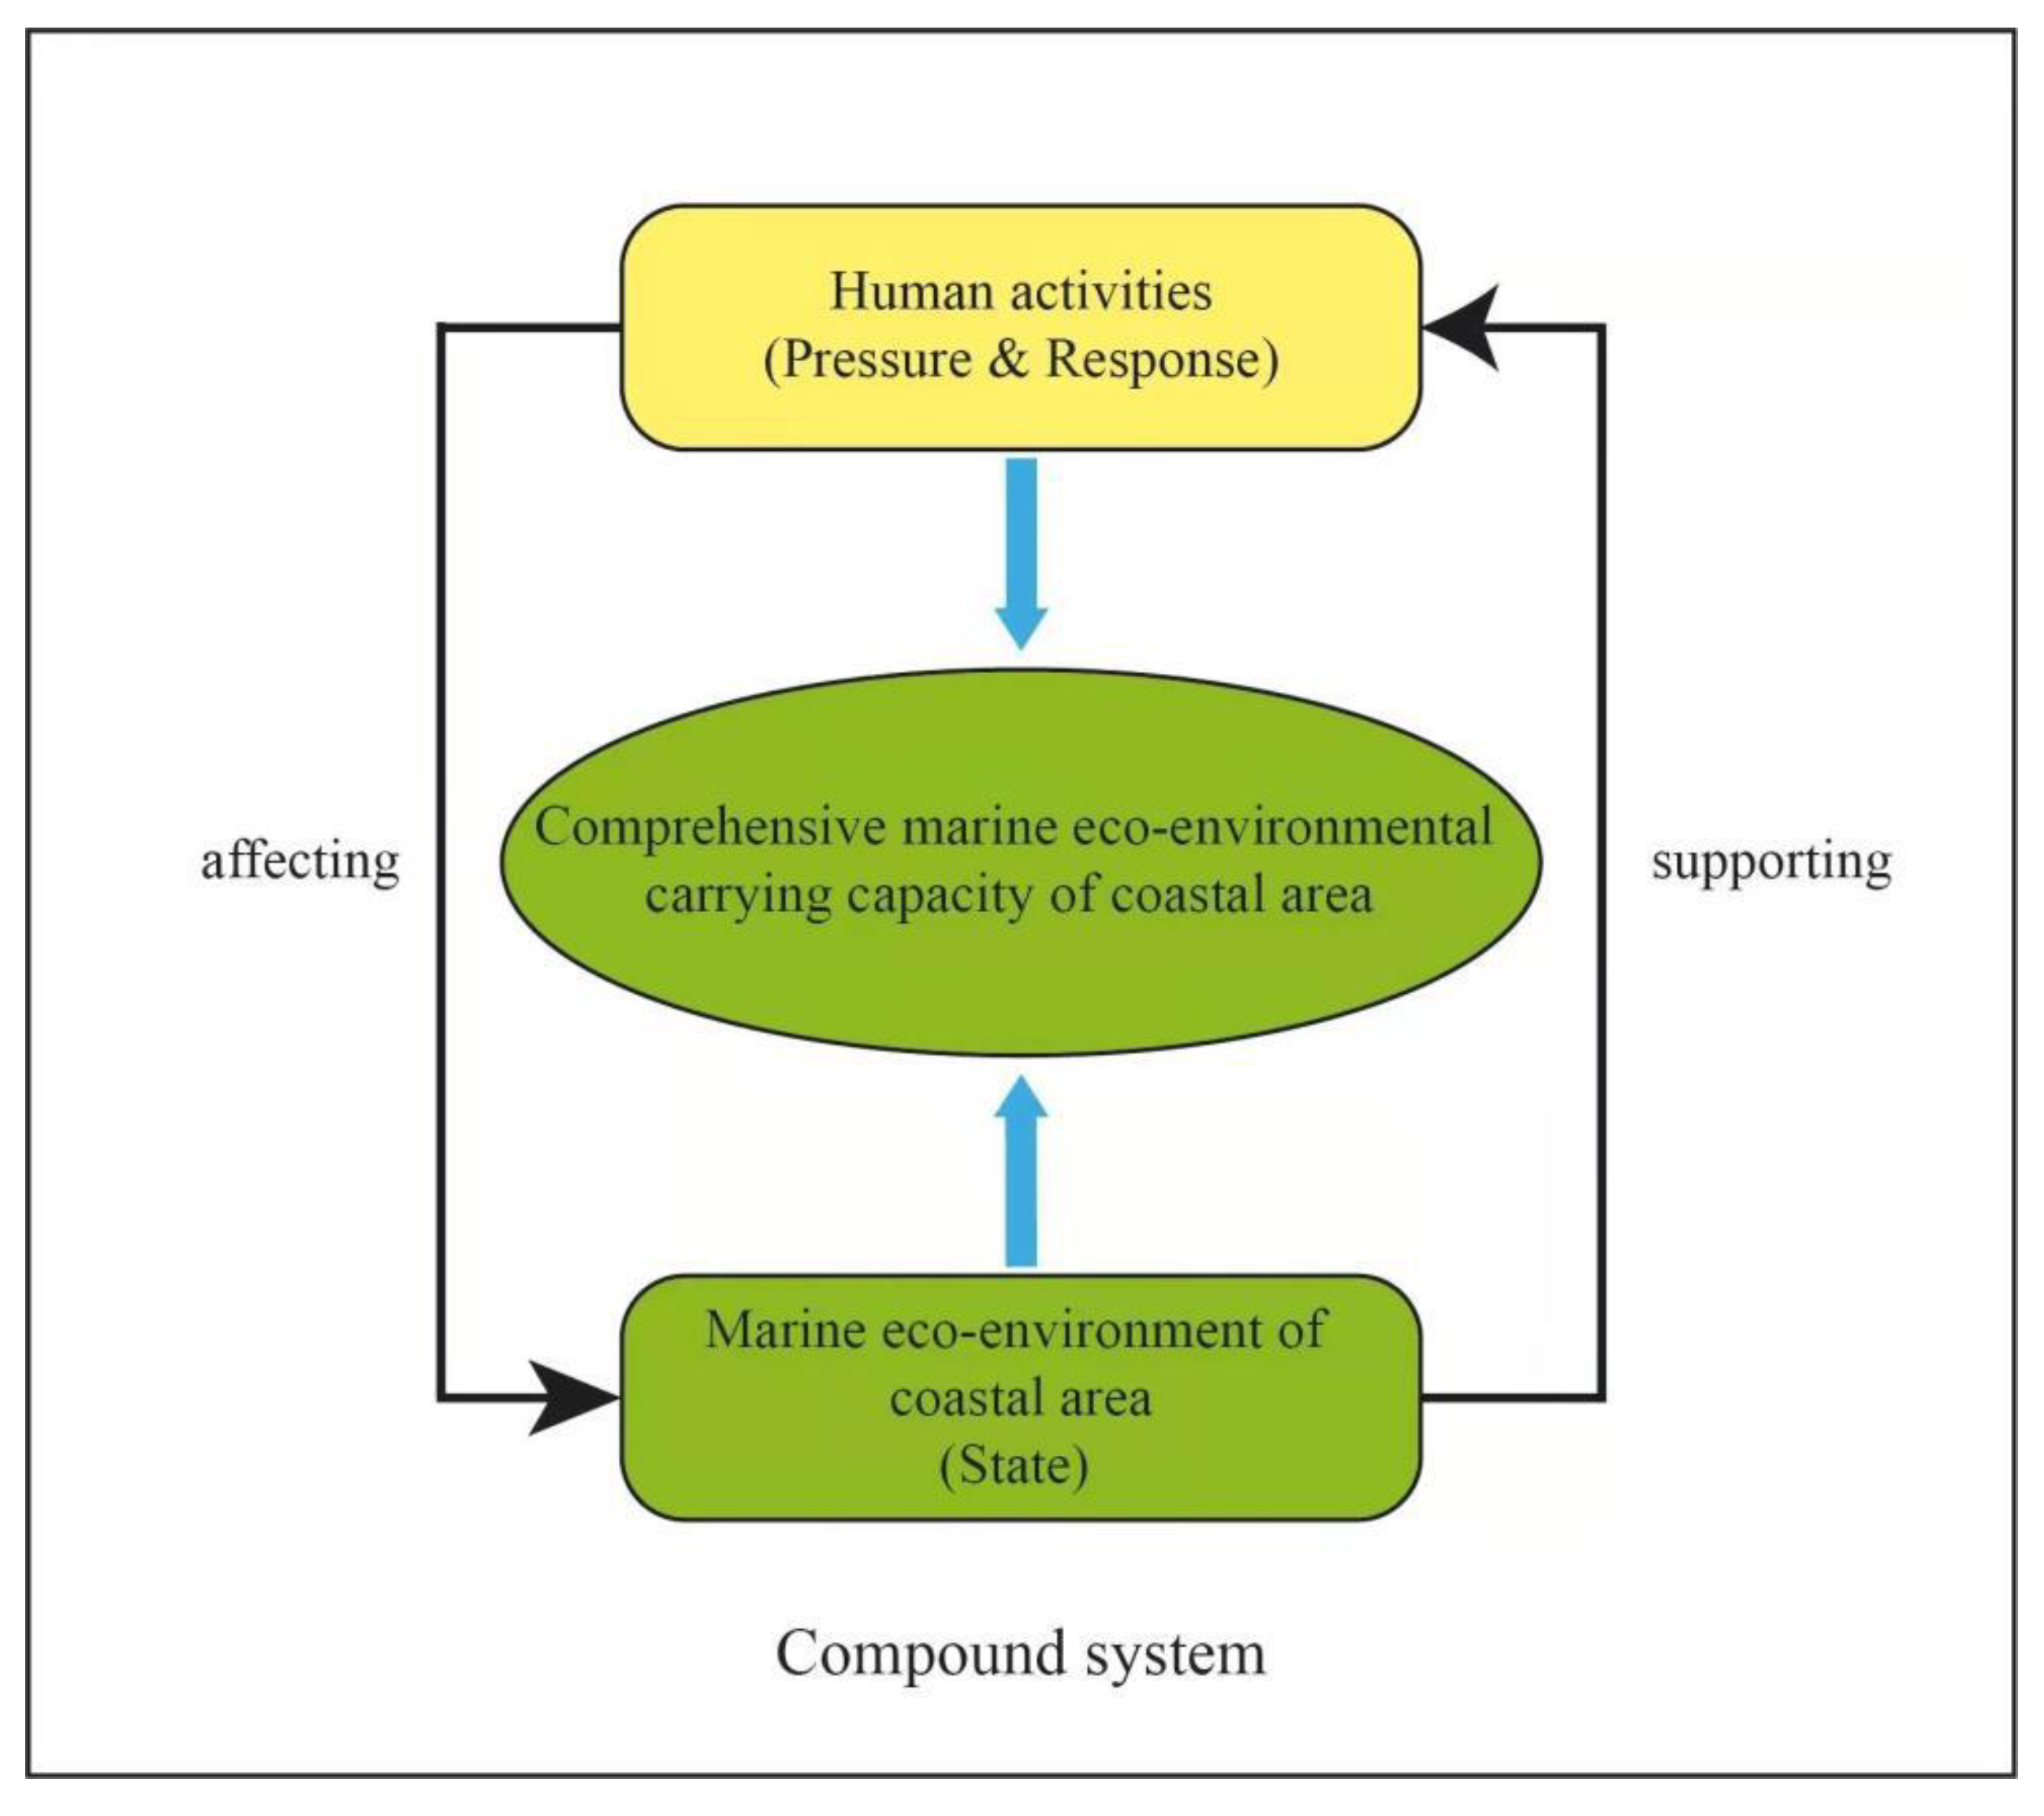
2.2.1. Step I: Framework for the Establishment of an Assessment Indicator System

When applying related evaluation methods, an assessment indicator system needs to be established. The most popular conceptual framework for carrying capacity, the pressure–state–response (PSR) model, was proposed by the Organization for Economic Cooperation and Development and has been widely applied in the field of environmental management over the past three decades [46,47,48]. The indicators typically include three aspects: the eco-environmental pressure, the socio-economic development status, and the response of humans and the ecosystem [46]. Notably, the European Environment Agency added the indicators “driving force” and “impact” to the PSR model thus creating the driving force–pressure–state–impact–response (DPSIR) model. The DPSIR model further enriches the content of the PSR model [49,50]. However, few studies have been conducted on how to find the accurate causality between all indicators, in part because of the complexity involved in the classification of assessment indicators using the DPSIR model [51,52].
The MECCCW conceptual framework has evolved from the PSR model [18] and now emphasizes that the two-way interplay between human activities and marine eco-environment conditions (Figure 2) should be taken into account. This conceptual framework has three elements [21]: environmental carrying capacity (ECC), ecological resilience (ER), and human activities (HA). The ECC represents the maximum discharge acceptability of environmental pollutants with specified quality standards in a certain area and corresponds to the “State” in the PSR model; ER represents the inherent self-maintenance and self-regulation ability of the marine ecosystem and also corresponds to the “State” in the PSR model; HA comprises two aspects, one of which represents the adverse impacts on the MECC arising from human exploitative activities (e.g., pollutant discharge, exceeding reclamation, etc.) and corresponds to the “Pressure” in the PSR model, while the other represents the corresponding management actions that are formulated by decision-makers to address the adverse impacts and corresponds to the “Response” in the PSR model.
Based on the MECCCW conceptual framework, the establishment of an assessment indicator system for MECCA is conceived as a combination of the target layer (i.e., the MECC index), the criterion layer (i.e., the indexes of ECC, ER, and HA), and the indicator layer (including some specific assessment indicators). The type of assessment indicator is typically identified by the “attribute context” and may result in the comparison of one “benefit indicator” (e.g., the disposal rate of urban sewage, etc.) defined as a positive effect with a corresponding “cost indicator” (e.g., the eutrophication index, etc.), which can be defined as a more negative effect [23].
As noted, the MECCCW conceptual framework considers not only the self-sustaining and regulating ability of the coastal eco-environment but also positive and negative feedbacks from human activities. Therefore, this framework could incorporate human, environmental, and ecological factors into the establishment process of the assessment indicator system as well as comprehensively reveal the explicit interconnected relationships between human activities and eco-environment conditions in coastal areas [21]. Moreover, the “dual role” of human activities could be well explained by distinguishing the implications of “pressure” (i.e., negative impacts) and “response” (i.e., positive impacts) in this framework. Hence, the study has used this framework to support the establishment of an indicator system.

2.2.2. Step II: Methods of Indicator Normalization and Weighting

The regularization method is often used as an analytical technique to normalize the initial data to hedge against the configurative situation of benefit (positive) and cost (negative) indicators with non-linear features [53]. This method is unnecessary for distinguishing between positive and negative indicators but can avoid the occurrence of a normalization value below zero when the assessment indicators present a nonlinear feature [54,55]. The formula for the regularization method is as follows [56]:
Z i j = / i = 1 k y i j 2   ( i = 1 ,   2 ,   ,   k )
where the parameter k represents the number of indicators, yij is the initial value of the ith indicator in the jth year, and Zij is the normalization value of yij.
The entropy weight method is a traditional and representative analytical tool for indicator weighting that has been widely applied in environmental management decision-making processes [38,40]. By representing all of the available information in terms of comentropy, this method determines weight based on the variant degree of each assessment indicator and can thus effectively avoid the influence of the analyzer’s preference [23,40]. Additionally, the calculation process for the entropy weight method is relatively simple, and the results of the weighting distribution are specific and explicit [22]. Hence, this method can be used to achieve more objective weight distribution results. The formulas of the entropy weight method are as follows [21,40]:
p i j = Z ij i = 1 n Z i j ( i = 1 ,   2 ,   ,   n ;   j = 1 ,   2 ,   ,   n )
e j = 1 / l n n i = 1 n p i j l n p i j
gj = 1 − ej(0 ≤ gj ≤ 1)
W j = g j / j = 1 m g j
where pij is the proportion of Zij (i.e., the normalization value of the ith indicator in the jth year) calculated by Formula (1), ej is the comentropy of each assessment indicator, the parameter n represents the number of samples (i.e., the number of statistic years), and gj is the variation coefficient indicating the importance of each indicator in the assessment indicator system. An indicator with a relatively higher gj value would have a strong impact on the MECC; Wj is the weight of each assessment indicator, and the definition of the parameter m is the same as that of the parameter k in Formula (1).

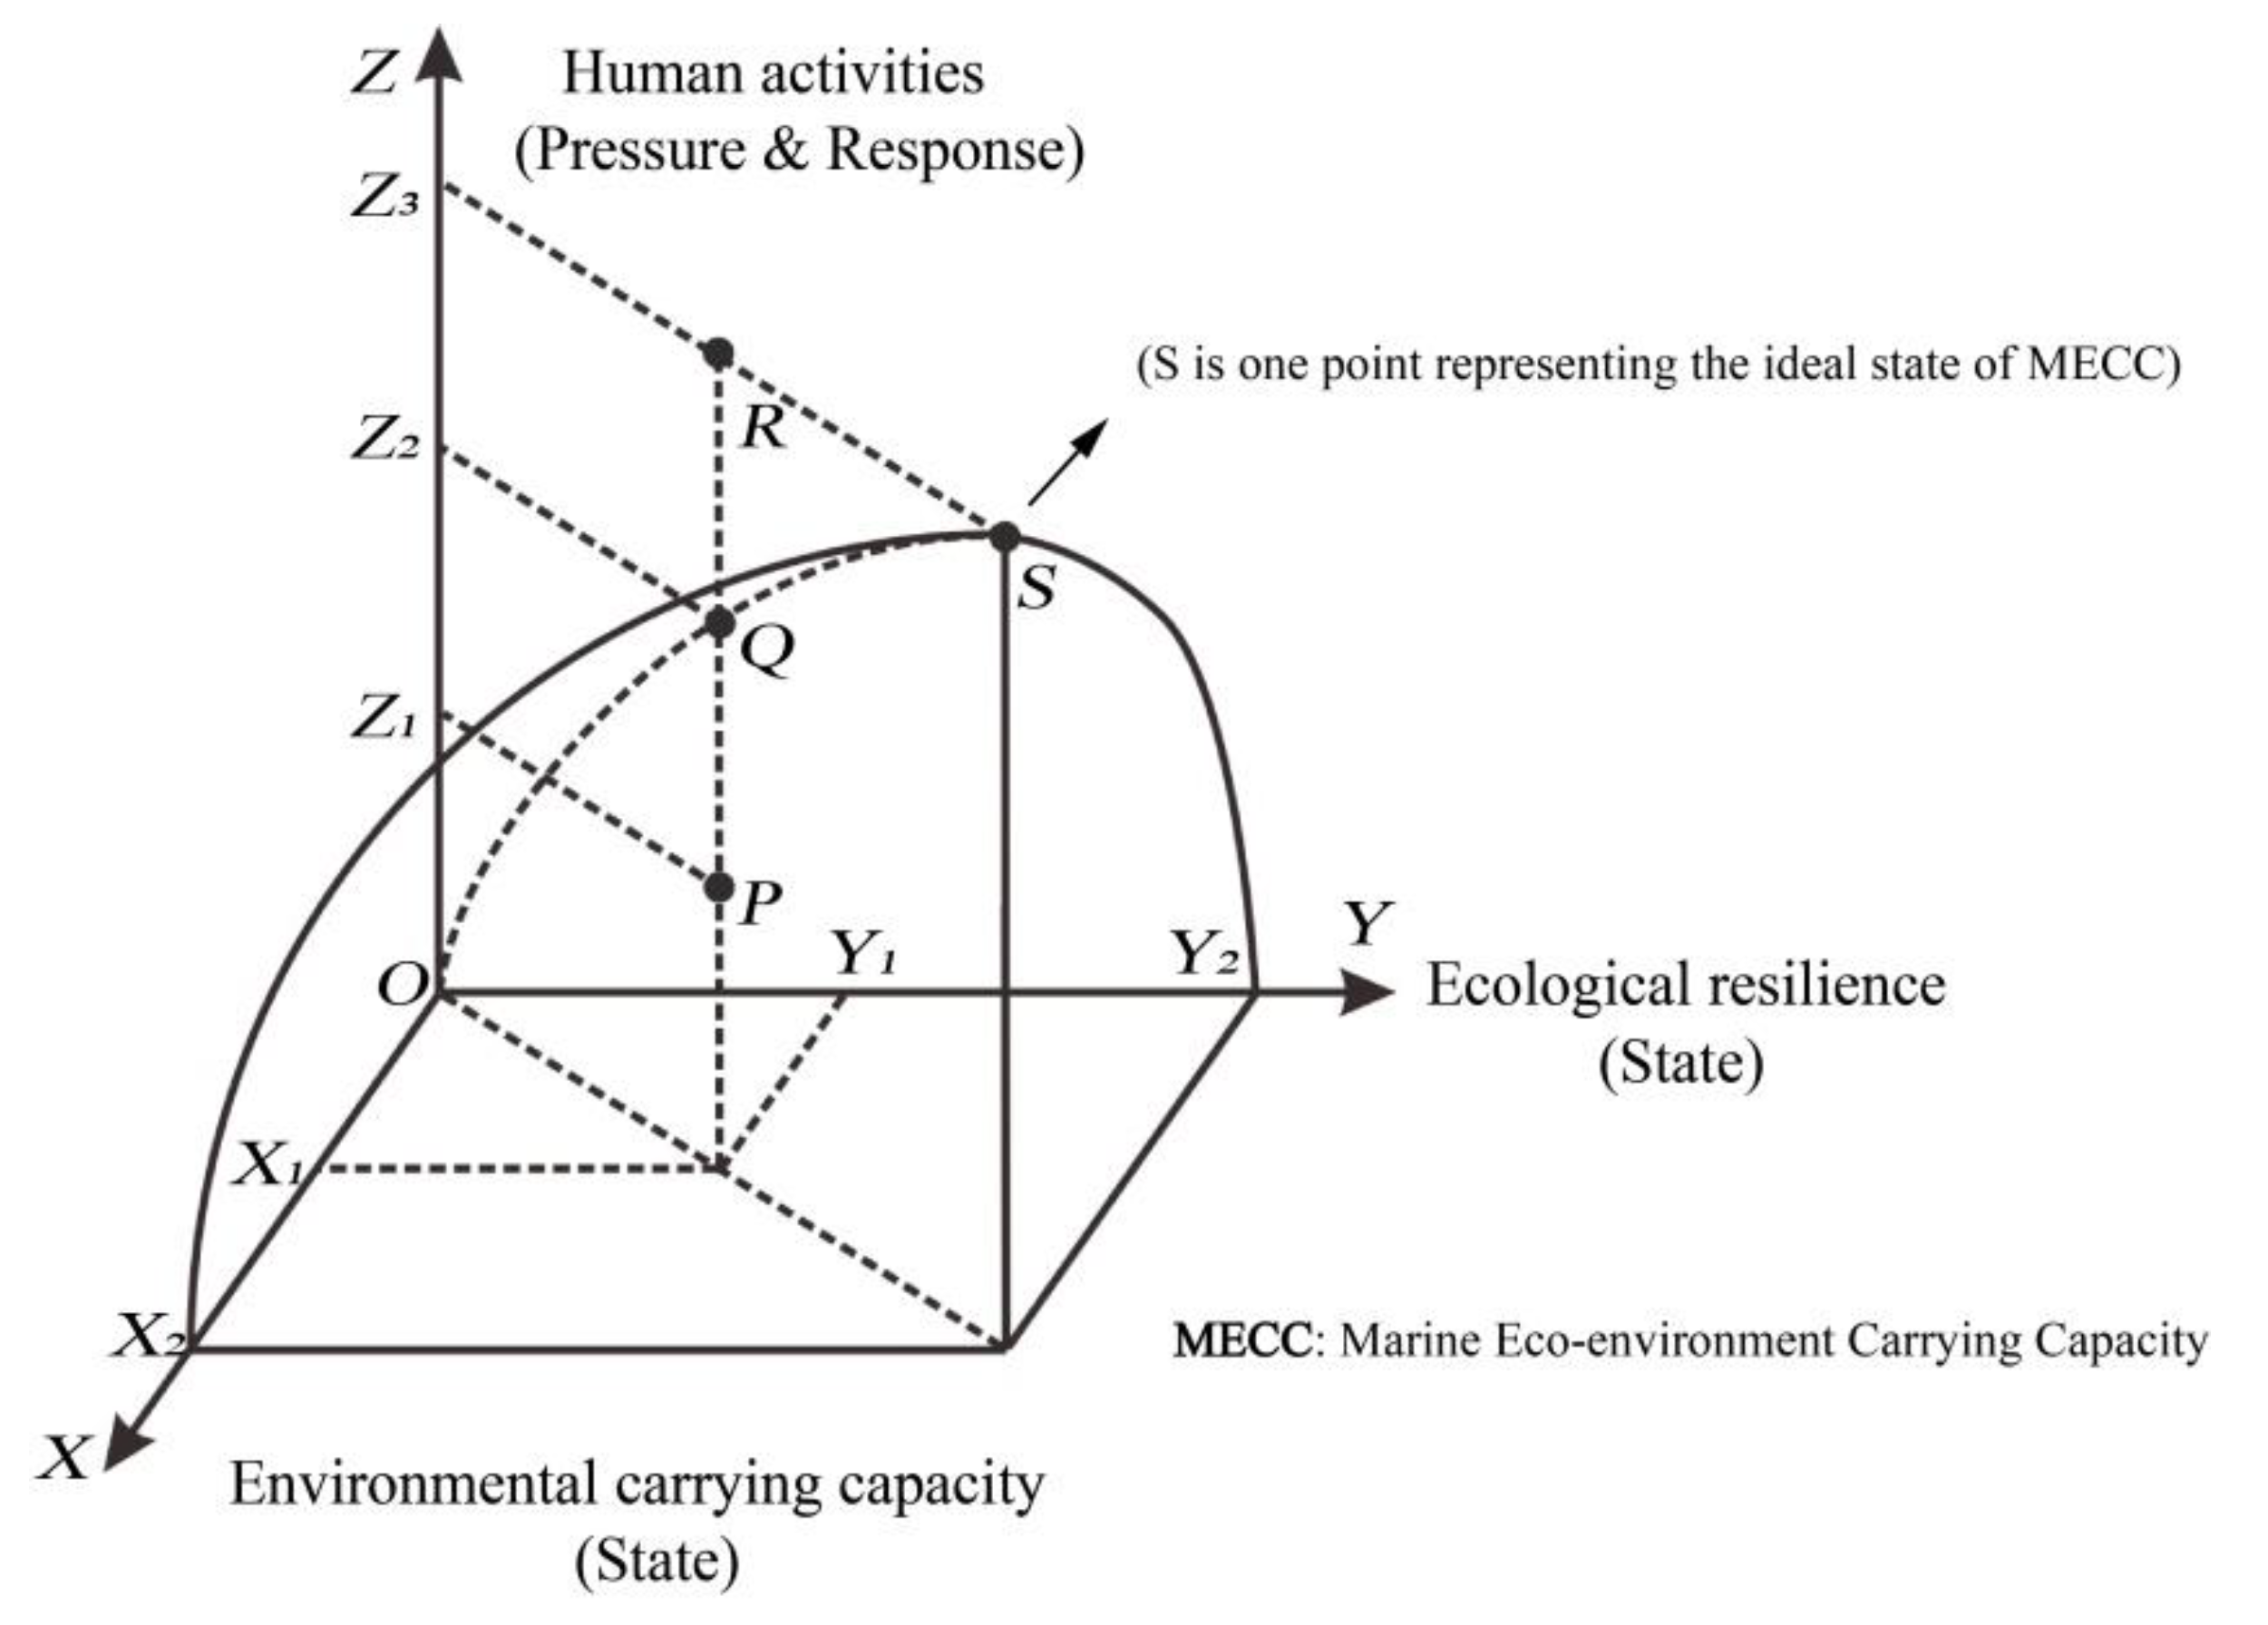
2.2.3. Step III: A Quantitative Analysis Method for MECCA

The state space model is an effective Euclidean space model method that can quantitatively describe the system state, where the three-dimensional state space axis is deemed to be an integrated combination to present the state vector of each element in the system [57,58,59]. Based on the MECCCW conceptual framework, the state space model for MECCA comprises the ECC, ER, and HA dimensions. The value of the MECC index is accounted for by the vector module from the origin point to the corresponding system state point and is represented as follows [22]:
MECC = | M | = i = 1 n w i v i r   2 2 ( i = 1 ,   2 ,   3 ,     n )
where |M| represents the actual MECC index, vir is the state space coordinate value of the corresponding assessment indicator for the ECC, ER, and HA dimensions, wi is the weight of the assessment indicator i, and the parameter n represents the number of assessment indicators. The results obtained using this model can be used as a basis to judge the carrying capacity state (i.e., load level, full-load level, or overload level), which is revealed by calculating the ratio of |M| to the ideal MECC index (i.e., |M|s, indicating that the MECC state is at full-load level) [21]. However, the determination of the |M|s value, which refers to the divergent standard for each assessment indicator in this model, is a complex issue [22]. Notably, there is currently no unified standard for each assessment indicator because of the distinctive regionality and ecosystem diversity of coastal areas [38,40], which may result in a complicated calculation process and relatively subjective outcome of |M|s.
We developed a modified model to simplify the calculation process of |M|s. The simplified state space model for the MECCA (Figure 3) assumes that the value of the vector module from the origin point to any point on the OQS curved surface is 1 (i.e., the ideal value of each assessment indicator after normalization is 1,1,1, …, n, and |M|s is 1). When the system state points inside the curved surface (e.g., the P point), on the curved surface (e.g., the Q or S point), or outside the curved surface (e.g., the R point), the state of the MECC is either load (i.e., |M| < 1), full load (i.e., |M| = 1), or overload (i.e., |M|>1). The simplified state space model avoids the difficulty of acquiring the large amounts of initial data required for the complicated process of integrated MECCA and overcomes the difficulty of determining the ideal MECC index value and the standard of each assessment indicator [22,60].

2.3. Data Collection

This study drew on five years of historical data and information related to MECCA, including information on the environment, ecology, and human activities in the coastal area of Sanya Bay.
Relevant statistical data and information were available on (1) the annual status quo of marine eco-environment conditions [61,62], e.g., water quality, pollutant content and distribution, sediment quality, distribution and area of important coastal habitats, etc.; (2) aspects of water quality monitoring [61,62], e.g., sewage outlet distribution, concentration of critical pollutants, flow quantity, and annual emissions of critical pollutant; (3) environmental and ecological risk [61], e.g., coastal erosion, and red tides; (4) related coastal development activities [62,63], e.g., coastal reclamation, marine aquaculture, and coastal tourism.
Other relevant data and information were used, such as related socioeconomic and environmental planning, an overview of social and economic development, the investment on environmental protection, and the amount of sewage disposal [64,65,66,67,68].

3. Results

3.1. Establishing an Assessment Indicator System

In Step I, the MECCCW conceptual framework was used to construct an assessment indicator system framework for the comprehensive marine eco-environmental carrying capacity of a coastal area (Figure 4).
Based on the MECCCW framework, common indicators were first selected from the relevant literature [15,23,28] taking into account the factors of human activities and eco-environmental conditions that affected the MECC of coastal areas. Secondly, we identified the main eco-environmental issues in Sanya Bay according to relevant data collections carried out in recent years [45,61,62,63,64,65,66,67,68], including increased discharge of land-sourced pollutants, deterioration of sea water quality, partial degradation of coral reef ecosystems, and increasing likelihood of red tide risk. Thirdly, we integrated the information on the actual situation in Sanya Bay with the advisory opinions of local experts and the responsible authorities and then selected the most relevant assessment indicators to determine the preferred alternative for the establishment of an assessment indicator system from an eco-environmental perspective. The assessment indicator system (Table 1) included a total of three criteria and eight assessment indicators.
The ECC indicators were factors that were related to the status quo of the natural environment and the state of the environmental capacity (e.g., water quality). The ER indicators represented the state of the marine ecosystem and its ability to defend against interference (e.g., crucial habit area and distribution). The HA indicators were factors that were related to the eco-environmental issues arising from human exploitation activities (e.g., pollutant discharge) as well as the response of humans to adverse eco-environmental impacts (e.g., policy making). These indicators can be briefly described as follows: (1) the eutrophication index is an important assessment indicator that reflects the degree of water pollution [69], where the utilization ratio of environmental capacity refers to the ratio of pollutant emission to the environmental capacity in a certain area and reflects the environment’s ability to accept pollutants [70]; (2) the coverage rate of the coral reef habitat is the coral reef area as a percentage of the total area, where a larger coral reef area indicates better marine biodiversity and ecosystem protection [71], while the red tide assessment index is an important parameter that directly reflects the changes in the ecosystem structure and function [72]; (3) at present, pollution discharge into the ocean (mainly arising from land-sourced production, human life, and marine aquaculture) is one of the greatest environmental concerns in Sanya Bay [61,62,63], where the total amount of pollution discharge into the ocean and the marine aquaculture area directly reflects eco-environmental pressures acting on Sanya Bay; (4) pollution control investment is a proportion of GDP, and the disposal rate of urban sewage represents the ability of human societies to respond to and control pollution and to improve eco-environment conditions when faced with eco-environmental issues [15,21].

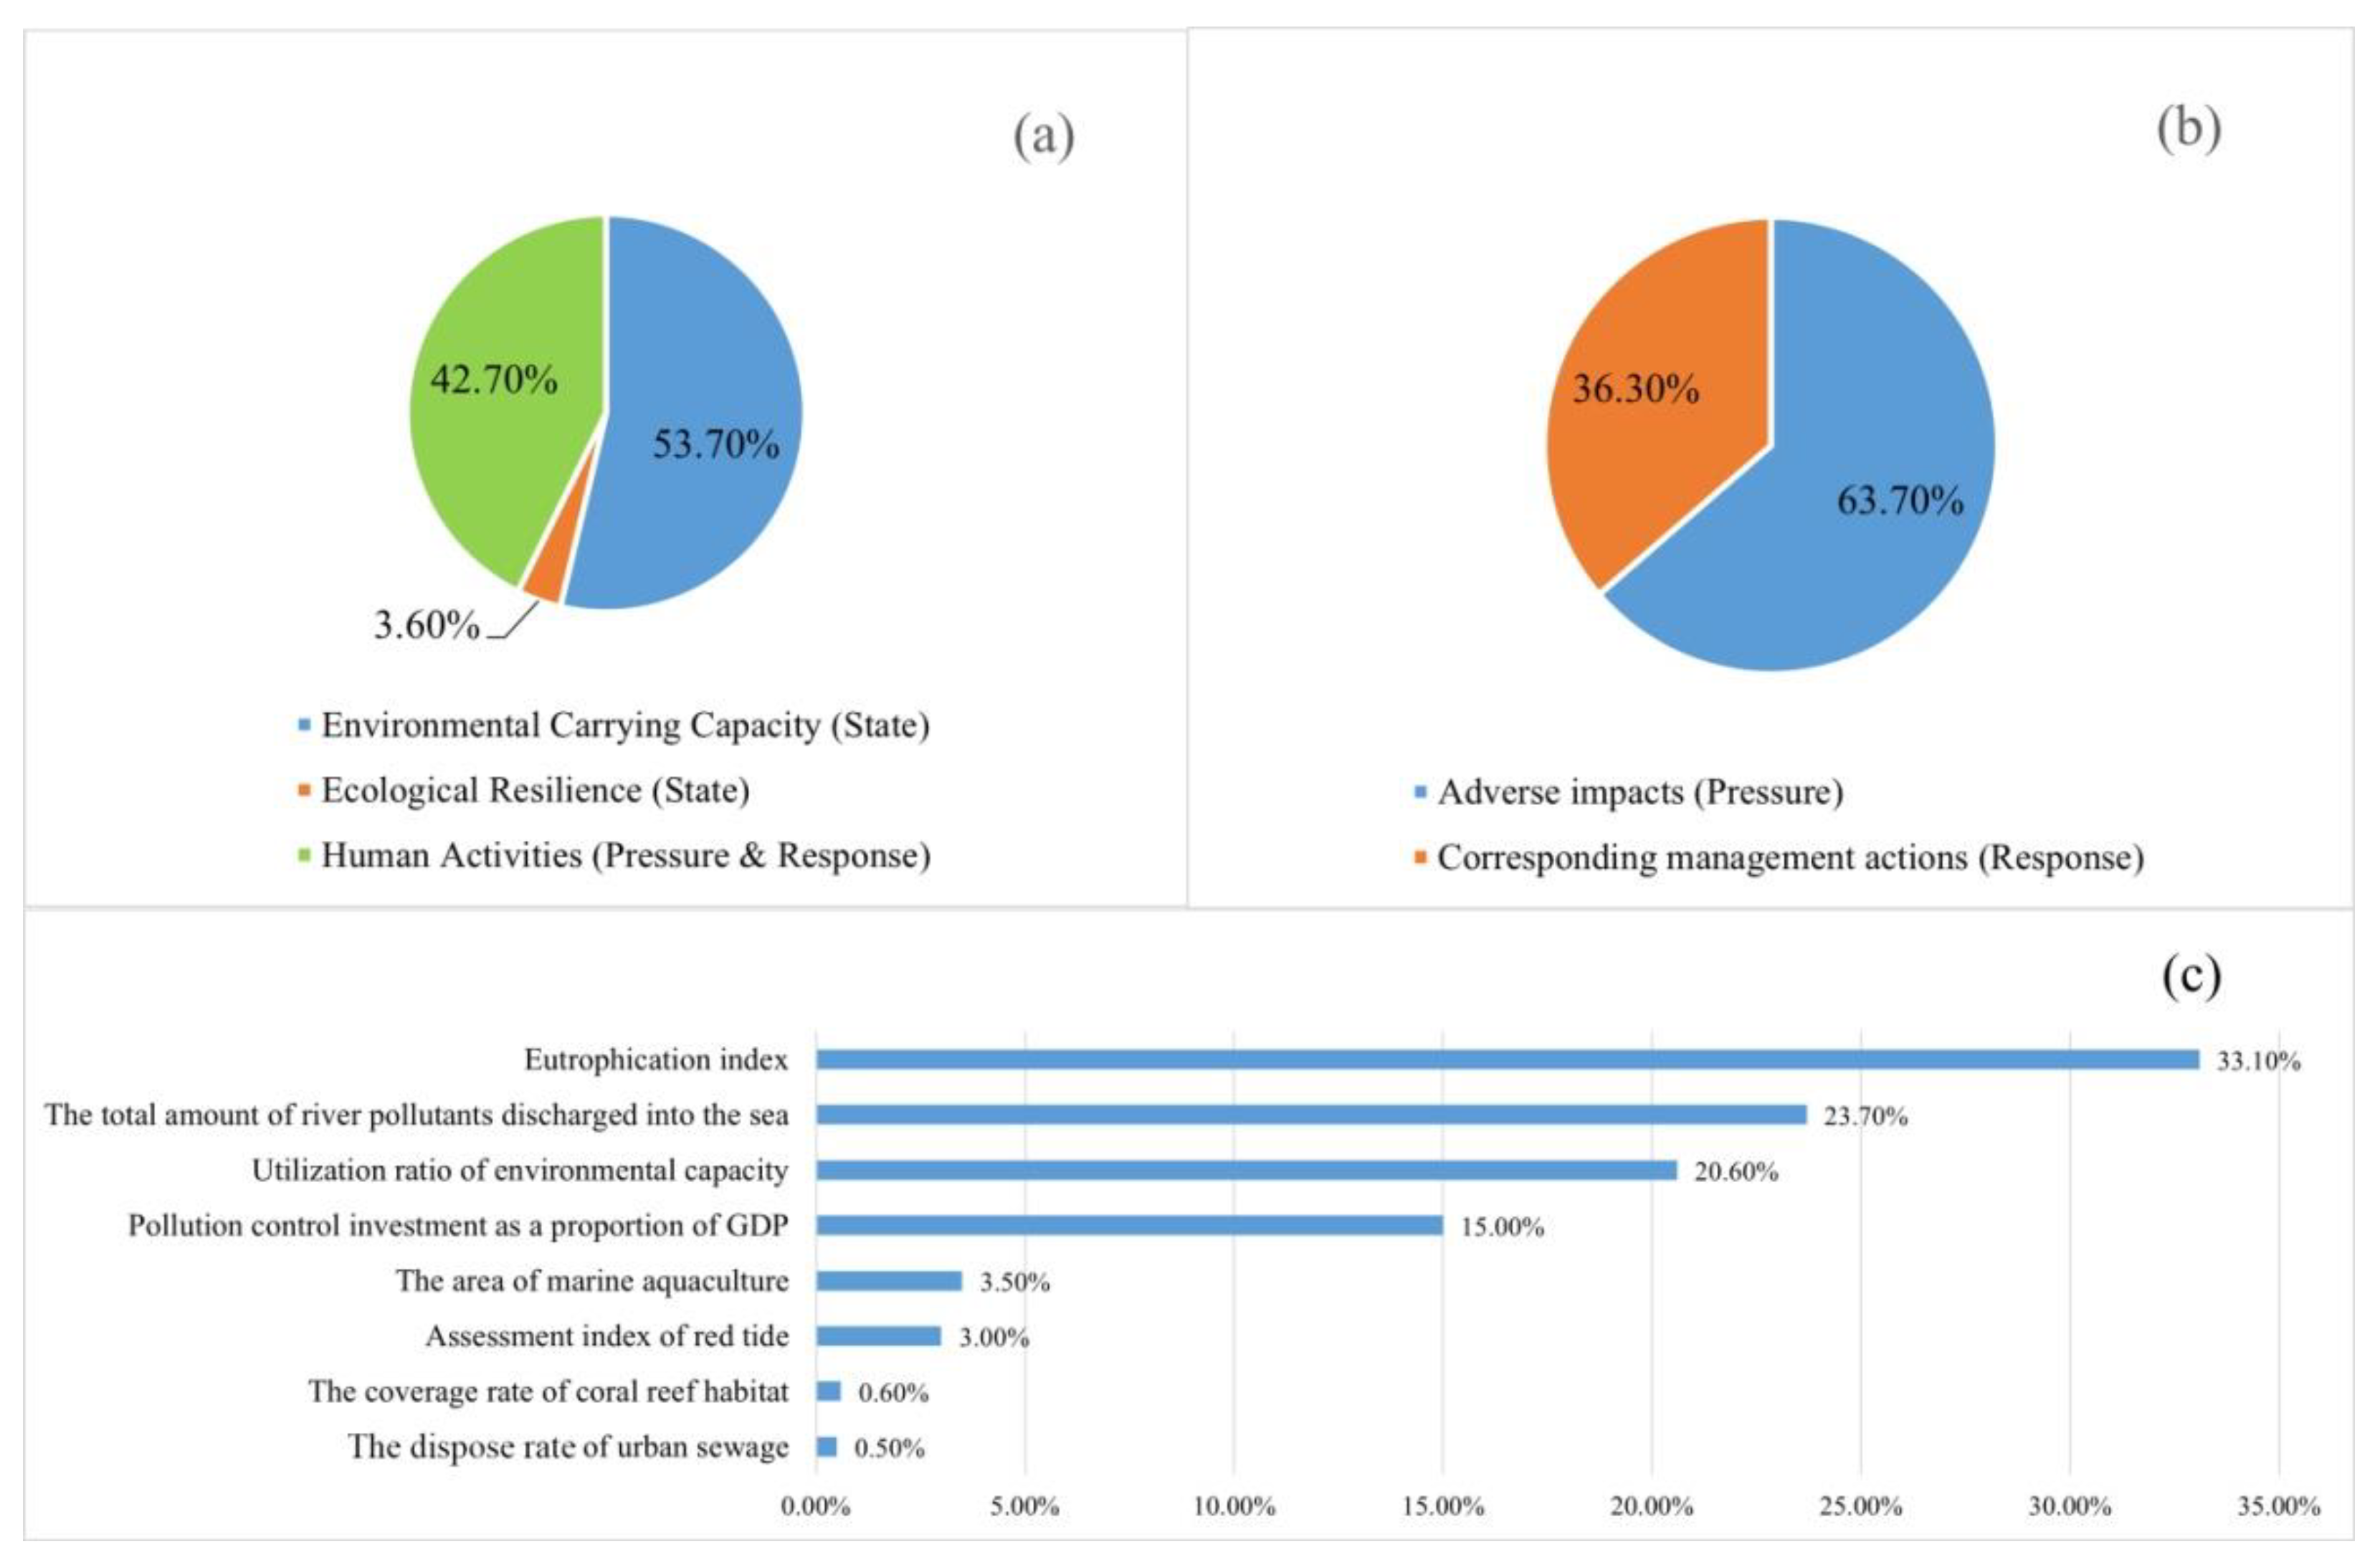
3.2. Calculation and Distribution of the Indicator Weight

After data collection, weights were attained using the regularization method and the entropy weight method (Table 1 and Figure 5).
The weighting results illustrate that (1) some of the indicators regarding coastal water quality (e.g., eutrophication index, total amount of river pollutants discharged into the ocean, and utilization ratio of the environmental capacity) had a great impact on the MECC, while the disposal rate of urban sewage had the smallest effect on the MECC; (2) the weight of the ECC with all of its associated assessment indicators and the weight of HA with most of its associated assessment indicators (except for “the disposal rate of urban sewage”) were both relatively higher than the ER. This indicated that either the EEC or the HA would have a greater effect on changes in the MECC state over the ER; (3) in terms of the HA criterion, “Pressure” had higher weight than “Response”. This indicated that the adverse impacts arising from human exploitation activities would have a greater effect on changes in the HA state than the related management actions.

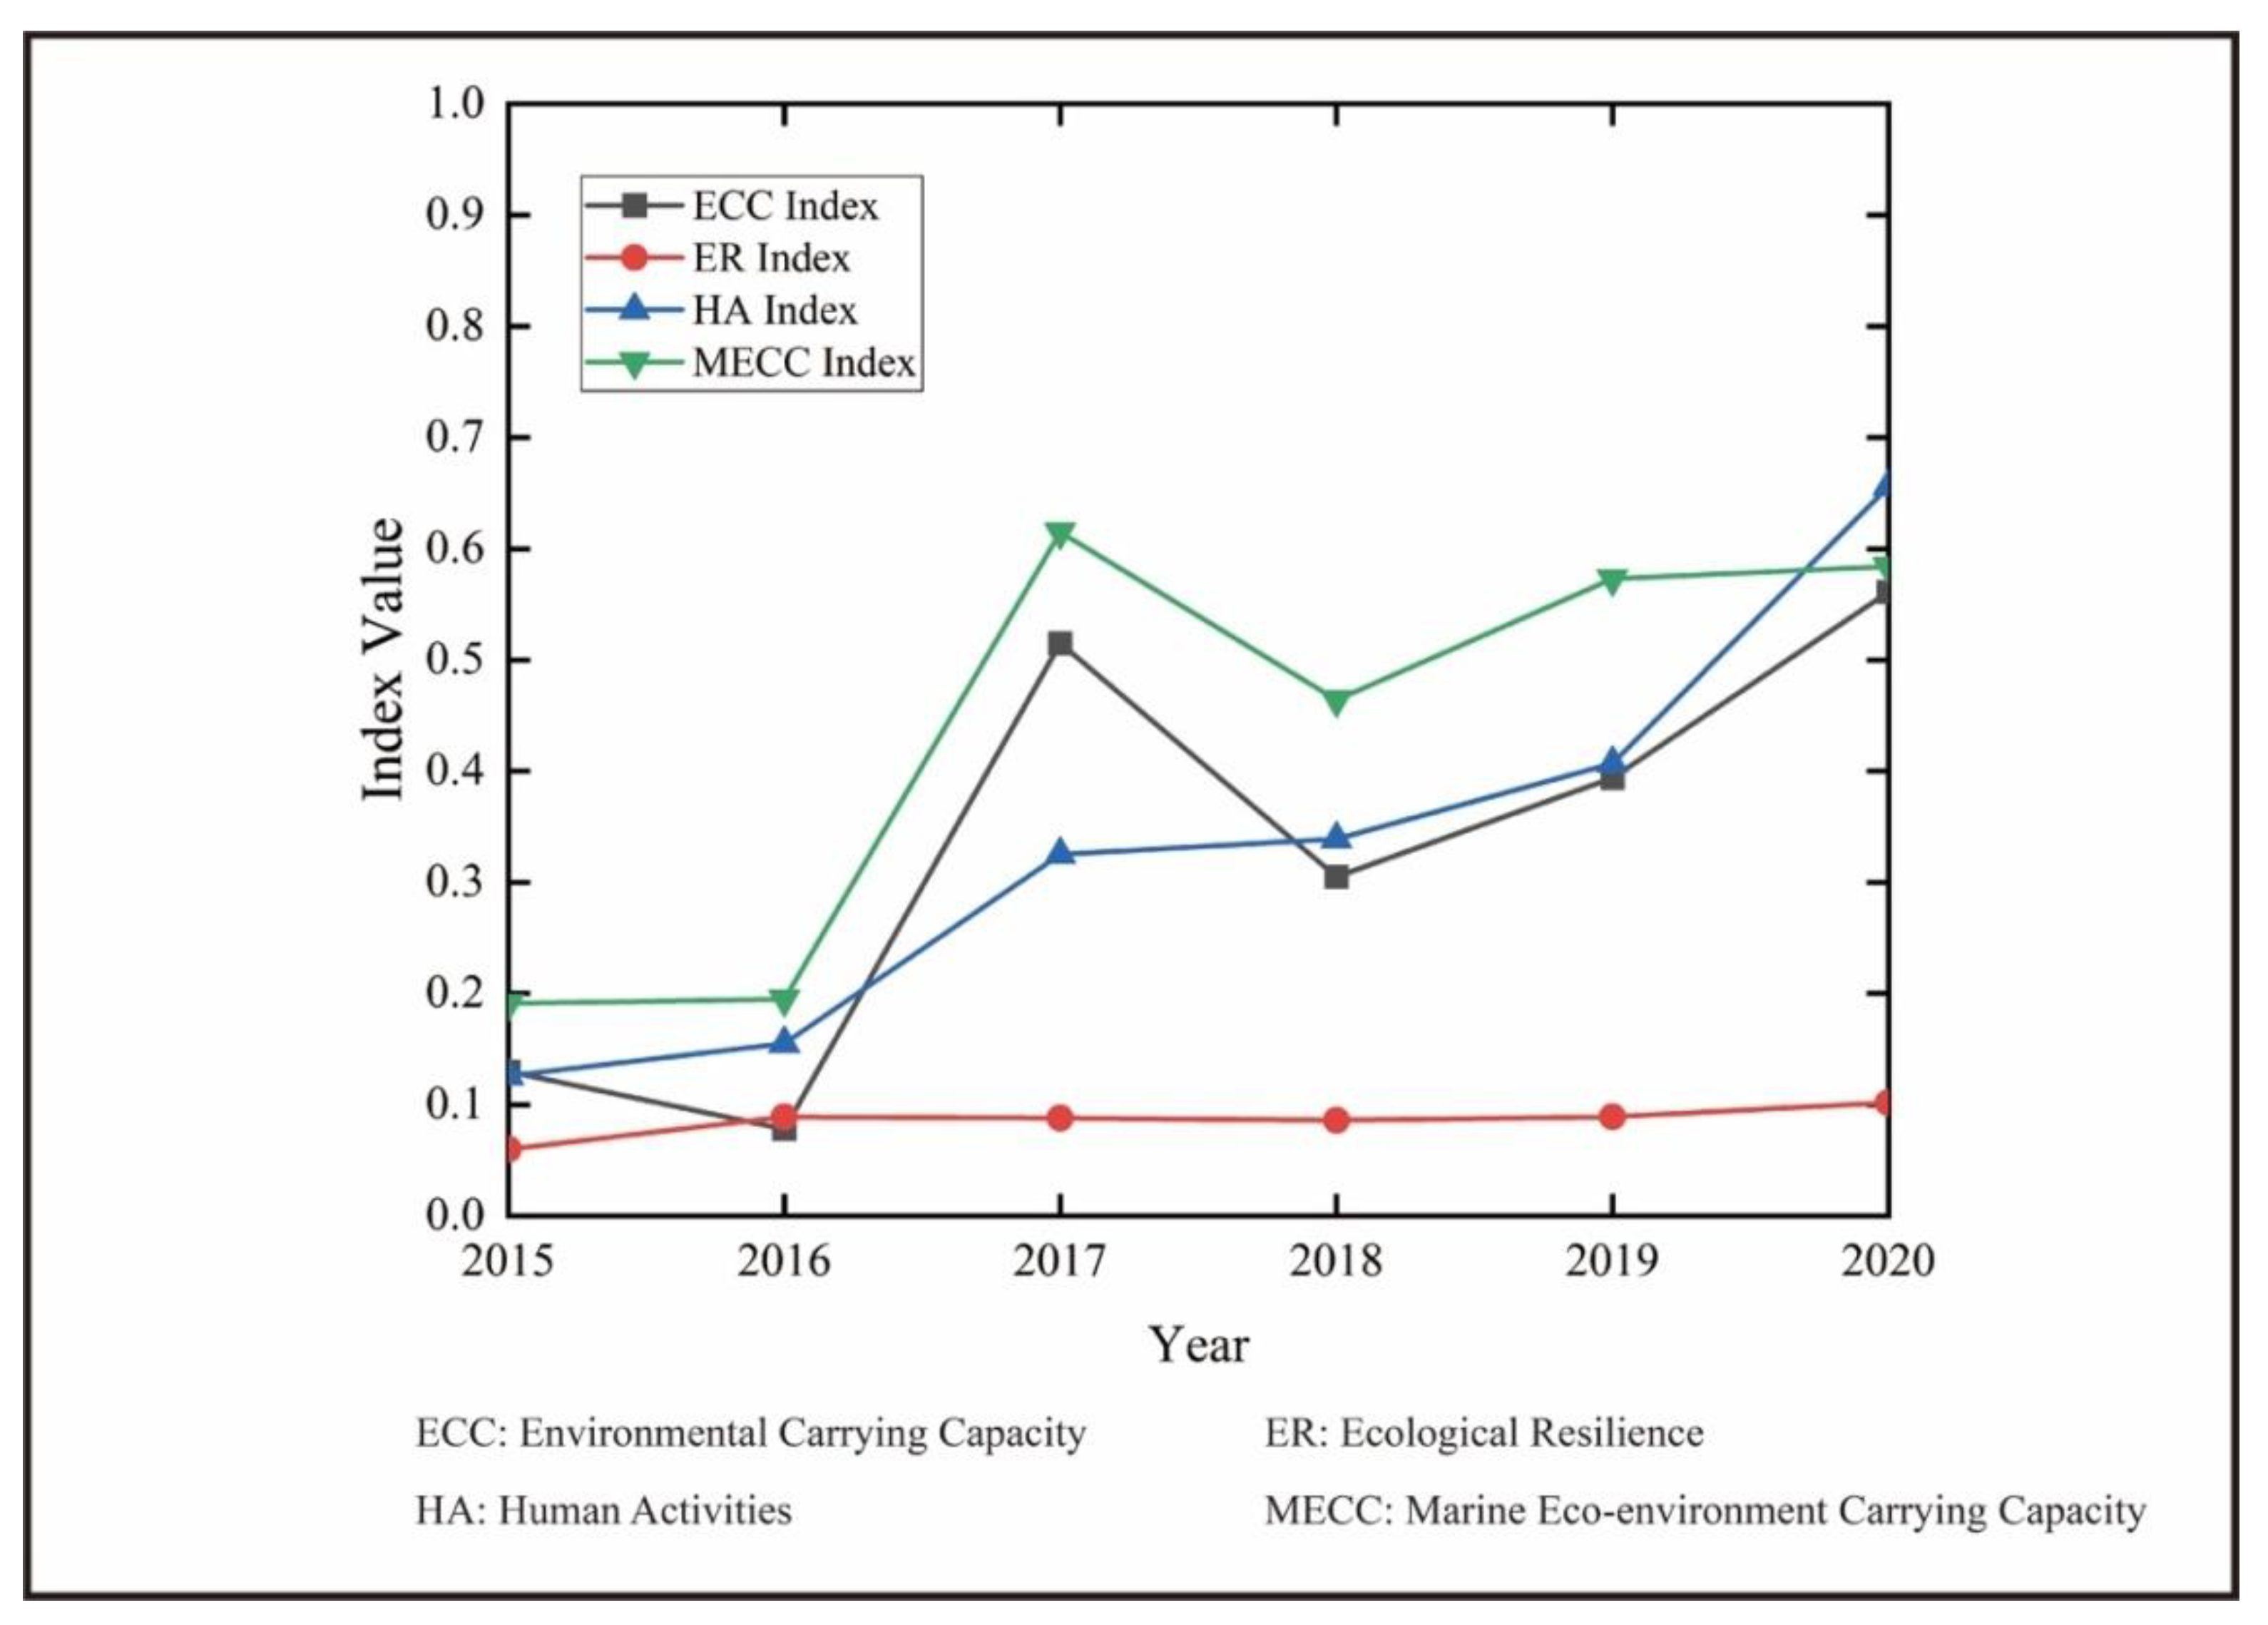
3.3. Comprehensive Evaluation of MECC

Based on the results in Table 1, the simplified state space model was applied in Step III to comprehensively evaluate and analyze the annual MECC index for Sanya Bay from 2015 to 2020. The assessment results (Table 2 and Figure 6) showed that (1) in terms of the target layer, the state of the Sanya Bay MECC was at the load level and showed a tendency to weaken, showing fluctuationsbetween2015 and 2020. The highest value of the MECC annual index (0.615) appeared in 2017 (i.e., the state of the MECC was at its lowest level in 2017), whereas the lowest value (0.191) appeared in 2015 (i.e., the state of the MECC was at its highest level in 2015); (2) from the perspective of each criterion, HA, ER, and ECC were also at load level from 2015 to 2020. Moreover, both of the annual indexes of EEC and HA had relatively higher values compared to the annual index of ER during the evaluation period from 2015 to 2020and showed similar trends to those observed in the assessment results of the MECC for Sanya Bay.

4. Discussion

4.1. Results Analysis

The results indicated that the increasing amounts of pollutant discharge arising from human activities may lead to a higher eutrophication index and a lower utilization ratio for environmental capacity when management actions (i.e., response aspect) are insufficient for managing undesirable impacts (i.e., pressure aspect).This explains why both annual indexes of ECC and HA in Sanya Bay clearly showed upward tendencies and fluctuations (i.e., the ECC and HA states tended to be weakened) during the evaluation period (Figure 6).
In recent years, historical reclamation activities (the reclamation activities of Sanya Bay have been subjected to strict restrictions since 2017) and increasing pollutant discharge have resulted in the slight degradation of the coral reef ecosystem and the occasional appearance of red tides in Sanya Bay [62]. Nevertheless, the annual ER index was still the highest of the three criteria in the assessment indicator system; it also did not show an apparent changing trend over the evaluation period (Figure 6). The analytical results for ER imply that there is a marine ecosystem with inherently high quality in Sanya Bay, which might be attributable to adequate self-maintenance and self-regulation abilities.
As a result of increasing pollutant discharge from the Sanya River, as well as the continued expansion of marine aquaculture in Sanya Bay [61,62,63], it is evident that the state of the MECC showed a weakening tendency from 2016 to 2017 (Figure 6). However, these adverse environmental impacts were alleviated by the high ER level together with the control of marine aquaculture and the increasing level of corresponding management actions [67,68], which improved Sanya Bay’s MECC state from 2017 to 2018.
Unlike the increased intensity of human exploitation after 2018, efforts toward eco-environmental protection in Sanya Bay remained at the prior levels [62,65,67,68]. This once again resulted in a weakening tendency of the MECC state of Sanya Bay from 2018 to 2020 (i.e., an increase in the value of the annual MECC index, as shown in Figure 6) when the existing management actions had difficulty in moderating undesirable impacts resulting from new eco-environmental problems. Our results indicate that an effective and timely response (e.g., an increase in the disposal rate of urban sewage, pollution control investment as a proportion of the GDP, etc.) to critical eco-environmental issues is crucial for alleviating or avoiding pressures (i.e., adverse eco-environmental consequences) arising from human activities, thus improving the future state of the MECC.

4.2. Proposed Corresponding Coastal Managing Measures

The assessment results indicate that the coastal eco-environmental management and sustainable development in Sanya Bay could be improved by taking the following actions:
(1) Strengthen pollutant discharge management to improve eco-environmental quality. After 2018, pollutant discharge increased year by year [61,62,63]. In the future, the government should improve the pollutant discharge supervision system and institutions (e.g., promoting and ensuring the implementation of “Three Control Lines and Environmental Admission List” in Sanya City), enhance environmental protection awareness of commercial enterprises, strictly manage the source of pollutants discharged directly into the ocean (especially in the Sanya River), control the scale of marine aquaculture and coastal reclamation, ensure that pollution discharge meets the standards, and reduce pollution discharge as much as possible. Relevant departments should continue their supervision to avoid a sudden increase in pollution discharge in a given year.
(2) Increase investments in environmental protection and enhance the level of pollution treatment. In recent years (i.e., after 2018), Sanya City has been financially inclined towards environmental protection, and efforts toward eco-environmental protection (e.g., pollution control investment as a proportion of the GDP and the disposal rate of urban sewage) remained at prior levels [62,65,67,68]. The government should continue to invest in environmental protection by increasing investments in pollutant control to improve water quality in all four regional watersheds (especially in the Sanya River), increasing other related environmental protection projects (e.g., mangrove planting), improving environmental protection facilities, and strengthening the technological support to improve the remediation and removal of pollutants, to further promote sustainable development.
(3) Maintain ecological health and establish contingency plans to help develop coastal risk-based planning and management. Due to prior coastal reclamation projects before 2017 and the current increases in pollutant discharge, slight degradation of the coral reef ecosystem and occasional red tides have occurred in some areas of Sanya Bay [62]. A healthy ecosystem is a prerequisite for an adequate carrying capacity [8,9]. Therefore, it is necessary to rationally develop and utilize environmental resources to prevent damage to the health of the coastal ecosystem. In addition, coastal risks (e.g., typhoon, red tide risk, oil spill risk) are highly uncertain and have adverse effects on MECC. Thus, attention should be paid, and precaution should be taken to minimize the coastal risks and formulate contingency plans to reduce possible losses.

4.3. Providing a Practicable Approach for Integrated MECCA in Coastal Areas

Considering the distinctive regionality and ecosystem diversity of coastal areas [7,38,39], it is a challenge to assess the MECC. Although prior related studies provided various referential methods for MECCA [21,73,74], the rationality and practicality of their applications in coastal areas still need further exploration and improvement.
The PSR model and the DPSIR model provide a framework for supporting the establishment of an assessment indicator system [22,23,49,50,74,75], but they both have difficulties in finding the accurate causality between all of the indicators, thus negatively impacting the rationality and pertinence of selected assessment indicators [51,52]. Compared with the above two models, the MECCCW conceptual framework model further describes the correspondences between three elements of the MECC (i.e., environmental carrying capacity, ecological resilience, and human activities) and three elements of the PSR model (i.e., pressure, state, and response) [21]. Therefore, it can assist with providing more explicit thinking for classifying the assessment indicatorsand better supportting the establishment of an assessment indicator system for MECC in coastal areas.
Currently, most studies commonlyuse the min–max method to normalize the assessment indicator [21,22,23,30,60,71,73]. However, in the case study of Sanya Bay, it was found that this method was not suitable for normalizing the initial data with non-linear features. Hence, we used the regularization method to deal with this issue. Meanwhile, although the analytic hierarchy process, expert judgment, and PCA are often used in the process of determining an indicator weight [21,22,60,71], subjectivity (e.g., analytic hierarchy process) and vagueness (e.g., PCA) of the weighting results by using these methods still exist. In the case study of Sanya Bay and other related studies [23,73,74], it was found that the entropy weight method not only could improve the disadvantages of the above weighting methods thus achieving more objective and explicit results of weight distribution, but also intuitively revealed the effect level of each indicator and allowed identifying the predomint impact factor on MECC by calculating the variation coefficient (i.e., gj in the Formula (4)) and the indicator weght.
Compared with other analytical methods for MECCA that were used in similar applications [14,23,30,31,35], it was found that the simplified state space model not only overcame the difficulties in the determination of the MECC ideal index value, but also avoided problems usually encountered in the MECC evaluation process using other analytical methods, such as the simplification of the assessment indicator (e.g., when using the ecological footprint method), the output of relatively subjective or incomplete evaluation results (e.g., when using the index evaluation method), the difficulty in acquiring large amounts of initial data required for the complicated process of integrated MECCA (e.g., when using the system dynamics method and the fuzzy comprehensive assessment model), and the difficulty of determining the standard for each assessment indicator (e.g., when using the matter-element extension method).
As noted, we selected the MECCCW conceptual framework model, the regularization method, the entropy weight method, and the simplified state space model to constitute a set of potential methods and offered insights for further improving the approach for integrated MECCA in coastal areas. The results of this case study application of Sanya Bay also proved that the set of potential methods was practicable for the integrated assessment of MECC in coastal areas.

5. Conclusions

Currently, most related or similar MECCA are concerned with terrestrial environments, and thus there is a lack of systematic research and applications focused on the combination of integrated MECCA with a unified method to support sustainable coastal development [20,21,22,23,76]. Thus, there is a need for methods that can support an integrated MECCA approach, similar to the one presented in this study, to develop informed analyses.
Taking the coastal area of Sanya Bay, southern China, as an example application, this study applied a set of potential methods for integrated MECCA to support: (1) the establishment of an assessment indicator system, (2) data normalization and weight calculation, and (3) MECC evaluation and analysis. The results demonstrated that the MECC of Sanya Bay from 2015 to 2020 was at load capacity and that both HA and ECC were the predominant impact factors for the changes observed in the MECC in Sanya Bay. Furthermore, the results offer insights that can guide coastal management decision making.
The case study of the coastal area of Sanya Bay provided valuable new perspectives on the strengths and limitations of the potential methods for integrated MECCA. First, the MECCCW conceptual framework provides an effective approach to comprehensively consider potential MECC impact factors, but there is still a lack of systematic research on how to apply related methods (e.g., sensitivity analysis, linear regression in the SPSS analysis software) to analyze (or evaluate) the process of selecting assessment indicators [21,22,41,71].The current processes for selecting assessment indicators are mostly based on expert judgment of anthropogenic pressure and degradation history in a study area [21,22,71,73]. Therefore, it is important to explore accurate and unified analytical approaches to ensure that future efforts result in an assessment indicator system that is more scientific, reasonable, and pertinent. Second, a simplified state space model can effectively avoid difficulties when determining the standard value of MECC as an assessment indicator [22,60]. Nevertheless, there is currently no systematic research and unified standard for determining the confidence interval of the MECC index value in this model framework [21,22,60]. This results in more uncertain descriptions of the MECC state that may not be specific enough to precisely classify its grading standard (e.g., extremely good, good, general, poor, very poor, when using the matter-element extension method) [30,73], especially at a much larger scale (e.g., regional level) and with a more complex coastal area (e.g., a semi-enclosed bay with several coastal subunits). Hence, there is a need to combine the SSS model with other related methods to explore a coupled model and thus apply it to a more scientific analysis of the MECC.
In summary, this study provides a potential integrated MECCA approach that could be used in coastal areas as well as empirical references for ensuring a sustainable coastal development. However, it still has several limitations, such as, mainly, the lack of authoritative and unified indicator systems, as well as specific rating standards. Future studies should focus on improving a scientific assessment system for MECC in coastal areas.

Author Contributions

K.W.: Conceptualization, Writing—original draft. K.C.: Writing—review and editing. Y.G.: Tables and illustrations production. S.J. and H.H.: Data collection and curation. All authors have read and agreed to the published version of the manuscript.

Funding

This work was supported by grants from [The Project Sponsored by the Scientific Research Foundation of Third Institute of Oceanography, Ministry of Natural Resources, P. R. China], grant number [2020008]; [The Project of Marine Protected Areas Network in China-ASEAN Countries], grant number [HX04-210901-21]; [The Project of Technical Standard System and Planning for Marine Ecological Restoration of Ministry of Natural Resources, P. R. China], grant number [HD01-210901-21]; [The Project of Marine Ecological Precaution and Monitoring of Ministry of Natural Resources, P. R. China–Research on Compensation Mechanism for Offshore Ecological Protection], grant number [HR04-220901-22]; and [The Pilot Project of Total Amount Control for Pollutant Discharge of the Sanya Bay], grant number [S200929].

Institutional Review Board Statement

Not applicable.

Informed Consent Statement

Not applicable.

Data Availability Statement

Not applicable.

Acknowledgments

The authors would like to thank colleagues who kindly helped with valuable suggestions and comments. We also gratefully appreciate the comments provided by anonymous reviewers.

Conflicts of Interest

The authors declare that they have no known competing financial interest or personal relationships that could have appeared to influence the work reported in this paper.

References

  1. Barbier, E.B.; Hacker, S.D.; Kennedy, C.; Koch, E.W.; Stier, A.C.; Silliman, B.R. The value of estuarine and coastal ecosystem services. Ecol. Monogr. 2011, 81, 169–193. [Google Scholar] [CrossRef]
  2. Seto, K.C. Exploring the dynamics of migration to mega-delta cities in Asia and Africa: Contemporary drivers and future scenarios. Glob. Environ. Chang. 2011, 21, 94–107. [Google Scholar] [CrossRef]
  3. Wang, G.; Fang, Q.; Zhang, L.; Chen, W.; Chen, Z.; Hong, H. Valuing the effects of hydropower development on watershed ecosystem services: Case studies in the Jiulong river watershed, Fujian province, China. Estuar. Coast. Shelf Sci. 2010, 86, 363–368. [Google Scholar] [CrossRef] [Green Version]
  4. Halpern, B.S.; Frazier, M.; Afflerbach, J.; Lowndes, J.S.; Micheli, F.; O’Hara, C.; Scarborough, C.; Selkoe, K.A. Recent pace of change in human impact on the world’s ocean. Sci. Rep. 2019, 9, 11–19. [Google Scholar] [CrossRef] [Green Version]
  5. Li, Y.F.; Xiang, Z.Y.; Chen, K.L.; Wang, X.Y. An improved spatial subsidy approach for ecological compensation in coastal seascapes for resilient land-sea management. J. Environ. Manag. 2020, 276, 111–120. [Google Scholar] [CrossRef] [PubMed]
  6. Bianco, F.; García-Ayllón, S. Coastal resilience potential as an indicator of social and morphological vulnerability to beach management. Estuar. Coast. Shelf Sci. 2021, 253, 107290. [Google Scholar] [CrossRef]
  7. Wu, K.K.; Zhang, L.P. Application of environmental risk assessment for strategic decision-making in coastal areas: Case studies in China. J. Environ. Plan. Manag. 2016, 59, 826–842. [Google Scholar] [CrossRef]
  8. Broman, G.I.; Robèrt, K.H. A framework for strategic sustainable development. J. Clean. Prod. 2017, 140, 17–31. [Google Scholar] [CrossRef]
  9. Navarro Jurado, E.; Tejada, M.; Almeida García, F.; Cabello González, J.; CortesMadas, R.; Delgado Pena, J.; Fernández Gutiérrez, F.; Guti´ errezFernández, G.; LuqueGallego, M.; MálvarezGarcía, G.; et al. Carrying capacity assessment for tourist destinations. Methodology for the creation of synthetic indicators applied in a coastal area. Tour. Manag. 2012, 33, 1337–1346. [Google Scholar] [CrossRef]
  10. Malthus, T. An Essay on the Principle of Population; Pickering: London, UK, 1798; pp. 154–196. [Google Scholar]
  11. United Nations Educational, Scientific and Cultural (UNESCO). Food and Agriculture Organization of the United Nations (FAO), 1985. Carrying Capacity Assessment with a Pilot Study of Kenya: A Resource Accounting Methodology for Sustainable Development; UNESCO: Paris, France; FAO: Rome, Italy, 2016; pp. 10–34. [Google Scholar]
  12. Smaal, A.; Prins, T.; Dankers, N. Minimum requirements for modeling bivalve carrying capacity. Aquat. Ecol. 1997, 31, 423–428. [Google Scholar] [CrossRef]
  13. Prato, T. Fuzzy adaptive management of social and ecological carrying capacities for protected areas. J. Environ. Manag. 2009, 90, 2551–2557. [Google Scholar] [CrossRef] [PubMed]
  14. Peng, B.; Li, Y.; Elahi, E.; Wei, G. Dynamic evolution of ecological carrying capacity based on the ecological footprint theory: A case study of Jiangsu province. Ecol. Indic. 2019, 99, 19–26. [Google Scholar] [CrossRef]
  15. Liu, R.; Pu, L.; Zhu, M.; Huang, S.; Jiang, Y. Coastal resource-environmental carrying capacity assessment: A comprehensive and trade-off analysis of the case study in Jiangsu coastal zone, eastern China. Ocean. Coast. Manag. 2020, 186, 50–62. [Google Scholar] [CrossRef]
  16. Millennium Ecosystem Assessment. Ecosystems and Human Well-Being: A Framework for Assessment; Island Press: Washington, DC, USA, 2005; pp. 25–36. [Google Scholar]
  17. Islam, R.; Khan, F.; Abbassi, R.; Garaniya, V. Human error assessment during maintenance operations of marine systems—What are the effective environmental factors? Saf. Sci. 2018, 107, 85–98. [Google Scholar] [CrossRef]
  18. Han, M.; Lu, G.; Shi, L.; Zhang, C.; Yu, H. Comprehensive carrying capacity assessment of Dongying coastal zone. ChinaPopul. Resour. Environ. 2017, 27, 9–13. [Google Scholar] [CrossRef]
  19. Chi, Y.; Shi, H.; Zheng, W.; Sun, J.; Fu, Z. Spatiotemporal characteristics and ecological effects of the human interference index of the yellow river delta in the last 30 years. Ecol. Indic. 2018, 39, 1219–1220. [Google Scholar] [CrossRef]
  20. Barbier, E.B.; Koch, E.W.; Silliman, B.R.; Hacker, S.D.; Wolanski, E.; Primavera, J.; Granek, E.F.; Polasky, S.; Aswani, S.; Cramer, L.A.; et al. Coastal ecosystem–based management with nonlinear ecological functions and values. Science 2008, 319, 321–323. [Google Scholar] [CrossRef]
  21. Li, Y.F. An Integrated Methodology for Assessment of Marine Eco-environment Carrying Capacity in Shandong Peninsula. Master’s Thesis, Institute of Oceanography, Chinese Academy of Sciences, Qingdao, China, 2014. [Google Scholar]
  22. Liu, J.Y.; Chen, S.D.; Jiang, T.J. Research on marine eco-environmental carrying capacity-a case study in eastern coast ocean of Shenzhen. Mar. Environ. Sci. 2017, 36, 560–565. [Google Scholar]
  23. Zheng, L.Y.; Bi, X.D.; Song, L.; Dong, S.J. Evaluation of marine ecological environment carrying capacity and obstacle diagnosis for Bohai Sea Ring Area of China based on entropy and catastrophe progression method. Mar. Sci. Bull. 2018, 37, 591–600. [Google Scholar] [CrossRef]
  24. United Nations. The Second World Ocean Assessment (World Ocean Assessment II). 2021. Available online: https://www.un.org/regularprocess/ (accessed on 21 April 2021).
  25. Lane, M. The carrying capacity imperative: Assessing regional carrying capacity methodologies for sustainable land-use planning. Land Use Policy 2010, 27, 1038–1045. [Google Scholar] [CrossRef] [Green Version]
  26. Smaal, A.C.; Schellekens, T.; Stralen, M.R.; Kromkamp, J.C. Decrease of the carrying capacity of the Oosterschelde estuary (SW Delta, NL) for bivalve filter feeders due to overgrazing? Aquaculture 2013, 40, 28–34. [Google Scholar] [CrossRef]
  27. Wang, S.; Ling, X.; Yang, F.; Wang, H. Assessment of water ecological carrying capacity under the two policies in Tieling city on the basis of the integrated system dynamics model. Sci. Total Environ. 2014, 47, 1070–1081. [Google Scholar] [CrossRef]
  28. Zhang, M.; Liu, Y.; Wu, J.; Wang, T. Index system of urban resource and environment carrying capacity based on ecological civilization. Environ. Impact Assess. Rev. 2018, 68, 90–97. [Google Scholar] [CrossRef]
  29. Shi, Y.; Shi, S.; Wang, H. Reconsideration of the methodology for estimation of land population carrying capacity in Shanghai metropolis. Sci. Total Environ. 2019, 652, 367–381. [Google Scholar] [CrossRef] [PubMed]
  30. Mou, S.; Yan, J.; Sha, J.; Deng, S.; Gao, Z.; Ke, W.; Li, S. A comprehensive evaluation model of regional water resource carrying capacity: Model development and a case study in Baoding, China. Water 2020, 12, 2637. [Google Scholar] [CrossRef]
  31. Zhang, F.; Ju, S.; Chan, N.W.; Ariken, M.; Tan, M.L.; Yushanjiang, A.; Wang, Y. Coupled analysis of new urbanization quality (NUQ) and eco-environmental carrying capacity (EECC) of prefecture-level and above cities in China during 2003–2016. Environ. Dev. Sustain. 2021, 23, 1–31. [Google Scholar] [CrossRef]
  32. McKindsey, C.W.; Thetmeyer, H.; Landry, T.; Slivert, W. Review of recent carrying capacity models for bivalve culture and recommendations for research and management. Aquaculture 2006, 261, 451–462. [Google Scholar] [CrossRef] [Green Version]
  33. Byron, C.; Link, J.; Costa-Pierce, B.; Bengtson, D. Calculating ecological carrying capacity of shellfish aquaculture using mass-balance modeling: Narragansett Bay, Rhode Island. Ecol. Modeling 2011, 222, 1743–1755. [Google Scholar] [CrossRef]
  34. Rios-Jara, E.; Galvan-Villa, C.M.; Rodriguez-Zaragoza, F.A.; Lopez-Uriarte, E.; Oz-Fernandez, M.T. The tourism carrying capacity of underwater trails in isabel island national park. Mex. Environ. Manag. 2013, 52, 335–347. [Google Scholar] [CrossRef]
  35. Zhang, Z.; Lu, W.X.; Zhao, Y.; Song, W.B. Development tendency analysis and evaluation of the water ecological carrying capacity in the Siping area of Jilin Province in China based on system dynamics and analytic hierarchy process. Ecol. Model. 2014, 275, 9–21. [Google Scholar] [CrossRef]
  36. Wang, M. The Study of Coupling Relationship between Marine Economic Development Potential and Marine Resources and Environment Carrying Capacity in the Coastal Areas of China. Master’s Thesis, Liaoning Normal University, Dalian, China, 2016. [Google Scholar]
  37. Xing, C.C.; Zhao, B.; Liu, N.N.; Liu, X.Q.; Sun, L.L.; Yang, K. The evaluation index system and the evaluation method of marine resource and environment carrying capacity in China. Ocean. Dev. Manag. 2019, 8, 33–35. [Google Scholar] [CrossRef]
  38. Wu, K.K.; Zhang, L.P.; Fang, Q.H. An approach and methodology of environmental risk assessment for strategic decision-making. J. Environ. Assess. Policy Manag. 2014, 16, 1–13. [Google Scholar] [CrossRef]
  39. Fang, Q.H.; Zhang, R.; Zhang, L.P.; Hong, H.S. Marine Functional Zoning in China: Experience and Prospects. Coast. Manag. 2011, 39, 656–667. [Google Scholar] [CrossRef]
  40. Hosseini, S.; Oladi, J.; Amirnejad, H. The evaluation of environmental, economic and social services of national parks. Environ. Dev. Sustain. 2021, 23, 9052–9075. [Google Scholar] [CrossRef]
  41. Wong, H.; Hu, B.Q. Application of improved extension evaluation method to water quality evaluation. J. Hydrol. 2014, 50, 539–548. [Google Scholar] [CrossRef]
  42. Daily, G.C.; Ehrlich, P.R. Socioeconomic equity, sustainability, and earth’s carrying capacity. Ecol. Appl. 1996, 6, 991–995. [Google Scholar] [CrossRef]
  43. Meng, F.; Guo, J.; Guo, Z.; Lee, J.C.K.; Liu, G.; Wang, N. Urban ecological transition: The practice of ecological civilization construction in China. Sci. Total Environ. 2021, 755, 142–156. [Google Scholar] [CrossRef]
  44. Che, Z.W.; Che, Z.S.; Li, G. Investigation and evaluation on environmental quality in Sanya Bay. J. Hainan Norm. Univ. 2009, 22, 70–82. [Google Scholar] [CrossRef]
  45. Li, L.; Li, Z.Z. Research progress on coastal geomorphology and sedimentary environment of Sanya Bay in Hainan. Open J. Nat. Sci. 2016, 4, 392–400. [Google Scholar] [CrossRef]
  46. Walz, R. Development of environmental indicator system: Experiences from Germany. J. Environ. Manag. 2000, 25, 613–623. [Google Scholar] [CrossRef]
  47. Qu, Y.B.; Zhu, W.Y.; Yun, W.J.; Zhang, Y.; Gao, Y. Land consolidation spatial pattern and diagnosis of its obstacle factors based on pressure-state-response model. Trans. Chin. Soc. Agric. Eng. 2017, 33, 241–248. [Google Scholar]
  48. Hazbavi, Z.; Sadeghi, S.H. Watershed health assessment using the pressure–state–response (PSR) framework. Land Degrad. Dev. 2020, 31, 3–19. [Google Scholar] [CrossRef]
  49. Lin, T.; Xue, X.Z.; Lu, C.Y. Analysis of Coastal Wetland Changes Using the “DPSIR” Model: A Case Study in Xiamen, China. Coast. Manag. 2007, 35, 289–303. [Google Scholar] [CrossRef]
  50. Sarmadi, H.; Salehi, E.; Kusari, N. The mega city of tehran water quantity assessment based on dpsir model. J. Phys. Conf. Ser. 2021, 18, 34–47. [Google Scholar] [CrossRef]
  51. Cao, H.J. An initial study on DPSIR model. Environ. Sci. Technol. 2005, 28, 109–113. [Google Scholar] [CrossRef]
  52. Malmir, M.; Javadi, S.; Moridi, A.; Neshat, A.; Razdar, B. A new combined framework for sustainable development using the dpsir approach and numerical modeling. Geosci. Front. 2021, 14, 260–273. [Google Scholar] [CrossRef]
  53. Lukas, M.A. Regularization Method. In Encyclopedia of Environmetrics; El-Shaarawi, A.H., Piegorsch, W.W., Eds.; John Wiley & Sons, Ltd.: New York, NY, USA, 2006; pp. 281–304. [Google Scholar] [CrossRef]
  54. Sohn, H. Effects of environmental and operational variability on structural health monitoring. Philos. Transactions. Math. Phys. Eng. Sci. 2007, 365, 539–560. [Google Scholar] [CrossRef]
  55. Boysen, A.K.; Heal, K.R.; Carlson, L.T.; Ingalls, A.E. Best-matched internal standard normalization in liquid chromatography-mass spectrometry metabolomics applied to environmental samples. Anal. Chem. 2017, 33, 1363–1369. [Google Scholar] [CrossRef]
  56. Doherty, J.; Skahill, B.E. An advanced regularization methodology for use in watershed model calibration. J. Hydrol. 2006, 327, 564–577. [Google Scholar] [CrossRef]
  57. Tan, Y.Y. Carrying Capacity of Marine Resource, Ecology and Environment and Its Application in Bohai Bay Rim. Ph.D. Thesis, Ocean University of China, Qingdao, China, 2010. [Google Scholar]
  58. Hunter, M.D. State Space Modeling in an Open Source, Modular, Structural Equation Modeling Environment. Struct. Equ. Model. 2017, 25, 307–324. [Google Scholar] [CrossRef]
  59. Cross, L.; Cockburn, J.; Yue, Y.; O’Doherty, J.P. Using deep reinforcement learning to reveal how the brain encodes abstract state-space representations in high-dimensional environments. Neuron 2020, 109, 568–570. [Google Scholar] [CrossRef] [PubMed]
  60. Xu, D.L.; Li, Y.Q. Marine eco-environmental carrying capacity assessment based on state-space method. Stat. Decis. Mak. 2013, 18, 56–60. [Google Scholar] [CrossRef]
  61. DEEHP (Department Ecology and Environment of Hainan Province). Regional Spatial Eco-Environment Assessment and "Three Control Lines and Environmental Admission List” in Sanya City. 2019. Available online: http://hnsthb.hainan.gov.cn/xxgk/0200/0202/hjywgl/hjyxpj/201903/t20190308_2401882.html (accessed on 10 January 2019).
  62. SCEEB (Sanya City Ecology and Environment Bureau). Marine Ecology and Environment Status Bulletin in Sanya City (2015–2020). 2020. Available online: http://hbj.sanya.gov.cn/sthjsite/zjgbxx/202106/289b859dbe59473fbb6d4be6163d1fe6.shtml (accessed on 6 June 2021).
  63. TPGSC (The People’s Government of Sanya City). Aquaculture Waters and Mudflat Planning in Sanya City (2018–2030). 2018. Available online: http://www.sanya.gov.cn/sanyasite/zfwj/201809/679f2be791774b3e8ec6263b09a228a1.shtml (accessed on 18 August 2019).
  64. SCEEB (Sanya City Ecology and Environment Bureau). The “13rd Five-Year Plan” of Ecological Construction and Environmental Protection of Sanya City. 2018. Available online: http://hbj.sanya.gov.cn/sthjsite/jhghxx/202112/966cad0c22424fe3bf901ec2986eb30c.shtm (accessed on 6 December 2018).
  65. SCSB (Sanya City Statistical Bureau). Yearbook of Sanya City (2015–2020); China Statistics Press: Beijing, China, 2020.
  66. TPGSC (The People’s Government of Sanya City). The “13rd Five-Year Plan” for the Development of Sanya’s Marine Economy. 2016. Available online: http://www.sanya.gov.cn/sanyasite/szfwjxx/201605/26e3235d3eff42808ed8b46fa0ae1ea9.shtml (accessed on 13 May 2016).
  67. TPGSC (The People’s Government of Sanya City). Sanya Ecological Civilization Construction and Development Plan (2018–2025). 2019. Available online: http://www.sanya.gov.cn/sanyasite/szfwjxx/201909/cf4c2434a6094528bc222b8d8bf87d52.shtml (accessed on 19 September 2019).
  68. TPGSC (The People’s Government of Sanya City). Statistical Bulletin of National Economic and Social Development in Sanya City (2015–2020); China Statistics Press: Beijing, China, 2020.
  69. Oberholster, P.J.; Madlala, T.; Blettler, M.; Amsler, M.L.; Botha, A. An eutrophication index for lowland sandy rivers in Mediterranean coastal climatic regions of Southern Africa. River Res. Appl. 2019, 36, 35–40. [Google Scholar] [CrossRef]
  70. Du, W.; Wang, F.; Li, M. Effects of environmental regulation on capacity utilization: Evidence from energy enterprises in China. Ecol. Indic. 2020, 11, 106–117. [Google Scholar] [CrossRef]
  71. Ma, Y.Y.; Zhang, Q.F.; Chen, Y.Z.; Tu, J.B.; Sun, H.; Bo, W.J.; Gao, W.S. The exemplary verification and amendment suggestion of the index system and evaluation method of marine resources and environment carrying capacity monitoring and early-warning—A case study of Hangu Sea Area of Tianjin. Ocean. Dev. Manag. 2018, 11, 52–57. [Google Scholar] [CrossRef]
  72. Bricker, S.B.; Ferreira, J.G.; Simas, T. An integrated methodology for assessment of estuarine trophic status. Ecol. Model. 2003, 169, 39–60. [Google Scholar] [CrossRef] [Green Version]
  73. Zhao, Y.; Xue, X.Z.; Huang, Y.; Kong, H. Evaluating comprehensive carrying capacity of coastal area using the matter-element extension method: A case study in Fujian Province of China. Ocean. Coast. Manag. 2021, 214, 21–31. [Google Scholar] [CrossRef]
  74. Su, Z.L.; Yuan, G.H.; Hao, Q. Carrying capacity assessment of marine ecological environment based on entropy method-A case study of coastal waters of Guangxi Province. Nat. Resour. Econ. China 2018, 31, 13–19. [Google Scholar] [CrossRef]
  75. Wei, C.; Guo, Z.Y.; Wu, J.P.; Ye, S.F. Constructing an assessment indices system to analyze integrated regional carrying capacity in the coastal zones-a case in Nantong. Ocean. Coast. Manag. 2014, 93, 51–59. [Google Scholar] [CrossRef]
  76. Heron, E.; Heron, R.; Taylor, L.; Lundquist, C.J.; Greenaway, A. Remaking ocean governance in Aotearoa New Zealand through boundary-crossing narratives about ecosystem-based management. Mar. Policy 2020, 122, 2–22. [Google Scholar] [CrossRef]
Figure 1. Location of the Sanya Bay.
Sustainability 14 04416 g001
Figure 2. Interactions between marine eco-environment conditions and human activities. Note that the human activities, pressure, state, and response portrayed in this figure are representative examples and thus are by no means exhaustive and definitive.
Sustainability 14 04416 g002
Figure 3. Simplified state space model for MECCA. For instance, S is one of the points on the curved surface, and the value of the vector OS is 1 (i.e., |OS| =1) in this model.
Sustainability 14 04416 g003
Figure 4. Framework of assessment indicator system for the comprehensive eco-environmental carrying capacity of a coastal area. This framework was constructed based on the MECCCW conceptual framework.
Sustainability 14 04416 g004
Figure 5. Differences in the weight proportion of each criterion and assessment indicator of the MECCA for Sanya Bay. (a) Weight proportion of ECC, ER, and HA; (b) weight proportion of adverse impacts (pressure) and corresponding management actions (response) in HA; (c) weight proportion of each assessment indicator in descending order. Here, the weight proportion is used to intuitively describe the importance of each criterion and assessment indicator in the changes of the MECC state.
Sustainability 14 04416 g005
Figure 6. Changing trends in the annual index values of ECC, ER, HA, and MECC in Sanya Bay from 2015 to 2020. The indexes include ECC index, ER index, HA index, and MECC index.
Sustainability 14 04416 g006
Table 1. Assessment indicator system of MECCA and its weight distribution for Sanya Bay.
Target
Layer
Criterion LayerWeight of Each CriterionIndicator LayerWeight of Assessment IndicatorIndicator Type
MECCECCState0.537Eutrophication index0.331Negative
Utilization ratio of environmental capacity0.206Negative
ERState0.036Coverage rate of coral reef habitat0.006Positive
Assessment index of red tide0.030Positive
HAPressure0.272Total amount of river pollutants discharged into the sea0.237Negative
Area of marine aquaculture0.035Negative
Response0.155Pollution control investment as a proportion of the GDP0.150Positive
Disposal rate of urban sewage0.005Positive
Note: ECC is environmental carrying capacity; ER is ecological resilience; HA is human activities; MECC is marine environmental carrying capacity; GDP is gross domestic product.
Table 2. Temporal changes in the annual index values of ECC, ER, HA, and MECC forSanya Bay from 2015 to 2020.
YearAnnual Index
Value of ECC
Annual Index
Value of ER
Annual Index
Value of HA
Annual Index Value of MECC
20150.1300.0600.1260.191
20160.0780.0890.1550.195
20170.5150.0880.3250.615
20180.3050.0860.3390.464
20190.3940.0890.4070.573
20200.5160.1020.6560.584
Note: ECC is environmental carrying capacity; ER is ecological resilience; HA is human activities; MECC is marine eco-environmental carrying capacity.
Publisher’s Note: MDPI stays neutral with regard to jurisdictional claims in published maps and institutional affiliations.

