Abstract
In the past few decades, many non-invasive monitoring methods have been developed based on body acoustics to investigate a wide range of medical conditions, including cardiovascular diseases, respiratory problems, nervous system disorders, and gastrointestinal tract diseases. Recent advances in sensing technologies and computational resources have given a further boost to the interest in the development of acoustic-based diagnostic solutions. In these methods, the acoustic signals are usually recorded by acoustic sensors, such as microphones and accelerometers, and are analyzed using various signal processing, machine learning, and computational methods. This paper reviews the advances in these areas to shed light on the state-of-the-art, evaluate the major challenges, and discuss future directions. This review suggests that rigorous data analysis and physiological understandings can eventually convert these acoustic-based research investigations into novel health monitoring and point-of-care solutions.
1. Introduction
Human body organs and mechanisms generate acoustic signals, including sounds and vibrations, that propagate through the surrounding tissues and reach the body surface. On the body surface, these signals can be measured and monitored noninvasively by acoustic sensors such as microphones, accelerometers, and gyroscopes. They can contain information about the normal or abnormal activity of their sources, i.e., the organs or mechanisms that generated them. For instance, cardiovascular or respiratory-induced sounds can be monitored using a stethoscope on the chest’s surface [1]. Any cardiovascular or respiratory abnormalities may alter these sounds on the chest, e.g., by changing the sound signals at their origin or the material properties of the tissues that the signals pass through. The variations of these signals can be investigated in order to detect and identify the abnormality (Figure 1). Advancements in wearables and sensing technology, coupled with the developments in computing, signal processing, and machine learning methods have enabled the long-term, real-time measurement and analysis of these signals even outside of healthcare facilities, which may result in the earlier diagnosis of diseases and the timely referral of the patients to their caregivers.
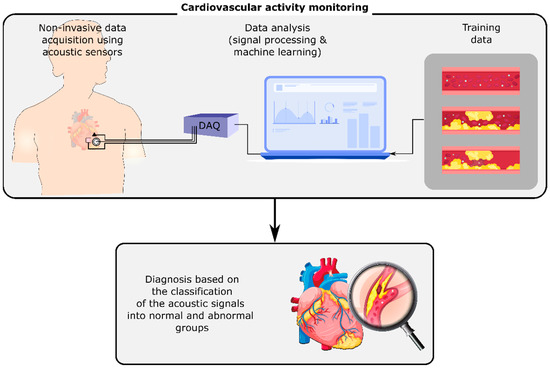
Figure 1.
Cardiovascular activity monitoring using the non-invasive measurement of acoustic signals on the chest’s surface. The analysis of these signals using digital signal processing and machine learning methods can identify cardiovascular conditions such as stenosis and aneurysm.
This paper reviews the diagnosis and monitoring methods that are being developed based on body acoustics for different types of medical conditions. An in-depth and comprehensive search of the Web of Knowledge, Embase, and MEDLINE databases was carried out with the combination of the following terms: “sound”, “vibration”, “acoustics”, “cardiovascular system”, “circulatory system”, “gastrointestinal system”, “digestive system”, “nervous system”, “respiratory system”, and “noninvasive diagnosis”, from 1980 to 2021. As a result, the following general categories were selected to be included in this review: cardiovascular diseases, respiratory illnesses, gastrointestinal diseases, and nervous system disorders. Such a review of the state-of-the-art provides a larger picture of the current challenges and potential future directions of the acoustic-based point of care diagnosis methods. Our review suggests that biomedical acoustic signals have a high potential to detect different types of medical conditions, especially by the remote monitoring of patients and high-risk individuals. However, there are still open questions and challenges that hinder the translation of these methods from a research interest to a powerful and reliable clinical monitoring tool.
2. Cardiovascular Diseases
One in every four Americans dies due to cardiovascular diseases (CVDs) every year, which makes CVDs the leading cause of death in the United States [2]. The earlier detection of the potential signs of the disease would make early treatments possible, and may prevent subsequent cardiovascular complications [3]. Despite many efforts, the development of novel robust diagnosis methods is still an urgent need for the earlier detection of many types of CVDs. This may become possible through the more-frequent evaluation of the patient’s status, for example, by low-cost user-friendly remote monitoring methods that can be used outside of the healthcare facilities. The current commercial remote monitoring devices are mainly based on electrocardiography (ECG). However, some CVDs such as structural abnormalities in heart valves may not be clearly seen in the ECG signal because they do not change the electrical depolarization of the myocardium [4]. In the research setting, other methods such as cardiovascular-induced sounds and vibrations on the chest’s surface have been also widely investigated [5,6,7]. These signals provide information about the mechanical aspects of cardiovascular activity, and thus may contain diagnostic information that is complementary to the existing methods such as ECG.
After these signals are measured using the sensing systems, they are usually analyzed using feature extraction and machine learning methods to classify them into healthy and diseased groups. For example, the temporal and spectral contents of cardiovascular sounds have been explored by methods such as wavelet transform, power spectral density, and mel-frequency cepstrum [8,9,10,11]. The extraction of the time and frequency features of the heart vibrations has been performed through short-time Fourier transformation, wavelet transformation, Wigner-Ville distribution, and polynomial chirplet transformation [12,13,14,15]. The acoustic signals can be also decomposed into their components using methods such as ensemble empirical mode decomposition and variational mode decomposition [16,17]. Additional features can be extracted from the resulting modes, or these modes can serve as signal features themselves. These decomposition methods can also assist with signal filtration by excluding the modes which are believed to be related to noise. Furthermore, some studies have suggested that the inclusion of respiration information would organize the signal features into separate groups that could lead to the more accurate classification of heart vibrations into normal and abnormal groups [18,19,20,21,22,23]. Throughout the different phases of the respiration cycle, there is variation in the temporal and spectral characteristics of heart-induced vibrations. For example, after segmenting vibration signals into smaller segments where each one represents one cardiac cycle, the segments that occur during the high-lung-volume phase are different from those during the low-lung-volume phase in both the time and frequency domains. This suggests that breaking the heart vibration signals into two different groups based on the respiration cycle information can result in a better signal characterization [19]. Other popular signal processing and analysis methods of the cardiovascular-induced sound and vibration signals have been reviewed in previous work [5,6,24,25,26].
In recent studies, cardiovascular vibrations played a vital role in the development of methods for the monitoring of cardiovascular activity and the early detection of irregularities. The axial and torsional components of these vibrations may be recorded noninvasively on the chest surface using sensing systems that include accelerometers and gyroscopes. These axial and torsional vibrations are called seismocardiograms (SCG) [27,28] and gyrocardiograms (GCG) [29,30], respectively. These precordial vibrations are generated by cardiac movements such as heart contraction, the opening and closure of the heart valves, and blood flow momentum and turbulence [5,6]. SCG and GCG signals can be measured from different locations on the chest. Some of the common measurement locations include the sternum, the right upper sternal border, and over the heart apex [5]. Other popular vibration-based cardiovascular activity monitoring methods include ballistocardiography [31,32], vibrocardiography [33], kinocardiography [34], and mechanocardiography [35]. These noninvasive cardiac-health monitoring methods have a duality in their applications; specifically, they have use in a clinical setting as well as in the home.
Cardiac vibration signals can provide information about the heart rate and cardiac cycle duration. Each cardiac cycle is composed of two main segments: the systolic and diastolic phases. In one cycle, the systolic portion is usually shorter than the diastolic portion [36]. In addition, the duration of the cardiac cycle depends on the respiration phase in which the cardiac cycle occurred [22]. The variations in the heart rate can be measured from the cardiac cycle duration, which can be determined by heart vibration signals [22,37,38]. These variations are known as predictive factors of different CVDs, such as sudden cardiac death [39]. Furthermore, the temporal features of the heart activities such as cardiac time intervals and fiducial points (e.g., the opening and closure time of the cardiac valves) can be also determined and analyzed using heart vibration signals [40,41,42]. These measurements assist in providing insight into the functions of the heart. For example, a recent study estimated the cardiac time intervals from impedance cardiography, PCG, and SCG [43]. The estimations of each method were compared with the gold standard values that were measured by multimodal echocardiography. The results suggested that SCG had a significantly higher accuracy than the other methods for the estimation of the pre-ejection period and the total systolic time.
Cardiovascular vibrations assisted in the diagnosis and monitoring of different clinical conditions. Earlier studies have been conducted to measure the heart motion of anesthetized pigs during surgery using a three-axis accelerometer [44]. The accelerometer output was filtered at 1 Hz in order to retain the movements due to the heart beating and remove the low-frequency respiration vibrations. The results suggested that accelerometers could locate irregular patterns that may indicate heart circulation failure—a sign of numerous CVDs. In another early study on human subjects, the functioning of the left ventricle has been observed through signals derived from SCG in order to detect myocardial ischemia [45]. Alterations in cardiac muscle contractions were noted and analyzed. The findings were conclusive enough to be used to diagnose patients with ischemia. More recent studies have used cardiac vibrations to diagnose medical conditions such as heart failure [46,47], coronary artery disease (CAD) [48], valvular disease [49], ischemia [50], atrial fibrillation [50,51,52], atrial flutter [53], aortic stenosis [54,55], and myocardial infarction [56]. Further uses of left ventricular monitoring using SCG have been also proposed in areas such as cancer patients’ cardiotoxicity assessments [57].
Auscultation has also been used to monitor cardiac health and activity for many years. Phonocardiography (PCG) is another common technique to record cardiovascular acoustics using a traditional or digital stethoscope [10,26]. In addition to normal heart sounds (S1 and S2), a PCG signal may contain components that indicate pathological conditions. For example, the presence of a third heart sound, S3, which occurs right after S2, can be a sign of congestive cardiac failure [58]. Figure 2 shows five sample normal and abnormal PCG signals. The presence of a cardiovascular abnormality or malfunction such as an aneurysm or stenosis may create turbulence in the downstream blood flow in a vessel [59,60]. The turbulent flow generates sounds in specific frequency bands (depending on the morphology and severity of the abnormality) that transmit to the vessel wall, then to the surrounding tissues, and eventually to the body surface. These variations may then be analyzed using signal processing and machine learning methods to detect the abnormality. For example, CAD is caused by large amounts of plaque deposit buildup in the coronary arteries, which limits blood flow. Currently, the most accurate way to test for CAD is coronary angiography, which is both invasive and expensive. Non-invasive ways to detect CAD include low-cost methods that are based on the non-invasive measurement of heart sounds using digital stethoscopes [61]. In order to diagnose CAD, one study obtained the diastolic sound segments by stethoscope in CAD patients and analyzed them using a multivariate classifier [61,62]. Subtle differences were noted between the diastolic sound from healthy individuals and patients with CAD, which suggested that a digital stethoscope has potential for noninvasive CAD diagnosis.
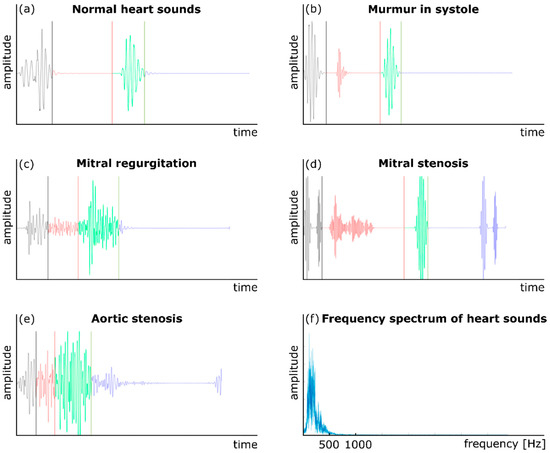
Figure 2.
Normal and abnormal heart sounds: (a) a normal heart sound, (b) murmur in the systole, (c) mitral regurgitation, (d) mitral stenosis, (e) aortic stenosis, and (f) the frequency content of a PCG signal. Adapted from ref. [10].
Computational fluid dynamics and post-processing numerical techniques are other effective, noninvasive approaches to analyze the sounds emitted from the human body [63,64]. Acoustic pressure fluctuations have been recognized as the primary flow-induced source of the sound through arteries and lung airways. These pressure fluctuations can be further excited by blood flow turbulence due to medical conditions such as stenosis and aneurysm. The pressure fluctuations are correlated with highly turbulent shear stresses and vibration on the internal arterial wall leading to the structural response of the surrounding tissue. Computational fluid dynamics simulations can investigate the sounds coming from highly turbulent fluctuating flow through the arteries, and explain the mechanisms of the clinical observations. This provides information that can help predict a variety of cardiovascular diseases [59,60]. In the past studies, vessel wall shear stress and pressure were used as indicators of an unhealthy artery with a high potential risk of complications leading to abnormal sound signals propagated through the tissue [65,66,67,68,69,70]. In these studies, adverse hemodynamic conditions at critical times during a heart cycle were investigated to find the correlation of transient pressure fluctuations due to highly turbulent kinetic energy with structural vibrations and stresses associated with elevated risk of hemolysis, platelet activation, and potential development of thrombosis. It was concluded that the highest turbulent stresses through an unhealthy artery can be 4–14% higher than the stresses through a healthy artery at peak systole. Moreover, the results from the pressure fluctuations and stresses on the internal arterial wall were utilized to analyze structural vibrations in the frequency domain, and to understand the mechanism of sound propagation to the epidermal surface. The acquisition of the sound signals on the chest surface propagated from unhealthy arteries can be used as a noninvasive diagnostic tool to identify the disease. Therefore, the post-processing of the sound features and their spatial distribution can contain valuable information about the geometric details of the disease, which can be essential for the diagnosis process. These studies post-processed the time-series of the pressure or wall shear stress that were recorded on the vessel wall in order to analyze the frequency contents of the flow fluctuations.
The information supported by decomposing the time-varying flow field into spatial and temporal parts through proper orthogonal decomposition (POD) can also help provide insights into the acoustic sources in the flow [59,60]. The decomposed time-varying flow can be reconstructed to describe the modes of coherent flow structures as sound sources and the time evolution of these modes. Additionally, POD analysis followed by a frequency-based temporal filtering method can visualize the coherent structures at specific frequencies to provide useful information on the localization of sound sources with maximum sound pressure levels through unhealthy systems. Additional information on the process of the POD method can be found in [59,60]. It should be noted that the importance of the accurate post-processing of CFD results with state-of-the-art methods such as the POD has been highlighted in previous studies. For example, it is suggested that POD can reconstruct features of complex recirculating flows through small vessels [71], while the spatial resolution of 4D-flow MRI is not sufficient to resolve these flow features accurately [72]. POD has also been used to study the flow through mechanical aortic valves [73], cerebral aneurysm [74,75], and coronary arteries [76].
3. Respiratory Illnesses
For centuries, simple and low-cost acoustic procedures such as auscultation, percussion, and tactile fremitus have allowed physicians to evaluate and address respiratory system diseases [77,78]. With advances in sensing technologies and the aid of advanced signal processing techniques, the more reliable feature extraction and classification of the respiratory sounds and vibrations have been developed, leading to a better understanding of both normal and abnormal lung acoustics. In order to classify signals that differentiate disease from health in a person, efficient feature extraction is needed. Different methods have been employed to properly extract features from lung sounds and vibrations in the time, frequency, and time–frequency domains. Examples of these would be Fourier transformation, mel-frequency cepstrum, wavelet transformation, and Hilbert–Huang transformation [77].
Various locations on the body produce respiratory sounds which need different measurement techniques and devices. For example, airway impedance is measured from the lips [79]. In other applications, respiratory acoustics would be recorded from the neck or chest surface. When the signals are measured on the neck (e.g., at the suprasternal notch over the extrathoracic trachea), they present larger amplitudes than recordings from the chest [80,81,82]. Measurements from the neck cover frequencies from 80 Hz to 1500 Hz, which includes the frequency range of many diseases (Table 1). In general, the frequency range of interest for the analysis of lung sounds is 100–2000 Hz. Because the chest behaves as a low-pass filter, it hinders higher-frequency components [77]. The frequency components below 100 Hz are also usually eliminated in order to remove the acoustic signals from other sources such as the heart, muscles, and electrical inference.

Table 1.
Frequency signatures of respiratory diseases.
Acoustic signals have been used to study the respiratory system in health and disease. For example, vibration response imaging (VRI) revealed variations in respiratory-induced vibrations between smoker and non-smoker individuals in healthy asymptomatic subjects [87]. VRI is a 2D grayscale imaging technique that measures respiratory acoustic variations using an array of piezo-acoustic sensors on the body’s surface [88]. Furthermore, a wide range of acoustic-based methods have been investigated and developed to detect respiratory conditions including asthma [1,89,90,91,92,93,94], obstructive sleep apnea [95,96,97], chronic obstructive pulmonary disorder [1,93,98,99,100,101], tracheal stenosis [102], pneumothorax [86,103,104,105], pneumonia [1,106,107,108], pleural effusion [109], cystic fibrosis [110,111], and COVID-19 [112,113]. Some of these methods and medical conditions will be discussed in more detail in the rest of this section.
Spirometry is currently one of the most common procedures which is performed to evaluate pulmonary function [114]. This test utilizes sound waves that come from the patient’s breathing patterns to diagnose respiratory diseases. During this procedure, the patient breathes deeply and slowly into a mouthpiece that is connected to a spirometer. This technique, however, can be limited by the patient’s ability to perform the test accurately, making it increasingly difficult for elderly people and younger children [77].
Due to these limitations, there have been alternative methods to diagnose children with pulmonary medical conditions such as asthma. For example, the forced oscillation technique uses tidal breathing, which requires little effort from children. This technique requires subjects to be in a seated position with straight backs and neutral or extended neck positioning [115]. In addition to the subject’s positioning, the cheeks and floor of the mouth should be supported by another person or physician. The forced oscillation technique is commonly tested using a mouthpiece that features a bacterial filter and a nose clip-on. In order to detect asthma using this technique, the system analyzes the relationship between the airflow and airway pressure from a respiration cycle (respiratory resistance and reactance). Another way to use bioacoustics to diagnose respiratory diseases is the use of tracheal sounds [102], which can be proven in people who suffer from obstructive sleep apnea [116]. Obstructive sleep apnea is a sleep disorder in which breathing is disrupted for longer than ten seconds and at least five times per hour throughout a single sleep period. In this case, the tracheal sounds come from the surface vibrations on the suprasternal notch. Acoustic-based sensors are able to track the pressure changes produced by the mass, elastance, and resistance of the trachea [116]. These sensors are inserted into a protective plastic chamber with a deep cuff. This creates an airtight space between the transducer and the skin. Adhesive tape is also usually used to keep the sensor placed right above the suprasternal notch and ensure a good sensor–skin coupling.
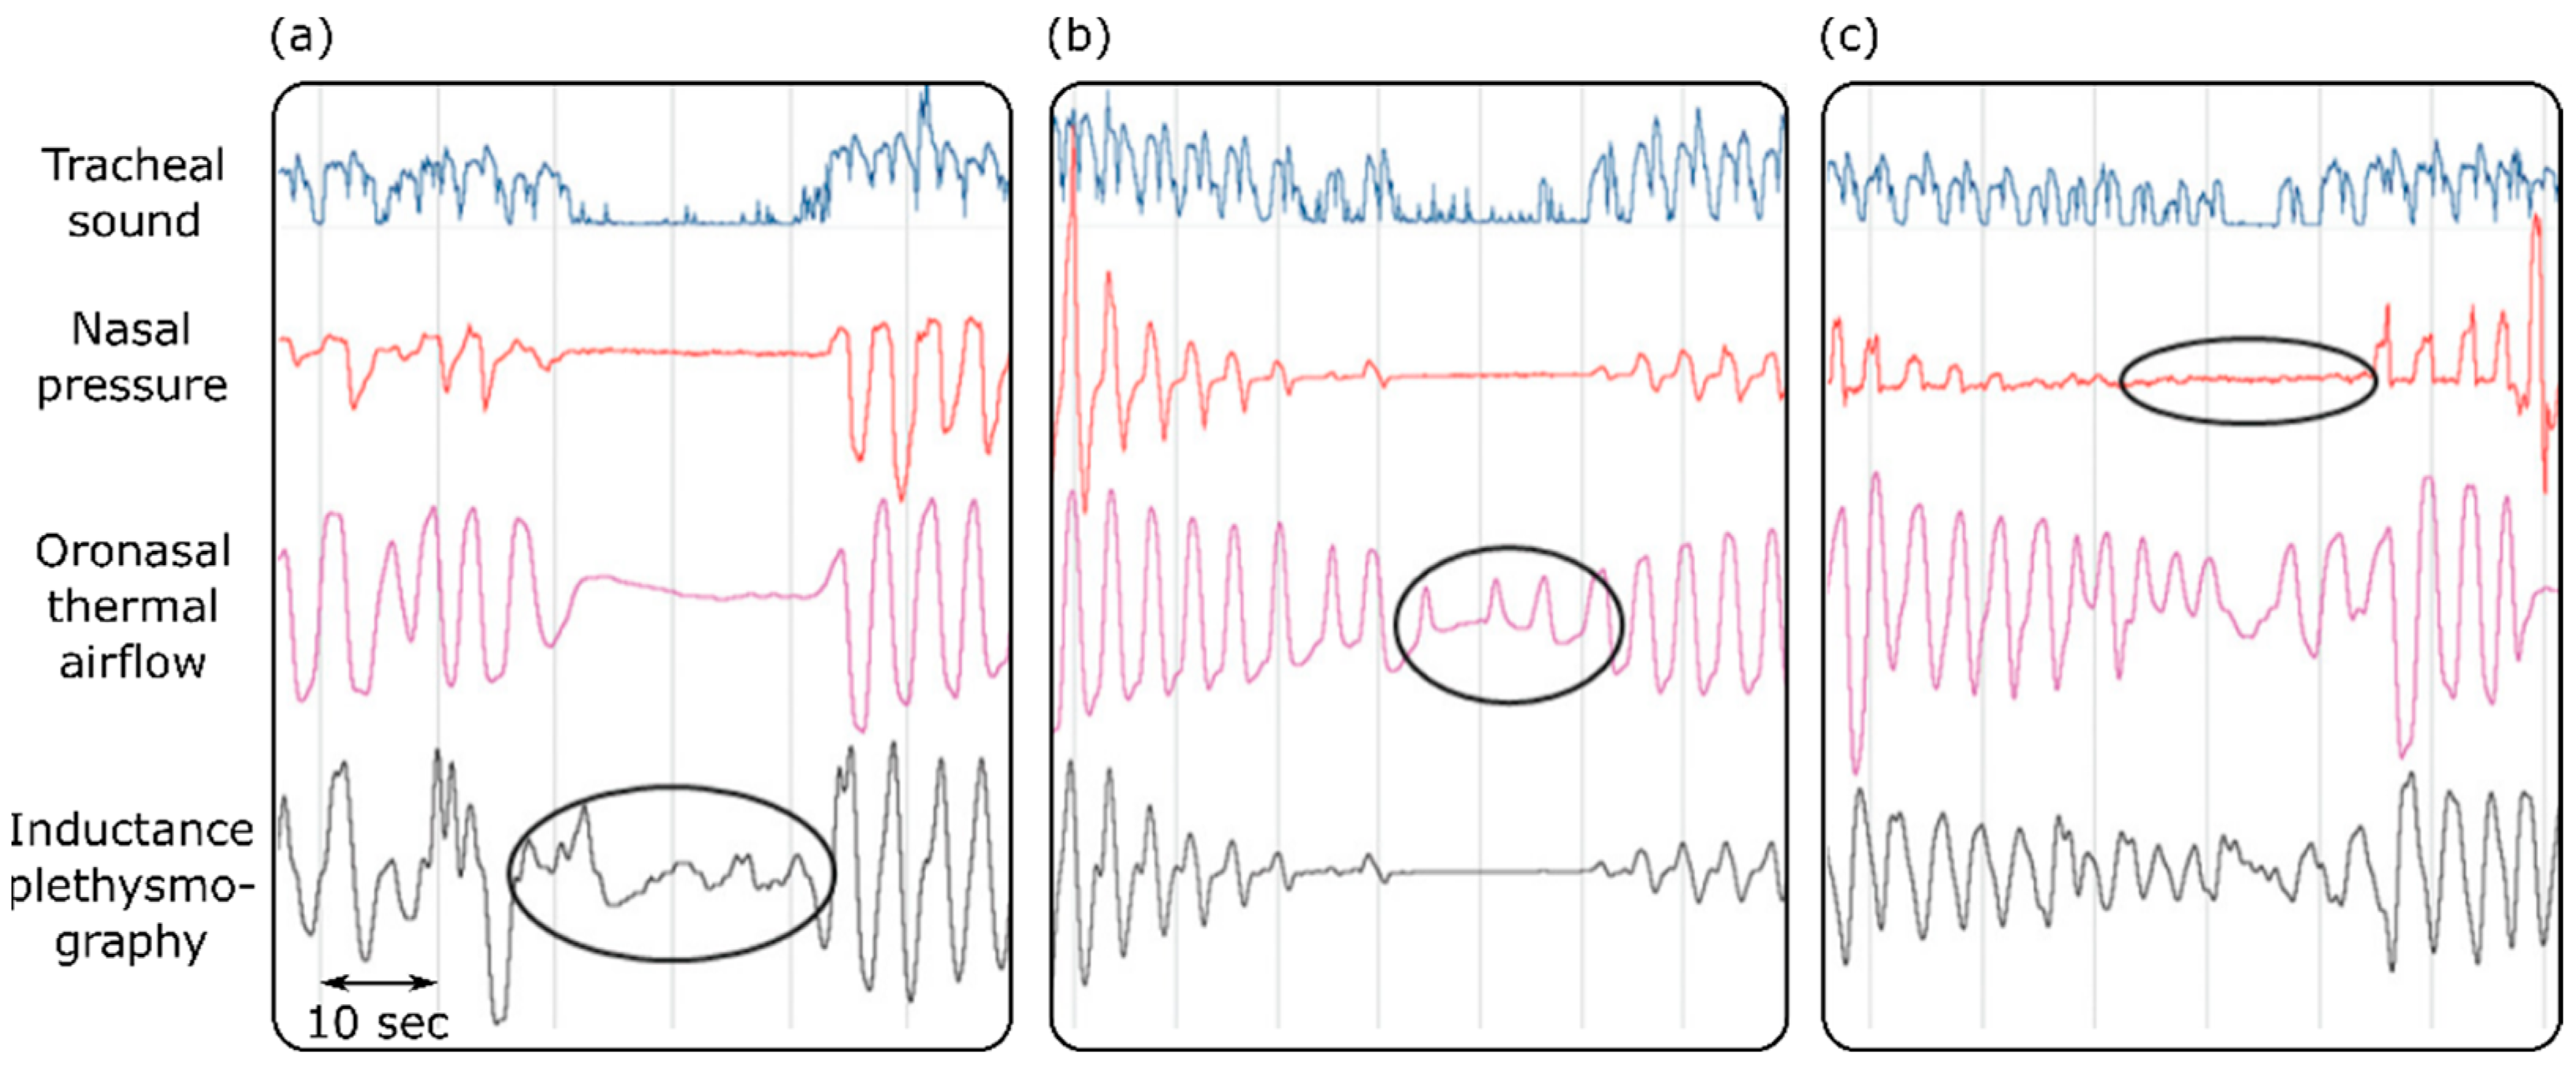
Sleep apnea is defined as a condition where the airflow is reduced by more than 90% for more than 10 s in an adult subject [117]. Different airflow techniques have been used for the diagnosis of obstructive sleep apnea in sleep laboratories and clinics [118,119,120]. These techniques included respiratory inductance plethysmography, oronasal thermal airflow measurements, and nasal pressure measurements. One study assessed the effectiveness of tracheal sound measurements in the detection of apnea [118]. The results suggested that tracheal sound measurements are efficient and reliable enough to accurately pick up and provide a noninvasive way to diagnose obstructive sleep apnea. Furthermore, the tracheal sound signals could detect apnea on occasions when it was missed by the other diagnostic techniques (Figure 3). Because apnea affects the oxygen delivery to different organs, it causes a muscle metabolic reflex, which in turn affects the blood pressure and cardiac contraction [119]. Based on this, it is suggested that maximum expiratory apnea increases the kinetic energy of the heart, which can be measured using cardiac vibration signals such as SCG and BCG [120].
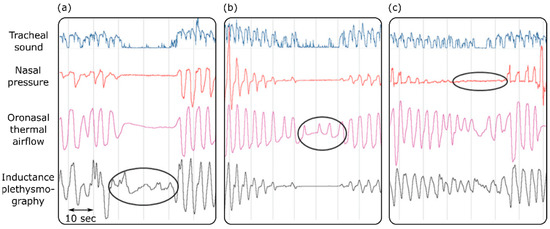
Figure 3.
Detecting sleep apnea using tracheal sounds, nasal pressure, oronasal thermal airflow, and inductance plethysmography. Apnea is not detected by inductance plethysmography or the oronasal thermal airflow sensor in (a,b). Oral breathing is mistaken for apnea by the nasal pressure transducer (c). Adapted from ref. [118].
Pneumonia is the result of a bacterial or viral infection that successfully inflames the lungs and converts the air sacs to a solid as they fill with pus. This disease can be very serious, or even fatal [121]. Imaging techniques such as chest X-rays are the most common ways to diagnose pneumonia. However, pneumonia is often unclear in these images, which may result in misdiagnosis [122]. Once the disease is detected, there are various treatments to reduce the effects of pneumonia in patients. The outcome from these treatments needs to be tested in order to find out how efficient they are the successful reduction of pneumonia. X-ray tests are currently the method of choice; however, these tests are expensive and impractical due to the excess amount of radiation applied to the patient. Researchers have begun to explore alternative approaches, one of which is VRI [93]. This technology focuses on lung function by recognizing the relationship between the gas flow in the lungs and the vibration energy. This process requires patients to be seated facing the VRI machine with multiple sensors placed on the back while respiratory cycles are recorded [77]. The placement of sensors varies from study to study [123]. For example, one study used two V-array sensors placed on the back, 1.5 cm above the mesoscapula [124]. They were positioned in parallel from right to left, with 5 cm allocated for a spin on the two sides. There were three to five, 12-s cycles of natural breathing that were recorded for the acquisition of data. After testing 62 subjects, the drastic change (p < 0.001) in the VRI images before and after treatment proved that this new VRI technology was successful in the evaluation of curative effects for pneumonia.
Chronic obstructive pulmonary disease (COPD) is a group of illnesses with the potential to block airflow and create problems related to the ability to breathe [125]. It is currently the third leading cause of death in the world [126]. One way to diagnose COPD is using a stethoscope, the accuracy of which relies on there being no human error in the dissection of the auscultations [1]. Newly developed digital stethoscope increase the reliability in diagnosis substantially [77]. By combing the conventional stethoscope with computerized systems, the digital stethoscope could produce an efficient technique for the discovery of common COPD conditions such as emphysema and chronic bronchitis [127,128]. Other studies have been carried out to test the accuracy of digital stethoscopes in the diagnosis of various respiratory illnesses [129]. However, these devices may also capture the surrounding noise signals, which should be carefully removed [130].
In addition to the assessment of respiration acoustics using sensing systems, numerical models have been used to investigate the sound transmission and vibration propagation within the respiratory system [131]. Clinical investigations of flow through the lung airways are challenging because of the complex geometry of lung airways, the transient nature of the airflow during the respiration cycle, and difficulties in locating small obstructions induced by the chronic pulmonary diseases in the medical images [132,133]. Numerical models can provide a comprehensive analysis of flow, which can potentially help explain airflow complications and support medical decision-making. This detailed information may not, however, be obtained with in-vivo measurements. For example, Hu et al. [132] demonstrated an innovative noninvasive diagnostic method using computational modeling and neural network techniques to localize the small obstructions in the peripheral lung based on the flow velocity contour shifts. In another study, the effects of different severity levels of upper airway deformation on the airflow structure were studied numerically in order to show the existence of turbulence flow and an increase in the flow fluctuations [134]. Although these numerical models can provide detailed information on respiratory flow, they are computationally expensive and usually require a few hours or days of processing time.
4. Other Diseases
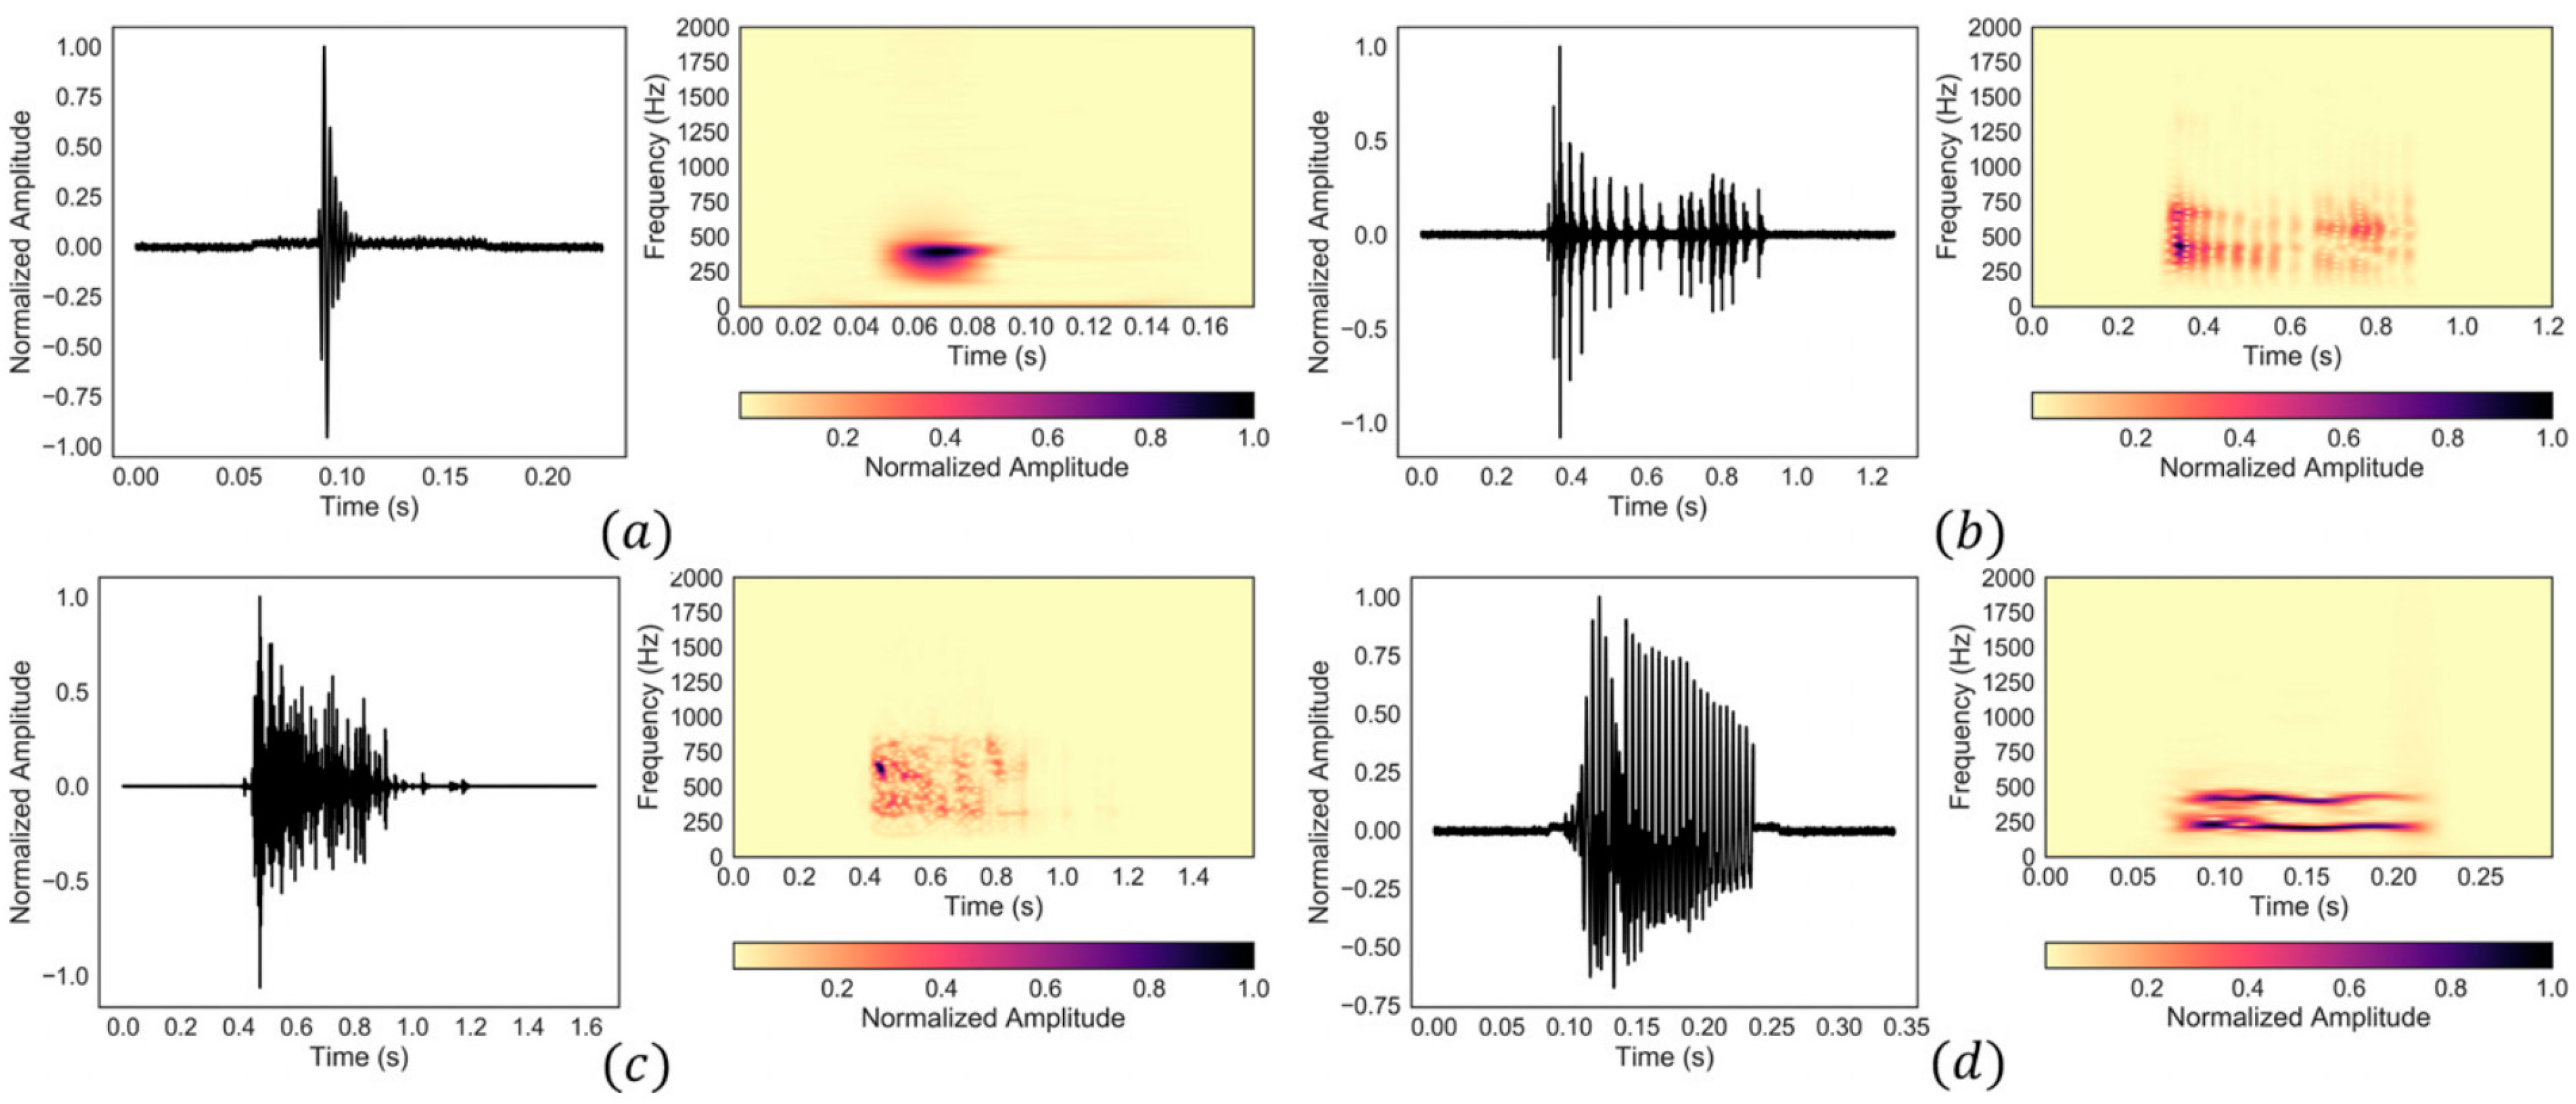
Biomedical acoustics have been also used to develop monitoring methods for other medical conditions. For instance, the digestive system generates sounds and vibrations that can be used for diagnosis purposes. Bowel sounds can be categorized into four typical types based on their waveform and frequency content [135]. These include single burst, multiple bursts, continuous random sound, and harmonic sound types (Figure 4). Alternatively, considering time-frequency features, abdominal sounds and vibrations can be classified into two groups of intestinal bursts and regularly sustained sounds (short and long duration sounds, respectively) as well as three sets of interfering noise, including respiration, snoring, and motion-related noise sets [136,137]. Table 2 lists the time and frequency signatures of different types of bowel sounds. Although some studies suggest that bowel sounds do not provide clinically relevant information [138], other studies have used the noninvasive monitoring and analysis of stomach and bowel sounds for the diagnosis of gastrointestinal tract diseases. These medical conditions include abdominal conditions such as appendicitis, intestinal obstruction, irritable bowel syndrome, inflammatory bowel disease, pyloric stenosis, postoperative ileus, and cholecystitis [139,140,141,142,143,144,145,146]. Despite respiratory and cardiac acoustics, the monitoring of gastrointestinal acoustics usually requires continuous data acquisition of several minutes, as gastrointestinal sounds do not occur frequently [147].
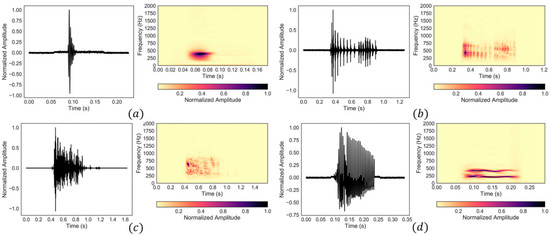
Figure 4.
Four common types of bowel sounds: (a) single burst, (b) multiple bursts, (c) continuous random sound, and (d) harmonic sound. Reprinted from ref. [135].
Table 2.
Time and frequency signatures of different types of bowel sounds. Data from ref. [135].
Bioacoustics sensors were also used to monitor the conditions of patients with nervous disorders such as Parkinson’s disease [148,149] and multiple sclerosis [150]. For example, accelerometers can evaluate the movement data of patients with multiple sclerosis, a chronic neurological disease. These data can be then used to assess the daily activities of the patients and provide clinical feedback in order to manage the symptoms of multiple sclerosis [150]. Tremor is the involuntary and rhythmic oscillatory movements of a body part, and is a symptom of many disorders, including cerebellar disease, peripheral neuropathy, orthostatic tremor, and Parkinson’s disease [151]. The frequency of the tremor can range between 3 Hz (slow) and 12 Hz (rapid). These frequencies and the amplitude of the tremor can be continuously monitored using wearable accelerometers in order to evaluate the severity of the disease [152]. Other studies have used acoustic signals for the non-invasive diagnosis and monitoring of other medical conditions, including voice disorders (e.g., phonotraumatic vocal hyperfunction) [153,154], dysphagia [155,156,157], fetal health and development [158], and cartilage-based conditions such as osteoarthritis and chondromalacia [159,160].
5. Conclusions and Future Directions
Advances in the development of lighter, cheaper, and more sensitive and accurate sensors have resulted in a resurgence in research on body acoustics for the non-invasive diagnosis of different medical conditions. In addition, the recent improvements in computational resources have made the real-time continuous monitoring of the patients a reality inside and outside of clinical settings [31,161,162]. These developments can lead to the formation of large databases of body acoustics. The analysis of this big data using methods such as deep learning may provide a better understanding of the body acoustics, and may establish novel non-invasive diagnosis methods. These signals may also provide complementary information to other monitoring methods. For example, while an ECG test assesses the electrical activity of the heart, acoustic signals such as sounds and vibrations can provide a more in-depth understanding of the mechanical activity of the cardiovascular system. This complementary information can lead to the detection of early signs of CVDs.
Acoustic signals may also assist in the non-invasive localization of the abnormalities inside the body [163]. Simultaneous measurements of acoustic signals from multiple locations on the body surface using sensor arrays can provide information on the 3D location of the acoustic source (e.g., cardiovascular diseases or lung pathologies). For example, the location of heart valves may be estimated by the analysis of the outputs of a microphone array [106,164].
Despite the many studies on the utility of acoustic signals for medical diagnosis, there are still open questions and challenges that hinder the transformation of these research studies into commercial products. One of the challenges in the use of acoustic signals for medical diagnosis is the presence of different noise sets in the signal of interest. The acoustic signals that are recorded on the body’s surface consist of sounds and vibrations from other sources that are not of interest. For example, a fetal PCG is a mixture of acoustic signals from the fetus, different organs of the mother, and other external noises [158]. In addition, any fetal movements can add an artifact to the fetal PCG. On the other hand, the acoustic signals recorded from a pregnant woman are contaminated by signals that originated from the fetus. Robust noise filtration methods should be established in order to isolate the signals of interest from noise.
Another challenge is that the temporal and spectral contents of the acoustic signals depend strongly on the acquisition location. For example, heart-induced vibrations on the chest’s surface may change by 30% with a sensor location change of 1 cm [5]. Other parameters such as the postural position and transmission medium (e.g., the amount of soft tissue between the signal source and the sensor) also affect the contents of the acoustic signals. In addition, these signals usually change from one subject to another. Therefore, the analysis methods should be developed such that they are robust, inclusive, and accurate under different conditions.
In conclusion, the utilization of new generations of sensing technologies in combination with signal processing methods and rigorous experiments to understand the physiological genesis of the acoustic signals may translate them from a research interest to a powerful tool for the diagnosis of medical conditions.
Author Contributions
Conceptualization, A.T.; investigation, A.T.; resources, A.T.; writing—original draft preparation, J.C. (20%), M.U. (10%), F.K. (10%) and A.T. (60%); writing—review and editing, A.T. and F.K.; visualization, A.T.; supervision, A.T.; project administration, A.T. All authors have read and agreed to the published version of the manuscript.
Funding
This research received no external funding.
Institutional Review Board Statement
Not applicable.
Informed Consent Statement
Not applicable.
Data Availability Statement
Not applicable.
Acknowledgments
Figure 1 was created using the art vectors available at vecteezy.com, accessed on 27 March 2022.
Conflicts of Interest
The authors declare no conflict of interest.
References
- Murphy, R.L.H. In Defense of the Stethoscope. Respir. Care 2008, 53, 355–369. [Google Scholar] [PubMed]
- Virani, S.S.; Alonso, A.; Aparicio, H.J.; Benjamin, E.J.; Bittencourt, M.S.; Callaway, C.W.; Carson, A.P.; Chamberlain, A.M.; Cheng, S.; Delling, F.N.; et al. Heart Disease and Stroke Statistics—2021 Update. Circulation 2021, 143, e254–e743. [Google Scholar] [CrossRef] [PubMed]
- Celermajer, D.S.; Chow, C.K.; Marijon, E.; Anstey, N.M.; Woo, K.S. Cardiovascular Disease in the Developing World: Prevalences, Patterns, and the Potential of Early Disease Detection. J. Am. Coll. Cardiol. 2012, 60, 1207–1216. [Google Scholar] [CrossRef] [PubMed] [Green Version]
- Hu, Y.; Kim, E.G.; Cao, G.; Liu, S.; Xu, Y. Physiological Acoustic Sensing Based on Accelerometers: A Survey for Mobile Healthcare. Ann. Biomed. Eng. 2014, 42, 2264–2277. [Google Scholar] [CrossRef]
- Taebi, A.; Solar, B.; Bomar, A.; Sandler, R.; Mansy, H. Recent Advances in Seismocardiography. Vibration 2019, 2, 64–86. [Google Scholar] [CrossRef] [Green Version]
- Inan, O.T.; Migeotte, P.-F.; Park, K.-S.; Etemadi, M.; Tavakolian, K.; Casanella, R.; Zanetti, J.; Tank, J.; Funtova, I.; Prisk, G.K.; et al. Ballistocardiography and Seismocardiography: A Review of Recent Advances. IEEE J. Biomed. Health Inform. 2015, 19, 1414–1427. [Google Scholar] [CrossRef] [Green Version]
- Gupta, P.; Moghimi, M.J.; Jeong, Y.; Gupta, D.; Inan, O.T.; Ayazi, F. Precision wearable accelerometer contact microphones for longitudinal monitoring of mechano-acoustic cardiopulmonary signals. NPJ Digit. Med. 2020, 3, 19. [Google Scholar] [CrossRef] [Green Version]
- Ghosh, S.K.; Tripathy, R.K.; Ponnalagu, R.N.; Pachori, R.B. Automated Detection of Heart Valve Disorders from the PCG Signal Using Time-Frequency Magnitude and Phase Features. IEEE Sens. Lett. 2019, 3, 1–4. [Google Scholar] [CrossRef]
- Chowdhury, T.H.; Poudel, K.N.; Hu, Y. Time-Frequency Analysis, Denoising, Compression, Segmentation, and Classification of PCG Signals. IEEE Access 2020, 8, 160882–160890. [Google Scholar] [CrossRef]
- Yaseen; Son, G.-Y.; Kwon, S. Classification of Heart Sound Signal Using Multiple Features. Appl. Sci. 2018, 8, 2344. [Google Scholar] [CrossRef] [Green Version]
- Saeidi, A.; Almasganj, F. Cardiac valves disorder classification based on active valves appearance periodic sequences tree of murmurs. Biomed. Signal Process. Control 2020, 57, 101775. [Google Scholar] [CrossRef]
- Taebi, A.; Mansy, H.A. Time-Frequency Distribution of Seismocardiographic Signals: A Comparative Study. Bioengineering 2017, 4, 32. [Google Scholar] [CrossRef] [PubMed]
- Taebi, A.; Mansy, H.A. Analysis of Seismocardiographic Signals Using Polynomial Chirplet Transform and Smoothed Pseudo Wigner-Ville Distribution. In Proceedings of the IEEE Signal Processing in Medicine and Biology Symposium (SPMB), Philadelphia, PA, USA, 2 December 2017; pp. 1–6. [Google Scholar]
- Taebi, A.; Mansy, H.A. Effect of Noise on Time-frequency Analysis of Vibrocardiographic Signals. J. Bioeng. Biomed. Sci. 2016, 6, 202. [Google Scholar] [CrossRef] [PubMed] [Green Version]
- Taebi, A.; Solar, B.E.; Mansy, H.A. An Adaptive Feature Extraction Algorithm for Classification of Seismocardiographic Signals. In Proceedings of the IEEE SoutheastCon 2018, St. Petersburg, Russia, 19–22 April 2018; pp. 1–5. [Google Scholar]
- Taebi, A.; Mansy, H.A. Noise Cancellation from Vibrocardiographic Signals Based on the Ensemble Empirical Mode Decomposition. J. Appl. Biotechnol. Bioeng. 2017, 2, 49–54. [Google Scholar] [CrossRef] [Green Version]
- Choudhary, T.; Bhuyan, M.K.; Sharma, L.N. A Novel Method for Aortic Valve Opening Phase Detection Using SCG Signal. IEEE Sens. J. 2020, 20, 899–908. [Google Scholar] [CrossRef]
- Zakeri, V.; Tavakolian, K. Identification of respiratory phases using seismocardiogram: A machine learning approach. Comput. Cardiol. 2015, 42, 305–308. [Google Scholar]
- Taebi, A.; Mansy, H.A. Grouping Similar Seismocardiographic Signals Using Respiratory Information. In Proceedings of the IEEE Signal Processing in Medicine and Biology Symposium (SPMB17), Philadelphia, PA, USA, 2 December 2017; pp. 1–6. [Google Scholar]
- Gamage, P.T.; Azad, M.K.; Taebi, A.; Sandler, R.H.; Mansy, H.A. Clustering of SCG Events Using Unsupervised Machine Learning. In Signal Processing in Medicine and Biology; Springer International Publishing: Cham, Switzerland, 2020; pp. 205–233. [Google Scholar]
- Solar, B.E.; Taebi, A.; Mansy, H.A. Classification of Seismocardiographic Cycles into Lung Volume Phases. In Proceedings of the IEEE Signal Processing in Medicine and Biology Symposium (SPMB), Philadelphia, PA, USA, 2 December 2017; pp. 1–2. [Google Scholar]
- Taebi, A.; Bomar, A.J.; Sandler, R.H.; Mansy, H.A. Heart Rate Monitoring During Different Lung Volume Phases Using Seismocardiography. In Proceedings of the IEEE SoutheastCon 2018, St. Petersburg, Russia, 19–22 April 2018; pp. 1–5. [Google Scholar]
- Sandler, R.H.; Azad, K.; Rahman, B.; Taebi, A.; Gamage, P.; Raval, N.; Mentz, R.J.; Mansy, H.A. Minimizing Seismocardiography Variability by Accounting for Respiratory Effects. J. Card. Fail. 2019, 25, S185. [Google Scholar] [CrossRef] [Green Version]
- Rai, D.; Thakkar, H.K.; Rajput, S.S.; Santamaria, J.; Bhatt, C.; Roca, F. A Comprehensive Review on Seismocardiogram: Current Advancements on Acquisition, Annotation, and Applications. Mathematics 2021, 9, 2243. [Google Scholar] [CrossRef]
- Abbas, A.K.; Bassam, R. Phonocardiography Signal Processing. Synth. Lect. Biomed. Eng. 2009, 4, 1–194. [Google Scholar] [CrossRef]
- Ismail, S.; Siddiqi, I.; Akram, U. Localization and classification of heart beats in phonocardiography signals—A comprehensive review. EURASIP J. Adv. Signal Process. 2018, 2018, 26. [Google Scholar] [CrossRef] [Green Version]
- Zanetti, J.; Salerno, D. Seismocardiography: A new technique for recording cardiac vibrations. Concept, method, and initial observations. J. Cardiovasc. Technol. 1990, 9, 111–120. [Google Scholar]
- Zanetti, J.M.; Tavakolian, K. Seismocardiography: Past, present and future. In Proceedings of the 35th Annual International Conference of the IEEE Engineering in Medicine and Biology Society (EMBC), Osaka, Japan, 3–7 July 2013; pp. 7004–7007. [Google Scholar]
- Tadi, M.J.; Lehtonen, E.; Saraste, A.; Tuominen, J.; Koskinen, J.; Teräs, M.; Airaksinen, J.; Pänkäälä, M.; Koivisto, T. Gyrocardiography: A new non-invasive monitoring method for the assessment of cardiac mechanics and the estimation of hemodynamic variables. Sci. Rep. 2017, 7, 6823. [Google Scholar] [CrossRef] [PubMed]
- Yang, C.; Tavassolian, N. Combined Seismo- and Gyro-Cardiography: A More Comprehensive Evaluation of Heart-Induced Chest Vibrations. IEEE J. Biomed. Health Inform. 2018, 22, 1466–1475. [Google Scholar] [CrossRef] [PubMed]
- Sadek, I.; Biswas, J.; Abdulrazak, B. Ballistocardiogram signal processing: A review. Health Inf. Sci. Syst. 2019, 7, 10. [Google Scholar] [CrossRef]
- Giovangrandi, L.; Inan, O.T.; Wiard, R.M.; Etemadi, M.; Kovacs, G.T.A. Ballistocardiography–A method worth revisiting. In Proceedings of the 33rd Annual International Conference of the IEEE Engineering in Medicine and Biology Society, Boston, MA, USA, 30 August–3 September 2011; pp. 4279–4282. [Google Scholar]
- Morbiducci, U.; Scalise, L.; De Melis, M.; Grigioni, M. Optical Vibrocardiography: A Novel Tool for the Optical Monitoring of Cardiac Activity. Ann. Biomed. Eng. 2007, 35, 45–58. [Google Scholar] [CrossRef]
- Hossein, A.; Rabineau, J.; Gorlier, D.; Del Rio, J.I.J.; van de Borne, P.; Migeotte, P.-F.; Nonclercq, A. Kinocardiography Derived from Ballistocardiography and Seismocardiography Shows High Repeatability in Healthy Subjects. Sensors 2021, 21, 815. [Google Scholar] [CrossRef]
- Jaakkola, J.; Jaakkola, S.; Lahdenoja, O.; Hurnanen, T.; Koivisto, T.; Pänkäälä, M.; Knuutila, T.; Kiviniemi, T.O.; Vasankari, T.; Airaksinen, K.E.J. Mobile Phone Detection of Atrial Fibrillation with Mechanocardiography. Circulation 2018, 137, 1524–1527. [Google Scholar] [CrossRef]
- Bowen, W.P. Changes in Heart-Rate, Blood-Pressure, and Duration of Systole Resulting from Bicycling. Am. J. Physiol. Content 1904, 11, 59–77. [Google Scholar] [CrossRef]
- Sieciński, S.; Kostka, P.S.; Tkacz, E.J. Heart Rate Variability Analysis on Electrocardiograms, Seismocardiograms and Gyrocardiograms on Healthy Volunteers. Sensors 2020, 20, 4522. [Google Scholar] [CrossRef]
- D’Mello, Y.; Skoric, J.; Xu, S.; Roche, P.J.R.; Lortie, M.; Gagnon, S.; Plant, D.V. Real-Time Cardiac Beat Detection and Heart Rate Monitoring from Combined Seismocardiography and Gyrocardiography. Sensors 2019, 19, 3472. [Google Scholar] [CrossRef] [Green Version]
- Sessa, F.; Anna, V.; Messina, G.; Cibelli, G.; Monda, V.; Marsala, G.; Ruberto, M.; Biondi, A.; Cascio, O.; Bertozzi, G.; et al. Heart Rate Variability as Predictive Factor for Sudden Cardiac Death. Aging 2018, 10, 166–177. [Google Scholar] [CrossRef] [PubMed] [Green Version]
- Etemadi, M.; Inan, O.T.; Giovangrandi, L.; Kovacs, G.T.A. Rapid Assessment of Cardiac Contractility on a Home Bathroom Scale. IEEE Trans. Inf. Technol. Biomed. 2011, 15, 864–869. [Google Scholar] [CrossRef] [PubMed]
- Ha, T.; Tran, J.; Liu, S.; Jang, H.; Jeong, H.; Mitbander, R.; Huh, H.; Qiu, Y.; Duong, J.; Wang, R.L.; et al. A Chest-Laminated Ultrathin and Stretchable E-Tattoo for the Measurement of Electrocardiogram, Seismocardiogram, and Cardiac Time Intervals. Adv. Sci. 2019, 6, 1900290. [Google Scholar] [CrossRef] [PubMed] [Green Version]
- Mora, N.; Cocconcelli, F.; Matrella, G.; Ciampolini, P. Fully automated annotation of seismocardiogram for noninvasive vital sign measurements. IEEE Trans. Instrum. Meas. 2020, 69, 1241–1250. [Google Scholar] [CrossRef]
- Dehkordi, P.; Khosrow-Khavar, F.; Di Rienzo, M.; Inan, O.T.; Schmidt, S.E.; Blaber, A.P.; Sørensen, K.; Struijk, J.J.; Zakeri, V.; Lombardi, P.; et al. Comparison of Different Methods for Estimating Cardiac Timings: A Comprehensive Multimodal Echocardiography Investigation. Front. Physiol. 2019, 10, 1057. [Google Scholar] [CrossRef]
- Hoff, L.; Elle, O.J.; Grimnes, M.J.; Halvorsen, S.; Alker, H.J.; Fosse, E. Measurements of Heart Motion Using Accelerometers. In Proceedings of the the 26th Annual International Conference of the IEEE Engineering in Medicine and Biology Society, San Francisco, CA, USA, 1–5 September 2004; Volume 3, pp. 2049–2051. [Google Scholar]
- Salerno, D.M.; Zanetti, J. Seismocardiography for monitoring changes in left ventricular function during ischemia. Chest 1991, 100, 991–993. [Google Scholar] [CrossRef] [Green Version]
- Inan, O.T.; Baran Pouyan, M.; Javaid, A.Q.; Dowling, S.; Etemadi, M.; Dorier, A.; Heller, J.A.; Bicen, A.O.; Roy, S.; De Marco, T.; et al. Novel Wearable Seismocardiography and Machine Learning Algorithms Can Assess Clinical Status of Heart Failure Patients. Circ. Heart Fail. 2018, 11, e004313. [Google Scholar] [CrossRef]
- Sandler, R.; Gamage, P.; Azad, M.K.; Dhar, R.; Raval, N.; Mentz, R.; Mansy, H. Potential SCG Predictors of Heart Failure Readmission. J. Card. Fail. 2020, 26, S87. [Google Scholar] [CrossRef]
- Dehkordi, P.; Bauer, E.P.; Tavakolian, K.; Zakeri, V.; Blaber, A.P.; Khosrow-Khavar, F. Identifying Patients with Coronary Artery Disease Using Rest and Exercise Seismocardiography. Front. Physiol. 2019, 10, 1211. [Google Scholar] [CrossRef]
- Yao, J.; Tridandapani, S.; Wick, C.A.; Bhatti, P.T. Seismocardiography-Based Cardiac Computed Tomography Gating Using Patient-Specific Template Identification and Detection. IEEE J. Transl. Eng. Health Med. 2017, 5, 1–14. [Google Scholar] [CrossRef]
- Iftikhar, Z.; Lahdenoja, O.; Jafari Tadi, M.; Hurnanen, T.; Vasankari, T.; Kiviniemi, T.; Airaksinen, J.; Koivisto, T.; Pänkäälä, M. Multiclass Classifier based Cardiovascular Condition Detection Using Smartphone Mechanocardiography. Sci. Rep. 2018, 8, 9344. [Google Scholar] [CrossRef] [PubMed]
- Hurnanen, T.; Lehtonen, E.; Tadi, M.J.; Kuusela, T.; Kiviniemi, T.; Saraste, A.; Vasankari, T.; Airaksinen, J.; Koivisto, T.; Pankaala, M. Automated Detection of Atrial Fibrillation Based on Time–Frequency Analysis of Seismocardiograms. IEEE J. Biomed. Health Inform. 2017, 21, 1233–1241. [Google Scholar] [CrossRef] [PubMed]
- Jafari Tadi, M.; Mehrang, S.; Kaisti, M.; Lahdenoja, O.; Hurnanen, T.; Jaakkola, J.; Jaakkola, S.; Vasankari, T.; Kiviniemi, T.; Airaksinen, J.; et al. Comprehensive Analysis of Cardiogenic Vibrations for Automated Detection of Atrial Fibrillation Using Smartphone Mechanocardiograms. IEEE Sens. J. 2019, 19, 2230–2242. [Google Scholar] [CrossRef]
- Paukkunen, M.; Parkkila, P.; Hurnanen, T.; Pankaala, M.; Koivisto, T.; Nieminen, T.; Kettunen, R.; Sepponen, R. Beat-by-Beat Quantification of Cardiac Cycle Events Detected from Three-Dimensional Precordial Acceleration Signals. IEEE J. Biomed. Health Inform. 2016, 20, 435–439. [Google Scholar] [CrossRef] [PubMed] [Green Version]
- Elnaggar, I.; Hurnanen, T.; Lahdenoja, O.; Airola, A.; Kaisti, M.; Vasankari, T.; Pykari, J.; Savontaus, M.; Koivisto, T. Detecting Aortic Stenosis Using Seismocardiography and Gryocardiography Combined with Convolutional Neural Networks. In Proceedings of the IEEE 28th Computing in Cardiology (CinC), Brno, Czech Republic, 12–15 September 2021; pp. 1–4. [Google Scholar]
- Yang, C.; Ojha, B.D.; Aranoff, N.D.; Green, P.; Tavassolian, N. Classification of aortic Stenosis Using Conventional Machine Learning and Deep Learning Methods Based on Multi-Dimensional Cardio-Mechanical Signals. Sci. Rep. 2020, 10, 17521. [Google Scholar] [CrossRef]
- Tavakolian, K.; Khosrow-Khavar, F.; Kajbafzadeh, B.; Marzencki, M.; Blaber, A.P.; Kaminska, B.; Menon, C. Precordial Acceleration Signals Improve the Performance of Diastolic Timed Vibrations. Med. Eng. Phys. 2013, 35, 1133–1140. [Google Scholar] [CrossRef]
- Hasan Shandhi, M.M.; Aras, M.; Wynn, S.; Fan, J.; Heller, J.A.; Etemadi, M.; Klein, L.; Inan, O.T. Cardiac Function Monitoring for Patients Undergoing Cancer Treatments Using Wearable Seismocardiography: A Proof-of-Concept Study. In Proceedings of the 42nd Annual International Conference of the IEEE Engineering in Medicine & Biology Society (EMBC), Montreal, QC, Canada, 20–24 July 2020; pp. 4075–4078. [Google Scholar]
- Mehta, N.J.; Khan, I.A. Third heart sound: Genesis and clinical importance. Int. J. Cardiol. 2004, 97, 183–186. [Google Scholar] [CrossRef]
- Khalili, F.; Gamage, P.T.; Taebi, A.; Johnson, M.E.; Roberts, R.B.; Mitchel, J. Spectral Decomposition and Sound Source Localization of Highly Disturbed Flow through a Severe Arterial Stenosis. Bioengineering 2021, 8, 34. [Google Scholar] [CrossRef]
- Khalili, F.; Gamage, P.T.; Taebi, A.; Johnson, M.E.; Roberts, R.B.; Mitchell, J. Spectral Decomposition of the Flow and Characterization of the Sound Signals through Stenoses with Different Levels of Severity. Bioengineering 2021, 8, 41. [Google Scholar] [CrossRef]
- Schmidt, S.E.; Holst-Hansen, C.; Graff, C.; Toft, E.; Struijk, J.J. Detection of Coronary Artery Disease with an Electronic Stethoscope. In Proceedings of the IEEE 34th Computers in Cardiology, Durham, NC, USA, 30 September–3 October 2007; pp. 757–760. [Google Scholar]
- Schmidt, S.; Holst-Hansen, C.; Toft, E.; Struijk, J. Detection of Coronary Artery Disease with an Electronic Stethoscope: Is it possible? In Proceedings of the Summer Meeting, Danish Cardiovascular Research Academy, Sønderborg, Denmark, 7–9 June 2007; p. 26. [Google Scholar]
- Khalili, F.; Taebi, A. Advances in Computational Fluid Dynamics Modeling of Cardiac Sounds as a Non-Invasive Diagnosis Method. In Biomedical and Biotechnology; American Society of Mechanical Engineers: Brussels, Belgium, 2021; Volume 5. [Google Scholar]
- Taebi, A.; Khalili, F. Advances in Noninvasive Diagnosis Based on Body Sounds and Vibrations–A Review. In Biomedical and Biotechnology; American Society of Mechanical Engineers: Brussels, Belgium, 2021; Volume 5. [Google Scholar]
- Khalili, F.; Gamage, P.P.T.; Mansy, H.A. Hemodynamics of a Bileaflet Mechanical Heart Valve with Different Levels of Dysfunction. J. Appl. Biotechnol. Bioeng. 2017, 2, 187–191. [Google Scholar] [CrossRef] [Green Version]
- Khalili, F.; Gamage, P.; Sandler, R.; Mansy, H. Adverse Hemodynamic Conditions Associated with Mechanical Heart Valve Leaflet Immobility. Bioengineering 2018, 5, 74. [Google Scholar] [CrossRef] [PubMed] [Green Version]
- Khalili, F.; Gamage, P.P.T.; Mansy, H.A. Prediction of Turbulent Shear Stresses through Dysfunctional Bileaflet Mechanical Heart Valves using Computational Fluid Dynamics. In Proceedings of the 3rd Thermal and Fluids Engineering Conference (TFEC), Fort Lauderdale, FL, USA, 4–7 March 2018; pp. 1–9. [Google Scholar]
- Khalili, F.; Gamage, P.P.T.; Mansy, H.A. Verification of Turbulence Models for Flow in a Constricted Pipe at Low Reynolds Number. In Proceedings of the 3rd Thermal and Fluids Engineering Conference (TFEC), Fort Lauderdale, FL, USA, 4–7 March 2018; pp. 1–10. [Google Scholar]
- Khalili, F. Fluid Dynamics Modeling and Sound Analysis of a Bileaflet Mechanical Heart Valve. Ph.D. Thesis, University of Central Florida, Orlando, FL, USA, May 2018. [Google Scholar]
- Khalili, F.; Gamage, P.P.T.; Meguid, I.A.; Mansy, H.A. A Coupled CFD-FEA study of the Sound Generated in a Stenosed Artery and Transmitted Through Tissue Layers. In Proceedings of the IEEE SoutheastCon, Orlando, FL, USA, 19–22 April 2018; pp. 1–6. [Google Scholar]
- Le, T.B.; Akerkouch, L. On the Modal Analysis of Blood Flow Dynamics in Brain Aneurysms. In Proceedings of the 2020 Design of Medical Devices Conference, Minneapolis, MN, USA, 6–9 April 2020; American Society of Mechanical Engineers: Brussels, Belgium, 2020. [Google Scholar]
- Fathi, M.F.; Bakhshinejad, A.; Baghaie, A.; Saloner, D.; Sacho, R.H.; Rayz, V.L.; D’Souza, R.M. Denoising and spatial Resolution Enhancement of 4D Flow MRI Using Proper Orthogonal Decomposition and Lasso Regularization. Comput. Med. Imaging Graph. 2018, 70, 165–172. [Google Scholar] [CrossRef] [PubMed]
- Darwish, A.; Di Labbio, G.; Saleh, W.; Kadem, L. Proper Orthogonal Decomposition Analysis of the Flow Downstream of a Dysfunctional Bileaflet Mechanical Aortic Valve. Cardiovasc. Eng. Technol. 2021, 12, 286–299. [Google Scholar] [CrossRef] [PubMed]
- Habibi, M.; Dawson, S.T.M.; Arzani, A. Data-Driven Pulsatile Blood Flow Physics with Dynamic Mode Decomposition. Fluids 2020, 5, 111. [Google Scholar] [CrossRef]
- Janiga, G. Novel Feature-Based Visualization of the Unsteady Blood Flow in Intracranial Aneurysms with the Help of Proper orthogonal Decomposition (POD). Comput. Med. Imaging Graph. 2019, 73, 30–38. [Google Scholar] [CrossRef]
- Ballarin, F.; Faggiano, E.; Ippolito, S.; Manzoni, A.; Quarteroni, A.; Rozza, G.; Scrofani, R. Fast Simulations of Patient-Specific Haemodynamics of Coronary Artery Bypass Grafts Based on a POD–Galerkin Method and a Vascular Shape Parametrization. J. Comput. Phys. 2016, 315, 609–628. [Google Scholar] [CrossRef]
- Rao, A.; Huynh, E.; Royston, T.J.; Kornblith, A.; Roy, S. Acoustic Methods for Pulmonary Diagnosis. IEEE Rev. Biomed. Eng. 2019, 12, 221–239. [Google Scholar] [CrossRef] [Green Version]
- Bohadana, A.; Izbicki, G.; Kraman, S.S. Fundamentals of Lung Auscultation. N. Engl. J. Med. 2014, 370, 744–751. [Google Scholar] [CrossRef] [Green Version]
- Hanna, N.; Smith, J.; Wolfe, J. How the Acoustic Resonances of The Subglottal Tract Affect the Impedance Spectrum Measured Through the Lips. J. Acoust. Soc. Am. 2018, 143, 2639–2650. [Google Scholar] [CrossRef]
- Harper, P.; Kraman, S.S.; Pasterkamp, H.; Wodicka, G.R. An acoustic Model of the Respiratory Tract. IEEE Trans. Biomed. Eng. 2001, 48, 543–550. [Google Scholar] [CrossRef]
- Gavriely, N.; Cugell, D.W. Airflow Effects on Amplitude and Spectral Content of Normal Breath Sounds. J. Appl. Physiol. 1996, 80, 5–13. [Google Scholar] [CrossRef]
- Gavriely, N.; Palti, Y.; Alroy, G. Spectral Characteristics of Normal Breath Sounds. J. Appl. Physiol. 1981, 50, 307–314. [Google Scholar] [CrossRef]
- Gross, V.; Dittmar, A.; Penzel, T.; Schüttler, F.; Von Wichert, P. The Relationship between Normal Lung Sounds, Age, and Gender. Am. J. Respir. Crit. Care Med. 2000, 162, 905–909. [Google Scholar] [CrossRef]
- Schreur, H.J.; Diamant, Z.; Vanderschoot, J.; Zwinderman, A.H.; Dijkman, J.H.; Sterk, P.J. Lung Sounds During Allergen-Induced Asthmatic Responses in Patients with Asthma. Am. J. Respir. Crit. Care Med. 1996, 153, 1474–1480. [Google Scholar] [CrossRef]
- Goettel, N.; Herrmann, M.J. Breath Sounds. Anesth. Analg. 2019, 128, e42. [Google Scholar] [CrossRef]
- Mansy, H.A.; Balk, R.A.; Warren, W.H.; Royston, T.J.; Dai, Z.; Peng, Y.; Sandler, R.H. Pneumothorax Effects on Pulmonary Acoustic Transmission. J. Appl. Physiol. 2015, 119, 250–257. [Google Scholar] [CrossRef] [Green Version]
- Yigla, M.; Gat, M.; Meyer, J.-J.; Friedman, P.J.; Maher, T.M.; Madison, J.M. Vibration Response Imaging Technology in Healthy Subjects. Am. J. Roentgenol. 2008, 191, 845–852. [Google Scholar] [CrossRef]
- Becker, H.D. Vibration Response Imaging–Finally a Real Stethoscope. Respiration 2009, 77, 236–239. [Google Scholar] [CrossRef]
- Aliboni, L.; Pennati, F.; Royston, T.J.; Woods, J.C.; Aliverti, A. Simulation of Bronchial Airway Acoustics in Healthy and Asthmatic Subjects. PLoS ONE 2020, 15, e0228603. [Google Scholar] [CrossRef]
- Fiz, J.A.; Jané, R.; Salvatella, D.; Izquierdo, J.; Lores, L.; Caminal, P.; Morera, J. Analysis of Tracheal Sounds During Forced Exhalation in Asthma Patients and Normal Subjects. Chest 1999, 116, 633–638. [Google Scholar] [CrossRef]
- Song, T.W.; Kim, K.W.; Kim, E.S.; Park, J.-W.; Sohn, M.H.; Kim, K.-E. Utility of Impulse Oscillometry in Young Children with Asthma. Pediatr. Allergy Immunol. 2008, 19, 763–768. [Google Scholar] [CrossRef]
- Barua, M.; Nazeran, H.; Nava, P.; Diong, B.; Goldman, M. Classification of Impulse Oscillometric Patterns of Lung Function in Asthmatic Children using Artificial Neural Networks. In Proceedings of the IEEE 27th Annual International Conference on IEEE Engineering in Medicine and Biology, Shanghai, China, 31 August–3 September 2005; pp. 327–331. [Google Scholar]
- Guntupalli, K.K.; Reddy, R.M.; Loutfi, R.H.; Alapat, P.M.; Bandi, V.D.; Hanania, N.A. Evaluation of Obstructive Lung Disease with Vibration Response Imaging. J. Asthma 2008, 45, 923–930. [Google Scholar] [CrossRef]
- Homs-Corbera, A.; Fiz, J.A.; Morera, J.; Jane, R. Time-Frequency Detection and Analysis of Wheezes During Forced Exhalation. IEEE Trans. Biomed. Eng. 2004, 51, 182–186. [Google Scholar] [CrossRef]
- Pasterkamp, H.; Schäfer, J.; Wodicka, G.R. Posture-Dependent Change of Tracheal Sounds at Standardized Flows in Patients with Obstructive Sleep Apnea. Chest 1996, 110, 1493–1498. [Google Scholar] [CrossRef]
- Elwali, A.; Moussavi, Z. Obstructive Sleep Apnea Screening and Airway Structure Characterization During Wakefulness Using Tracheal Breathing Sounds. Ann. Biomed. Eng. 2017, 45, 839–850. [Google Scholar] [CrossRef]
- Alshaer, H.; Levchenko, A.; Bradley, T.D.; Pong, S.; Tseng, W.-H.; Fernie, G.R. A System for Portable Sleep Apnea Diagnosis Using an Embedded Data Capturing Module. J. Clin. Monit. Comput. 2013, 27, 303–311. [Google Scholar] [CrossRef]
- Goncharoff, V.; Jacobs, J.E.; Cugell, D.W. Wideband Acoustic Transmission of Human Lungs. Med. Biol. Eng. Comput. 1989, 27, 513–519. [Google Scholar] [CrossRef]
- Crim, C.; Celli, B.; Edwards, L.D.; Wouters, E.; Coxson, H.O.; Tal-Singer, R.; Calverley, P.M.A. Respiratory System Impedance with Impulse Oscillometry in Healthy and COPD Subjects: ECLIPSE Baseline Results. Respir. Med. 2011, 105, 1069–1078. [Google Scholar] [CrossRef] [Green Version]
- Gong, S.-G.; Yang, W.-L.; Zheng, W.; Liu, J.-M. Evaluation of Respiratory Impedance in Patients with Chronic Obstructive Pulmonary Disease by an Impulse Oscillation System. Mol. Med. Rep. 2014, 10, 2694–2700. [Google Scholar] [CrossRef]
- Fernandez-Granero, M.; Sanchez-Morillo, D.; Leon-Jimenez, A. Computerised Analysis of Telemonitored Respiratory Sounds for Predicting Acute Exacerbations of COPD. Sensors 2015, 15, 26978–26996. [Google Scholar] [CrossRef] [Green Version]
- Yonemaru, M.; Kikuchi, K.; Mori, M.; Kawai, A.; Abe, T.; Kawashiro, T.; Ishihara, T.; Yokoyama, T. Detection of Tracheal Stenosis by Frequency Analysis of Tracheal Sounds. J. Appl. Physiol. 1993, 75, 605–612. [Google Scholar] [CrossRef]
- Royston, T.J.; Zhang, X.; Mansy, H.A.; Sandler, R.H. Modeling Sound Transmission Through the Pulmonary System and Chest with Application to Diagnosis of a Collapsed Lung. J. Acoust. Soc. Am. 2002, 111, 1931–1946. [Google Scholar] [CrossRef]
- Lichtenstein, D.A.; Menu, Y. A Bedside Ultrasound Sign Ruling Out Pneumothorax in the Critically III. Chest 1995, 108, 1345–1348. [Google Scholar] [CrossRef] [Green Version]
- Blanco, M.; Mor, R.; Fraticelli, A.; Breen, D.P.; Dutau, H. Distribution of Breath Sound Images in Patients with Pneumothoraces Compared to Healthy Subjects. Respiration 2009, 77, 173–178. [Google Scholar] [CrossRef]
- Kompis, M.; Pasterkamp, H.; Wodicka, G.R. Acoustic Imaging of the Human Chest. Chest 2001, 120, 1309–1321. [Google Scholar] [CrossRef] [Green Version]
- Rao, A.; Ruiz, J.; Bao, C.; Roy, S. Tabla: A Proof-of-Concept Auscultatory Percussion Device for Low-Cost Pneumonia Detection. Sensors 2018, 18, 2689. [Google Scholar] [CrossRef] [Green Version]
- Lichtenstein, D.; Mezière, G.; Seitz, J. The Dynamic Air Bronchogram. Chest 2009, 135, 1421–1425. [Google Scholar] [CrossRef]
- Anantham, D.; Herth, F.J.F.; Majid, A.; Michaud, G.; Ernst, A. Vibration Response Imaging in the Detection of Pleural Effusions: A Feasibility Study. Respiration 2009, 77, 166–172. [Google Scholar] [CrossRef]
- Osman, L.P.; Roughton, M.; Hodson, M.E.; Pryor, J.A. Short-Term Comparative Study of High Frequency Chest Wall Oscillation and European Airway Clearance Techniques in Patients with cystic fibrosis. Thorax 2010, 65, 196–200. [Google Scholar] [CrossRef] [Green Version]
- Hristara-Papadopoulou, A.; Tsanakas, J.; Diomou, G.; Papadopoulou, O. Current Devices of Respiratory Physiotherapy. Hippokratia 2008, 12, 211–220. [Google Scholar]
- Muguli, A.; Pinto, L.; Sharma, N.; Krishnan, P.; Ghosh, P.K.; Kumar, R.; Ramoji, S.; Bhat, S.; Chetupalli, S.R.; Ganapathy, S.; et al. DiCOVA Challenge: Dataset, task, and baseline system for COVID-19 diagnosis using acoustics. arXiv 2021, arXiv:2103.09148. [Google Scholar]
- Rogers, J.; Ni, X.; Ouyang, W.; Jeong, H.; Kim, J.-T.; Tzavelis, A.; Mirzazadeh, A.; Wu, C.; Lee, J.Y.; Keller, M.; et al. Long-term, Continuous, and Multimodal Monitoring of Respiratory Digital Biomarkers Via Wireless Epidermal Mechano-Acoustic Sensing in Clinical and Home Settings for COVID-19 patients. Proc. Natl. Acad. Sci. USA 2020, 118, e2026610118. [Google Scholar]
- Brashier, B.; Salvi, S. Measuring Lung Function Using Sound Waves: Role of the Forced Oscillation Technique and Impulse Oscillometry System. Breathe 2015, 11, 57–65. [Google Scholar] [CrossRef] [PubMed]
- Beydon, N. Pulmonary Function Testing in Young Children. Paediatr. Respir. Rev. 2009, 10, 208–213. [Google Scholar] [CrossRef]
- Penzel, T.; Sabil, A. The Use of Tracheal Sounds for the Diagnosis of Sleep Apnoea. Breathe 2017, 13, e37–e45. [Google Scholar] [CrossRef]
- Berry, R.B.; Budhiraja, R.; Gottlieb, D.J.; Gozal, D.; Iber, C.; Kapur, V.K.; Marcus, C.L.; Mehra, R.; Parthasarathy, S.; Quan, S.F.; et al. Rules for Scoring Respiratory Events in Sleep: Update of the 2007 AASM Manual for the Scoring of Sleep and Associated Events. J. Clin. Sleep Med. 2012, 08, 597–619. [Google Scholar] [CrossRef] [Green Version]
- Sabil, A.; Glos, M.; Günther, A.; Schöbel, C.; Veauthier, C.; Fietze, I.; Penzel, T. Comparison of Apnea Detection Using Oronasal Thermal Airflow Sensor, Nasal Pressure Transducer, Respiratory Inductance Plethysmography and Tracheal Sound Sensor. J. Clin. Sleep Med. 2019, 15, 285–292. [Google Scholar] [CrossRef] [Green Version]
- Maughan, R.J.; Shirreffs, S.M. Muscle Cramping During Exercise: Causes, Solutions, and Questions Remaining. Sport Med. 2019, 49, 115–124. [Google Scholar] [CrossRef] [Green Version]
- Kuo, Y.-C.; Song, T.-T.; Bernard, J.R.; Liao, Y.-H. Short-Term Expiratory Muscle Strength Training Attenuates Sleep Apnea and Improves Sleep Quality in Patients with Obstructive Sleep Apnea. Respir. Physiol. Neurobiol. 2017, 243, 86–91. [Google Scholar] [CrossRef]
- Ruuskanen, O.; Lahti, E.; Jennings, L.C.; Murdoch, D.R. Viral Pneumonia. Lancet 2011, 377, 1264–1275. [Google Scholar] [CrossRef]
- Ayan, E.; Unver, H.M. Diagnosis of Pneumonia from Chest X-Ray Images Using Deep Learning. In Proceedings of the IEEE 2019 Scientific Meeting on Electrical-Electronics & Biomedical Engineering and Computer Science (EBBT), Istanbul, Turkey, 24–26 April 2019; pp. 1–5. [Google Scholar]
- Bartziokas, K.; Daenas, C.; Preau, S.; Zygoulis, P.; Triantaris, A.; Kerenidi, T.; Makris, D.; Gourgoulianis, K.I.; Daniil, Z. Vibration Response Imaging: Evaluation of Rater Agreement in Healthy Subjects and Subjects with Pneumonia. BMC Med. Imaging 2010, 10, 6. [Google Scholar] [CrossRef] [PubMed] [Green Version]
- Jiang, H.; Chen, J.; Cao, J.; Mu, L.; Hu, Z.; He, J. Application of Vibration Response Imaging Technology in Patients with Community-Acquired Pneumonia Before and After the Treatment. Exp. Ther. Med. 2017, 13, 3433–3437. [Google Scholar] [CrossRef] [PubMed] [Green Version]
- Rennard, S.I.; Drummond, M.B. Early Chronic Obstructive Pulmonary Disease: Definition, Asessment, and Prevention. Lancet 2015, 385, 1778–1788. [Google Scholar] [CrossRef] [Green Version]
- WHO The top 10 Causes of Death. Available online: https://www.who.int/en/news-room/fact-sheets/detail/the-top-10-causes-of-death (accessed on 15 February 2022).
- Altan, G.; Kutlu, Y.; Allahverdi, N. Deep Learning on Computerized Analysis of Chronic Obstructive Pulmonary Disease. IEEE J. Biomed. Health Inform. 2020, 24, 1344–1350. [Google Scholar] [CrossRef]
- Kim, V.; Criner, G.J. Chronic Bronchitis and Chronic Obstructive Pulmonary Disease. Am. J. Respir. Crit. Care Med. 2013, 187, 228–237. [Google Scholar] [CrossRef] [Green Version]
- Liu, Y.; Lin, Y.; Zhang, X.; Wang, Z.; Gao, Y.; Chen, G.; Xiong, H. Classifying Respiratory Sounds Using Electronic Stethoscope. In Proceedings of the 2017 IEEE SmartWorld, Ubiquitous Intelligence & Computing, Advanced & Trusted Computed, Scalable Computing & Communications, Cloud & Big Data Computing, Internet of People and Smart City Innovation (SmartWorld/SCALCOM/UIC/ATC/CBDCom/IOP/SCI), San Francisco, CA, USA, 4–8 August 2017; IEEE: Picataway, NJ, USA, 2017; pp. 1–8. [Google Scholar]
- Emmanouilidou, D.; McCollum, E.D.; Park, D.E.; Elhilali, M. Computerized Lung Sound Screening for Pediatric Auscultation in Noisy Field Environments. IEEE Trans. Biomed. Eng. 2018, 65, 1564–1574. [Google Scholar] [CrossRef]
- Henry, B.; Royston, T.J. A Multiscale Analytical Model of Bronchial Airway Acoustics. J. Acoust. Soc. Am. 2017, 142, 1774–1783. [Google Scholar] [CrossRef]
- Hu, P.; Cai, C.; Yi, H.; Zhao, J.; Feng, Y.; Wang, Q. Aiding Airway Obstruction Diagnosis with Computational Fluid Dynamics and Convolutional Neural Network: A New Perspective and Numerical Case Study. J. Fluids Eng. 2022, 144, 081206. [Google Scholar] [CrossRef]
- Gamage, P.P.T.; Khalili, F.; Khurshidul Azad, M.D.; Mansy, H.A. Modeling Inspiratory Flow in a Porcine Lung Airway. J. Biomech. Eng. 2018, 140, 061003. [Google Scholar] [CrossRef]
- Wang, L.; Ge, H.; Chen, L.; Hajipour, A.; Feng, Y.; Cui, X. LES Study on the Impact of Airway Deformation on the Airflow Structures in the Idealized Mouth–Throat Model. J. Braz. Soc. Mech. Sci. Eng. 2022, 44, 23. [Google Scholar] [CrossRef]
- Du, X.; Allwood, G.; Webberley, K.M.; Osseiran, A.; Wan, W.; Volikova, A.; Marshall, B.J. A Mathematical Model of Bowel Sound Generation. J. Acoust. Soc. Am. 2018, 144, EL485–EL491. [Google Scholar] [CrossRef] [PubMed]
- Dimoulas, C.; Kalliris, G.; Papanikolaou, G.; Kalampakas, A. Long-Term Signal Detection, Segmentation and Summarization Using Wavelets and Fractal Dimension: A Bioacoustics Application in Gastrointestinal-Motility Monitoring. Comput. Biol. Med. 2007, 37, 438–462. [Google Scholar] [CrossRef] [PubMed]
- Dimoulas, C.; Kalliris, G.; Papanikolaou, G.; Petridis, V.; Kalampakas, A. Bowel-Sound Pattern Analysis Using Wavelets and Neural Networks with Application to Long-Term, Unsupervised, Gastrointestinal Motility Monitoring. Expert Syst. Appl. 2008, 34, 26–41. [Google Scholar] [CrossRef]
- Massey, R.L. Return of Bowel Sounds Indicating an End of Postoperative Ileus: Is it Time to Cease This Long-Standing Nursing Tradition? Medsurg Nurs. 2012, 21, 146–150. [Google Scholar] [PubMed]
- Sugrue, M.; Redfern, M.; Kurata, J.H. Computerized Phonoenterography. J. Clin. Gastroenterol. 1994, 18, 139–144. [Google Scholar] [CrossRef] [PubMed]
- Tomomasa, T.; Morikawa, A.; Sandler, R.H.; Mansy, H.A.; Koneko, H.; Masahiko, T.; Hyman, P.E.; Itoh, Z. Gastrointestinal Sounds and Migrating Motor Complex in Fasted Humans. Am. J. Gastroenterol. 1999, 94, 374–381. [Google Scholar] [CrossRef] [PubMed]
- Yuki, M.; Adachi, K.; Fujishiro, H.; Uchida, Y.; Miyaoka, Y.; Yoshino, N.; Yuki, T.; Ono, M.; Kinoshita, Y. Is A Computerized Bowel Sound Auscultation System Useful for The Detection of Increased Bowel Motility? Am. J. Gastroenterol. 2002, 97, 1846–1848. [Google Scholar] [CrossRef]
- Tomomasa, T.; Takahashi, A.; Nako, Y.; Kaneko, H.; Tabata, M.; Tsuchida, Y.; Morikawa, A. Analysis of Gastrointestinal Sounds in Infants with Pyloric Stenosis Before and After Pyloromyotomy. Pediatrics 1999, 104, e60. [Google Scholar] [CrossRef] [Green Version]
- Lu, Q.; Yadid-Pecht, O.; Sadowski, D.; Mintchev, M.P. Acoustic and Intraluminal Ultrasonic Technologies in the Diagnosis of Diseases in Gastrointestinal Tract: A Review. Engineering 2013, 05, 73–77. [Google Scholar] [CrossRef] [Green Version]
- Du, X.; Allwood, G.; Webberley, K.M.; Inderjeeth, A.-J.; Osseiran, A.; Marshall, B.J. Noninvasive Diagnosis of Irritable Bowel Syndrome via Bowel Sound Features: Proof of Concept. Clin. Transl. Gastroenterol. 2019, 10, e00017. [Google Scholar] [CrossRef]
- Spiegel, B.M.R.; Kaneshiro, M.; Russell, M.M.; Lin, A.; Patel, A.; Tashjian, V.C.; Zegarski, V.; Singh, D.; Cohen, S.E.; Reid, M.W.; et al. Validation of an Acoustic Gastrointestinal Surveillance Biosensor for Postoperative Ileus. J. Gastrointest. Surg. 2014, 18, 1795–1803. [Google Scholar] [CrossRef] [PubMed]
- Kaneshiro, M.; Kaiser, W.; Pourmorady, J.; Fleshner, P.; Russell, M.; Zaghiyan, K.; Lin, A.; Martinez, B.; Patel, A.; Nguyen, A.; et al. Postoperative Gastrointestinal Telemetry with an Acoustic Biosensor Predicts Ileus vs. Uneventful GI Recovery. J. Gastrointest. Surg. 2016, 20, 132–139. [Google Scholar] [CrossRef] [PubMed]
- Li, B.; Wang, J.-R.; Ma, Y.-L. Bowel Sounds and Monitoring Gastrointestinal Motility in Critically Ill Patients. Clin. Nurse Spec. 2012, 26, 29–34. [Google Scholar] [CrossRef] [PubMed]
- Lord, S.; Rochester, L.; Baker, K.; Nieuwboer, A. Concurrent Validity of Accelerometry to Measure Gait in Parkinsons Disease. Gait Posture 2008, 27, 357–359. [Google Scholar] [CrossRef]
- Ornelas-Vences, C.; Sánchez-Fernández, L.P.; Sánchez-Pérez, L.A.; Martínez-Hernández, J.M. Computer Model for Leg Agility Quantification and Assessment for Parkinson’s Disease Patients. Med. Biol. Eng. Comput. 2019, 57, 463–476. [Google Scholar] [CrossRef]
- Aminian, S.; Ezeugwu, V.E.; Motl, R.W.; Manns, P.J. Sit Less and Move More: Perspectives of Adults with Multiple Sclerosis. Disabil. Rehabil. 2019, 41, 904–911. [Google Scholar] [CrossRef]
- Charles, P.D.; Esper, G.J.; Davis, T.J.; Maciunas, R.J.; Robertson, D. Classification of Tremor and Update on Treatment. Am. Fam. Phys. 1999, 59, 1565. [Google Scholar]
- Preeti, M.; Guha, K.; Baishnab, K.L.; Dusarlapudi, K.; Narasimha Raju, K. Low Frequency MEMS Accelerometers in Health Monitoring–A Review Based on Material and Design Aspects. Mater. Today Proc. 2019, 18, 2152–2157. [Google Scholar] [CrossRef]
- Cortés, J.P.; Espinoza, V.M.; Ghassemi, M.; Mehta, D.D.; Van Stan, J.H.; Hillman, R.E.; Guttag, J.V.; Zañartu, M. Ambulatory Assessment of Phonotraumatic Vocal Hyperfunction Using Glottal Airflow Measures Estimated from Neck-Surface Acceleration. PLoS ONE 2018, 13, e0209017. [Google Scholar] [CrossRef] [Green Version]
- Mehdizadehfar, V.; Almasganj, F.; Torabinezhad, F. Investigation of the Effects of Speech Signal Length on Vocal Disorder Sorting Done Via Dynamic Pattern Modeling. J. Voice 2017, 31, 515.e1–515.e8. [Google Scholar] [CrossRef]
- Santamato, A.; Panza, F.; Solfrizzi, V.; Russo, A.; Frisardi, V.; Megna, M.; Ranieri, M.; Fiore, P. Acoustic Analysis of Swallowing Sounds: A New Technique for Assessing Dysphagia. J. Rehabil. Med. 2009, 41, 639–645. [Google Scholar] [CrossRef] [PubMed] [Green Version]
- Dudik, J.M.; Kurosu, A.; Coyle, J.L.; Sejdić, E. Dysphagia and Its Effects on Swallowing Sounds and Vibrations in Adults. Biomed. Eng. Online 2018, 17, 69. [Google Scholar] [CrossRef] [PubMed] [Green Version]
- Lazareck, L.J.; Moussavi, Z.M.K. Classification of Normal and Dysphagic Swallows by Acoustical Means. IEEE Trans. Biomed. Eng. 2004, 51, 2103–2112. [Google Scholar] [CrossRef] [PubMed] [Green Version]
- Chetlur Adithya, P.; Sankar, R.; Moreno, W.A.; Hart, S. Trends in Fetal Monitoring Through Phonocardiography: Challenges and Future Directions. Biomed. Signal. Process. Control. 2017, 33, 289–305. [Google Scholar] [CrossRef]
- Mollan, R.A.; McCullagh, G.C.; Wilson, R.I. A Critical Appraisal of Auscultation of Human Joints. Clin. Orthop. Relat. Res. 1982, 170, 231–237. [Google Scholar] [CrossRef]
- Shark, L.-K. Discovering Differences in Acoustic Emission Between Healthy and Osteoarthritic Knees Using a Four-Phase Model of Sit-Stand-Sit Movements. Open Med. Inform. J. 2010, 4, 116–125. [Google Scholar] [CrossRef] [PubMed] [Green Version]
- Wang, J.; Warnecke, J.M.; Haghi, M.; Deserno, T.M. Unobtrusive Health Monitoring in Private Spaces: The Smart Vehicle. Sensors 2020, 20, 2442. [Google Scholar] [CrossRef]
- Di Rienzo, M.; Piccirillo, S. Wearables for Life in Space. In Wearable Sensors; Elsevier: Amsterdam, The Netherlands, 2021; pp. 463–486. [Google Scholar]
- McKee, A.M.; Goubran, R.A. Sound Localization in the Human Thorax. In Proceedings of the IEEE Instrumentationand Measurement Technology Conference Proceedings, Ottawa, ON, Canada, 16–19 May 2005; Volume 1, pp. 117–122. [Google Scholar]
- Saeidi, A.; Almasganj, F. 3D Heart Sound Source Localization Via Combinational Subspace Methods for Long-Term Heart Monitoring. Biomed. Signal. Process. Control. 2017, 31, 434–443. [Google Scholar] [CrossRef]


Publisher’s Note: MDPI stays neutral with regard to jurisdictional claims in published maps and institutional affiliations. |
© 2022 by the authors. Licensee MDPI, Basel, Switzerland. This article is an open access article distributed under the terms and conditions of the Creative Commons Attribution (CC BY) license (https://creativecommons.org/licenses/by/4.0/).