The Mediterranean Diet and Cognitive Function among Healthy Older Adults in a 6-Month Randomised Controlled Trial: The MedLey Study

 ,
,
Abstract
:1. Introduction
2. Methods
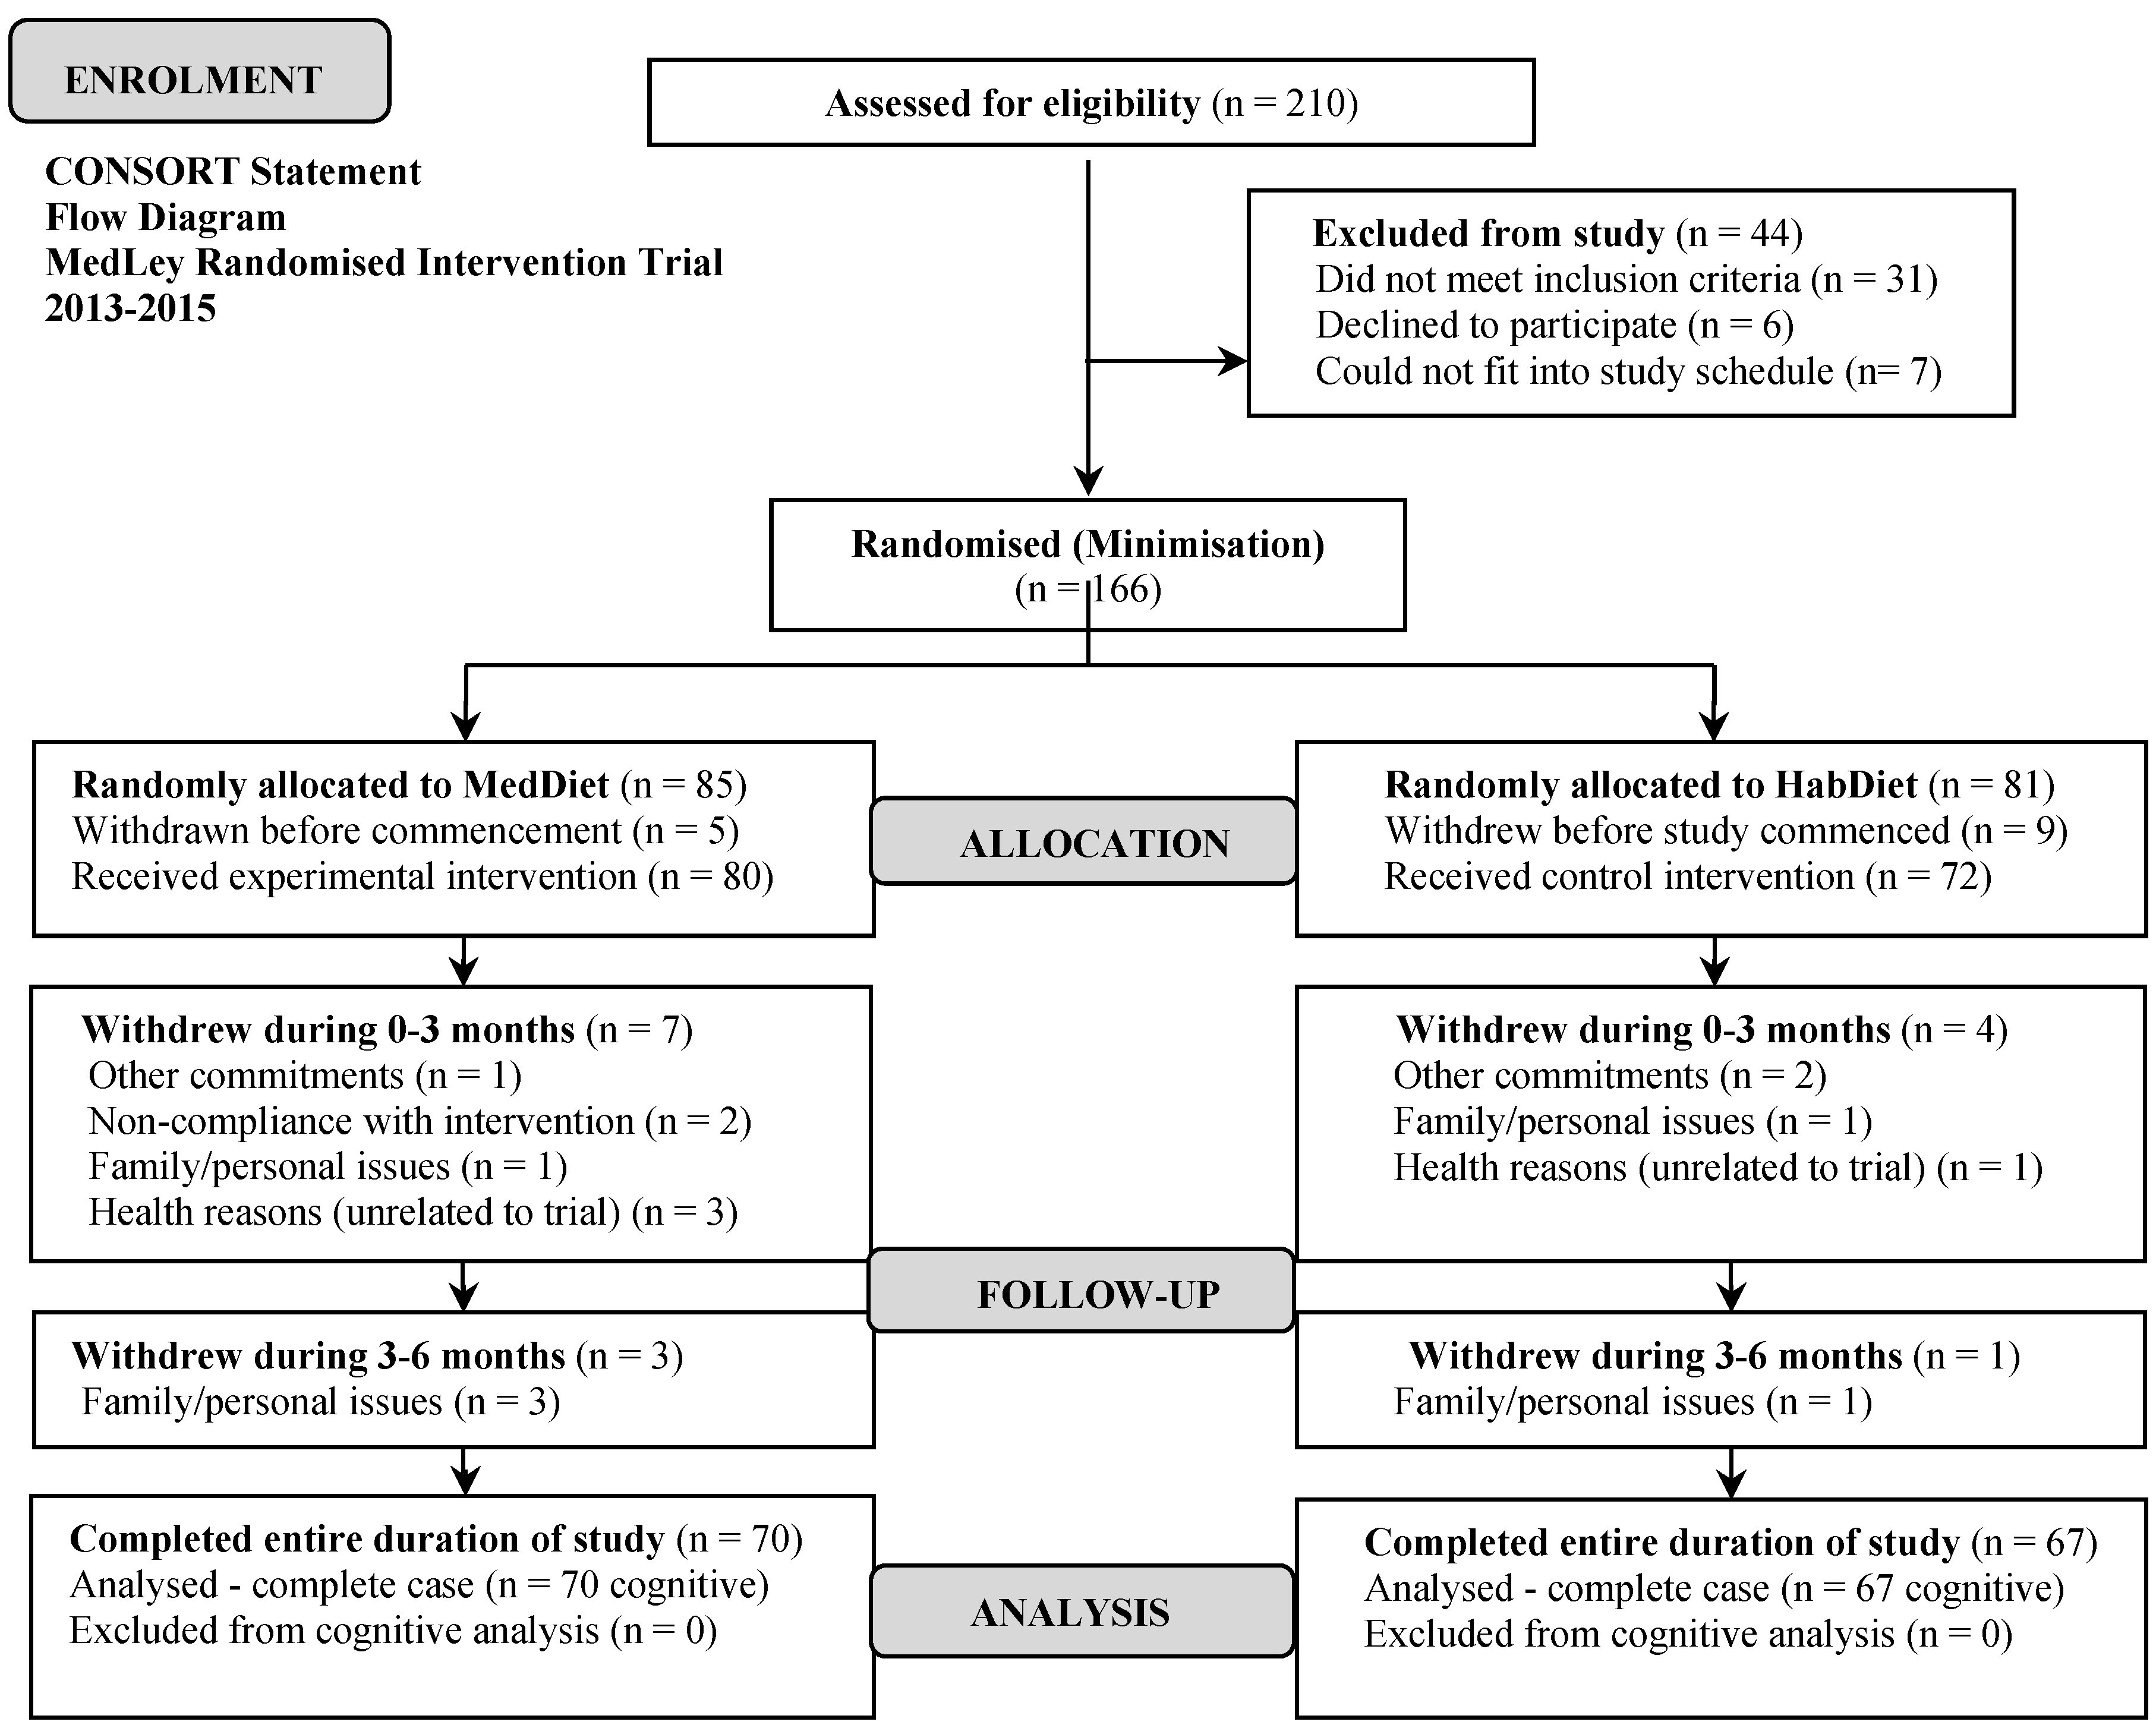
2.1. Study Design
2.2. Study Population
2.3. Minimised Randomisation
2.4. Power Calculations
2.5. Diet Intervention—Mediterranean Diet
2.6. Compliance
2.7. Covariate Assessment
2.8. Primary Outcome—Cognitive Assessment
2.9. Statistical Analyses
3. Results
3.1. Descriptive Statistics
3.1.1. Participant Characteristics
3.1.2. Changes in Diet Observed in Experimental and Control Groups
3.2. Inferential Statistics
Primary Outcome: Age-Related Cognitive Function
4. Discussion
5. Conclusions
Acknowledgments
Author Contributions
Conflicts of Interest
References
- World Health Organization. Dementia. Fact Sheet No. 362. Available online: http://www.who.int/mediacentre/factsheets/fs362/en/ (accessed on 22 July 2015).
- Australian Institute of Health and Welfare. Dementia in Australia. Available online: http://www.aihw.gov.au/publication-detail/?id=10737422958 (accessed on 22 July 2015).
- Singh, B.; Parsaik, A.K.; Mielke, M.M.; Erwin, P.J.; Knopman, D.S.; Petersen, R.C.; Roberts, R.O. Association of Mediterranean diet with mild cognitive impairment and Alzheimer’s disease: A systematic review and meta-analysis. J. Alzheimer's Dis. 2014, 39, 271–282. [Google Scholar]
- Willett, W.C.; Sacks, F.; Trichopoulou, A.; Drescher, G.; Ferro-Luzzi, A.; Helsing, E.; Trichopoulos, D. Mediterranean diet pyramid: A cultural model for healthy eating. Am. J. Clin. Nutr. 1995, 61, 1402–1406. [Google Scholar]
- Gomez-Pinilla, F. Brain foods: The effects of nutrients on brain function. Nat. Rev. Neurosci. 2008, 9, 568–578. [Google Scholar] [CrossRef] [PubMed]
- Sofi, F.; Abbate, R.; Gensini, G.F.; Casini, A. Accruing evidence on benefits of adherence to the Mediterranean diet on health: An updated systematic review and meta-analysis. Am. J. Clin. Nutr. 2010, 92, 1189–1196. [Google Scholar] [CrossRef] [PubMed]
- Knight, A.; Bryan, J.; Murphy, K. Is the Mediterranean diet a feasible approach to preserving cognitive function and reducing risk of dementia for older adults in Western countries? New insights and future directions. Ageing Res. Rev. 2015, 25, 85–101. [Google Scholar] [CrossRef] [PubMed]
- Gu, Y.; Luchsinger, J.A.; Stern, Y.; Scarmeas, N. Mediterranean diet, inflammatory and metabolic biomarkers and risk of Alzheimer disease. J. Alzheimer's Dis. 2010, 22, 483–492. [Google Scholar]
- Féart, C.; Samieri, C.; Barberger-Gateau, P. Mediterranean diet and cognitive health: An update of available knowledge. Curr. Opin. Clin. Nutr. 2015, 13, 14–18. [Google Scholar] [CrossRef] [PubMed]
- Kesse-Guyot, E.; Andreeva, V.A.; Lassale, C.; Ferry, M.; Jeandel, C.; Hercberg, S.; Galan, P. Mediterranean diet and cognitive function: A French study. Am. J. Clin. Nutr. 2013, 97, 369–376. [Google Scholar] [CrossRef] [PubMed]
- Cherbuin, N.; Anstey, K.J. The Mediterranean diet is not related to cognitive change in a large prospective investigation: The PATH through Life study. Am. J. Geriatr. Psychiatry 2012, 20, 635–639. [Google Scholar] [CrossRef] [PubMed]
- Scarmeas, N.; Stern, Y.; Tang, M.X.; Mayeux, R.; Luchsinger, J.A. Mediterranean diet and risk for Alzheimer’s disease. Ann. Neurol. 2006, 59, 912–921. [Google Scholar] [CrossRef] [PubMed]
- Tangney, C.C.; Li, H.; Wang, Y.; Barnes, L.; Schneider, J.A.; Bennett, D.A.; Morris, M.C. Relation of DASH- and Mediterranean-like dietary patterns to cognitive decline in older persons. Neurology 2014, 83, 1410–1416. [Google Scholar] [CrossRef] [PubMed]
- Wengreen, H.; Munger, R.G.; Cutler, A.; Quach, A.; Bowles, A.; Corcoran, C.; Tschanz, J.T.; Norton, M.C.; Welsh-Bohmer, K.A. Prospective study of dietary approaches to stop hypertension- and mediterranean-style dietary patterns and age-related cognitive change: The cache county study on memory, health and aging. Am. J. Clin. Nutr. 2013, 98, 1263–1271. [Google Scholar] [CrossRef] [PubMed]
- Titova, O.E.; Ax, E.; Brooks, S.J.; Sjögren, P.; Cederholm, T.; Kilander, L.; Kullberg, J.; Larsson, E.M.; Johansson, L.; Ahlström, H.; et al. Mediterranean diet habits in older individuals: Associations with cognitive functioning and brain volumes. Exp. Gerontol. 2013, 48, 1443–1448. [Google Scholar] [CrossRef] [PubMed]
- Samieri, C.; Grodstein, F.; Rosner, B.A.; Kang, J.H.; Cook, N.R.; Manson, J.E.; Buring, J.E.; Willett, W.C.; Okereke, O.I. Mediterranean diet and cognitive function in older age. Epidemiology 2013, 24, 490–499. [Google Scholar] [CrossRef] [PubMed]
- Martinez-Lapiscina, E.H.; Clavero, P.; Toledo, E.; Estruch, R.; Salas-Salvado, J.; San Julian, B.S.; Sanchez-Tainta, A.; Ros, E.; Valls-Pedret, C.; Martinez-Gonzalez, M.A. Mediterranean diet improves cognition: The PREDIMED-NAVARRA randomised trial. J. Neurol. Neurosur. Psychiatry 2013, 84, 1318–1325. [Google Scholar] [CrossRef] [PubMed]
- Folstein, M.F.; Folstein, S.E.; McHugh, P.R. Mini-mental state. A practical method for grading the cognitive state of patients for the clinician. J. Psychiatry Res. 1975, 12, 189–198. [Google Scholar] [CrossRef]
- Del Ser Quijano, T.; García de Yébenes, M.J.; Sánchez, S.; Frades, P.B.; Rodríguez, L.A.; Bartolomé Martínez, M.P.; Otero, P.A. The nutrition transition: New trends in the global diet. Med. Clin. (Barc.) 2004, 122, 727–740. [Google Scholar] [CrossRef]
- Valls-Pedret, C.; Sala-Vila, A.; Serra-Mir, M.; Corella, D.; de la Torre, R.; Martínez-González, M.Á.; Martínez-Lapiscina, E.H.; Fitó, M.; Pérez-Heras, A.; Salas-Salvadó, J.; et al. Mediterranean diet and age-related cognitive decline: A randomized clinical trial. JAMA Intern. Med. 2015, 175, 1094–1103. [Google Scholar] [CrossRef] [PubMed]
- Schmidt, M. Rey Auditory and Verbal Learning Test: A Handbook; Western Psychological Services: Los Angeles, CA, USA, 1996. [Google Scholar]
- Knight, A.; Bryan, J.; Wilson, C.; Hodgson, J.; Murphy, K. A randomised controlled intervention trial evaluating the efficacy of a Mediterranean dietary pattern on cognitive function and psychological wellbeing in healthy older adults: The MedLey study. BMC Geriatr. 2015, 15, 55. [Google Scholar] [CrossRef] [PubMed]
- Davis, C.R.; Bryan, J.; Hodgson, J.M.; Wilson, C.; Dhillon, V.; Murphy, K.J. A randomised controlled intervention trial evaluating the efficacy of an Australianised Mediterranean diet compared to the habitual Australian diet on cognitive function, psychological wellbeing and cardiovascular health in healthy older adults (MedLey study): Protocol paper. BMC Nutr. 2015, 1, 35. [Google Scholar] [CrossRef]
- Kalbe, E.; Kessler, J.; Calabrese, P.; Smith, R.; Passmore, A.P.; Brand, M.; Bullock, R. DemTect: A new, sensitive cognitive screening test to support the diagnosis of mild cognitive impairment and early dementia. Int. J. Geriatr. Psychiatry 2004, 19, 136–143. [Google Scholar] [CrossRef] [PubMed]
- Norman, G.R.; Sloan, J.A.; Wyrwich, K.W. Interpretation of changes in health-related quality of life: The remarkable universality of half a standard deviation. Med. Care 2003, 41, 582–592. [Google Scholar] [CrossRef] [PubMed]
- Trichopoulou, A.; Costacou, T.; Bamia, C.; Trichopoulos, D. Adherence to a Mediterranean diet and survival in a Greek population. N. Engl. J. Med. 2003, 48, 2599–2608. [Google Scholar] [CrossRef] [PubMed]
- Kromhout, D.; Keys, A.; Aravanis, C.; Buzina, R.; Fidanza, F.; Giampaoli, S. Food consumption patterns in the 1960s in seven countries. Am. J. Clin. Nutr. 1989, 49, 889–894. [Google Scholar] [PubMed]
- Spielberger, C.D. The State Trait Anxiety Inventory STAI form Y (Test Manual); Consulting Psychologists Press: Palo Alto, CA, USA, 1983. [Google Scholar]
- Radloff, L.S. The CES-D Scale: A self-report depression scale for research in the general population. Appl. Psychol. Meas. 1977, 1, 385–401. [Google Scholar] [CrossRef]
- Cohen, S.; Karmarck, T.; Mermelstein, R. A global measure of perceived stress. J. Health Soc. Behav. 1983, 24, 385–396. [Google Scholar] [CrossRef] [PubMed]
- Parrot, A.; Hindmarch, I. The Leeds sleep evaluation questionnaire in psychopharmacological investigations—A review. Psychopharmacology 1980, 71, 173–179. [Google Scholar] [CrossRef]
- Deary, I.J. Intelligence. Annu. Rev. Psychol. 2012, 63, 453–482. [Google Scholar] [CrossRef] [PubMed]
- Salthouse, T.A.; Ferrer-Caja, E. What needs to be explained to account for age-related effects on multiple cognitive variables? Psychol. Aging 2003, 18, 91–110. [Google Scholar] [CrossRef] [PubMed]
- Dodrill, C.B. A neuropsychological battery for epilepsy. Epilepsia 1978, 19, 611–23. [Google Scholar] [CrossRef] [PubMed]
- Delis, D.C.; Kaplan, E.; Kramer, J.H. Delis-Kaplan Executive Function System (D-KEFS); Harcourt Assessment: Ocala, FL, USA, 2001. [Google Scholar]
- Wechsler, D. Wechsler Adult Intelligence Scale—Fourth Edition; Pearson: San Antonio, TX, USA, 2008. [Google Scholar]
- Benton, A.L. Revised Visual Retention Test: Clinical and Experimental Applications, 4th ed.; The Psychological Corporation: San Antonio, TX, USA, 1974. [Google Scholar]
- Osborne, J.W. Best Practices in Quantitative Methods; SAGE Publications Inc.: London, UK, 2008. [Google Scholar]
- Field, A. Discovering Statistics Using SPSS, 3rd ed.; SAGE Publications Inc.: London, UK, 2009. [Google Scholar]
- Bryman, A. Social Research Methods; Oxford University Press: Oxford, UK, 2004. [Google Scholar]
- Samieri, C.; Okereke, O.I.; Devore, E.E.; Grodstein, F. Long-term adherence to the mediterranean diet is associated with overall cognitive status, but not cognitive decline, in women. J. Nutr. 2013, 143, 493–499. [Google Scholar] [CrossRef] [PubMed]
- Ackerman, P.L. Ability Determinants of Individual Differences in Skilled Performance; Cambridge University Press: New York, NY, USA, 2005. [Google Scholar]
- Stern, Y. What is cognitive reserve? Theory and research application of the reserve concept. J. Int. Neuropsychol. Soc. 2002, 8, 448–460. [Google Scholar] [CrossRef] [PubMed]
- Schooler, C.; Mulatu, M.S. The reciprocal effects of leisure time activities and intellectual functioning in older people: A longitudinal analysis. Psychol. Aging 2001, 16, 466–482. [Google Scholar] [CrossRef]
- Salthouse, T.A.; Pink, J.E.; Tucker-Drob, E.M. Contextual analysis of fluid intelligence. Intelligence 2008, 36, 464–486. [Google Scholar] [CrossRef] [PubMed]
- Knight, A.; Bryan, J.; Murphy, K. The mediterranean diet and age-related cognitive functioning: A systematic review of study findings and neuropsychological assessment methodology. Nutr. Neurosci. 2016, 18, 1–20. [Google Scholar] [CrossRef] [PubMed]
- Davis, C.; Bryan, J.; Hodgson, J.; Murphy, K. Definition of the mediterranean diet; a literature review. Nutrients 2015, 7, 9139–9153. [Google Scholar] [CrossRef] [PubMed]

| Variables at Baseline | MedDiet (n = 70) a | HabDiet (Control) (n = 67) a | p-Value |
|---|---|---|---|
| Age, Mean (SD) c | 72.1 (4.9) | 72.0 (5.0) | 0.960 |
| Sex (Women, N, %) a,b | 33 (24.1) | 40 (29.2) | 0.098 |
| Body Mass Index (kg/m2) c | 26.5 (3.5) | 26.9 (4.1) | 0.512 |
| Birth country Australia (N, %) a,b | 40 (29.2) | 30 (21.9) | 0.521 |
| Married (N, %) a,b | 48 (35.0) | 50 (36.5) | 0.318 |
| Education only secondary (N, %) a,b | 27 (19.7) | 29 (21.2) | 0.549 |
| Retired (N, %) a,b | 63 (46.0) | 50 (36.5) | 0.237 |
| Risk factors (N, %) a,b | |||
| Presence of at least one ApoE-4 genotype | 24 (17.5) | 30 (21.9) | 0.163 |
| Family history of heart attack | 27 (19.7) | 25 (18.2) | 0.845 |
| Family history of stroke | 17 (12.4) | 19 (13.9) | 0.799 |
| Family history of diabetes | 20 (14.6) | 22 (16.1) | 0.688 |
| Family history of high blood pressure | 32 (23.4) | 23 (16.8) | 0.502 |
| Family history of dementia | 16 (11.7) | 10 (7.3) | 0.298 |
| Health and psychological status score, Mean (SD) c | |||
| SF-36 Total Physical Component | 51.6 (6.7) | 52.0 (6.4) | 0.735 |
| Total Mental Component | 54.7 (7.4) | 55.7 (6.1) | 0.379 |
| CES-D | 34.3 (3.4) | 34.6 (4.2) | 0.629 |
| PSS | 19.9 (4.2) | 18.8 (3.9) | 0.108 |
| LSEQ | 14.7 (5.6) | 15.0 (16.3) | 0.727 |
| STAI-Y (state) | 47.0 (4.2) | 46.4 (4.4) | 0.387 |
| STAI-Y (trait) | 46.4 (4.2) | 45.7 (3.8) | 0.376 |
| Cognitive assessment score for individual tests, Mean (SD) c | |||
| Stroop Test (interference score) | 2.5 (0.5) | 2.5 (0.6) | 0.398 |
| DSB | 9.2 (2.2) | 9.3 (2.1) | 0.864 |
| BVRT | 6.2 (1.5) | 6.1 (1.3) | 0.744 |
| TOL | 15.4 (3.4) | 15.9 (3.3) | 0.336 |
| RAVLT (total score) | 76.7 (14.9) | 75.7 (13.8) | 0.689 |
| Symbol Search | 19.3 (4.1) | 19.5 (4.5) | 0.812 |
| DSF | 11.2 (2.0) | 10.9 (2.1) | 0.303 |
| LNS | 20.5 (2.5) | 20.9 (2.8) | 0.376 |
| ILF | 24.7 (8.5) | 25.4 (8.5) | 0.651 |
| ELF | 23.3 (9.4) | 21.9 (7.8) | 0.329 |
| Coding | 40.7 (9.3) | 42.8 (10.8) | 0.240 |
| MedDiet (Mean, SD) | HabDiet (Mean, SD) | |||||
|---|---|---|---|---|---|---|
| Nutrients | Baseline | Final Assessment Point a | p-Value for Change | Baseline | Final Assessment Point a | p-Value for Change |
| Energy (kJ) | 8954 ± 2190 | 8827 ± 1987 | 0.59 | 8809 ± 2011.3 | 8408 ± 2138.7 | 0.16 |
| kJ from protein (%) | 19.0 ± 3.0 | 19.4 ± 3.1▲ | 0.43 | 19.0 ± 3.3 | 19.2 ± 3.6▲ | 0.73 |
| kJ from fat (%) | 33.6 ± 6.0 | 38.8 ± 7.4▲ | <0.001 | 34.4 ± 5.8 | 35.6 ± 5.7▲ | 0.16 |
| kJ from saturated fat (%) | 12.1 ± 2.8 | 9.1 ± 1.8 | <0.001 | 12.8 ± 3.0 | 13.0 ± 3.3▲ | 0.63 |
| kJ from monounsaturated fat (%) | 13.2 ± 3.6 | 19.7 ± 4.7▲ | <0.001 | 13.2 ± 3.4 | 14.2 ± 3.6▲ | <0.05 |
| kJ from carbohydrate (%) | 42.2 ± 7.0 | 37.8 ± 6.0 | <0.001 | 41.3 ± 6.9 | 40.7 ± 7.5 | 0.25 |
| kJ from alcohol (%) | 2.0 ± 5.6 | 1.8 ± 4.4 | <0.05 | 1.7 ± 5.1 | 2.6 ± 5.5▲ | 0.69 |
| Fat as mono (%) | 42.5 ± 5.9 | 54.3 ± 5.2▲ | <0.001 | 41.5 ± 5.8 | 43.2 ± 6.2▲ | <0.03 |
| Fat as saturated (%) | 39.7 ± 7.9 | 25.4 ± 4.0 | <0.001 | 40.7 ± 7.5 | 39.9 ± 8.6 | 0.46 |
| Cholesterol (mg) | 304.1 ± 138.6 | 223.4 ± 90.3 | <0.001 | 300.8 ± 128.4 | 296.3 ± 130.9 | 0.82 |
| Sugars (g) | 109.5 ± 36.4 | 99.1 ± 31.3 | <0.01 | 107.8 ± 43.6 | 98.0 ± 39.5 | <0.02 |
| MUFA:SFA | 1.2 ± 0.5 | 2.2 ± 0.5▲ | <0.001 | 1.1 ± 0.4 | 1.2 ± 0.05▲ | 0.08 |
| Fibre (g) | 31.3 ± 12.6 | 33.8 ± 12.4▲ | 0.21 | 28.4 ± 8.1 | 25.7 ± 8.2 | <0.01 |
| Vitamin C (mg) | 157.1 ± 90.3 | 166.5 ± 76.7▲ | 0.43 | 139.4 ± 69.9 | 120.7 ± 72.9 | 0.07 |
| Vitamin E (mg) | 11.4 ± 6.5 | 17.3 ± 5.8▲ | <0.001 | 10.8 ± 4.1 | 10.9 ± 5.0▲ | 0.89 |
| Total folate (µg) | 493.8 ± 237.0 | 489.5 ± 154.1 | 0.88 | 425.3 ± 167.5 | 388.4 ± 148.4 | 0.12 |
| Total vitamin A equivalents (µg) | 1100.0 ± 579.6 | 921.2 ± 682.2 | 0.24 | 927.1 ± 621.9 | 893.9 ± 629.6 | 0.53 |
| β-carotene equivalents (µg) | 4418.3 ± 3469.6 | 4508.6 ± 4493.6▲ | 0.12 | 3623.8 ± 3377.9 | 3370.5 ± 3287.5 | 0.38 |
| Sodium (mg) | 2367.3 ± 891.0 | 1792.7 ± 656.3 | <0.001 | 2357.7 ± 874.0 | 2154.8 ± 648.2 | 0.09 |
| Potassium (mg) | 3982.7 ± 1451.9 | 3863.6 ± 978.8 | 0.47 | 3661.6 ± 817.4 | 3333.0 ± 807.3 | <0.01 |
| Calcium (mg) | 978.3 ± 381.2 | 926.2 ± 279.8 | 0.22 | 927.8 ± 352.2 | 869.0 ± 342.5 | 0.07 |
| Iron (mg) | 14.5 ± 5.6 | 13.7 ± 3.7 | 0.20 | 12.8 ± 3.7 | 12.2 ± 4.4 | 0.35 |
| Zinc (mg) | 12.5 ± 4.4 | 10.9 ± 3.1 | <0.02 | 11.7 ± 3.5 | 12.1 ± 4.5▲ | 0.43 |
| Total long-chain n3 (mg) | 222.7 ± 601.9 | 586.8 ± 1201.05▲ | <0.001 | 265.7 ± 447.3 | 190.9 ± 282.5 | <0.05 |
| Linoleic acid (g) | 11.5 ± 6.7 | 15.2 ± 6.3▲ | <0.001 | 11.4 ± 4.6 | 10.8 ± 5.0 | 0.40 |
| α-linolenic acid (ala) (g) | 1.5 ± 0.7 | 1.6 ± 1.4▲ | 0.39 | 1.5 ± 0.7 | 1.3 ± 0.5 | <0.01 |
| MedDiet (Mean, SD) | HabDiet (Mean, SD) | |||||
|---|---|---|---|---|---|---|
| Foods | Baseline | Final Assessment Point a | p-Value for Change | Baseline | Final Assessment Point a | p-Value for Change |
| Extra virgin olive oil † | 0.0 ± 4.5 | 36.3 ± 28.2▲ | <0.001 | 0.0 ± 7.7 | 0.0 ± 6.9 | 0.42 |
| Vegetables 1 | 227.2 ± 191.7 | 256.9 ± 131.2▲ | 0.22 | 202.4 ± 119.7 | 207.7 ± 119.7▲ | 0.77 |
| Fruits 2 | 272.8 ± 152.1 | 381.9 ± 195.3▲ | <0.001 | 272.2 ± 154.6 | 288.1 ± 160.8▲ | 0.36 |
| Legumes † | 0.0 ± 12.6 | 36.0 ± 47.3▲ | <0.001 | 0.0 ± 11.3 | 0.0 ± 26.7▲ | 0.51 |
| Nuts † | 6.2 ± 20.0 | 34.0 ± 37.875▲ | <0.001 | 12.0 ± 20.3 | 6.3 ± 25.0 | 0.78 |
| Dairy 3,† | 210.8 ± 243 | 310.0 ± 225▲ | <0.001 | 213.5 ± 258.5 | 219 ± 299.2▲ | 0.30 |
| Breads and cereals | 149.9 ± 84.9 | 146.8 ± 63.7 | 0.80 | 148.2 ± 70.6 | 142.7 ± 74.0 | 0.60 |
| Fish and seafood † | 24.7 ± 69.58 | 77.0 ± 60.3▲ | <0.001 | 36.7 ± 80.1 | 28.3 ± 60.0 | <0.02 |
| Meat 4,† | 50 ± 87.7 | 49.9 ± 72.1 | 0.07 | 73.0 ± 109.3 | 80.0 ± 84.3▲ | 0.27 |
| Smallgoods † | 0.0 ± 21.7 | 0.0 ± 6.8 | <0.01 | 0.0 ± 24.3 | 7.0 ± 28.2▲ | 0.87 |
| Eggs and egg dishes † | 9.2 ± 39.8 | 16.7 ± 32.7▲ | 0.38 | 16.7 ± 41.0 | 16.3 ± 39.7 | 0.10 |
| Red wine † | 0.0 ± 157.6 | 49.9 ± 198.0▲ | 0.48 | 9.9 ± 152.8 | 0.0 ± 99.0 | <0.01 |
| Discretionary foods 5,† | 94.5 ± 92.8 | 50.0 ± 52.6 | <0.001 | 103.2 ± 107.3 | 79.7 ± 95.85 | 0.23 |
| Discretionary beverages 6,† | 446.2 ± 533.0 | 467.3 ± 434.4▲ | 0.08 | 483.4 ± 721.5 | 583.3 ± 589.5▲ | 0.43 |
| Coffee | 319.0 ± 252.8 | 344.6 ± 247.0▲ | 0.40 | 312.9 ± 272.2 | 320.9 ± 283.4▲ | 0.67 |
| Miscellaneous 7,† | 150.0 ± 160.5 | 23.7 ± 68.0 | <0.001 | 139 ± 150.4 | 80 ± 106 | <0.001 |
| MedDiet (n = 70) | HabDiet (n = 67) | ||
|---|---|---|---|
| Outcome | Mean a (95% CI) | p-Value a (vs. Control) | Mean a (95% CI) |
| Total age-related cognitive function score (composite) | 279.8 (271.5–288.1) | 287.8 (279.2–296.4) | |
| Adjusted diff. versus control (95% CI) | +8.00 (−4.00–19.9) | 0.19 | 0 (reference group) |
| Executive function score (composite) | 69.6 (66.1–73.2) | 72.2 (68.5–75.9) | |
| Adjusted diff. versus control (95% CI) | +2.53 (−2.58–7.65) | 0.33 | 0 (reference group) |
| Memory score (composite) | 126.9 (122.9–131.1) | 128.9 (124.8–133.2) | |
| Adjusted diff. versus control (95% CI) | +2.00 (−3.88–7.88) | 0.50 | 0 (reference group) |
| Speed of processing score (composite) | 77.1 (73.9–80.2) | 80.3 (77.1–83.5) | |
| Adjusted diff. versus control (95% CI) | +3.24 (−1.21–7.70) | 0.15 | 0 (reference group) |
| Visual–spatial score (composite) | 6.07 (5.66–6.48) | 6.29 (5.86–6.71) | |
| Adjusted diff. versus control (95% CI) | +0.21 (−0.38–0.81) | 0.48 | 0 (reference group) |
| Outcome, Treatment Arm | Mean (95% CI) a | p-Value for Mixed Factorial a,b Repeated Measures ANCOVA | Effect Size (Observed Power) a,b | |||||
|---|---|---|---|---|---|---|---|---|
| MedDiet Group (n = 70) | Control Group (n = 67) | Between Groups | Within Groups | Interaction Term | Between Groups | Within Groups | Interaction Term | |
| Total age-related cognitive function score (composite) | ||||||||
| 3 months | −0.76 (−2.04 to 0.52) | 0.82 (−0.51 to 2.14) | 0.34 | 0.71 | 0.10 | 0.01 (0.12) | 0.04 (0.52) | 0.03 (0.45) |
| 6 months | −0.37 (−1.59 to 0.86) | 0.40 (−0.88 to 1.67) | ||||||
| Executive function score (composite) | ||||||||
| 3 months | −0.28 (−0.78 to 0.21) | 0.82 (−0.51 to 2.14) | 0.44 | 0.07 | 0.11 | 0.01 (0.12) | 0.01 (0.10) | 0.03 (0.47) |
| 6 months | −0.09 (−0.54 to 0.36) | 0.30 (−0.21 to 0.82) | ||||||
| Memory score (composite) | ||||||||
| 3 months | −0.22 (−0.80 to 0.37) | 0.23 (−0.38 to 0.84) | 0.68 | 0.05 | 0.44 | 0.001 (0.07) | 0.05 (0.60) | 0.01 (0.19) |
| 6 months | −0.05 (−0.66 to 0.56) | 0.05 (−0.58 to 0.68) | ||||||
| Speed of processing score (composite) | ||||||||
| 3 months | −0.20 (−0.58 to 0.19 | 0.21 (−0.19 to 0.61) | 0.17 | 0.90 | 0.81 | 0.01 (0.27) | 0.002 (0.07) | 0.003 (0.08) |
| 6 months | −0.18 (−0.55 to 0.20) | 0.19 (−0.20 to 0.58) | ||||||
| Visual-spatial score (composite) | ||||||||
| 3 months | −0.07 (−0.30 to 0.19) | 0.07 (−0.16 to 0.31) | 0.34 | 0.71 | 0.10 | 0.002 (0.08) | 0.02 (0.32) | 0.008 (0.14) |
| 6 months | −0.06 (−0.28 to 0.17) | 0.06 (−0.18 to 0.30) | ||||||
| Stroop Test | ||||||||
| 3 months | 2.33 (2.20 to 2.45) | 2.33 (2.20 to 2.46) | 0.72 | 0.07 | 0.82 | 0.001 (0.07) | 0.02 (0.32) | 0.008 (0.14) |
| 6 months | 2.28 (2.20 to 2.39) | 2.26 (2.15 to 2.36) | ||||||
| DSB | ||||||||
| 3 months | 9.49 (9.05 to 9.93) | 9.38 (8.92 to 9.84) | 0.95 | 0.55 | 0.84 | 0.001 (0.05) | 0.009 (0.15) | 0.003 (0.08) |
| 6 months | 9.41 (8.87 to 9.95) | 9.51 (8.96 to 10.07) | ||||||
| BVRT | ||||||||
| 3 months | 5.21 (4.81 to 5.60) | 5.45 (5.04 to 5.86) | 0.55 | 0.01 | 0.55 | 0.02 (0.39) | 0.008 (0.14) | 0.009 (0.06) |
| 6 months | 6.07 (5.65 to 6.50) | 6.29 (5.85 to 6.73) | ||||||
| TOL score | ||||||||
| 3 months | 16.20 (15.47 to 16.93) | 16.52 (15.76 to 17.28) | 0.51 | 0.81 | 0.67 | 0.003 (0.10) | 0.003 (0.08) | 0.005 (0.11) |
| 6 months | 17.49 (16.73 to 18.26) | 17.51 (16.72 to 18.30) | ||||||
| RAVLT score | ||||||||
| 3 months | 79.70 (76.21 to 83.20) | 78.88 (75.26 to 82.51) | 0.83 | 0.03 | 0.24 | 0.001 (0.05) | 0.05 (0.67) | 0.02 (0.31) |
| 6 months | 86.18 (82.56 to 89.11) | 87.54 (83.78 to 91.31) | ||||||
| Symbol Search | ||||||||
| 3 months | 21.39 (20.18 to 22.60) | 22.13 (20.88 to 23.38) | 0.41 | 0.31 | 0.78 | 0.005 (0.13) | 0.02 (0.23) | 0.004 (0.09) |
| 6 months | 24.83 (23.59 to 26.07) | 25.57 (24.28 to 18.30) | ||||||
| DSF | ||||||||
| 3 months | 11.18 (10.71 to 11.66) | 11.44 (10.95 to 11.94) | 0.65 | 0.10 | 0.20 | 0.002 (0.07) | 0.03 (0.48) | 0.02 (0.34) |
| 6 months | 11.04 (10.50 to 11.58) | 10.74 (10.18 to 11.30) | ||||||
| LNS | ||||||||
| 3 months | 20.40 (19.81 to 20.99) | 20.92 (20.30 to 21.53)) | 0.28 | 0.570 | 0.85 | 0.01 (0.19) | 0.005 (0.15) | 0.002 (0.08) |
| 6 months | 20.68 (19.93 to 21.43) | 20.88 (20.09 to 21.67) | ||||||
| ILF | ||||||||
| 3 months | 24.37 (22.55 to 26.19) | 27.10 (25.21 to 28.99) | 0.16 | 0.45 | 0.34 | 0.02 (0.29) | 0.006 (0.20) | 0.01 (0.29) |
| 6 months | 25.60 (23.68 to 27.51) | 27.25 (25.27 to 29.24) | ||||||
| ELF | ||||||||
| 3 months | 22.39 (20.67 to 24.11)) | 23.77 (21.99 to 25.56) | 0.81 | 0.50 | 0.18 | 0.001 (0.06) | 0.007 (0.20) | 0.02 (0.47) |
| 6 months | 24.26 (22.14 to 26.38) | 25.18 (22.97 to 27.38) | ||||||
| Coding | ||||||||
| 3 months | 46.07 (43.71 to 48.42) | 48.82 (46.40 to 51.25) | 0.09 | 0.59 | 0.92 | 0.02 (0.39) | 0.008 (0.14) | 0.001 (0.06) |
| 6 months | 52.34 (49.98 to 54.70) | 54.73 (52.30 to 57.16 ) | ||||||
© 2016 by the authors; licensee MDPI, Basel, Switzerland. This article is an open access article distributed under the terms and conditions of the Creative Commons Attribution (CC-BY) license (http://creativecommons.org/licenses/by/4.0/).
Share and Cite
Knight, A.; Bryan, J.; Wilson, C.; Hodgson, J.M.; Davis, C.R.; Murphy, K.J. The Mediterranean Diet and Cognitive Function among Healthy Older Adults in a 6-Month Randomised Controlled Trial: The MedLey Study. Nutrients 2016, 8, 579. https://doi.org/10.3390/nu8090579
Knight A, Bryan J, Wilson C, Hodgson JM, Davis CR, Murphy KJ. The Mediterranean Diet and Cognitive Function among Healthy Older Adults in a 6-Month Randomised Controlled Trial: The MedLey Study. Nutrients. 2016; 8(9):579. https://doi.org/10.3390/nu8090579
Chicago/Turabian StyleKnight, Alissa, Janet Bryan, Carlene Wilson, Jonathan M. Hodgson, Courtney R. Davis, and Karen J. Murphy. 2016. "The Mediterranean Diet and Cognitive Function among Healthy Older Adults in a 6-Month Randomised Controlled Trial: The MedLey Study" Nutrients 8, no. 9: 579. https://doi.org/10.3390/nu8090579
APA StyleKnight, A., Bryan, J., Wilson, C., Hodgson, J. M., Davis, C. R., & Murphy, K. J. (2016). The Mediterranean Diet and Cognitive Function among Healthy Older Adults in a 6-Month Randomised Controlled Trial: The MedLey Study. Nutrients, 8(9), 579. https://doi.org/10.3390/nu8090579