
Discolouring 3D Gel Dosimeter for UV Dose Distribution Measurements


Abstract
:1. Introduction
2. Materials and Methods
2.1. Dosimeters Preparation
2.2. Irradiation
2.3. Spectrophotometric Measurements
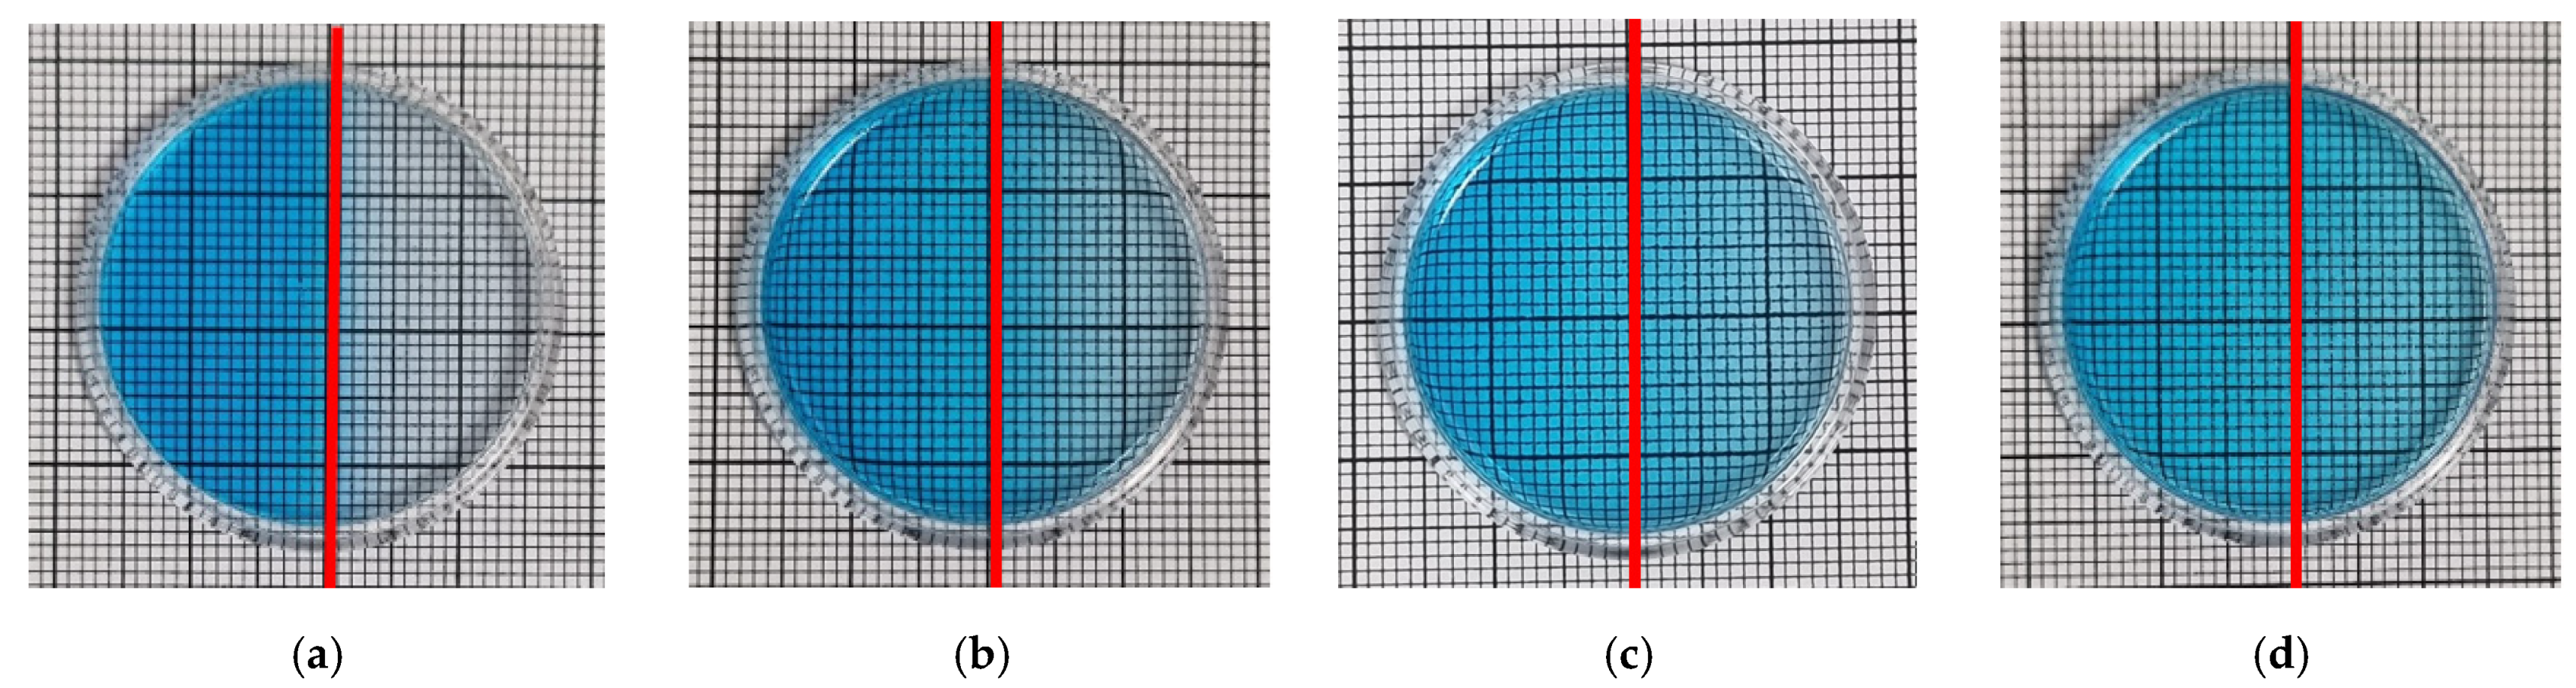
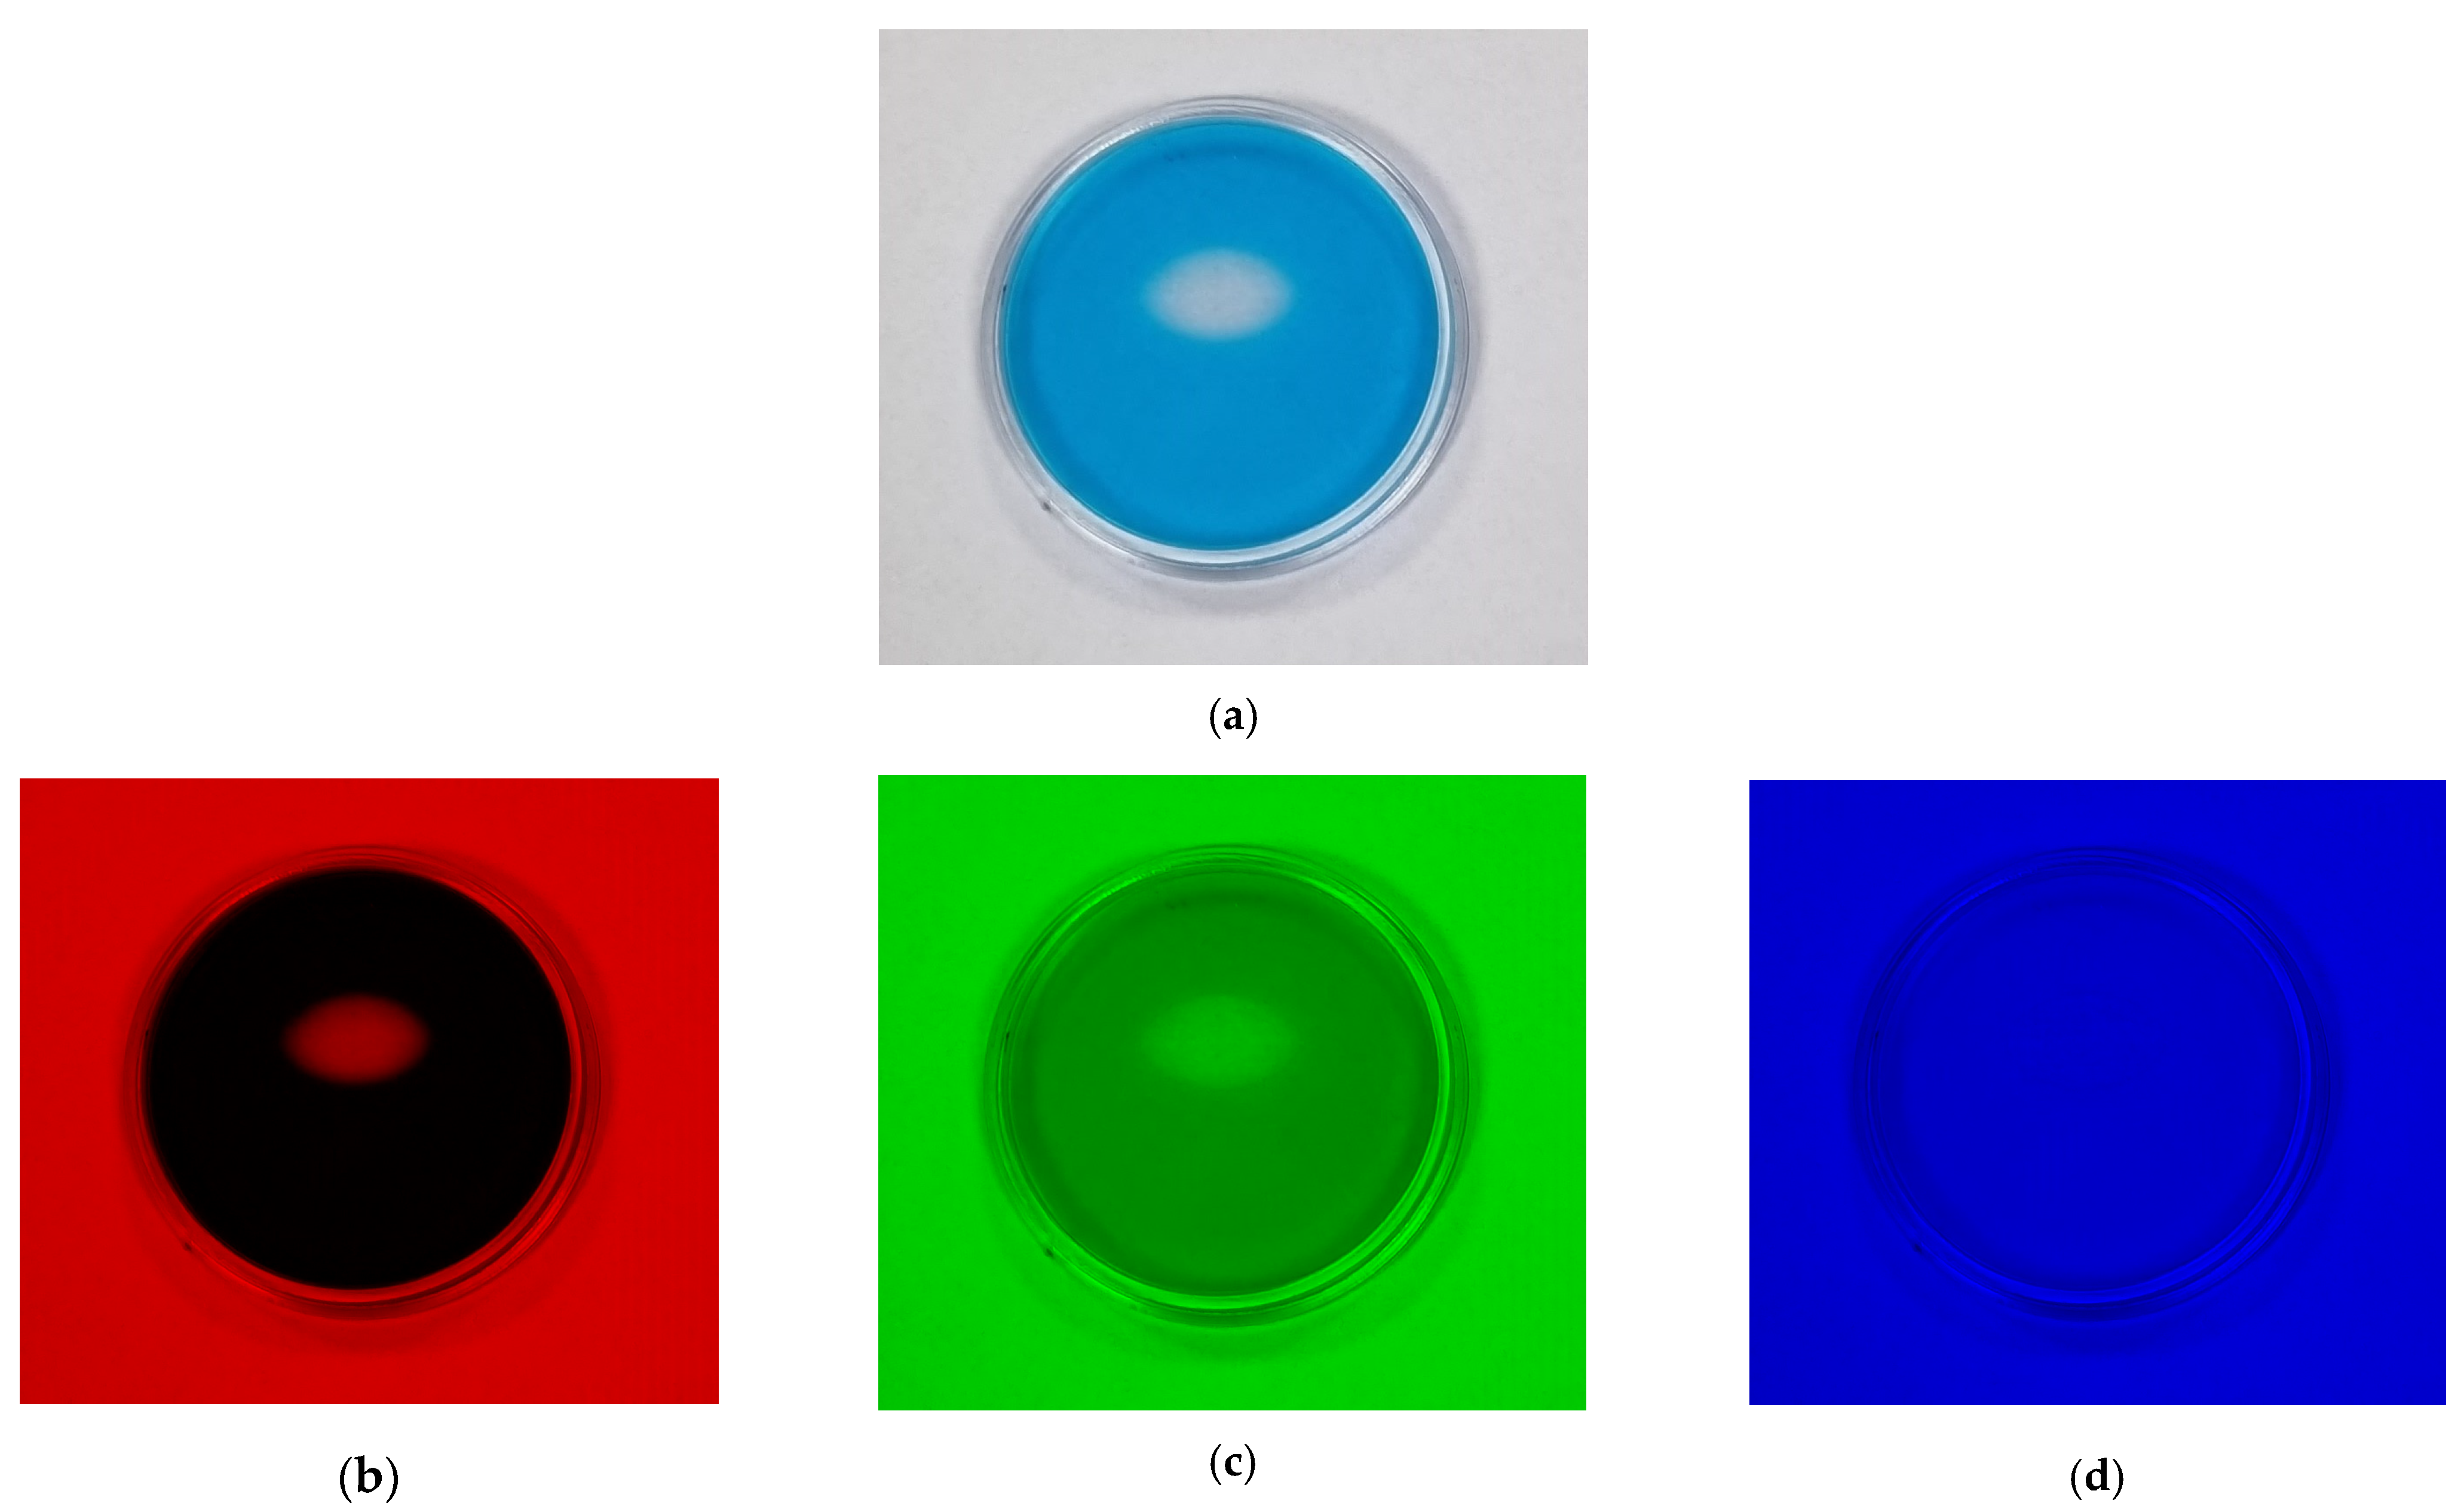
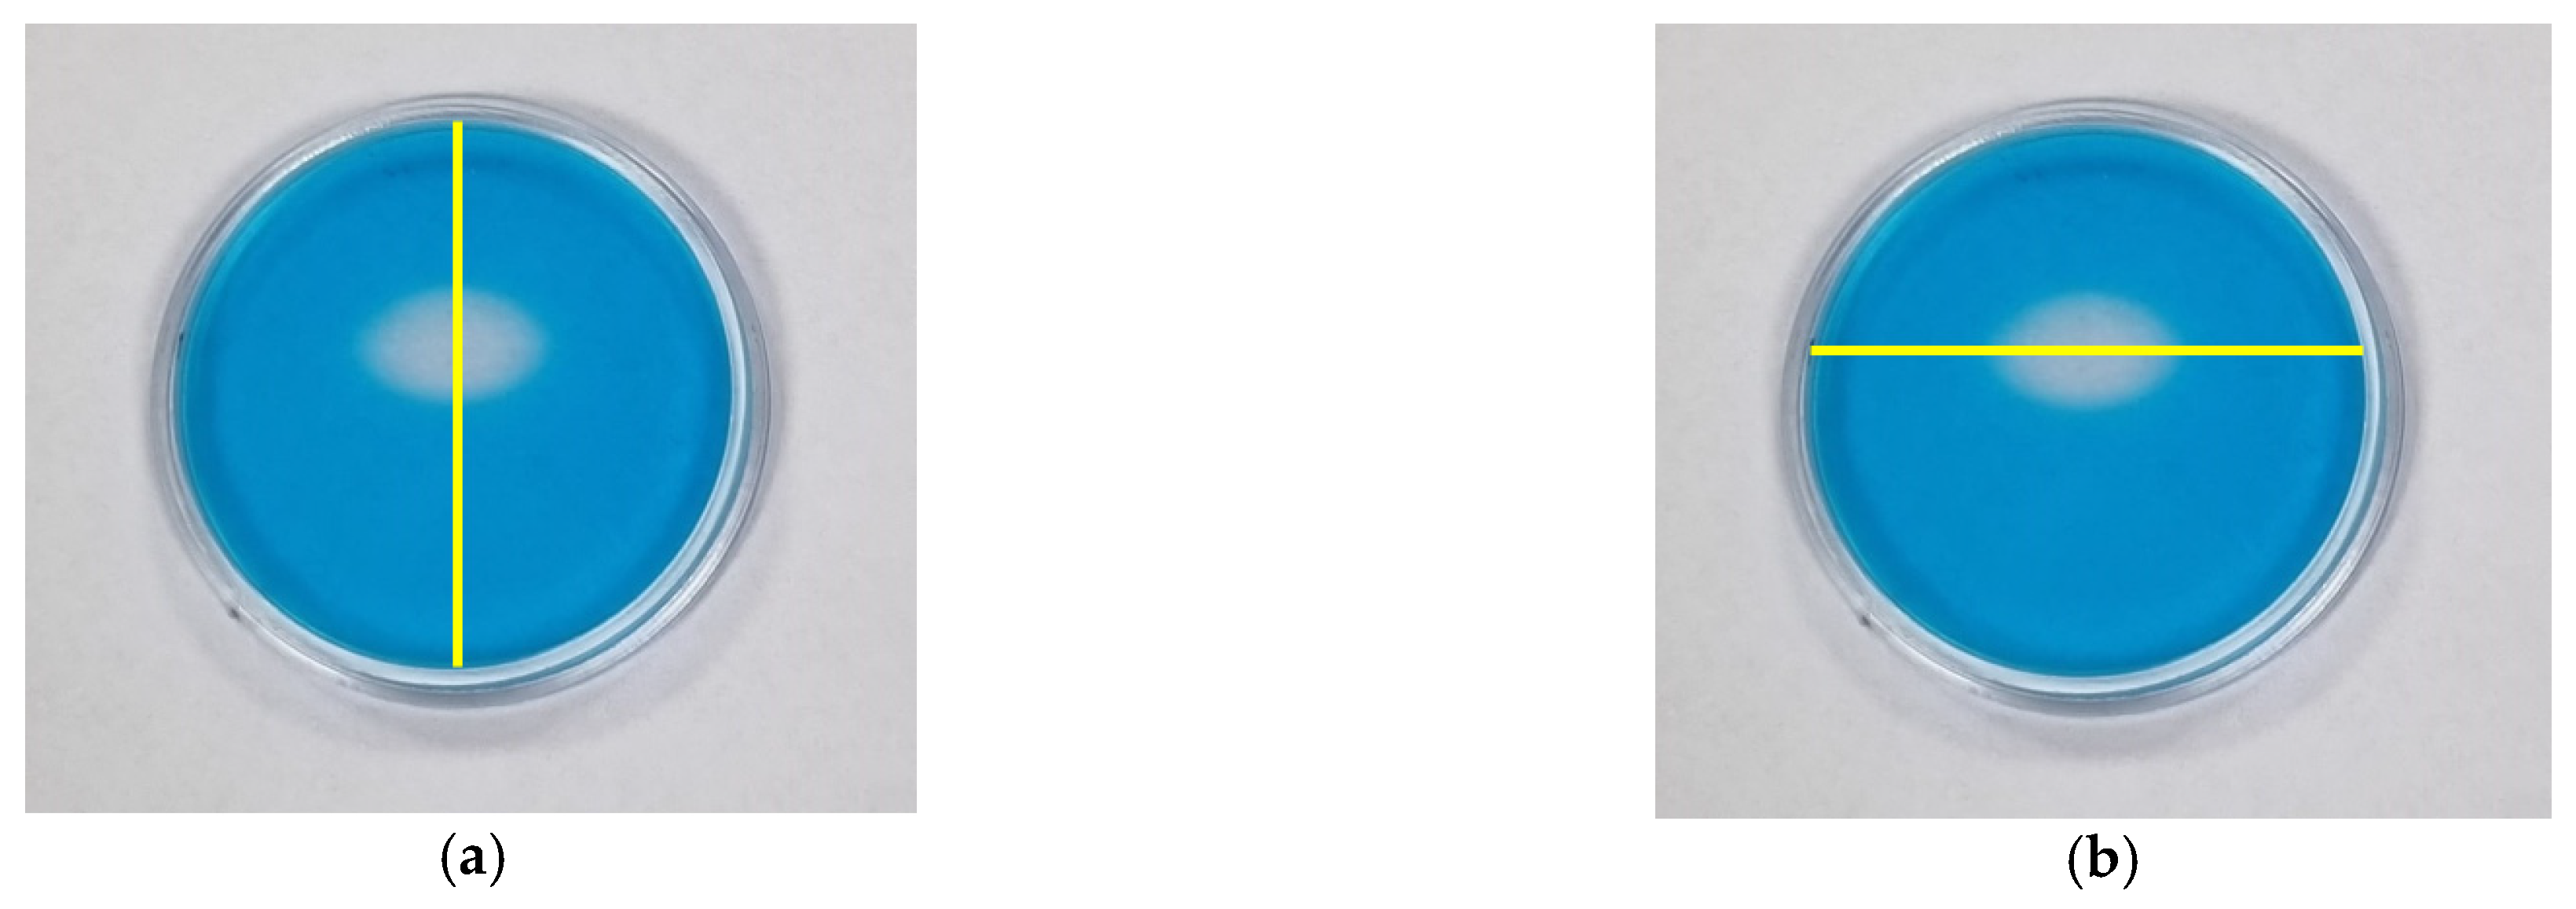
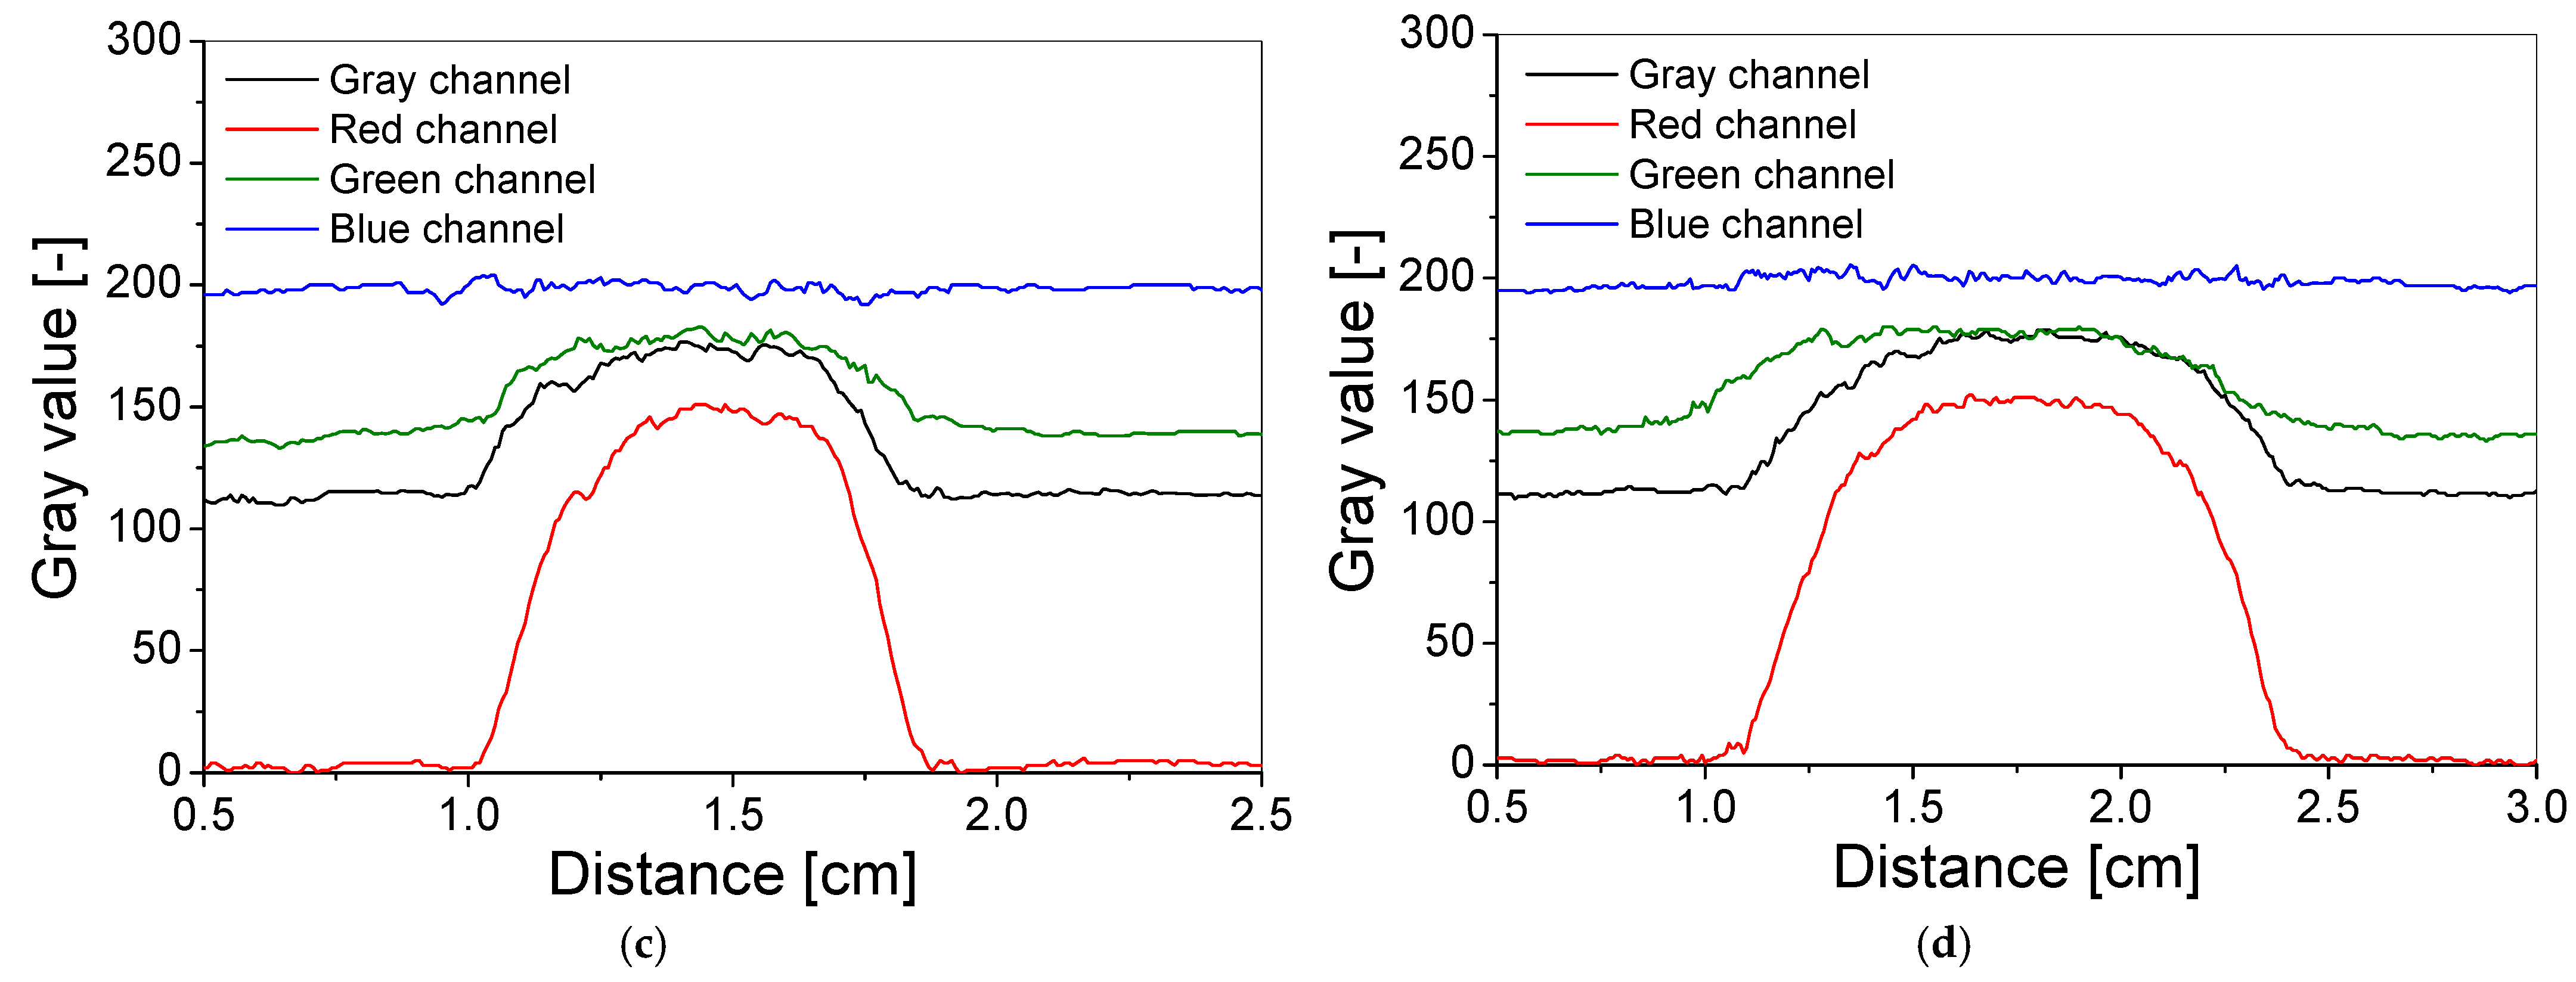
2.4. Spatial Stability of Dose Distribution
3. Results and Discussion
3.1. Selection of the Dosimeter’s Chemical Composition
- (1)
- H2O2
- (2)
- + H2O2 → / + H2O
- (3)
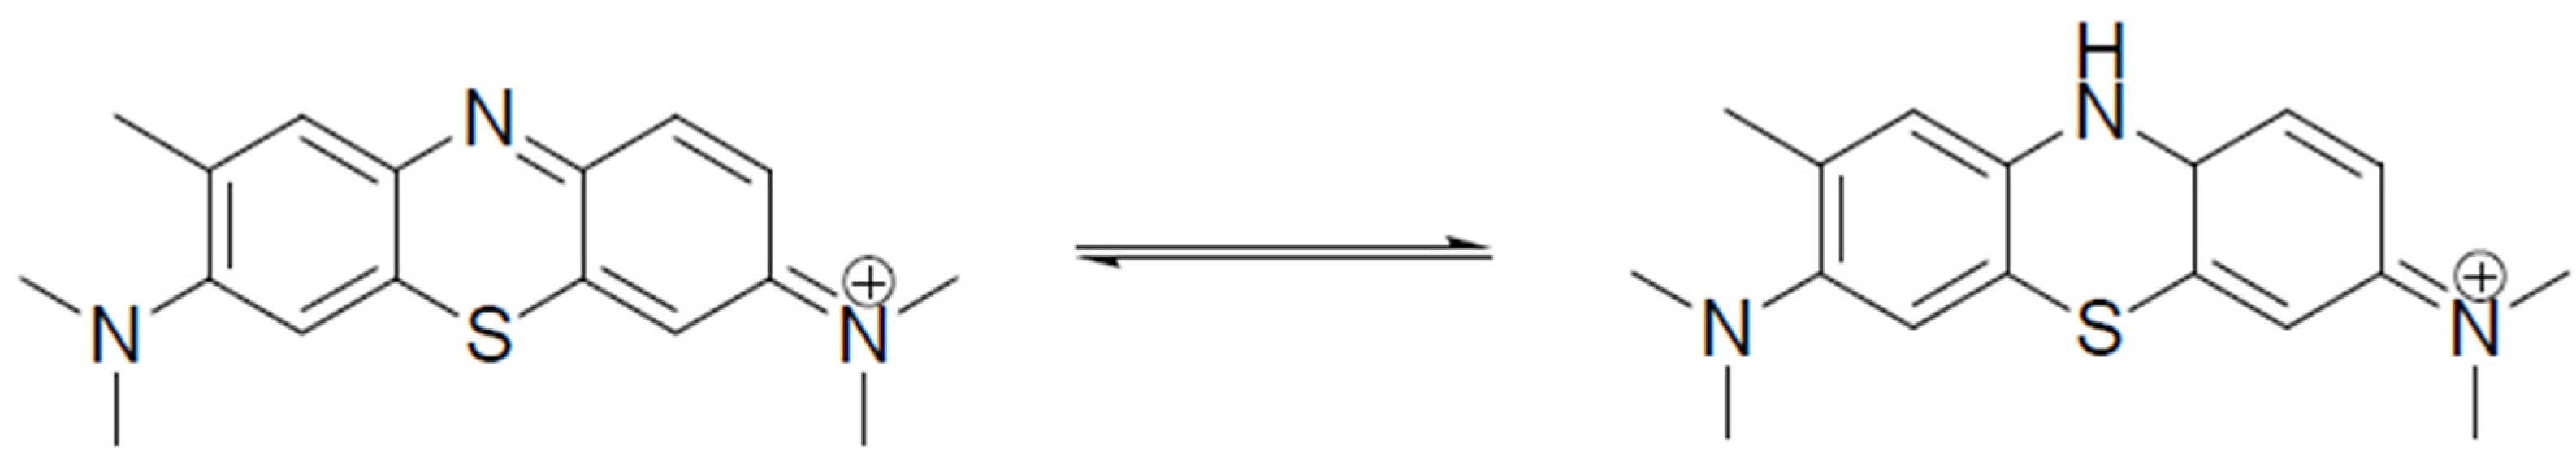
- TBO TBO*
- (4)
- TBO* + H2O2 → + + TBO
- (5)
- TBO + → Leuco form of TBO
- (6)
- TBO + → Leuco form of TBO
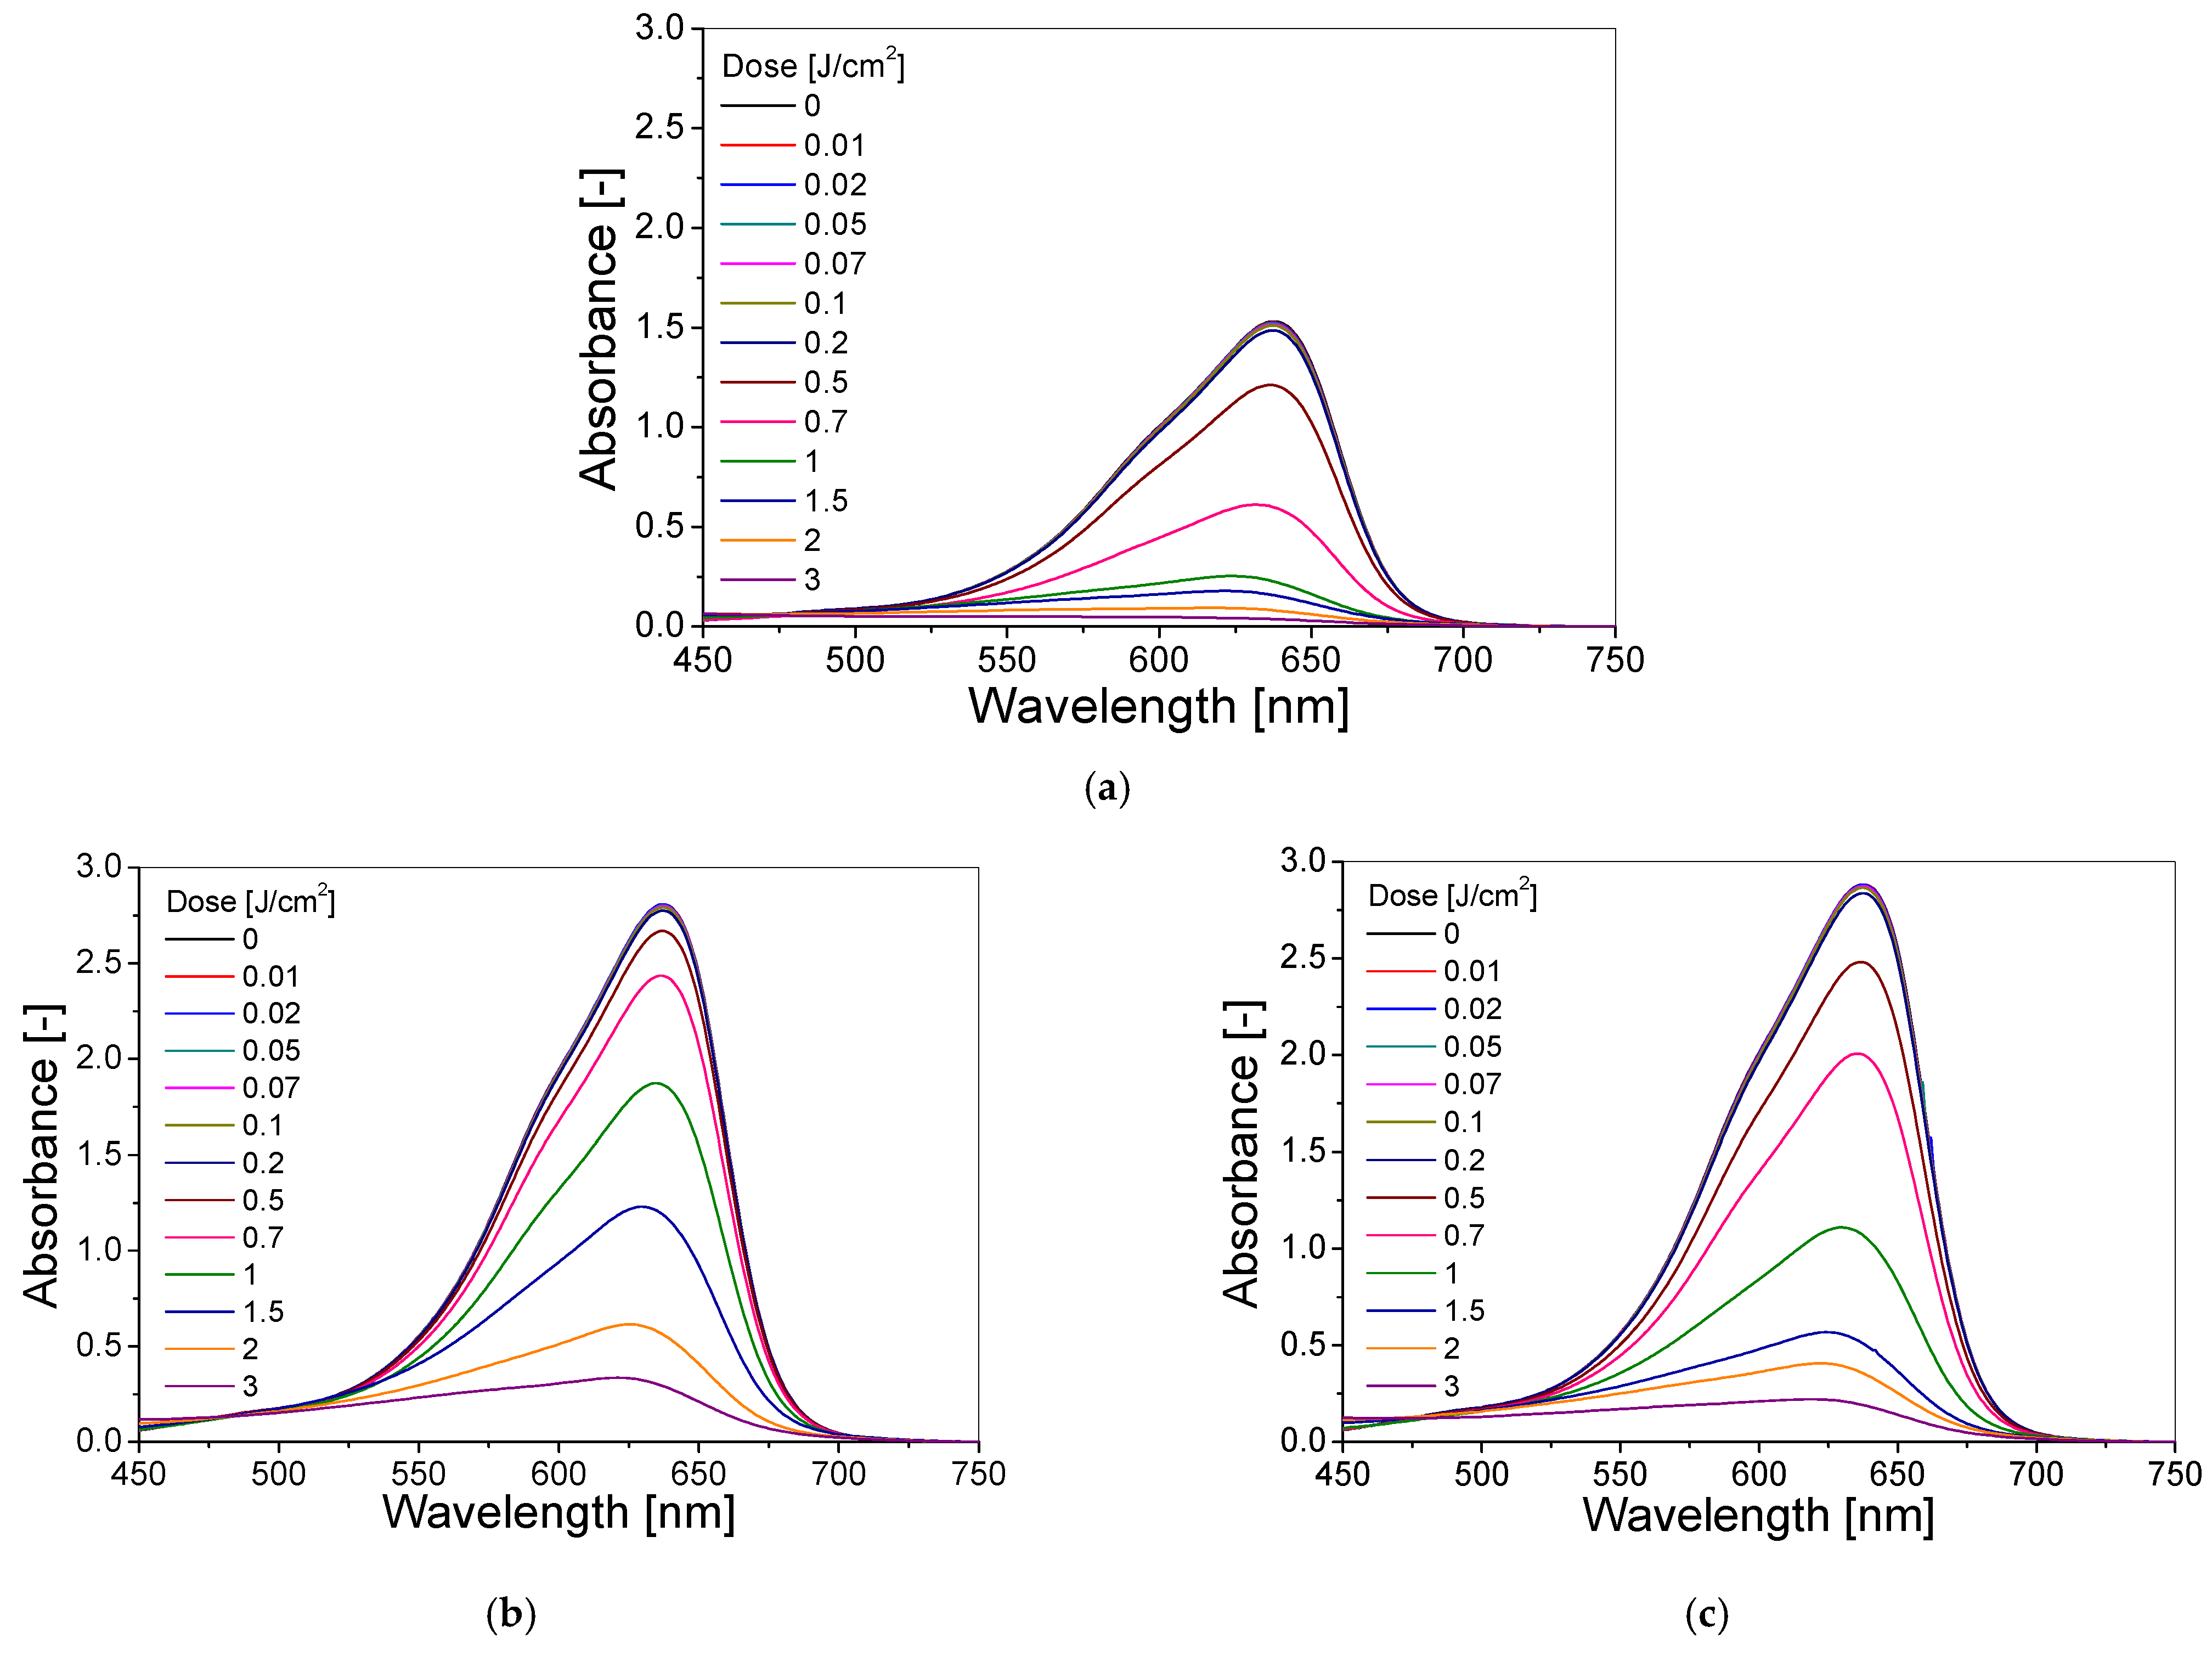
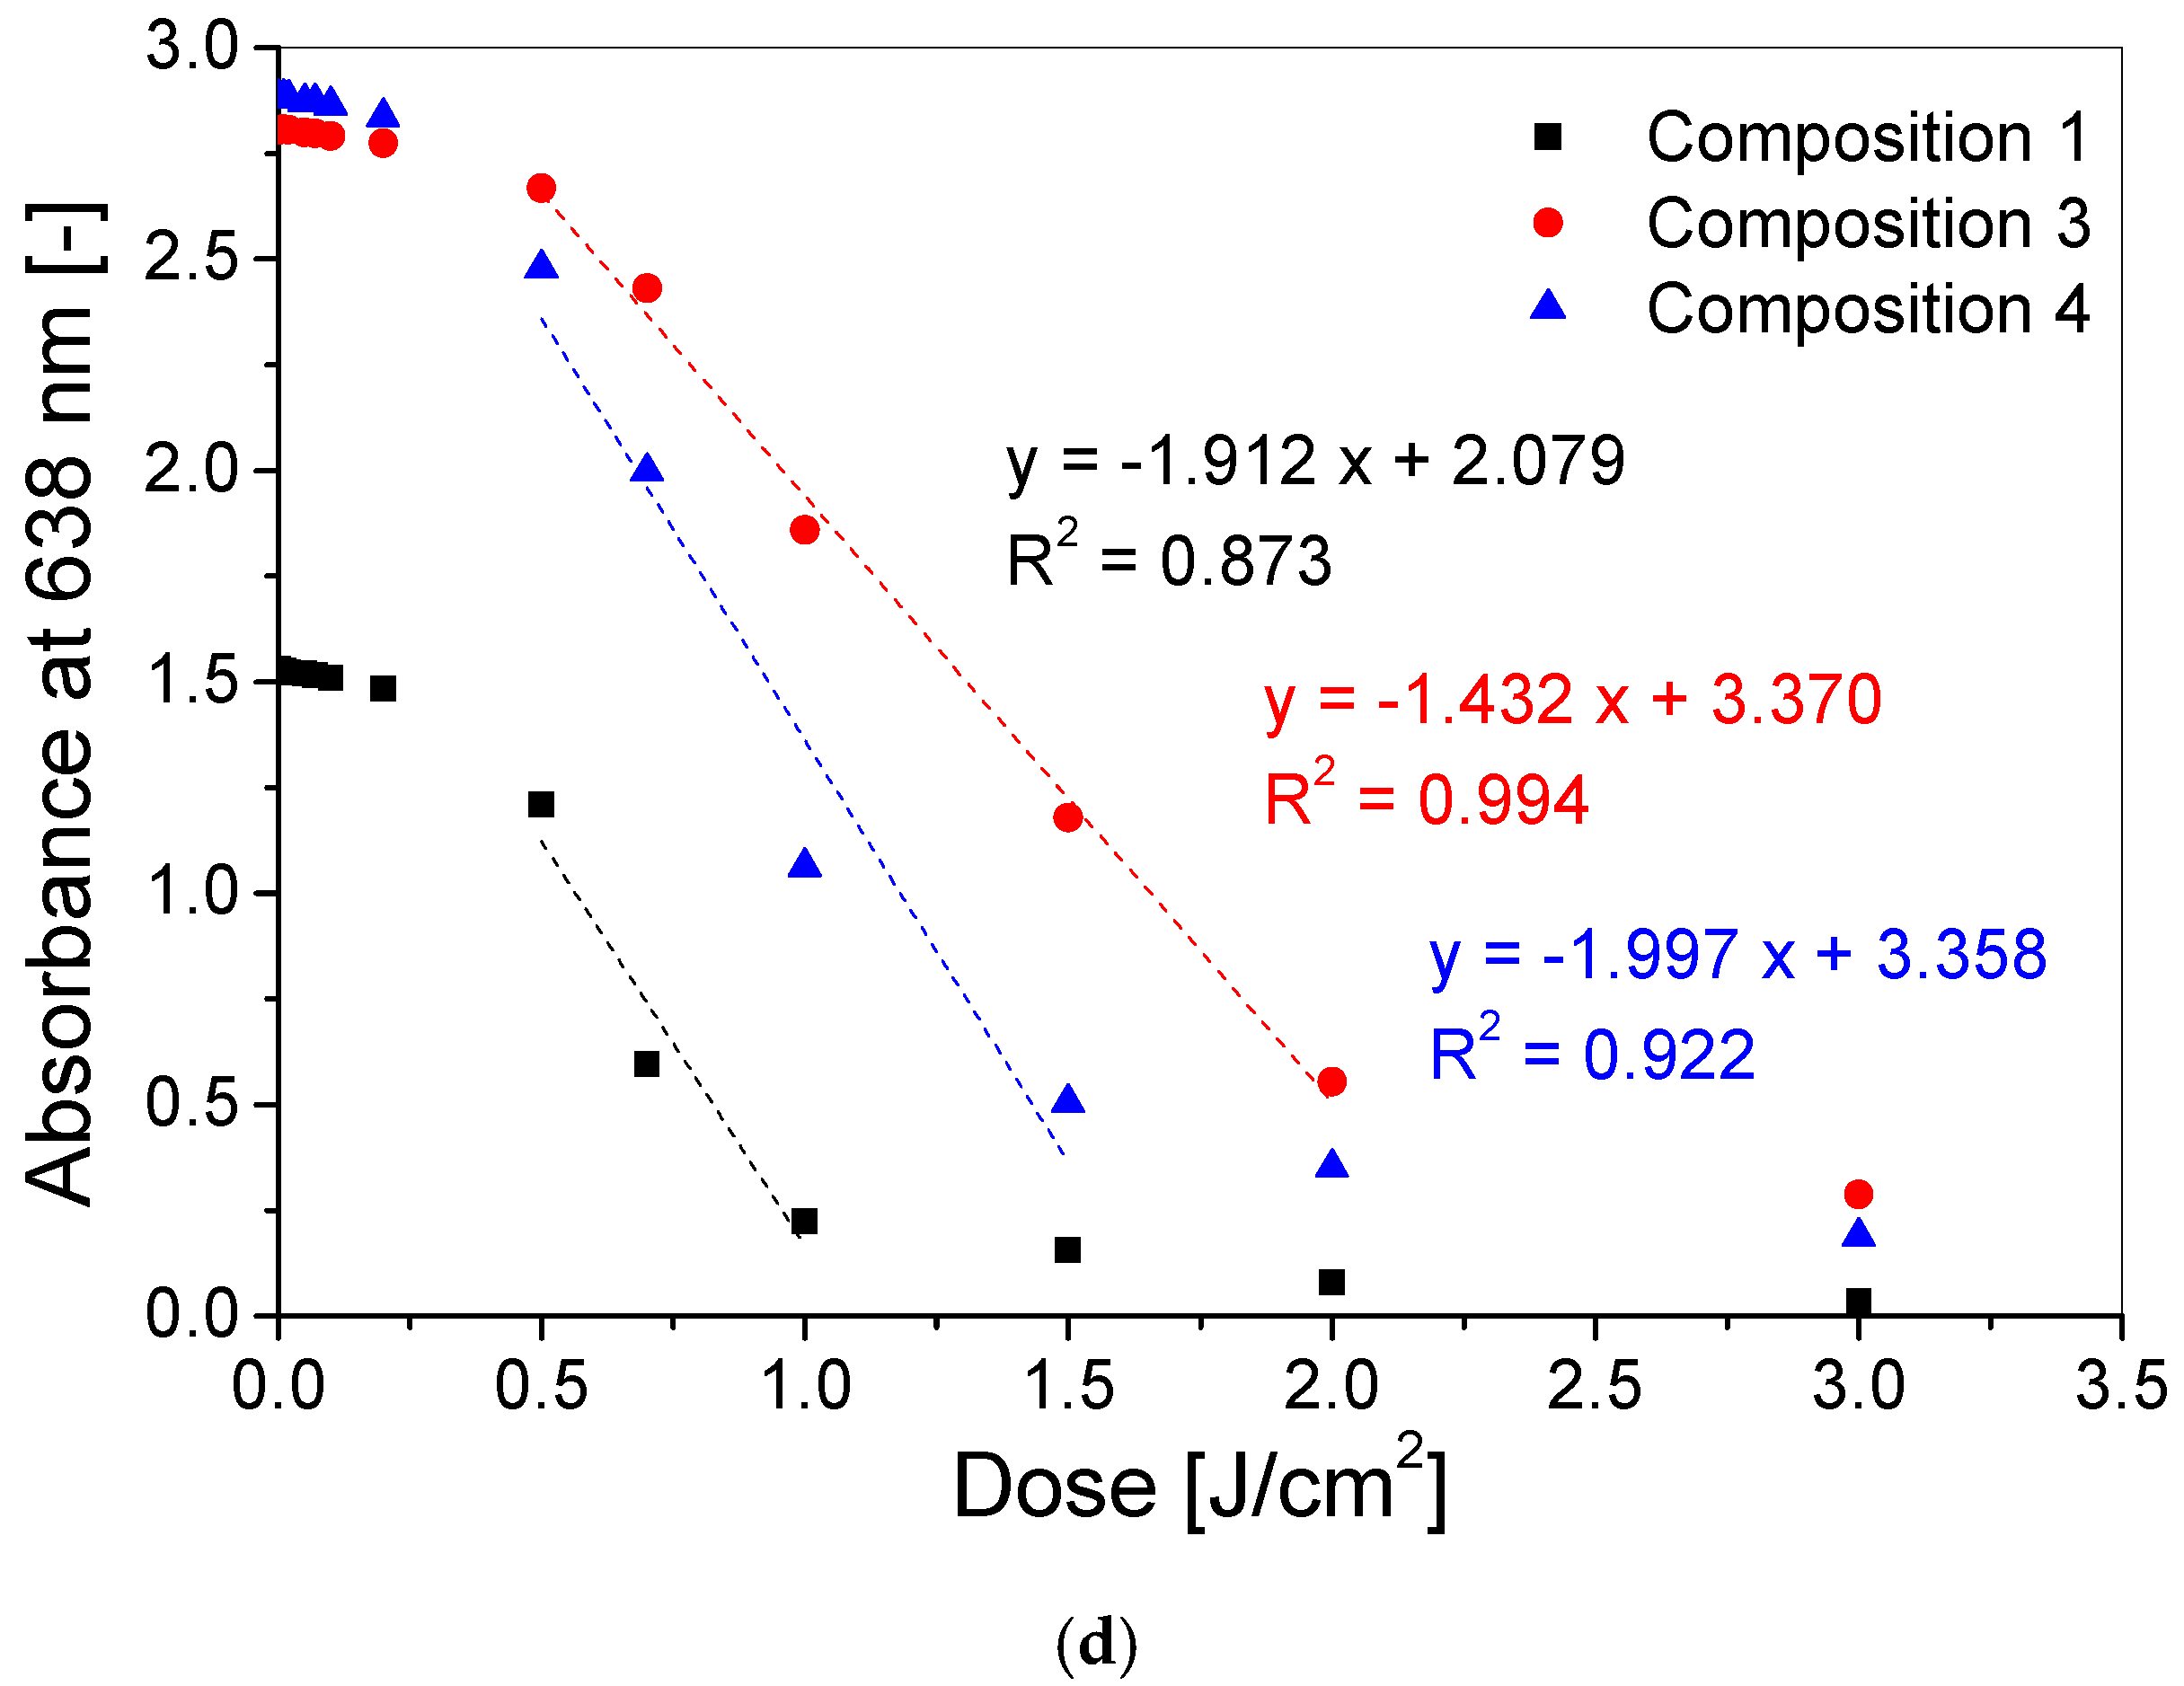
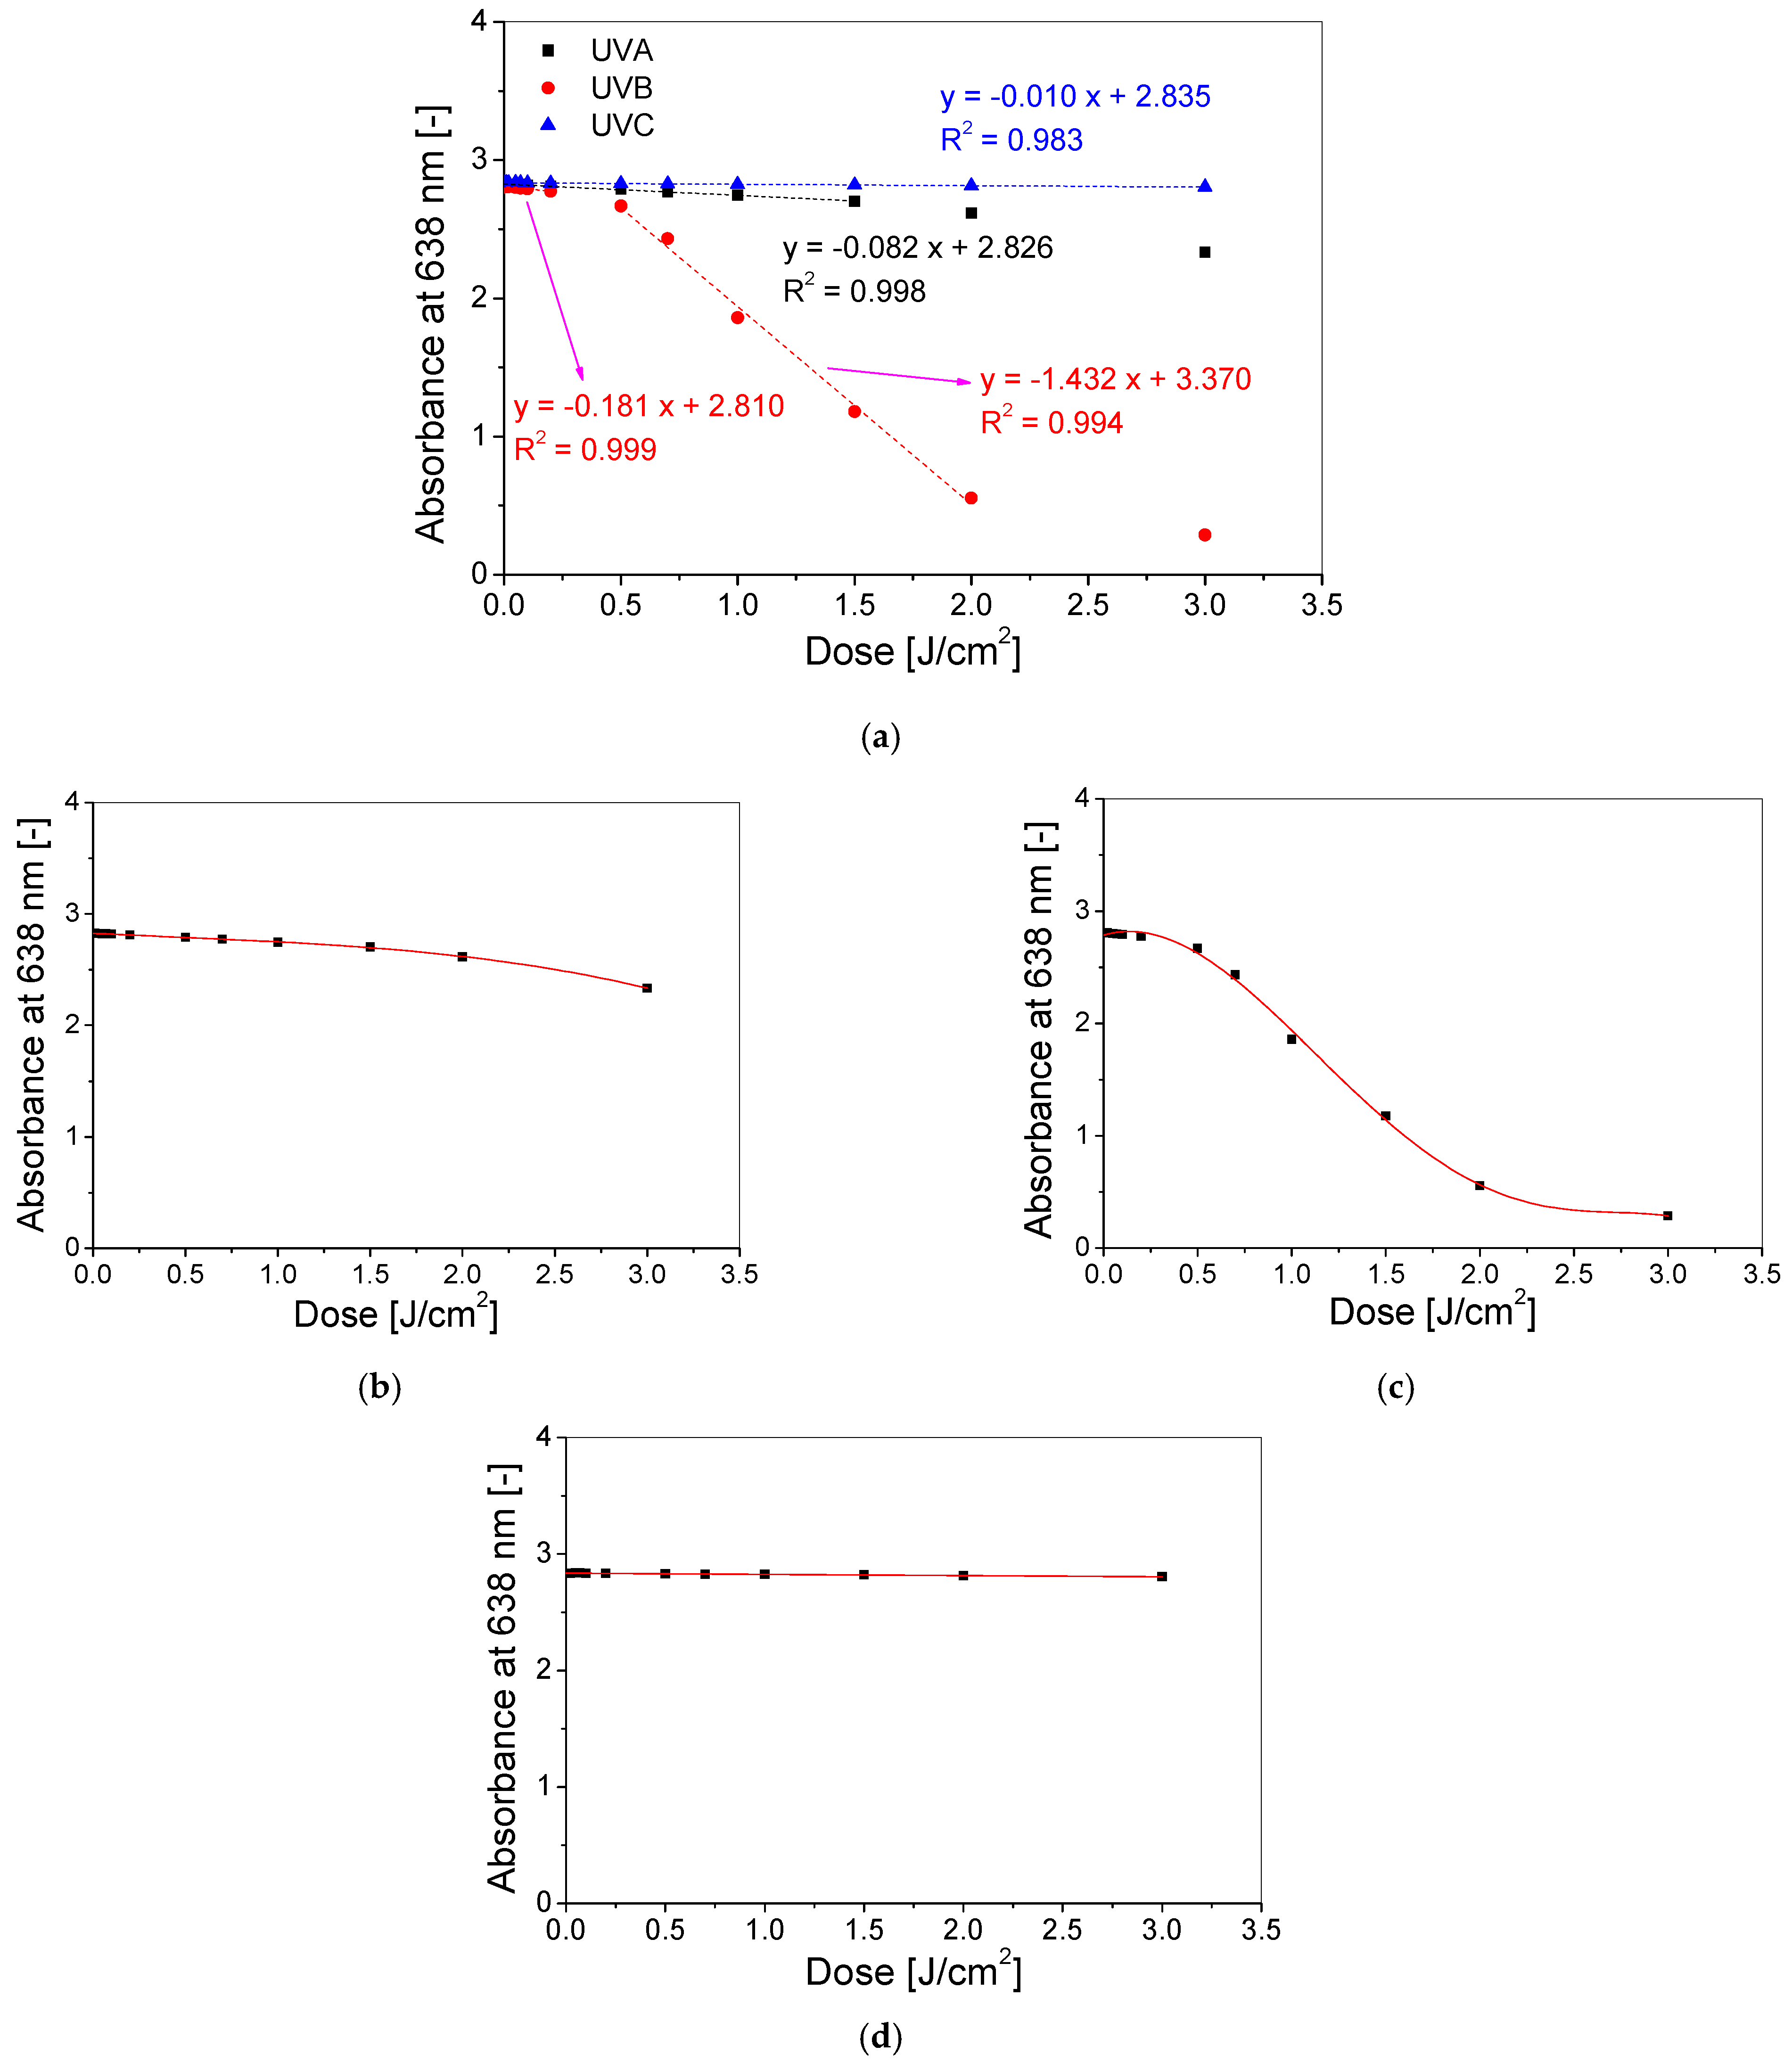
3.2. Dose–Response of Dosimeter
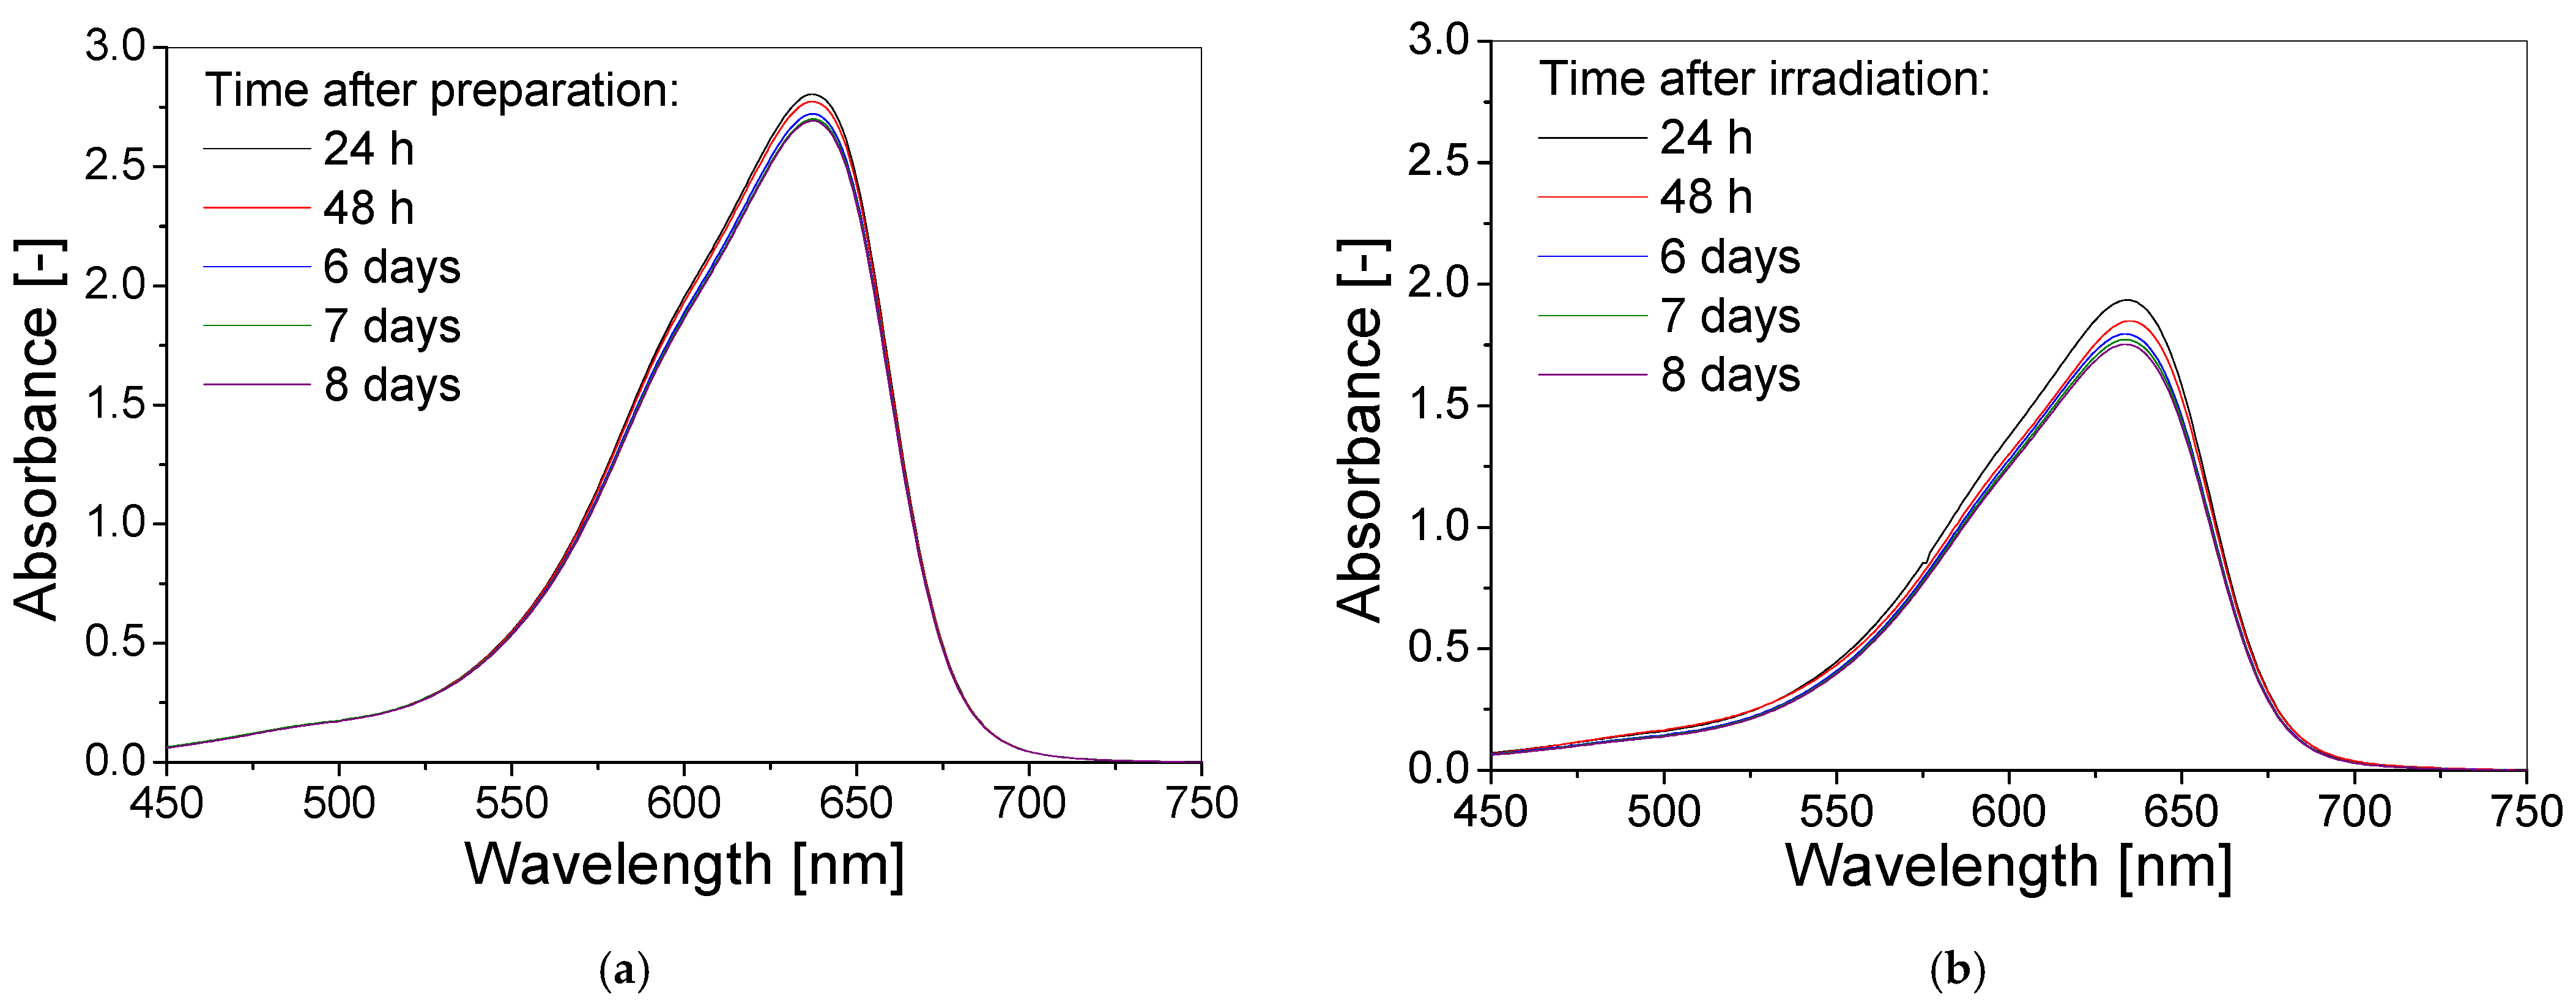
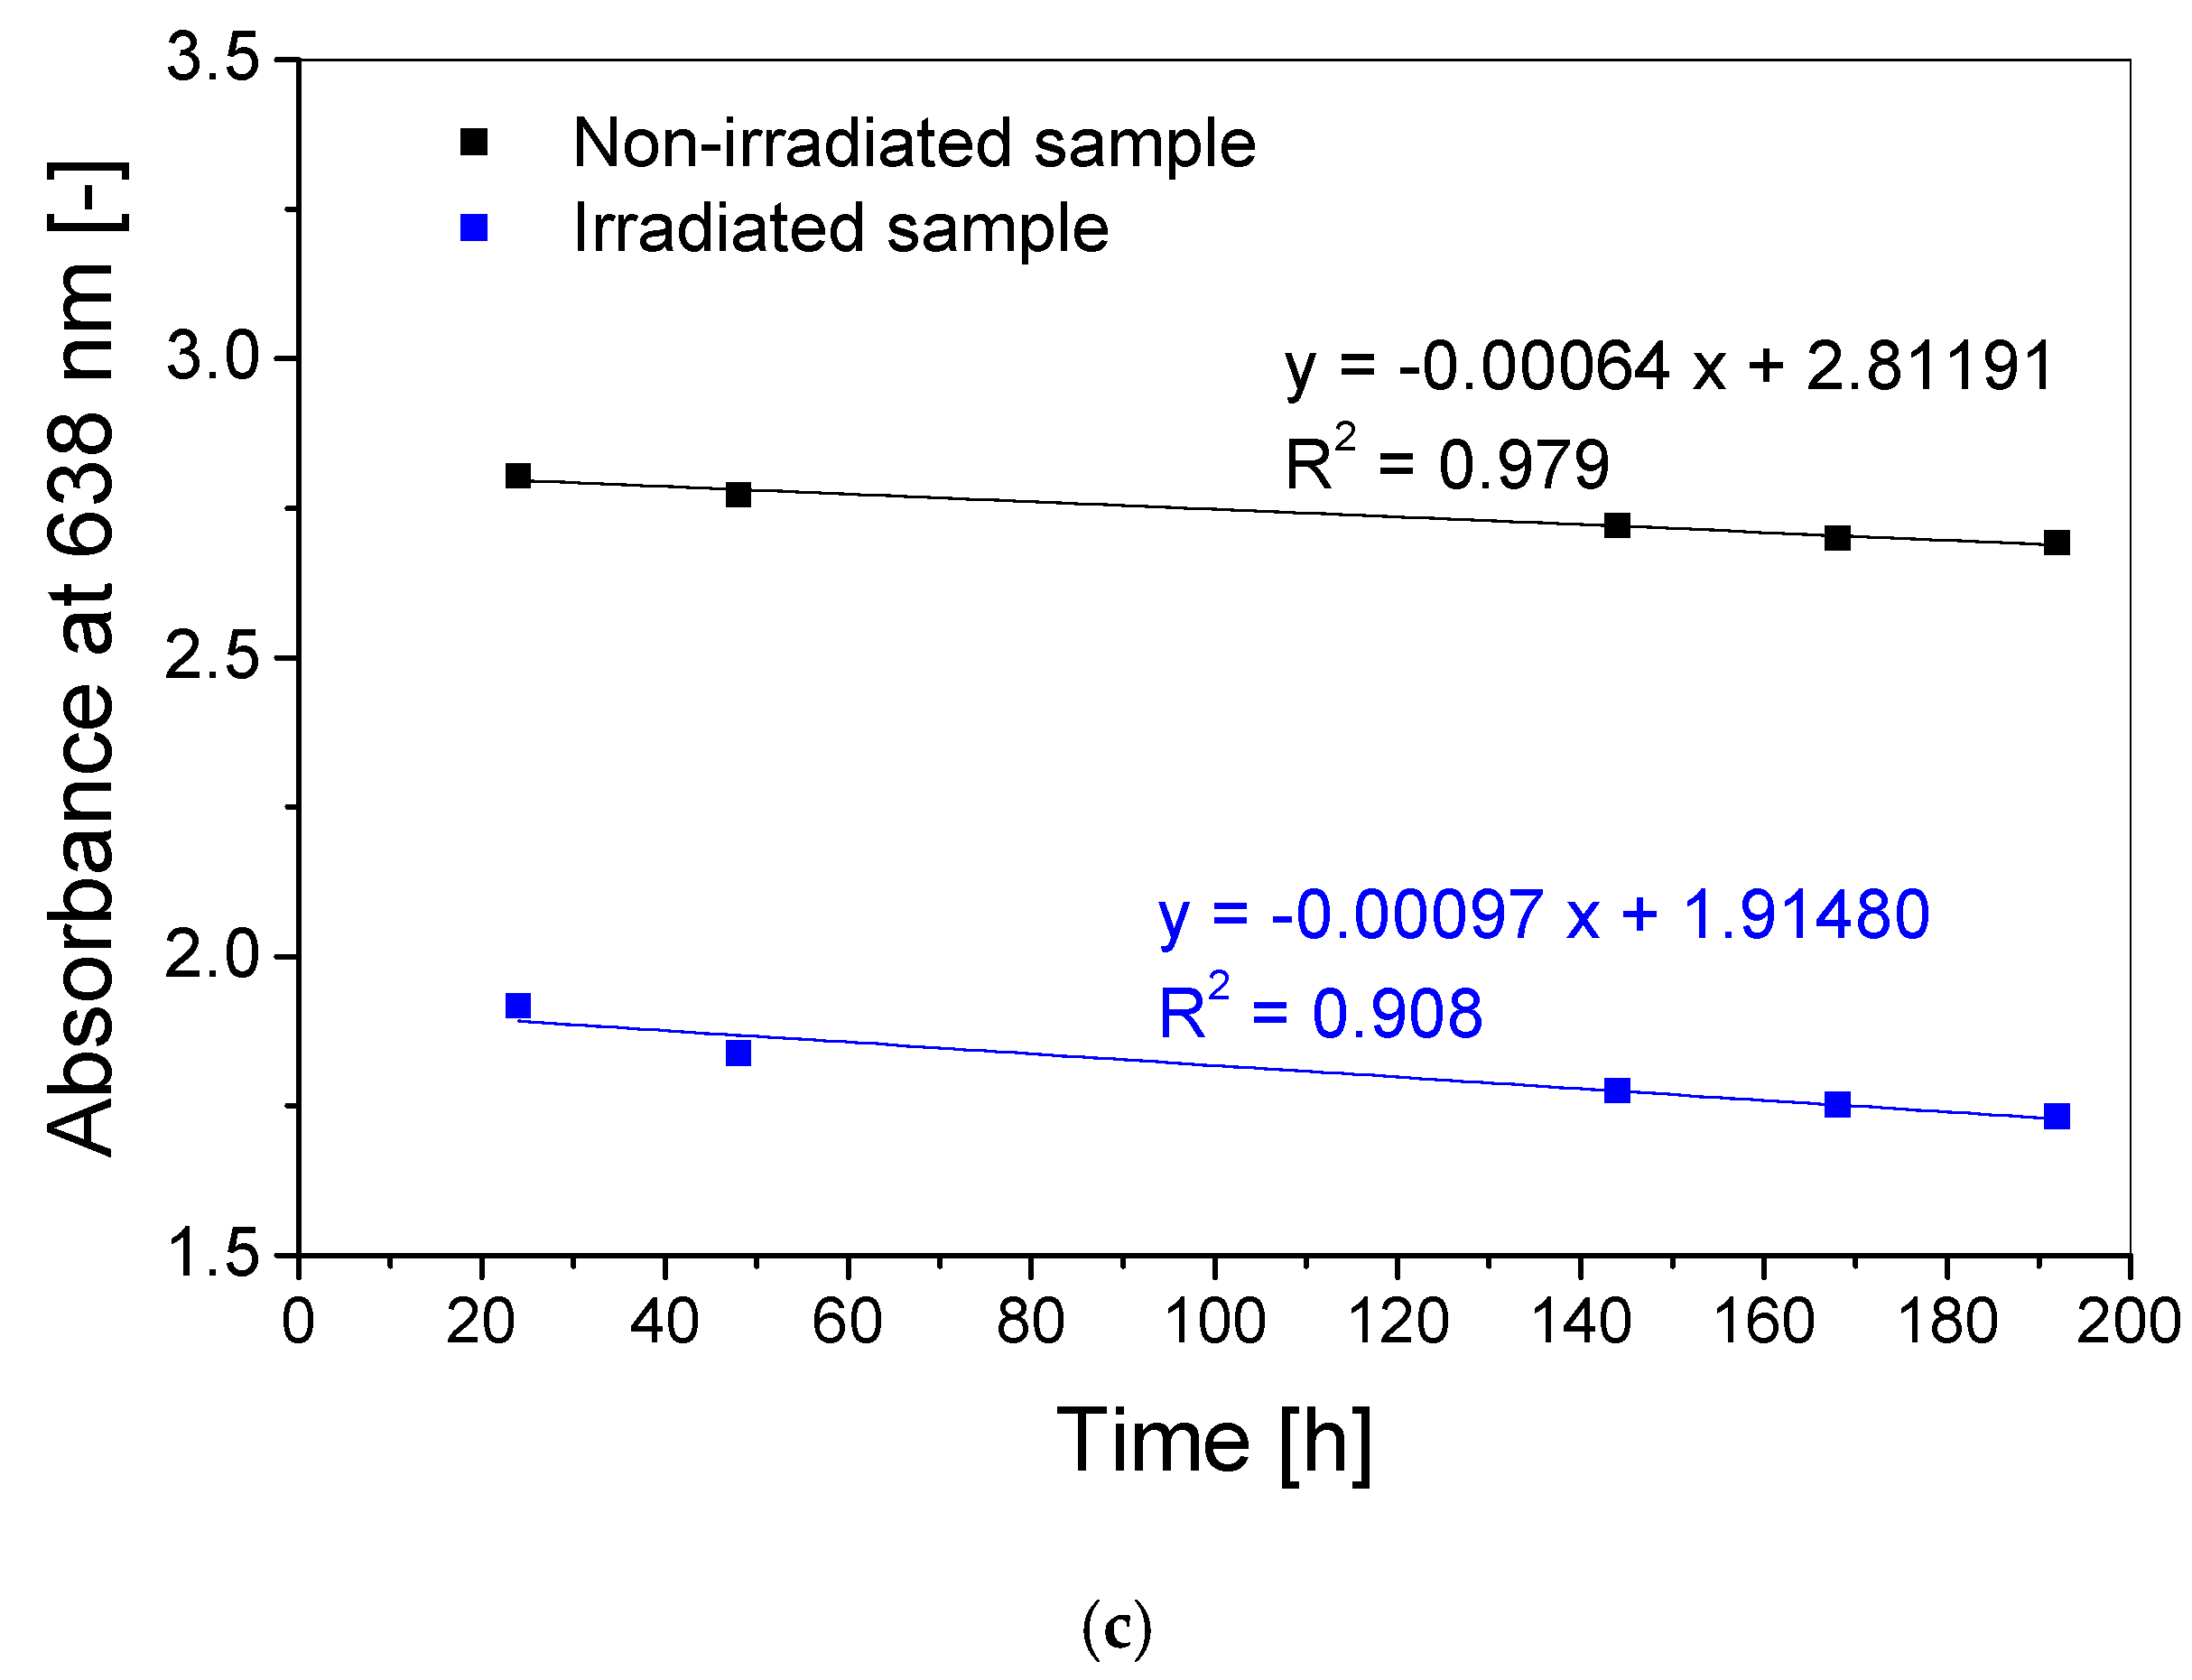
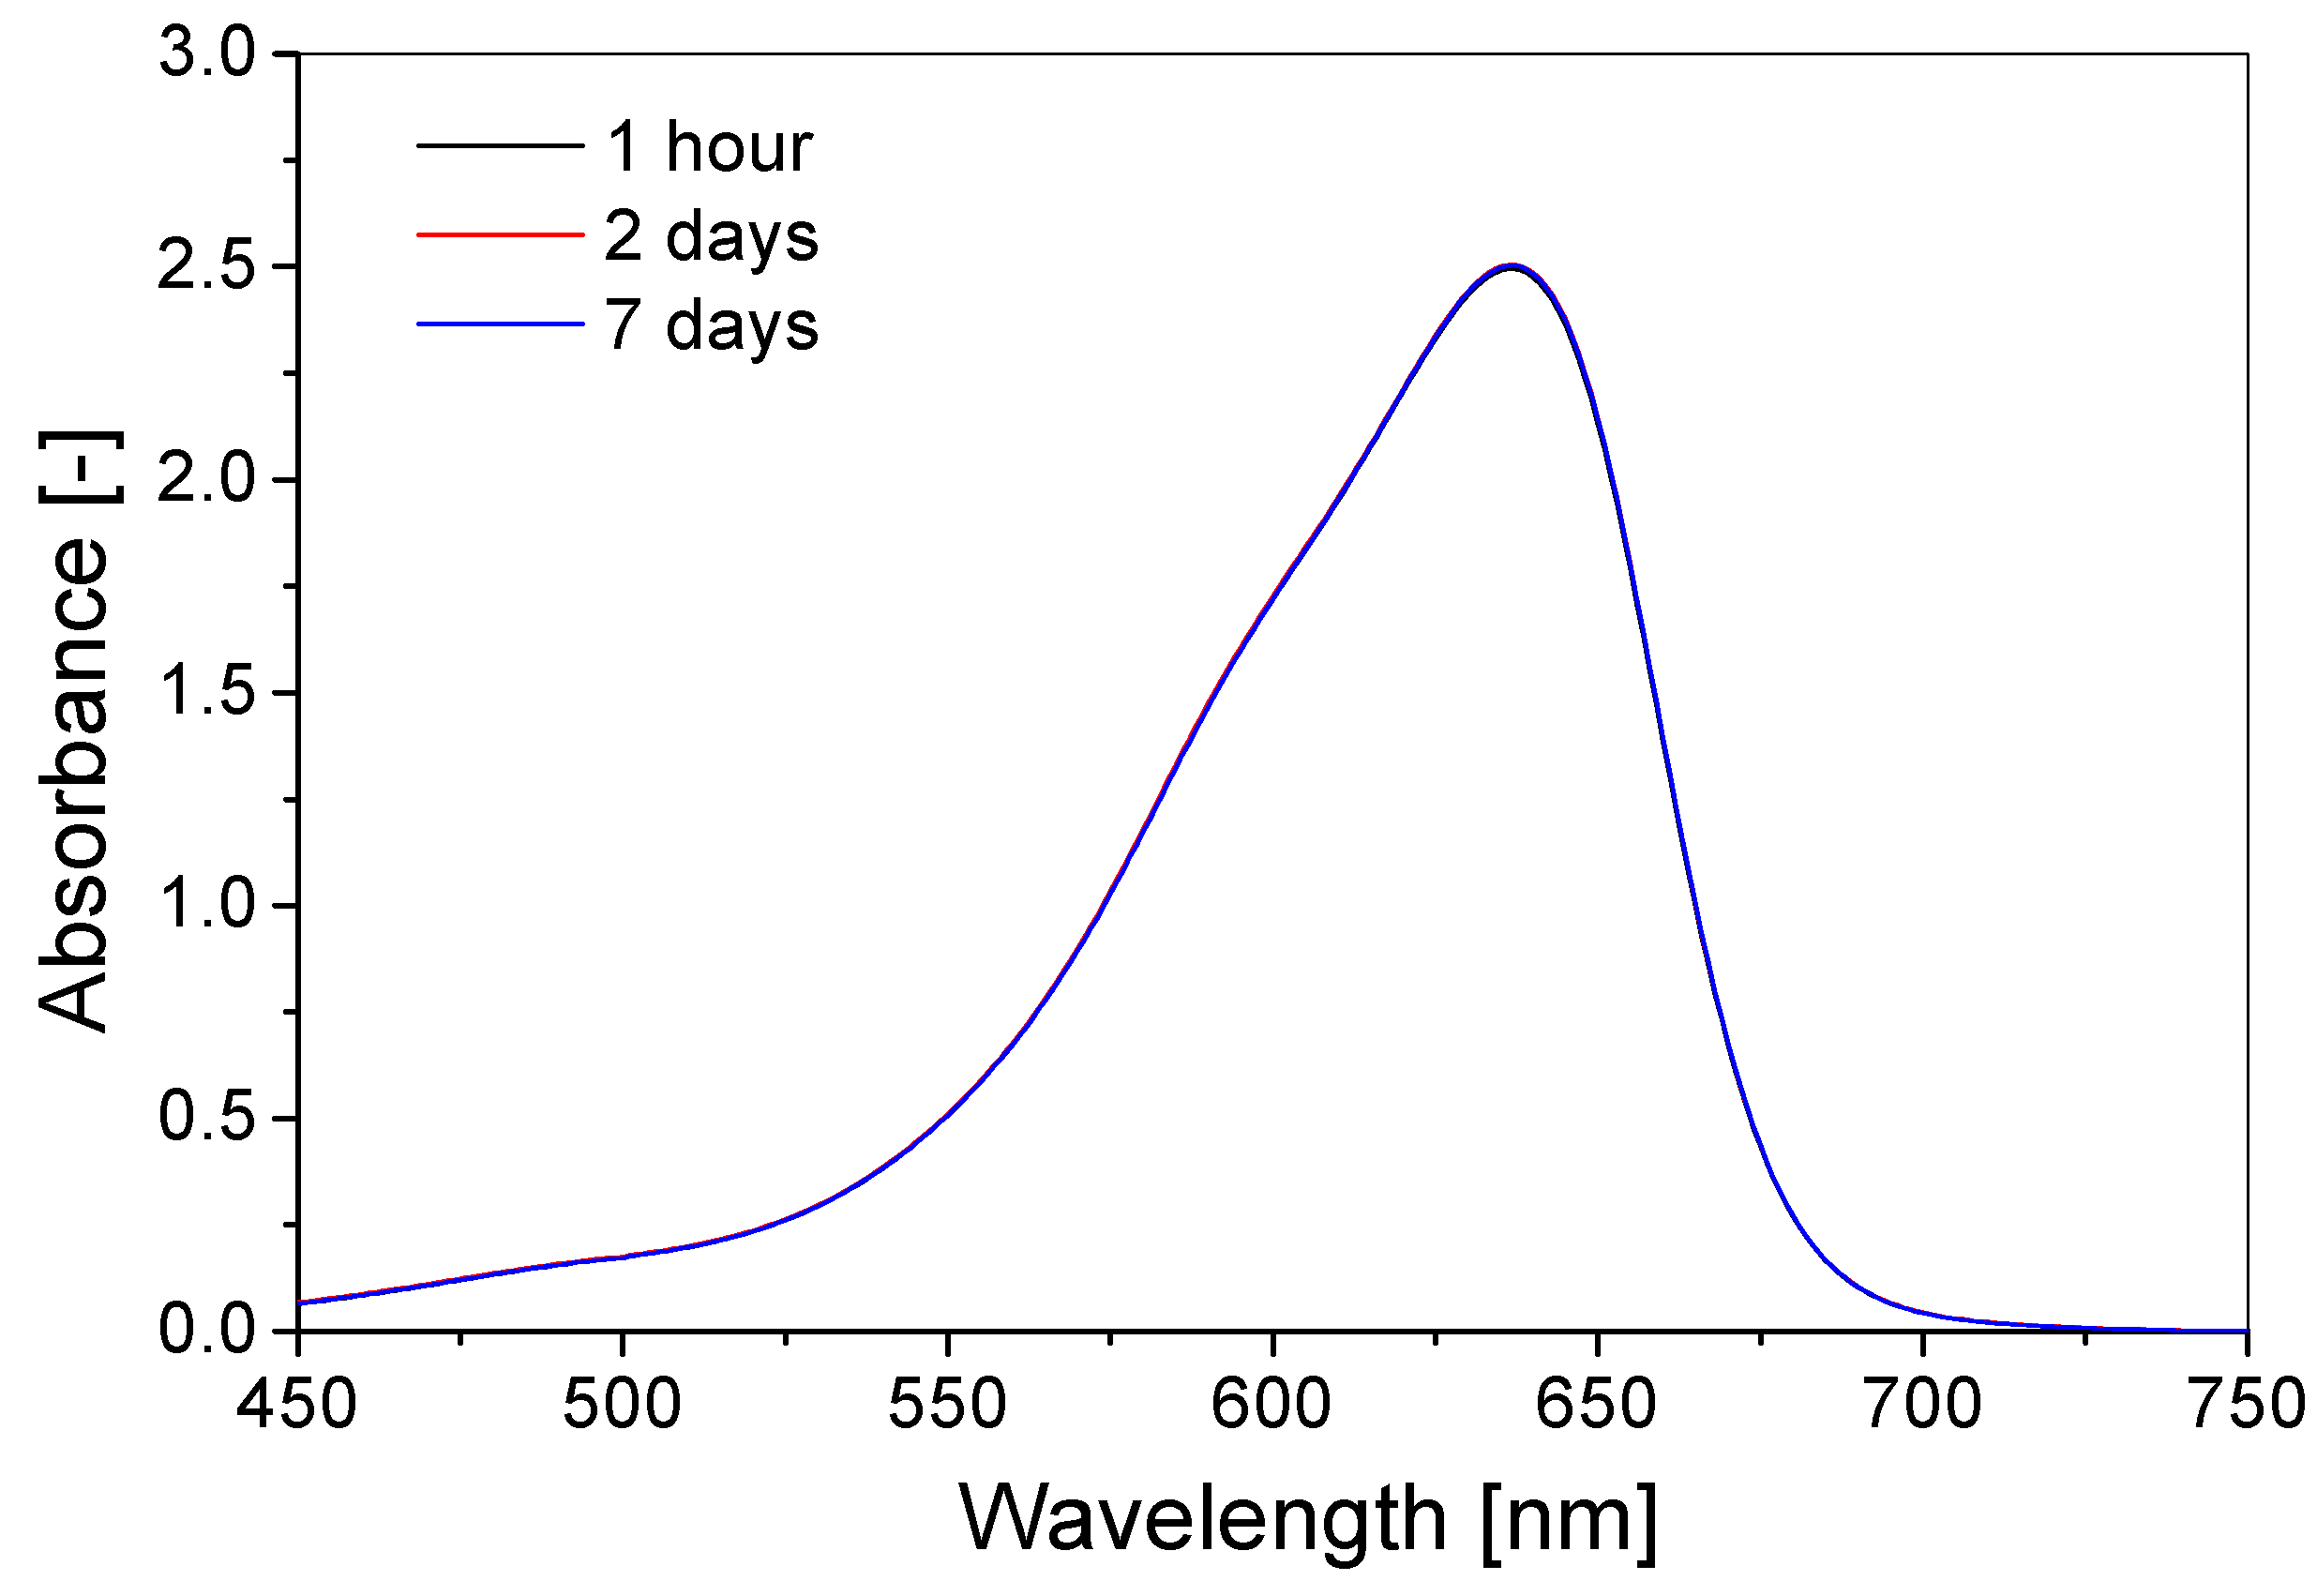
3.3. Stability over Time
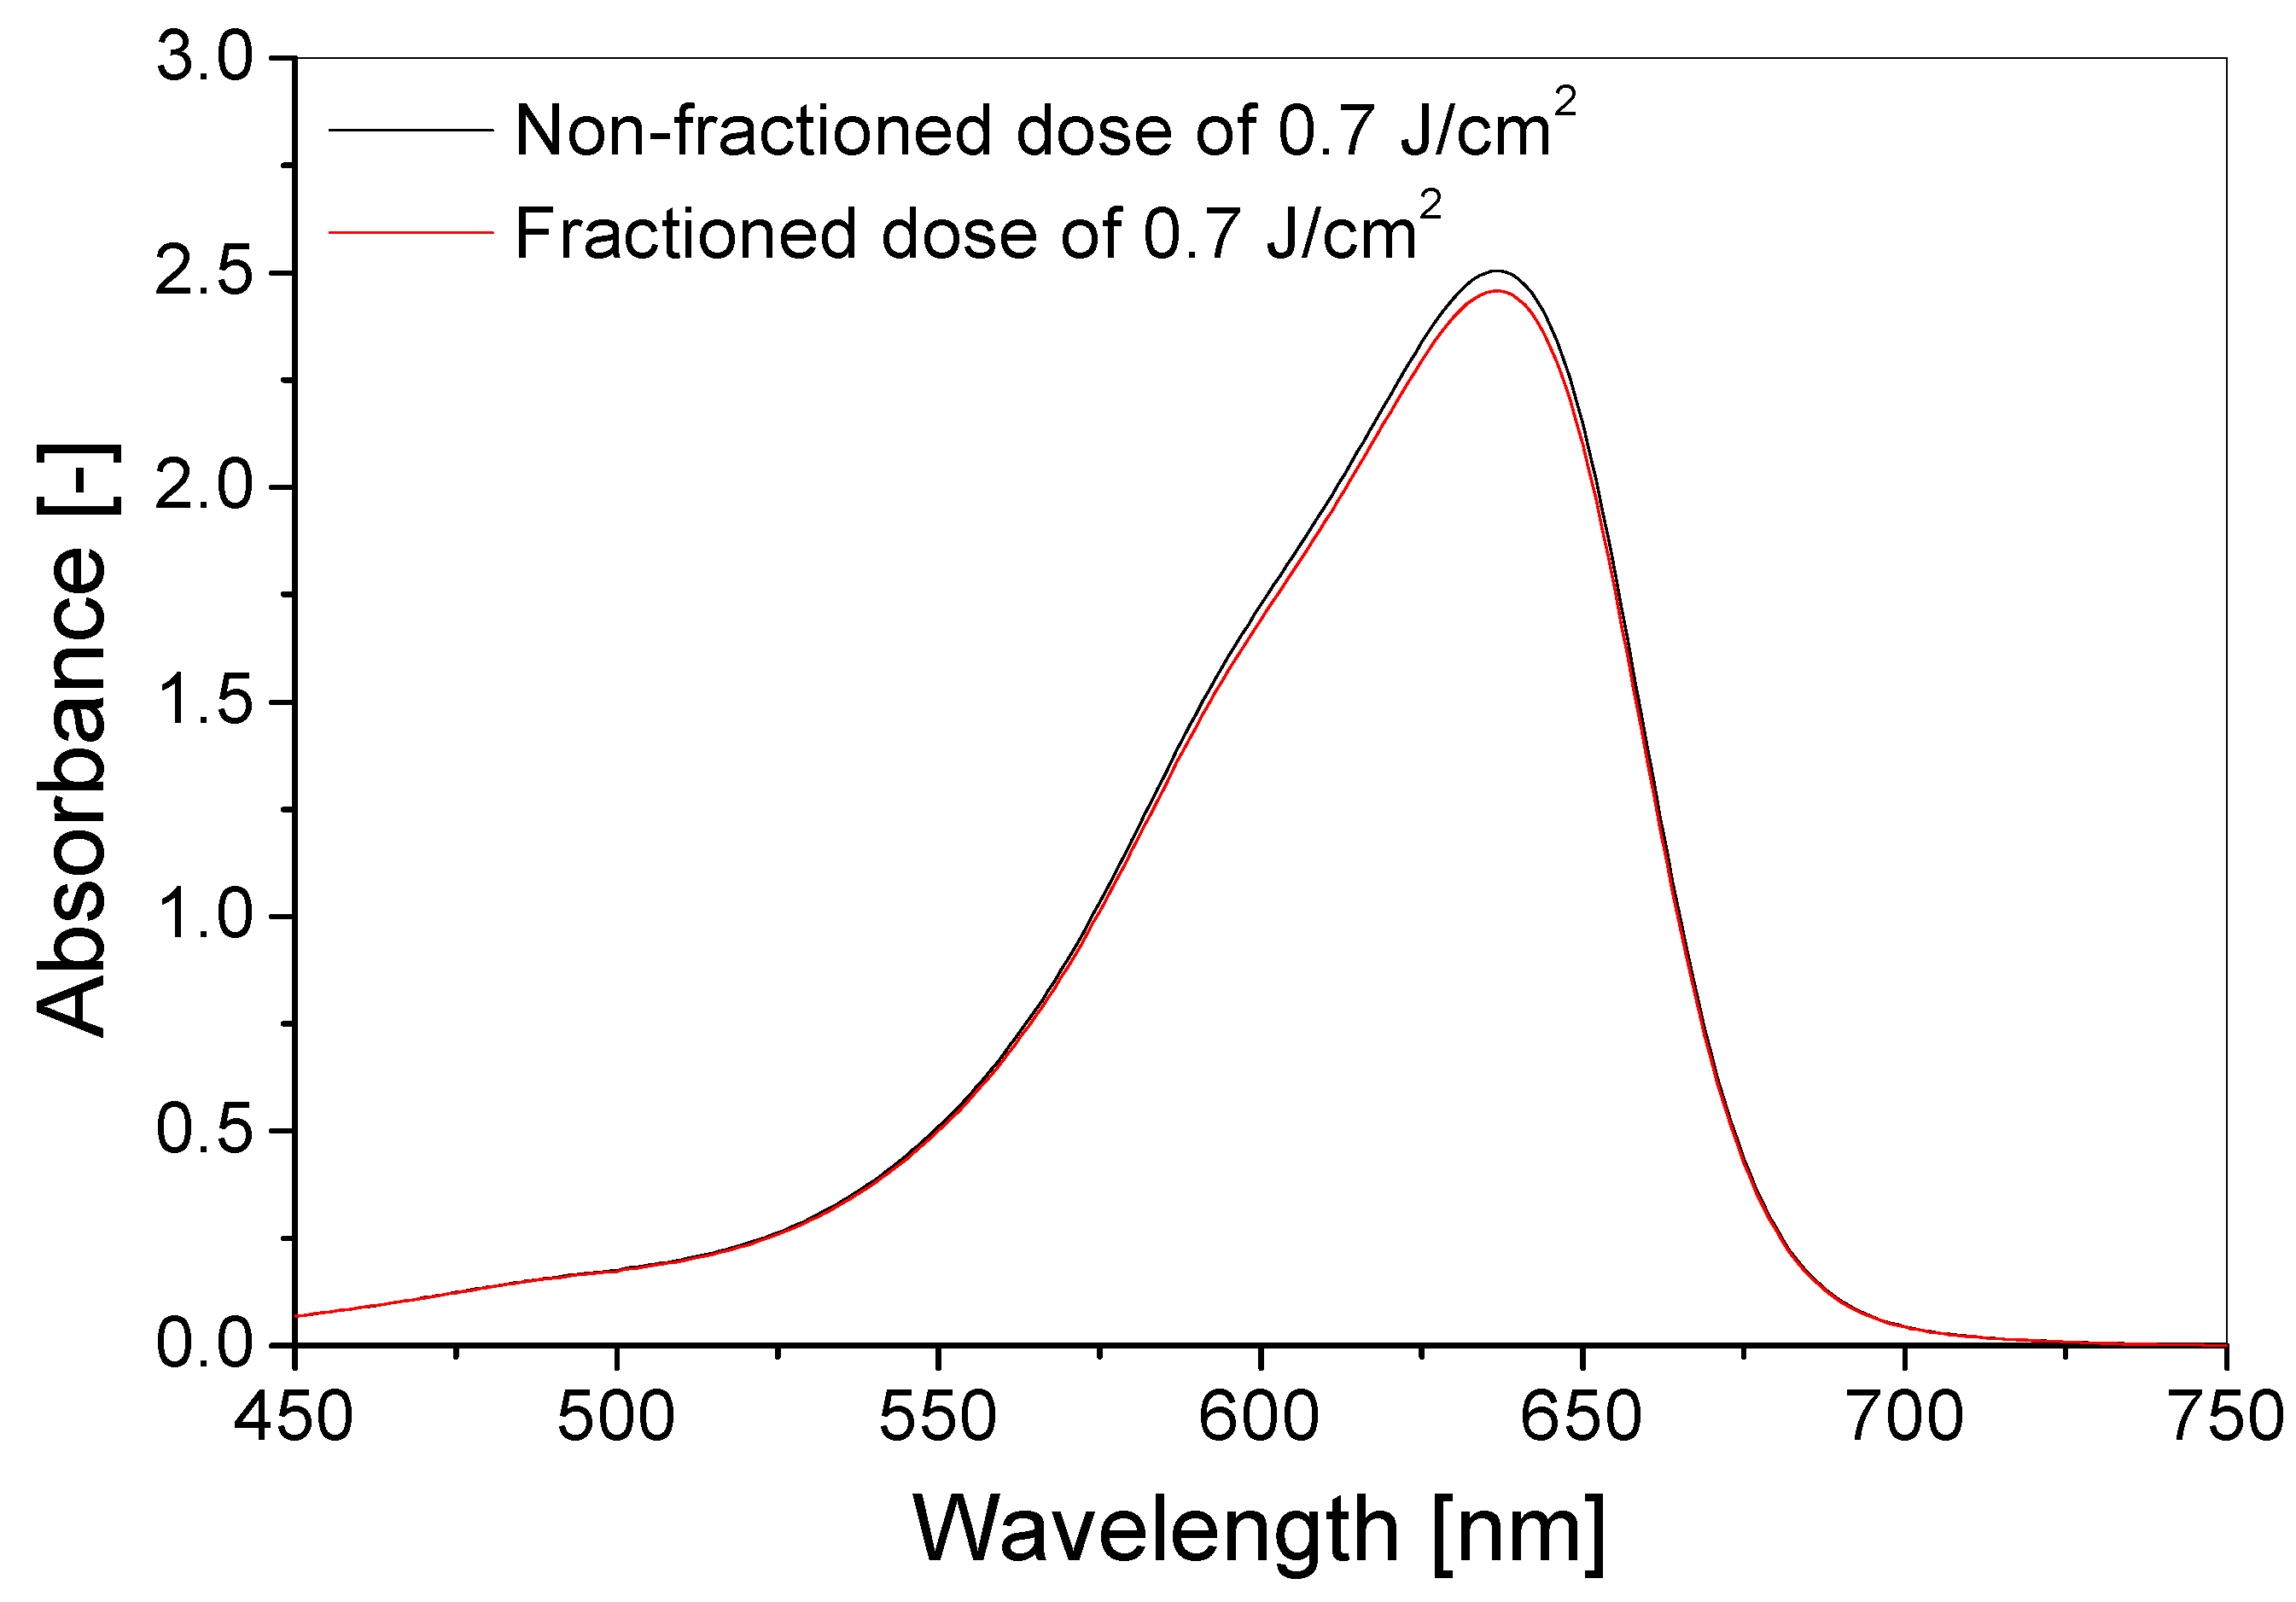
3.4. Spatial Stability of Dose Distribution
4. Conclusions
Author Contributions
Funding
Institutional Review Board Statement
Informed Consent Statement
Data Availability Statement
Conflicts of Interest
References
- Taylor, H.R. The biological effects of UV-B on the eye. Photochem. Photobiol. 1989, 50, 489–492. [Google Scholar] [CrossRef]
- Urbach, F. Potential effects of altered solar ultraviolet radiation on human skin cancer. Photochem. Photobiol. 1989, 50, 507–513. [Google Scholar] [CrossRef] [PubMed]
- D’Orazio, J.; Jarrett, S.; Amaro-Ortiz, A.; Scott, T. UV Radiation and the Skin. Int. J. Mol. Sci. 2013, 14, 12222–12248. [Google Scholar] [CrossRef] [PubMed] [Green Version]
- Smith, G.J. Ultraviolet Radiation Actinometer. U.S. Patent 4,763,011, 23 August 1988. [Google Scholar]
- Chanishvili, A.; Chilaya, G.; Petriashvili, G.; Barberi, R.; Bartolino, R.; De Santo, M.P. Cholesteric liquid crystal mixtures sensitive to different ranges of solar UV irradiation. Mol. Cryst. Liq. Cryst. 2005, 434, 353–366. [Google Scholar] [CrossRef]
- Petriashvili, G.; Chanishvili, A.; Chilaya, G.; Matranga, M.A.; De Santo, M.P.; Barberi, R. Novel UV sensor based on a liquid crystalline mixture containing a photoluminescent dye. Mol. Cryst. Liq. Cryst. 2009, 500, 82–90. [Google Scholar] [CrossRef]
- Beaubien, D.J.; Beaubien, A.F. Reference Grade Solar Ultraviolet Band Pyranometer. U.S. Patent 5,331,168, 19 July 1994. [Google Scholar]
- Munakata, N. Genotoxic action of sunlight upon Bacillus subtilis spores: Monitoring studies at Tokyo, Japan. J. Radiat. Res. 1989, 30, 338–351. [Google Scholar] [CrossRef] [Green Version]
- Karentz, D.; Lutze, L.H. Evaluation of biologically harmful ultraviolet radiation in Antarctica with a biological dosimeter designed for aquatic environments. Limnol. Oceanogr. 1990, 35, 549–561. [Google Scholar] [CrossRef]
- Hegedüs, M.; Modos, K.; Ronto, G.; Fekete, A. Validation of phage T7 biological dosimeter by quantitative polymerase chain reaction using short and long segments of phage T7 DNA. Photochem. Photobiol. 2003, 78, 213–219. [Google Scholar] [CrossRef]
- Mills, A.; Grosshans, P.; McFarlane, M. UV dosimeters based on neotetrazolium chloride. J. Photochem. Photobiol. A Chem. 2009, 201, 136–141. [Google Scholar] [CrossRef]
- Kozicki, M.; Sąsiadek, E.; Kadłubowski, S.; Dudek, M.; Maras, P.; Nosal, A.; Gazicki-Lipman, M. Flat foils as UV and ionising radiation dosimeters. J. Photochem. Photobiol. A Chem. 2018, 351, 179–196. [Google Scholar] [CrossRef]
- Chen, C.C.; Lu, C.S.; Chung, Y.C.; Lan, J.L. UV light induced photodegradation of malachite green on TiO2 nanoparticles. J. Hazard. Mater. 2007, 141, 520–528. [Google Scholar] [CrossRef] [PubMed]
- Kozicki, M.; Sąsiadek, E. Textile UV detector with 2,3,5-triphenyltetrazolium chloride as an active compound. Radiat. Meas. 2011, 46, 510–526. [Google Scholar] [CrossRef]
- Kozicki, M.; Sąsiadek, E. UV dosimeter based on polyamide woven fabric and nitro blue tetrazolium chloride as an active compound. Radiat. Meas. 2011, 46, 1123–1137. [Google Scholar] [CrossRef]
- Kozicki, M.; Sąsiadek, E. Scanning of flat textile-based radiation dosimeters: Influence of parameters on the quality of results. Radiat. Meas. 2013, 58, 87–93. [Google Scholar] [CrossRef]
- Kozicki, M.; Sąsiadek, E. UV–assisted screen–printing of flat textiles. Coloration Technol. 2012, 128, 251–260. [Google Scholar] [CrossRef]
- Sąsiadek, E.; Jaszczak, M.; Skwarek, J.; Kozicki, M. NBT-Pluronic F–127 hydrogels printed on flat textiles as UV radiation sensors. Materials 2021, 14, 3435. [Google Scholar] [CrossRef]
- Zhang, W.; Yang, L.; Fang, S.; Chen, J. HEA-PVA system for UVA radiation dose measurement. J. Photochem. Photobiol. B 2016, 163, 100. [Google Scholar] [CrossRef]
- Kozicki, M.; Kwiatos, K.; Dudek, M.; Stempien, Z. Radiochromic gels for UV radiation measurements in 3D. J. Photochem. Photobiol. A 2018, 351, 197–207. [Google Scholar] [CrossRef]
- Kozicki, M.; Bartosiak, M.; Dudek, M.; Kadłubowski, S. LCV-Pluronic F–127 dosimeter for UV light dose distribution measurements. J. Photochem. Photobiol. A Chem. 2021, 405, 112930. [Google Scholar] [CrossRef]
- Kozicki, M.; Kwiatos, K.; Kadłubowski, S.; Dudek, M. TTC-Pluronic 3D radiochromic gel dosimetry of ionizing radiation. Phys. Med. Biol. 2017, 62, 5668–5690. [Google Scholar] [CrossRef]
- Jaszczak, M.; Wach, R.; Maras, P.; Dudek, M.; Kozicki, M. Substituting gelatine with Pluronic F–127 matrix in 3D polymer gel dosimeters can improve nuclear magnetic resonance, thermal and optical properties. Phys. Med. Biol. 2018, 63, 175010. [Google Scholar] [CrossRef] [PubMed]
- Gafar, S.M.; El-Kelany, M.A.; El-Ahdal, M.A.; El-Shawadfy, S.R. Toluidine Blue O-Gelatin Gel Dosimeter for Radiation Processing. Open J. Polym. Chem. 2014, 4, 56–61. [Google Scholar] [CrossRef] [Green Version]
- Deepthi, K.; Umabala, A.M.; Prasada Rao, A.V. Photocatalytic Degradation of Acid Orange, Toluidine Blue and Rosaniline Using H2O2 Sensitized Bi2MoO6 and Visible Light. Asian J. Chem. 2017, 29, 1677–1682. [Google Scholar] [CrossRef]
- Chi, Z.; Liu, R.; Sun, Y.; Wang, M.; Zhang, P.; Gao, C. Investigation on the toxic interaction of toluidine blue with calf thymus DNA, Journal of Hazardous Materials. J. Hazard. Mater. 2010, 175, 274–278. [Google Scholar] [CrossRef] [PubMed]
- Cataldo, F. Hydrogen peroxide photolysis with different UV light sources including a new UV-LED light source. New Front. Chem. 2014, 23, 99–110. [Google Scholar]
- Venkatadri, R.; Peters, R.W. Chemical Oxidation Technologies: Ultraviolet Light/Hydrogen Peroxide, Fenton’s Reagent, and Titanium Dioxide-Assisted Photocatalysis. Hazard. Waste Hazard. Mater. 1993, 10, 107–149. [Google Scholar] [CrossRef]
- Aleboyeh, A.; Aleboyeh, H.; Moussa, Y. The study of the effect of different variable on H2O2/UV decolorization of three azo dyes in the continuous circulation photoreactor. Trans. Ecol. Environ. 2003, 65, 369–378. [Google Scholar]
- Kwon, B.G.; Kim, J.O.; Kwon, J.K. An Advanced Kinetic Method for HO2∙/O2—Determination by Using Terephthalate in the Aqueous Solution. Environ. Eng. Res. 2012, 17, 205–210. [Google Scholar] [CrossRef] [Green Version]
- Parsoya, P.; Ameta, S.C. Use of zinc ferrite as a photocatalyst for degradation of Toluidine Blue. J. Curr. Chem. Pharm. 2016, 6, 63–69. [Google Scholar]
- Zaribafan, A.; Haghbeen, K.; Fazli, M.; Akhondali, A. Spectrophotometric Method for Hydrogen Peroxide Determination through Oxidation of Organic Dyes. Environ. Stud. Persian Gulf 2014, 1, 93–101. [Google Scholar]


| Chemical Composition | Non-Irradiated Samples | Samples Irradiated with 0.5 J/cm2 of UV Radiation | ||||
|---|---|---|---|---|---|---|
| No. | TBO (µM) | H2O2 (% w/w) | UVA | UVB | UVC | |
| 1 | 30 | 5 |  | 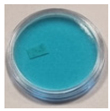 | 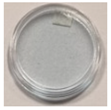 |  |
| 2 | 30 | 10 | 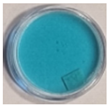 | 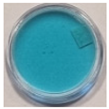 | 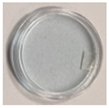 |  |
| 3 | 60 | 5 | 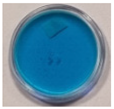 |  | 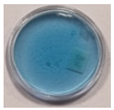 | 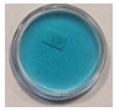 |
| 4 | 60 | 10 | 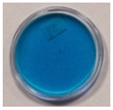 | 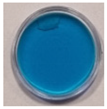 | 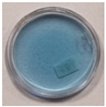 | 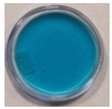 |
| 5 | 60 | - | 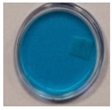 | 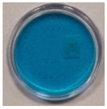 | 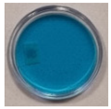 |  |
| Composition (see Table 1) | Dose Sensitivity (cm2/J) | Intercept (–) | Threshold Dose (J/cm2) | Linear Dose Range (J/cm2) | Dynamic Dose Range (J/cm2) | R2 |
|---|---|---|---|---|---|---|
| 1 | −1.9123 ± 0.4982 | 2.0793 ± 0.3794 | 0.01 | 0.5–1 | 0.01–3 | 0.8729 |
| 3 | −1.4315 ± 0.0573 | 3.3703 ± 0.0724 | 0.01 | 0.5–2 | 0.01–3 | 0.9936 |
| 4 | −1.9965 ± 0.3310 | 3.3580 ± 0.3306 | 0.01 | 0.5–1.5 | 0.01–3 | 0.9218 |
| Type of UV Radiation | Threshold Dose (J/cm2) | Linear Dose Range (J/cm2) | Dynamic Dose Range (J/cm2) | Linear Equation A = a × D +A0 Where D Is Dose | Polynomial Equation UVA: A = A0 + aD + bD2 + cD3 UVB: A = A0 + aD + bD2 + cD3 + dD4 +eD5 where D is Dose | ||||||||
|---|---|---|---|---|---|---|---|---|---|---|---|---|---|
| a (cm2/J) | A0 (-) | R2 | a | b | c | d | e | A0 | R2 | ||||
| UVA | 0.05 | 0–1.5 | 0.05–3 | −0.0815 ± 0.0012 | 2.8264 ± 0.0007 | 0.9978 | −0.0882 ± 0.0061 | 0.0223 ± 0.0058 | −0.0165 ± 0.0013 | - | - | 2.8256 ± 0.0012 | 0.9997 |
| UVB | 0.05 | 0.01–0.2 | 0.05–3 | −0.1808 ± 0.0019 | 2.8099 ± 0.0002 | 0.9995 | 0.4732 ± 0.4103 | −1.8483 ± 1.2114 | 0.4651 ± 1.2956 | 0.0906 ± 0.5654 | −0.0295 ± 0.0845 | 2.7868 ± 0.0256 | 0.9976 |
| 0.5–2 | −1.4315 ± 0.0573 | 3.3703 ± 0.0724 | 0.9936 | ||||||||||
| UVC | 0.1 | 0–3 | 0.1–3 | −0.0103 ± 0.0004 | 2.8355 ± 0.0004 | 0.9829 | - | ||||||
Publisher’s Note: MDPI stays neutral with regard to jurisdictional claims in published maps and institutional affiliations. |
© 2022 by the authors. Licensee MDPI, Basel, Switzerland. This article is an open access article distributed under the terms and conditions of the Creative Commons Attribution (CC BY) license (https://creativecommons.org/licenses/by/4.0/).
Share and Cite
Jaszczak, M.; Sąsiadek-Andrzejczak, E.; Kozicki, M. Discolouring 3D Gel Dosimeter for UV Dose Distribution Measurements. Materials 2022, 15, 2546. https://doi.org/10.3390/ma15072546
Jaszczak M, Sąsiadek-Andrzejczak E, Kozicki M. Discolouring 3D Gel Dosimeter for UV Dose Distribution Measurements. Materials. 2022; 15(7):2546. https://doi.org/10.3390/ma15072546
Chicago/Turabian StyleJaszczak, Malwina, Elżbieta Sąsiadek-Andrzejczak, and Marek Kozicki. 2022. "Discolouring 3D Gel Dosimeter for UV Dose Distribution Measurements" Materials 15, no. 7: 2546. https://doi.org/10.3390/ma15072546
APA StyleJaszczak, M., Sąsiadek-Andrzejczak, E., & Kozicki, M. (2022). Discolouring 3D Gel Dosimeter for UV Dose Distribution Measurements. Materials, 15(7), 2546. https://doi.org/10.3390/ma15072546