
A Bibliometric Analysis of the Application of Remote Sensing in Crop Spatial Patterns: Current Status, Progress and Future Directions


Abstract
1. Introduction
2. Materials and Methods
2.1. Methods and Tools
2.2. Literature Search Strategy
3. Basic Information of Field Research
3.1. Publication Trend
3.2. Subject Category
3.3. Time Series Change Analysis of Hot Topics
3.4. Evolution Analysis of Research Hotspots Based on Explosive Index
4. Remote Sensing Monitoring System of Crop Spatial Pattern
4.1. Remote Sensing Monitoring Method of Crop Planting Area
4.1.1. Crop Remote Sensing Recognition Method Based on Spectral Features
- Visual interpretation. The early remote sensing monitoring of crop planting area is mainly based on visual interpretation, that is, relying on the spectral law, geological law and the experience of experts who have a deep understanding of the situation of the study area and the spectral characteristics of crops, inferring crop types from a series of characteristics of remote sensing images, including brightness, tone, position, time, texture and structure [6,42]. The advantage of this method is to make full use of experts’ prior knowledge and comprehensive understanding of image features, as well as the advantages of the human brain, so as to avoid the possible errors caused by only using spectral analysis, and the recognition accuracy is high [43,44,45]. However, the disadvantages of this method are strong subjectivity, low efficiency, high cost and high requirements for time and personnel, so it is not suitable for large-scale crop remote sensing recognition [46,47,48].
- Image-based statistical classification. This method includes supervised and unsupervised classification. It mainly calculates the statistical characteristics between pixels, including the mean value, variance, standard deviation and dispersion, to establish the discriminant function between crop categories, so as to realize crop type recognition [8]. Supervised classification based on statistical features is the first remote sensing classification method for crop recognition, and the remote sensing classification method has been extended to the whole world [49]. As crops also belong to vegetation and have similar spectral characteristics to other vegetation, it is often necessary to select the time phase with obvious differences between crops and other vegetation spectral characteristics [50,51]. However, in large-scale monitoring, especially in areas with complex planting conditions, the classification accuracy is still difficult to control, and classification methods using other effective identification marks are still immature [52]. Therefore, a combination of automatic classification and visual interpretation is also commonly used [41].
- Intelligent classification algorithm. The traditional supervised and unsupervised classification is limited by human or surface environmental factors, which makes it difficult to achieve the research purposes and requirements with classification accuracy [53]. Due to the limitation of the resolution of satellite remote sensing data, satellite image elements have the characteristics of comprehensive spectral information, which causes the computer classification to face many unclear situations [54]. There are many phenomena of the “same object with different spectrum” and “foreign object with same spectrum”. According to the point independence principle of spectral characteristics of ground objects, the proportion of misclassification is very high [55]. In recent years, an intelligent classification algorithm with a high degree of automation has become one of the new hot spots. At present, the common intelligent classification methods of crop area extraction mainly include the neural network [56,57], support vector machine [58], decision tree [59] and random forest [60,61].
- Object-oriented classification method. The object-oriented classification method has outstanding advantages in the application of high-resolution remote sensing images [62]. It not only makes full use of the spectral characteristics of the ground objects, but also considers their shape, texture and structure, so as to form a number of non-overlapping non-empty sub regions after segmentation to reduce “salt-and-pepper noise” [63]. As the objects are relatively uniform, the phenomena of “same spectra with different object” and “same object with different spectra” are solved to some extent [4,64,65,66].
4.1.2. Crop Remote Sensing Recognition Method Based on Crop Phenological Characteristics
- Time series matching method. High temporal resolution images can fully reflect the seasonal changes in vegetation, and the same vegetation in the same area has similar change curves, so different ground features can be identified using the change characteristics of the vegetation index time series [41]. By analyzing the matching degree between the unknown pixel spectral curve and the pure pixel spectral curve, the surface feature types are identified [67,68], including the spectral angle classification, spectral feature fitting and binary coding [69,70]. Inspired by the spectral analysis of hyperspectral remote sensing, this method has been applied to the analysis of time series data to identify crop types [71,72]. The purpose of this method is to make use of the differences in seasonal rhythm, so as to avoid the problem of similar spectral characteristics among crop types [73]. However, the spatial resolution of remote sensing data, which can form time series and is often used in large-scale research, is usually very low, so the monitoring accuracy is not high [74].
- Dentification of key phenological periods. In general, the same crop has relatively stable growth and development characteristics in the same area [75]. The key phenological period can allow crops and other vegetation a greater degree of recognition, which can be used as an important basis to improve the accuracy of crop type recognition [76]. The purpose of this method is to analyze the characteristic value of the key phenological period of crop growth in time series data by selecting the appropriate remote sensing image and using the local crop phenology information, so as to achieve the purpose of crop extraction [77]. This method can make crop type recognition more targeted, thus avoiding the blindness of remote sensing data selection.
- Time series transformation method. Each crop has a unique seasonal growth pattern, which makes the NDVI time series curve reflect its phenological characteristics. The change characteristics of time series data can be described quantitatively after the correlation transformation, and then the crop types can be identified [78]. The amplitude and phase angle images of each crop were extracted using the harmonic analysis of time series, and then the crops were identified using discriminant analysis [79,80]. Based on the discrete Fourier transform to detect the frequency distribution, the extracted biological features can be introduced into the classification feature space, so the separability between categories is improved [81]. The core idea of this method is to extract the time series features of crops different from other land objects using various transformation methods, and can obtain some specific details so that the results of crop classification are more accurate, but only the low-spatial resolution data can be used.
4.1.3. Crop Remote Sensing Recognition Method Based on Multi-Source Data
- Pixel decomposition method. The key point of this method is to provide endmembers from medium- and high-resolution images, and decompose pixels based on low-spatial resolution images of a single scene or multiple scenes in a key phenological period. A large number of studies at home and abroad show that the accuracy of crop recognition is high, which can basically meet actual needs [87,88,89]. This method considers the availability of different types of remote sensing data and makes full use of the advantages of multi-resolution remote sensing with relatively high accuracy. However, the disadvantages of this method are that it does not take advantage of the time advantage of low-spatial resolution remote sensing, the effect is more obvious when the planting structure is relatively simple, and the result is a low-spatial resolution abundance map, which can count the total planting area of crops, but the determination of sub-pixel positions cannot provide much support.
- Correlation analysis model. The key aspect of this method is to establish a semi-quantitative or regression model with low-resolution time series or key phenological data to identify crops [90,91,92]. There are also studies that consider the quantitative functional relationship between the vegetation index and planting area in the key phenological period of crops [93]. The principle of this is that, when the pixel is mixed with other types of ground objects, the slope of the curve in the key period will change. The advantage of this method is that it makes full use of the advantages of multi-resolution remote sensing, highlights key phenological characteristics, makes the theory more sufficient and the accuracy higher. However, the disadvantage of this method is that the result is still an abundance map, which cannot determine the specific location of the sub-pixels and is only used to count the total planting area and the approximate planting distribution.
- Multi-phase mask method. The key aspect of this method is to make use of the time continuity advantage of low-spatial resolution remote sensing data, distinguish crops and non-crops based on the seasonal rhythm characteristics of crops, and identify crop types based on medium- and high-resolution images with crop areas as masks [94,95]. This method takes advantage of the time advantage of low-resolution remote sensing to narrow the spatial range of crop recognition, reduce the influence of “the same object with different spectrum” and “foreign object with the same spectrum” to a certain extent, so as to improve the recognition accuracy. However, it is necessary to formulate relevant rules to ensure the mixed pixels contain crops in the mask.
- Sequence data fusion. The key aspect of this method is the fusion of low-resolution time series data and high-resolution multispectral data, which not only improves the spatial resolution and clarity, but also the accuracy and reliability of recognition [96,97]. The advantage of this method is that it fully integrates the advantages of multi-resolution remote sensing in time and space and improves the spatial accuracy without losing the advantages of time series. However, when using single or several temporal high-resolution remote sensing images to fuse with time series low-spatial resolution remote sensing images, it is necessary to focus on the temporal differences between images of different scales, which also further verifies the applicability of this method.
4.2. Remote Sensing Monitoring of Multiple Cropping
4.2.1. Research Method of Potential Multiple Cropping Index (PMCI)
- AEZ (Agro-Ecological Zones). This method is commonly used to calculate the potential productivity of regional cultivated land in the world. Its purpose is to integrate climate, soil, topography, land use, irrigation conditions and other factors with the growth models of various crops, and finally calculate the maximum production potential of each piece of land [101,102]. The AEZ model considers the factors of crop growth more comprehensively, which has high theoretical significance and practical application value, but for small areas, the accuracy is not high.
- Methods based on aerolithology. The core idea of this method is to divide multiple cropping potential into heat and precipitation potential, and take the smallest one as the final multiple cropping index potential. The heat and precipitation potential is divided into multiple cropping regions by the accumulated temperature of ≥10 °C and the average annual precipitation [103,104]. Based on the agricultural climatology model, the current development still depends on the experience stage, and the determination of the heat and precipitation threshold mostly depends on the experience value, which has some limitations.
- Method based on an economic model. This method considers that the production of crops and the concept products in economics have some similarities; that is, under the input of some production factors, a certain output can be obtained. If light, temperature, water resources and other natural conditions are regarded as input factors, and the multiple cropping index is regarded as the output, then the potential of the multiple cropping index can be measured by using the stochastic frontier production function, which is used to measure the technical efficiency in economics [105,106]. The method based on the economic model can be used to analyze the non-benefit part of multiple cropping, but the premise of application is that multiple cropping must reach the maximum potential in some places.
4.2.2. Research Method of Actual Multiple Cropping Index (MCI)
- Statistical method of the Statistical Yearbook. The most commonly used method is to obtain the actual multiple cropping index by dividing the sown area of crops by the cultivated area in the Statistical Yearbook. The statistical method is relatively simple in calculation. The advantage of this method is that it can quickly evaluate the change trend of the multiple cropping index on the regional scale, but the disadvantage is that the accuracy is often restricted by the reliability and lag of statistical data, and it cannot effectively represent the local pattern change in the cultivated land multiple cropping index or accurately describe the spatial characteristics of the planting system [107,108].where is the multiple cropping index of regional cultivated land; is the total harvest area of the whole year; is the total area of cultivated land.
- Peak value method. The peak value method is the most widely used method in multiple cropping monitoring due to being simple and easy to use. The core idea of the peak value method is that the peak value of the crop multiple cropping mode is consistent with that of the crop vegetation index change curve; that is, the vegetation index data of crops in one season of a year forms an obvious single-peak curve, the vegetation index of crops in two seasons of a year forms a double-peak curve and the vegetation index of crops in three seasons of a year forms a triple-peak curve. The key aspect of the peak method is to obtain the frequency and distribution of the peak. However, only calculating the peak number may cause an error in multiple cropping monitoring. As the remote sensing data are disturbed by the condition of the remote sensing sensor itself (inclination, resolution and sensor aging), cloud, atmosphere and sun height angle, the vegetation index directly obtained from the remote sensing image has a large amount of noise. This results in the irregular fluctuation of the time series vegetation index data, which is not suitable for extracting the information of the cultivated land multiple species index directly. Therefore, it is necessary to remove the noise from the time series vegetation index data and reconstruct a smooth time profile to better describe the process of cultivated land seasonal change. Common data smoothing methods are shown in Table 2. The calculation process of the multiple-cropping index is shown in Figure 9.
4.3. Remote Sensing Monitoring of Crop Planting Patterns
4.4. The Mechanism of Crop Spatial Pattern Change
5. Discussion
5.1. Inspiration of Remote Sensing Cloud Platform to the Research of Crop Spatial Pattern
5.2. Future Research Direction for Crop Spatial Pattern Change
5.2.1. The Change Characteristics of Crop Spatial Patterns
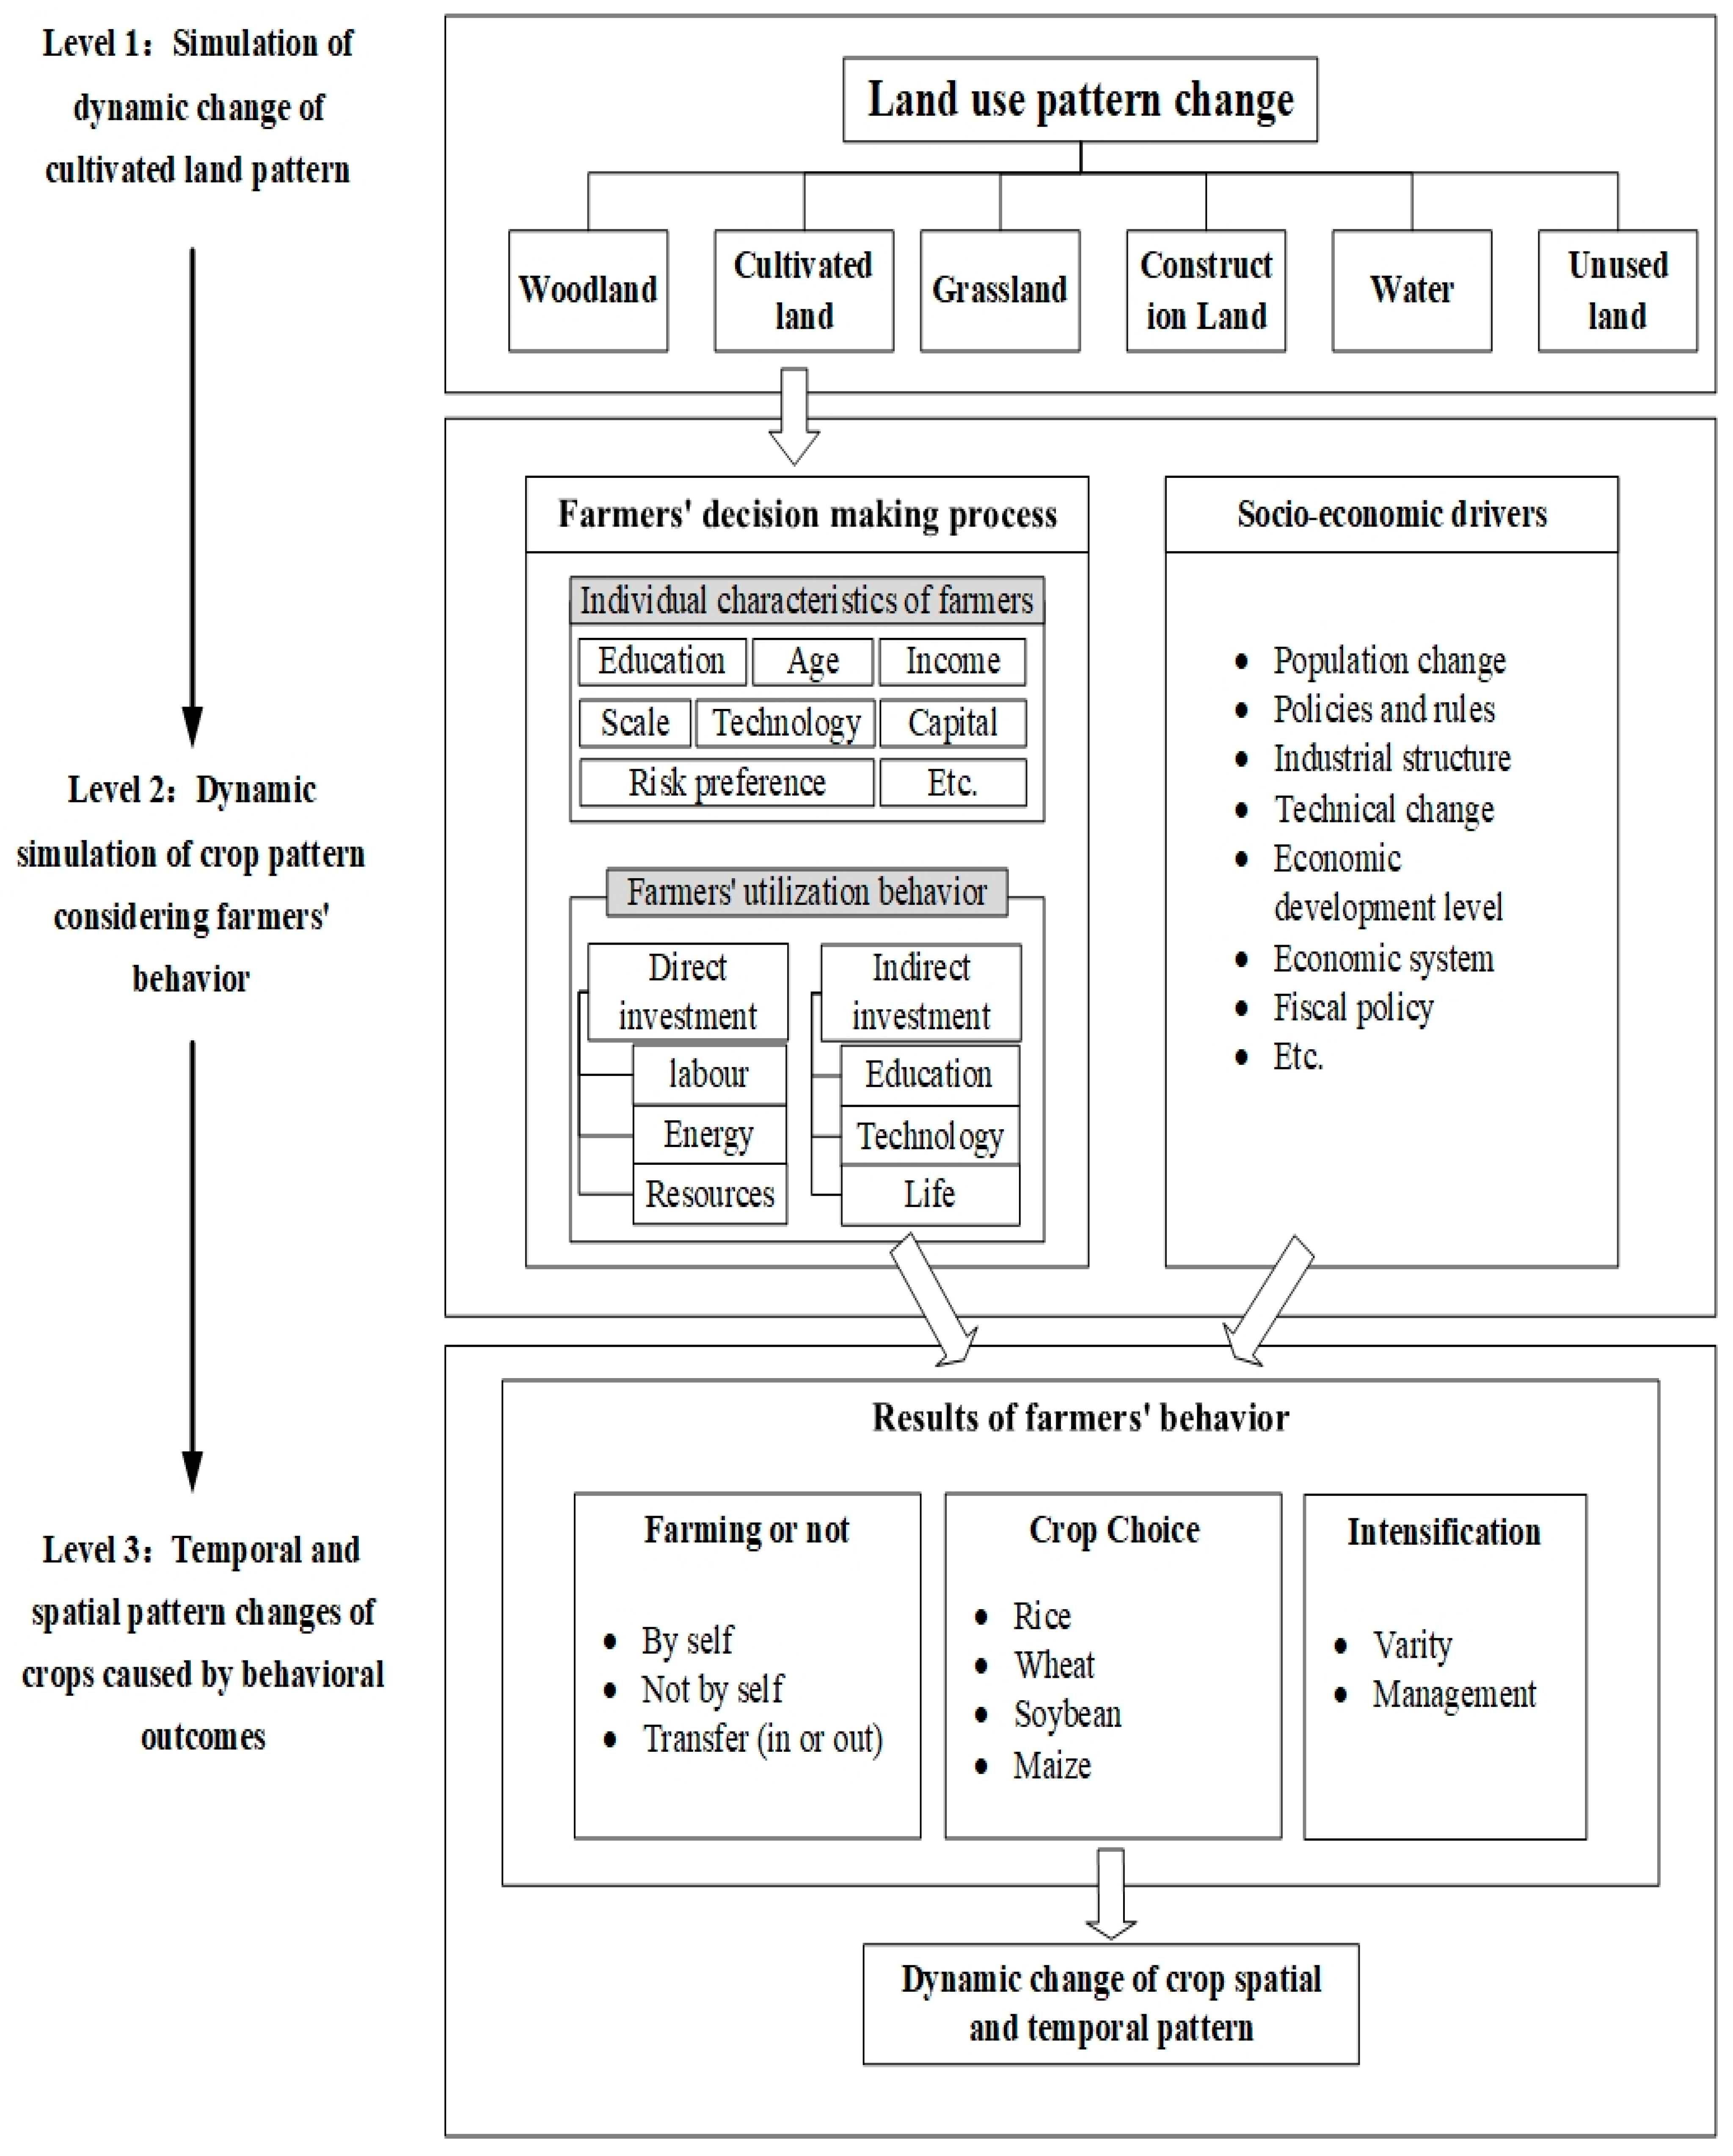
5.2.2. Simulation of Crop Spatial Pattern
6. Conclusions
Author Contributions
Funding
Institutional Review Board Statement
Informed Consent Statement
Data Availability Statement
Conflicts of Interest
References
- Hu, Q.; Wu, W.; Song, Q.; Yu, Q.; Yang, P.; Tang, H. Recent Progresses in Research of Crop Patterns Mapping by Using Remote Sensing. Sci. Agric. Sin. 2015, 48, 1900–1914. [Google Scholar]
- Xie, H.; He, Y.; Zou, J.; Wu, Q. Spatio-temporal difference analysis of cultivated land use intensity based on emergy in the Poyang Lake Eco-economic Zone of China. J. Geogr. Sci. 2016, 26, 1412–1430. [Google Scholar] [CrossRef]
- Li, Z.; Yu, Y.; Jiang, A. Temporal Variations and Driving Factors of Cultivated Land Use Intensity in Shandong Province from 1980 to 2015. J. Resour. Ecol. 2019, 10, 265. [Google Scholar]
- Chen, Z.; Ren, J.; Tang, H.; Shi, Y.; Liu, J. Progress and perspectives on agricultural remote sensing research and applications in China. J. Remote Sens. 2016, 20, 748–767. [Google Scholar]
- Chen, S.; Ma, Z. Temporal and Spatial Characteristics and Optimization of the Intensive Use of Cultivated Land in Maoming City. J. Resour. Ecol. 2020, 11, 598–605. [Google Scholar] [CrossRef]
- Tang, H.; Wu, W.; Yang, P. Recent Progresses in Monitoring Crop Spatial Patterns by Using Remote Sensing Technologies. Sci. Agric. Sin. 2010, 43, 2879–2888. [Google Scholar]
- Liu, Z.; Liu, D.; Zhu, D.; Zhang, L.; Zan, X.; Tong, L. Review on Crop Type Fine Identification and Automatic Mapping Using Remote Sensing. Trans. Chin. Soc. Agric. Mach. 2018, 49, 1–12. [Google Scholar]
- Wu, W.; Yang, P.; Li, Z.; Chen, Z.; Zhou, Q.; Tang, H. Review on research progress of crop spatial pattern change. Chin. J. Agric. Resour. Reg. Plan. 2014, 35, 12–20. [Google Scholar]
- Emami, F.; Koch, M. Agricultural Water Productivity-Based Hydro-Economic Modeling for Optimal Crop Pattern and Water Resources Planning in the Zarrine River Basin, Iran, in the Wake of Climate Change. Sustainability 2018, 10, 3953. [Google Scholar] [CrossRef]
- Wu, W.; Yu, Q.; Peng, Y.; Lu, M.; Qiong, H.; Song, Q.; Shi, Y.; Sun, J.; Zhang, B.; Shi, Z. Latest research progresses in agricultural land resources remote sensing. China Agric. Inf. 2019, 31, 1–12. [Google Scholar]
- Song, Q.; Hu, Q.; Lu, M.; Yu, Q.; Yang, P.; Shi, Y.; Duan, Y.; Wu, W. Prospect of crop mapping. Chin. J. Agric. Resour. Reg. Plan. 2020, 41, 57–65. [Google Scholar]
- Hu, Q.; Yin, H.; Friedl, M.A.; You, L.; Li, Z.; Tang, H.; Wu, W. Integrating coarse-resolution images and agricultural statistics to generate sub-pixel crop type maps and reconciled area estimates. Remote Sens. Environ. 2021, 258, 112365. [Google Scholar] [CrossRef]
- Long, Y.; Wu, W.; Yu, Q.; Hu, Q.; Lu, M.; Chen, D. Recent Study Progresses in Intensive Use of Cropland. J. Nat. Resour. 2018, 33, 337–350. [Google Scholar]
- Guo, J.; Li, G.; Li, Q. Impact of the labor cost increase on the structure of main crops in China: Based on the Chinese provincial panel data from 1998 to 2014. J. Hunan Agric. Univ. 2017, 18, 44–50. [Google Scholar]
- Yang, Z.; Wu, W.; Di, L.; Üstündağ, B. Remote sensing for agricultural applications. J. Integr. Agric. 2017, 16, 239–241. [Google Scholar] [CrossRef]
- Song, Q.; Zhou, Q.B.; Wu, W.B.; Hu, Q.; Yu, Q.; Tang, H. Recent Progresses in Research of Integrating Multi-Source Remote Sensing Data for Crop Mapping. Sci. Agric. Sin. 2015, 48, 1122–1135. [Google Scholar]
- Atzberger, C. Advances in Remote Sensing of Agriculture: Context Description, Existing Operational Monitoring Systems and Major Information Needs. Remote Sens. 2013, 5, 949–981. [Google Scholar] [CrossRef]
- Zhong, G.; Zhou, Q.; Wang, D. Spatial variability of crop area sampling unit and its influence on sampling extrapolation efficiency. Chin. J. Agric. Resour. Reg. Plan. 2019, 40, 20–36. [Google Scholar]
- Yu, X. Application of remote sensing technology and information in agricultural statistical investigation. China Stat. 2016, 3, 9–11. [Google Scholar]
- Bégué, A.; Arvor, D.; Bellon, B.; Betbeder, J.; de Abelleyra, D.; Ferraz, P.D.R.; Lebourgeois, V.; Lelong, C.; Simões, M.; Verón, S. Remote Sensing and Cropping Practices: A Review. Remote Sens. 2018, 10, 99. [Google Scholar] [CrossRef]
- Zhou, T.; Pan, J.; Han, T.; Wei, S. Planting area extraction of winter wheat based on multi-temporal SAR data and optical imagery. Trans. Chin. Soc. Agric. Eng. 2017, 33, 215–221. [Google Scholar]
- Liu, H.Q.; Jin, M.Y.; Gong, W.P. Applications of remote sensing in agriculture in the United States. Chin. J. Agric. Resour. Reg. Plan. 1999, 20, 58–62. [Google Scholar]
- Xu, W.; Tian, Y. Overview of extraction of crop area from remote sensing. J. Yunnan Agric. Univ. 2005, 20, 94–98. [Google Scholar] [CrossRef]
- Liu, J.; Wang, L.; Ji, F.; Teng, F.; Yao, B. Design and application of “One Map” crop area remote sensing monitoring operation. China Agric. Inf. 2018, 30, 77–89. [Google Scholar]
- Wang, L.M.; Liu, J. Analysis of Spatial-temporal Dynamic Change of Wheat Planting Structure of China. Chin. Agric. Sci. Bull. 2019, 35, 12–23. [Google Scholar]
- Yan, H.; Xiao, X.; Huang, H.; Liu, J.; Chen, J.; Bai, X. Multiple cropping intensity in China derived from agro-meteorological observations and MODIS data. Chin. Geogr. Sci. 2014, 24, 205–219. [Google Scholar] [CrossRef]
- Su, S.; Wang, Y. Analysis on the evolution track of crop gravity center and geographical agglomeration trend in China. Rural Econ. Sci.-Technol. 2017, 28, 1–4. [Google Scholar]
- Liao, Y.; Song, Z.; Zhao, F.; Lu, K. Impacts of Climate Change on the Agricultural Planting Structure of Main Crops in Hunan. Chin. Agric. Sci. Bull. 2010, 26, 276–286. [Google Scholar]
- Du, G.; Zhang, Y.; Li, Q. The evolution path of crop structure in the Sanjiang Plain in the 21st century. Res. Agric. Mod. 2019, 40, 736–744. [Google Scholar]
- Li, Y.; Qiu, B.; He, Y.; Chen, G.; Ye, Z. Cropping intensity based on MODIS data in China during 2001–2018. Prog. Geogr. 2020, 39, 1874–1883. [Google Scholar] [CrossRef]
- Zhu, X.L.; Li, Q.; Shen, M.G.; Chen, J.; Wu, J. A Methodology for Multiple Cropping Index Extraction Based on NDVI Time-Series. J. Nat. Resour. 2008, 23, 534–544. [Google Scholar]
- Wei, W.; Wu, W.; Li, Z.; Yang, P.; Hu, Q.; Zhou, Q. Comparative study on reconstruction methods of time series vegetation index. Chin. J. Agric. Resour. Reg. Plan. 2014, 35, 34–43. [Google Scholar]
- Qiu, J. Bibliometrics, 2nd ed.; Science Press: Beijing, China, 2019. [Google Scholar]
- Li, J. Scientometrics and Knowledge Networks Analysis, 2nd ed.; Capital University of Economics and Business Press: Beijing, China, 2017. [Google Scholar]
- Yuan, Z.; Li, J.; Li, F. Visualization analysis on discipline dynamic of tillage erosion in recent 30 years based on Citespace. Res. Soil. Water Conserv. 2021, 28, 407–411. [Google Scholar]
- Mauricius Co-Occurrence Analysis. Available online: https://blog.csdn.net/zhaozhn5/article/details/78120507 (accessed on 8 January 2021).
- Garfield, E.; Paris, S.W.; Stock, W.G. HistCite™: A software tool for informetric analysis of citation linkage. Inf. Wiss. Prax. 2006, 57, 391–400. [Google Scholar]
- Xiao, P.; Zhou, Y.; Li, X.; Xu, J.; Zhao, C. Assessment of Heavy Metals in Agricultural Land: A Literature Review Based on Bibliometric Analysis. Sustainability 2021, 13, 4559. [Google Scholar] [CrossRef]
- Chen, C. CiteSpace II: Detecting and visualizing emerging trends and transient patterns in scientific literature. J. Am. Soc. Inf. Sci. Technol. 2006, 57, 359–377. [Google Scholar] [CrossRef]
- Liu, X.; Pei, T.; Shu, H.; Gao, X. A Bibliometric Investigation of Research on Social-Ecological System Resilience. Adv. Earth Sci. 2019, 34, 765–777. [Google Scholar]
- Zhang, X.; Liu, J.; Qin, F. A Review of Remote Sensing Application in Crop Type Discrimination. Chin. Agric. Sci. Bull. 2014, 30, 278–285. [Google Scholar]
- Wang, Y.; Gong, Y. Spectral Remote Sensing Technology Applied in Crop Yield Estimation: Research Progress. Chin. Agric. Sci. Bull. 2019, 35, 69–75. [Google Scholar]
- Zhang, Z. Accuracy analysis of ground feature recognition of gaogao-1 image. Geospat. Inf. 2018, 16, 21–25. [Google Scholar]
- Tian, J.; Deng, R.; Qin, Y.; Liu, Y.; Liang, Y.; Liu, W. Visual Interpretation and Spatial Distribution of Water Pollution Source Based on Remote Sensing Inversion in Pearl River Delta. Econ. Geogr. 2018, 38, 172–178. [Google Scholar]
- Li, Z.; Zhang, Y.; Yang, S.; Zhu, Q.; Wu, J.; Ma, H.; He, Y. Error assessment of extracting morphological parameters of bank gullies by manual visual interpretation based on QuickBird imagery. Trans. Chin. Soc. Agric. Eng. 2014, 30, 179–186. [Google Scholar]
- Bey, A.; Sánchez-Paus Díaz, A.; Maniatis, D.; Marchi, G.; Mollicone, D.; Ricci, S.; Bastin, J.-F.; Moore, R.; Federici, S.; Rezende, M. Collect Earth: Land Use and Land Cover Assessment through Augmented Visual Interpretation. Remote Sens. 2016, 8, 807. [Google Scholar] [CrossRef]
- Schepaschenko, D.; See, L.; Lesiv, M.; Bastin, J.F.; Mollicone, D.; Tsendbazar, N.E.; Bastin, L.; McCallum, I.; Laso Bayas, J.C.; Baklanov, A.; et al. Recent Advances in Forest Observation with Visual Interpretation of Very High-Resolution Imagery. Surv. Geophys. 2019, 40, 839–862. [Google Scholar] [CrossRef]
- Yang, Y.; Kasimu, A. Several Problems of Remote Sensing Image Visual Interpretation of the Arid Area. J. Xinjiang Norm. Univ. 2016, 35, 12–16. [Google Scholar]
- Amani, M.; Brisco, B.; Afshar, M.; Mirmazloumi, S.M.; Mahdavi, S.; Mirzadeh, S.M.J.; Granger, J. A generalized supervised classification scheme to produce provincial wetland inventory maps: An application of Google Earth Engine for big geo data processing. Big Earth Data 2019, 3, 378–394. [Google Scholar] [CrossRef]
- Dhingra, S.; Kumar, D. A review of remotely sensed satellite image classification. Int. J. Electr. Comput. Eng. (IJECE) 2019, 9, 1720–1731. [Google Scholar] [CrossRef]
- Abbas, Z.; Jaber, H.S. Accuracy assessment of supervised classification methods for extraction land use maps using remote sensing and GIS techniques. IOP Conf. Ser. Mater. Sci. Eng. 2020, 745, 012166. [Google Scholar] [CrossRef]
- Liu, W.; Qin, R.; Su, F. Weakly supervised classification of time-series of very high resolution remote sensing images by transfer learning. Remote Sens. Lett. 2019, 10, 689–698. [Google Scholar] [CrossRef]
- Raj, A.; Minz, S. A Scalable Unsupervised Classification Method Using Rough Set for Remote Sensing Imagery. Int. J. Softw. Sci. Comput. Intell. 2021, 13, 65–88. [Google Scholar] [CrossRef]
- Zhao, Z.; Liu, D.; Hang, Z. Research status and Prospect of crop remote sensing recognition methods. Jiangsu Agric. Sci. 2019, 47, 45–51. [Google Scholar]
- Wang, D.; Zhang, A.; Zhao, A.; Li, J. Extraction model of winter wheat planting information based on unsupervised classification. Bull. Surv. Mapp. 2019, 8, 68–71. [Google Scholar]
- Wang, C.; Zhao, Q.; Ma, Y.; Ren, Y. Crop Identification of Drone Remote Sensing Based on Convolutional Neural Network. Trans. Chin. Soc. Agric. Mach. 2019, 50, 161–168. [Google Scholar]
- Zhou, L.; Mu, H.; Ma, H. Remote sensing estimation on yield of winter wheat in North China based on convolutional neural network. Trans. Chin. Soc. Agric. Eng. 2019, 35, 119–128. [Google Scholar]
- Li, L.; Pan, Y.; Zhang, J.; Song, G.; Hou, D. Method of winter wheat planting area estimation based on support vector machine and post-classification changed vector analysis. Trans. Chin. Soc. Agric. Mach. 2010, 26, 210–217. [Google Scholar]
- Du, B.; Zhang, J.; Wang, Z.; Mao, D.; Zhang, M.; Wu, B. Crop Mapping based on Sentinel-2A NDVI Time Series Using Object-Oriented Classification and Decision Tree Model. J. Geo-Inf. Sci. 2019, 21, 740–751. [Google Scholar]
- Wu, L.; Wang, X.; Wang, Z.; Fang, X.; Zhu, T.; Ding, L. Crops identification based on hyperspectral data and random forest method. J. Zhejiang AF Univ. 2020, 37, 136–142. [Google Scholar]
- He, Y.; Wang, C.; Jia, H.; Chen, F. Research on Extraction of Winter Wheat based on Random Forest. Remote Sens. Technol. Appl. 2018, 33, 1132–1140. [Google Scholar]
- Li, H.; Xu, F.; Weng, X. Recognition method for high-resolution remote-sensing imageries of ionic rare earth mining based on object-oriented technology. Arab. J. Geosci. 2020, 13, 1137. [Google Scholar] [CrossRef]
- Zhou, T. Object-Oriented Land Cover Classification Using High Spatial Resolution Remote Sensing. Geomat. Sci. Technol. 2020, 8, 9–16. [Google Scholar] [CrossRef]
- Jin, B.; Ye, P.; Zhang, X.; Song, W.; Li, S. Object-Oriented Method Combined with Deep Convolutional Neural Networks for Land-Use-Type Classification of Remote Sensing Images. J. Indian Soc. Remote Sens. 2019, 47, 951–965. [Google Scholar] [CrossRef]
- Tan, Q.; Guo, B.; Hu, J.; Dong, X.; Hu, J. Object-Oriented Remote Sensing Image Information Extraction Method Based on Multi-Classifier Combination and Deep Learning Algorithm. Pattern Recogn. Lett. 2020, 141, 32–36. [Google Scholar] [CrossRef]
- Zhao, F.; Wu, X.; Wang, S. Object-oriented Vegetation Classification Method based on UAV and Satellite Image Fusion. Procedia Comput. Sci. 2020, 174, 609–615. [Google Scholar] [CrossRef]
- Mars, J.C.; Rowan, L.C. Spectral assessment of new ASTER SWIR surface reflectance data products for spectroscopic mapping of rocks and minerals. Remote Sens. Environ. 2010, 114, 2011–2025. [Google Scholar] [CrossRef]
- Li, H.; Chen, Y.; Zhang, Z.; Wu, H.; Liu, Z. Planting Structure Changes of the Main Crops in Heilongjiang Province Based on Long Time Series MODIS Images. J. Hangzhou Norm. Univ. 2021, 20, 658–665. [Google Scholar]
- Deng, S. ENVI Remote Sensing Image Processing Method; Science Press: Beijing, China, 2010. [Google Scholar]
- Hao, Y.; Chen, Z.; Hou, R.; Wang, B. Spatiotemporal Information Extraction of Agricultural Land Occupied by Construction Based on Time Series of Remote Sensing. Resour. Environ. Yangtze Basin 2021, 30, 371–381. [Google Scholar]
- Murakami, T.; Ogawa, S.; Ishitsuka, N.; Kumagai, K.; Saito, G. Crop discrimination with multitemporal SPOT/HRV data in the Saga Plains, Japan. Int. J. Remote Sens. 2001, 22, 1335–1348. [Google Scholar] [CrossRef]
- Chen, S.; Zhao, Y.; Shen, S. Crop classification by remote sensing based on spectral analysis. Trans. Chin. Soc. Agric. Eng. 2012, 28, 154–160. [Google Scholar]
- Wen, C.; Lu, M.; Song, Q.; Cheng, R.; Zhang, S. A comparative analysis of feature extraction and classifiers for crop classification based on time series data. China Agric. Inf. 2021, 33, 1–16. [Google Scholar]
- Chao, Z.; Che, M.; Hou, S. Brief review of vegetation phenological information extraction software based on time series remote sensing data. Remote Sens. Nat. Resour. 2021, 33, 19–25. [Google Scholar]
- Pan, L.; Xia, H.; Zhao, X.; Guo, Y.; Qin, Y. Mapping Winter Crops Using a Phenology Algorithm, Time-Series Sentinel-2 and Landsat-7/8 Images, and Google Earth Engine. Remote Sens. 2021, 13, 2510. [Google Scholar] [CrossRef]
- Zhou, L.; Zhou, W.; Chen, J.; Xu, X.; Wang, Y.; Zhuang, J.; Chi, Y. Land surface phenology detections from multi-source remote sensing indices capturing canopy photosynthesis phenology across major land cover types in the Northern Hemisphere. Ecol. Indic. 2022, 135, 108579. [Google Scholar] [CrossRef]
- Su, R.; Xiong, Q.; Geng, Y.; Liu, K.; Gao, H.; Jin, W. Multi temporal hj-ccd image monitoring of cotton and medium rice planting area in the south of Jianghan Plain. Resour. Environ. Yangtze Basin 2013, 22, 1441–1448. [Google Scholar]
- Cui, L.; Shi, J.; Du, H. Advances in Remote Sensing Extraction of Vegetation Phenology and Its Driving Factors. Adv. Earth Sci. 2021, 36, 9–16. [Google Scholar]
- Wardlow, B.; Egbert, S.; Kastens, J. Analysis of time-series MODIS 250 m vegetation index data for crop classification in the U.S. Central Great Plains. Remote Sens. Environ. 2007, 108, 290–310. [Google Scholar] [CrossRef]
- Zhang, J.; Zhao, G.; Hong, Y.; Sun, Z.; Duan, Y. Spatial extraction of winter wheat in Hebei in growing season using pixel-wise phenological curve. Trans. Chin. Soc. Agric. Eng. 2020, 36, 193–200. [Google Scholar]
- Jakubauskas, M.E.; Legates, D.R.; Kastens, J.H. Crop identification using harmonic analysis of time-series AVHRR NDVI data. Comput. Electron. Agric. 2002, 37, 127–139. [Google Scholar] [CrossRef]
- Castillejo-González, I.L.; López-Granados, F.; García-Ferrer, A.; Peña-Barragán, J.M.; Jurado-Expósito, M.; de la Orden, M.S.; González-Audicana, M. Object- and pixel-based analysis for mapping crops and their agro-environmental associated measures using QuickBird imagery. Comput. Electron. Agric. 2009, 68, 207–215. [Google Scholar] [CrossRef]
- Le Toan, T.; Ribbes, F.; Wang, L.; Floury, N.; Ding, K.; Kong, J.A.; Fujita, M.; Kurosu, T. Rice crop mapping and monitoring using ERS-1 data based on experiment and modeling results. IEEE Trans. Geosci. Remote Sens. 1997, 35, 41–56. [Google Scholar] [CrossRef]
- Townshend, J.; Justice, C.; Li, W.; Gurney, C.; McManus, J. Global land cover classification by remote sensing: Present capabilities and future possibilities. Remote Sens. Environ. 1991, 35, 243–255. [Google Scholar] [CrossRef]
- Wessels, K. Mapping regional land cover with MODIS data for biological conservation: Examples from the Greater Yellowstone Ecosystem, USA and Para State, Brazil. Remote Sens. Environ. 2004, 92, 67–83. [Google Scholar] [CrossRef]
- D’Este, M.; Elia, M.; Giannico, V.; Spano, G.; Lafortezza, R.; Sanesi, G. Machine Learning Techniques for Fine Dead Fuel Load Estimation Using Multi-Source Remote Sensing Data. Remote Sens. 2021, 13, 1658. [Google Scholar] [CrossRef]
- Kerdiles, H.; Grondona, M.O. NOAA-AVHRR NDVI decomposition and subpixel classification using linear mixing in the Argentinean Pampa. Int. J. Remote Sens. 1995, 16, 1303–1325. [Google Scholar] [CrossRef]
- Xu, W.; Zhang, G.; Fan, J.; Qian, Y. Remote sensing monitoring of winter wheat areas using MODIS data. Trans. Chin. Soc. Agric. Eng. 2007, 23, 144–149. [Google Scholar]
- Jing, Y.; Li, G.; Huang, W. Area estimation of double cropping rice based on similarity analysis and linear spectral mixture model. Trans. Chin. Soc. Agric. Eng. 2013, 29, 177–183. [Google Scholar]
- Potapov, P.; Hansen, M.C.; Stehman, S.V.; Loveland, T.R.; Pittman, K. Combining MODIS and Landsat imagery to estimate and map boreal forest cover loss. Remote Sens. Environ. 2008, 112, 3708–3719. [Google Scholar] [CrossRef]
- Gu, X.H.; Pan, Y.Z.; Zhu, X.F.; Zhang, J.S.; Han, L.J.; Wang, S. Consistency Study between MODIS and TM on Winter Wheat Plant Area Monitoring—A Case in Small Area. J. Remote Sens. 2007, 11, 350–358. [Google Scholar]
- Verbeiren, S.; Eerens, H.; Piccard, I.; Bauwens, I.; Van Orshoven, J. Sub-pixel classification of spot-vegetation time series for the assessment of regional crop areas in Belgium. Int. J. Appl. Earth Obs. 2008, 10, 486–497. [Google Scholar] [CrossRef]
- Pan, Y.Z.; Li, L.; Zhang, J.; Liang, S.; Hou, D. Crop area estimation based on MODIS-EVI time series according to distinct characteristics of key phenology phases: A case study of winter wheat area estimation in small-scale area. J. Remote Sens. 2011, 15, 578–594. [Google Scholar]
- Li, Y.; Chen, X.W.; Duan, H.W.; Shen, Y. Application of Multi-source and Multi-temporal Remote Sensing Data in Winter Wheat Identification. Geogr. Geo-Inf. Sci. 2010, 26, 47–49. [Google Scholar]
- Lanjeri, S.; Melia, J.; Segarra, D. A multi-temporal masking classification method for vineyard monitoring in central Spain. Int. J. Remote Sens. 2001, 22, 3167–3186. [Google Scholar] [CrossRef]
- Cai, X.; Cui, Y. Crop planting structure extraction in irrigated areas from multi-sensor and multi-temporal remote sensing data. Trans. Chin. Soc. Agric. Eng. 2009, 25, 124–130. [Google Scholar]
- Gu, X.; Han, L.; Wang, J.; Huang, W.; He, X. Estimation of maize planting area based on wavelet fusion of multi-resolution images. Trans. Chin. Soc. Agric. Eng. 2012, 28, 203–209. [Google Scholar]
- Huang, H.; Gao, Z. The Extraction of Multiple Cropping Index of China Based on NDVI Time-Series; SPIE: Bellingham, WA, USA, 2011; p. 81560Z. [Google Scholar]
- Chen, D.; Wu, W.; Lu, M.; Hu, Q.; Zhou, Q. Review on research progress of surface coverage data reconstruction based on multi-source data fusion. Chin. J. Agric. Resour. Reg. Plan. 2016, 37, 62–70. [Google Scholar]
- Wang, L.; Qi, F.; Shen, X.; Huang, J. Monitoring Multiple Cropping Index of Henan Province, China Based on MODIS-EVI Time Series Data and Savitzky-Golay Filtering Algorithm. Comput. Model. Eng. Sci. 2019, 119, 331–348. [Google Scholar] [CrossRef]
- Wang, L.; Lu, Y.; Li, Q.; Hu, Z.; Wu, D.; Zhang, Y.; Wang, T. Spatio-temporal analysis of winter wheat yield gaps in Henan Province using AEZ model. Chin. J. Eco-Agric. 2018, 26, 547–558. [Google Scholar]
- Xie, J.; Cai, Y.; Zheng, Z. AEZ-based Assessment for Food Productivity Potential of Cultivated Land in China. China Land. Sci. 2004, 18, 31–37. [Google Scholar]
- Hatfield, J.L.; Dold, C. Agroclimatology and Wheat Production: Coping with Climate Change. Front. Plant. Sci. 2018, 9, 224. [Google Scholar] [CrossRef]
- Středa, T.; Středová, H.; Chuchma, F.; Kučera, J.; Rožnovský, J. Smart method of agricultural drought regionalization: A winter wheat case study. Contrib. Geophys. Geod. 2019, 49, 25–36. [Google Scholar] [CrossRef]
- Aigner, D.; Lovell, C.A.K.; Schmidt, P. Formulation and estimation of stochastic frontier production function models. J. Econom. 1977, 6, 21–37. [Google Scholar] [CrossRef]
- Meeusen, W.; Van den Broeck, J. Corrigendum: Efficiency Estimation from Cobb-Douglas Production Functions with Composed Error. Int. Econ. Rev. 1977, 18, 790. [Google Scholar] [CrossRef]
- Zuo, L.J.; Zhang, Z.X.; Dong, T.T.; Wang, X. Progress in the Research on the Multiple Cropping Index. J. Nat. Resour. 2009, 24, 553–560. [Google Scholar]
- Tang, P.; Yao, Y.; Wu, W.; Yang, P. Research progress of cultivated land multiple cropping index based on Remote Sensing Technology. Chin. J. Agric. Resour. Reg. Plan. 2010, 31, 21–27. [Google Scholar]
- Gu, X.H.; Yu, Y.C.; Wang, K.; Yang, F.; Huang, W.J. Monitoring the Pattern of Crop Rotation through Remote Sensing. China Land Sci. 2011, 25, 68–74. [Google Scholar]
- Peng, G.; Hu, D.; Chen, F. Evaluation of flue-cured tobacco planting suitability and crop rotation planning based on spatial information. Geogr. Res. 2010, 29, 873–882. [Google Scholar]
- Jayanth, J.; Aravind, R.; Amulya, C.M. Classification of Crops and Crop Rotation Using Remote Sensing and GIS-Based Approach: A Case Study of Doddakawalande Hobli, Nanjangudu Taluk. J. Indian Soc. Remote Sens. 2021, 50, 197–215. [Google Scholar] [CrossRef]
- Waldhoff, G.; Lussem, U.; Bareth, G. Multi-Data Approach for remote sensing-based regional crop rotation mapping: A case study for the Rur catchment, Germany. ITC J. 2017, 61, 55–69. [Google Scholar] [CrossRef]
- Sun, L.; Zhu, Z.S. A Model for Management of Large-Area Crop Rotation. Appl. Mech. Mater. 2014, 496–500, 2775–2778. [Google Scholar] [CrossRef]
- Ekepu, D.; Tirivanhu, P. Assessing socio-economic factors influencing adoption of legume-based multiple cropping systems among smallholder sorghum farmers in Soroti, Uganda. S. Afr. J. Agric. Ext. SAJAE 2016, 44, 195–215. [Google Scholar] [CrossRef][Green Version]
- Len, B.; Ren, J.; Guo, J. Research on the influence of crop seed subsidy on Farmers’ planting decision—Based on the experience of 208 wheat farmers in Shandong, Henan and Hebei. Res. Financ. Econ. Issues 2012, 6, 124–129. [Google Scholar]
- Wu, W.; Yang, P.; Shibasaki, R.; Tang, H.J.; Chen, Z.X. Agent-Based Model for Land-Use/Cover Change: A Review. Sci. Geogr. Sin. 2007, 27, 573–578. [Google Scholar]
- Overmars, K.P.; Verburg, P.H.; Veldkamp, T.A. Comparison of a deductive and an inductive approach to specify land suitability in a spatially explicit land use model. Land Use Policy 2007, 24, 584–599. [Google Scholar] [CrossRef]
- Yu, Q.; Wu, W.; Tang, H.; Yang, P.; Li, Z.; Xia, T.; Liu, Z.; Zhou, Q. Simulation model framework of crop spatial pattern change based on Farmers’ behavior. Sci. Agric. Sin. 2013, 46, 3266–3276. [Google Scholar]
- Yu, Q.; Wu, W.; Chen, Y.; Yang, P.; Meng, C.; Zhou, Q.; Tang, H. Model application of an agent-based model for simulating crop pattern dynamics at regional scale based on MATLAB. Trans. Chin. Soc. Agric. Eng. 2014, 30, 105–114. [Google Scholar]
- Yu, Q.; Wu, W.; Yang, P.; Tang, H.; Zhou, Q.; Chen, Z. Progress of agent-based agricultural land change modeling: A review. Acta Ecol. Sin. 2013, 33, 1690–1700. [Google Scholar]
- Grimm, V.; Revilla, E.; Berger, U.; Jeltsch, F.; Mooij, W.M.; Railsback, S.F.; Thulke, H.; Weiner, J.; Wiegand, T.; DeAngelis, D.L. Pattern-Oriented Modeling of Agent-Based Complex Systems: Lessons from Ecology. Sci. Am. Assoc. Adv. Sci. 2005, 310, 987–991. [Google Scholar] [CrossRef]
- Peng, J.; Wu, H.; Song, J.; Li, M. Impact of agricultural mechanization level on farmers’ cropping index in Hubei Province. Chin. J. Eco-Agric. 2019, 27, 380–390. [Google Scholar]
- Veldkamp, A. Investigating land dynamics: Future research perspectives. J. Land Use Sci. 2009, 4, 5–14. [Google Scholar] [CrossRef]
- Liang, J.; Xie, Y.; Sha, Z.; Zhou, A. Modeling urban growth sustainability in the cloud by augmenting Google Earth Engine (GEE). Comput. Environ. Urban. Syst. 2020, 84, 101542. [Google Scholar] [CrossRef]
- Hao, B.; Han, X.; Ma, M.; Liu, Y.; Li, S. Research Progress on the Application of Google Earth Engine in Geoscience and Environmental Sciences. Remote Sens. Technol. Appl. 2018, 33, 600–611. [Google Scholar]
- Tamiminia, H.; Salehi, B.; Mahdianpari, M.; Quackenbush, L.; Adeli, S.; Brisco, B. Google Earth Engine for geo-big data applications: A meta-analysis and systematic review. ISPRS J. Photogramm. 2020, 164, 152–170. [Google Scholar] [CrossRef]
- Tan, S.; Wu, B.; Zhang, X. Mapping Paddy Rice in the Hainan Province Using both Google Earth Engine and Remote Sensing Images. J. Geo-Inf. Sci. 2019, 6, 937–947. [Google Scholar]
- Silva Junior, C.A.D.; Leonel-Junior, A.H.S.; Rossi, F.S.; Correia Filho, W.L.F.; Santiago, D.D.B.; Oliveira-Júnior, J.F.D.; Teodoro, P.E.; Lima, M.; Capristo-Silva, G.F. Mapping soybean planting area in midwest Brazil with remotely sensed images and phenology-based algorithm using the Google Earth Engine platform. Comput. Electron. Agric. 2020, 169, 105194. [Google Scholar] [CrossRef]
- Inoue, S.; Ito, A.; Yonezawa, C. Mapping Paddy Fields in Japan by Using a Sentinel-1 SAR Time Series Supplemented by Sentinel-2 Images on Google Earth Engine. Remote Sens. 2020, 12, 1622. [Google Scholar] [CrossRef]
- An, Y.; Tan, X.; Tan, J.; Yu, H.; Wang, Z.; Li, W. Evolution of Crop Planting Structure in Traditional Agricultural Areas and Its Influence Factors: A Case Study in Hunan Province. Econ. Geogr. 2021, 41, 156–166. [Google Scholar]
- Böhler, J.E.; Schaepman, M.E.; Kneubühler, M. Crop Classification in a Heterogeneous Arable Landscape Using Uncalibrated UAV Data. Remote Sens. 2018, 10, 1282. [Google Scholar] [CrossRef]
- Harfenmeister, K.; Spengler, D.; Weltzien, C. Analyzing Temporal and Spatial Characteristics of Crop Parameters Using Sentinel-1 Backscatter Data. Remote Sens. 2019, 11, 1569. [Google Scholar] [CrossRef]
- Wei, L.; Yu, M.; Liang, Y.; Yuan, Z.; Huang, C.; Li, R.; Yu, Y. Precise Crop Classification Using Spectral-Spatial-Location Fusion Based on Conditional Random Fields for UAV-Borne Hyperspectral Remote Sensing Imagery. Remote Sens. 2019, 11, 2011. [Google Scholar] [CrossRef]
- Zhang, P.; Hu, S.; Li, W.; Zhang, C. Parcel-level mapping of crops in a smallholder agricultural area: A case of central China using single-temporal VHSR imagery. Comput. Electron. Agric. 2020, 175, 105581. [Google Scholar] [CrossRef]
- Teixeira, E.; Kersebaum, K.C.; Ausseil, A.; Cichota, R.; Guo, J.; Johnstone, P.; George, M.; Liu, J.; Malcolm, B.; Khaembah, E.; et al. Understanding spatial and temporal variability of N leaching reduction by winter cover crops under climate change. Sci. Total Environ. 2021, 771, 144770. [Google Scholar] [CrossRef]
- Paixão, J.S.; Casaroli, D.; dos Anjos, J.C.R.; Alves Júnior, J.; Evangelista, A.W.P.; Dias, H.B.; Battisti, R. Optimizing Sugarcane Planting Windows Using a Crop Simulation Model at the State Level. Int. J. Plant. Prod. 2021, 15, 303–315. [Google Scholar] [CrossRef]
- Hoffmann, M.P.; Swanepoel, C.M.; Nelson, W.C.D.; Beukes, D.J.; van der Laan, M.; Hargreaves, J.N.G.; Rötter, R.P. Simulating medium-term effects of cropping system diversification on soil fertility and crop productivity in southern Africa. Eur. J. Agron. 2020, 119, 126089. [Google Scholar] [CrossRef]
- Araya, A.; Prasad, P.V.V.; Gowda, P.H.; Djanaguiramana, M.; Gebretsadkan, Y. Modeling the effects of crop management on food barley production under a midcentury changing climate in northern Ethiopia. Clim. Risk Manag. 2021, 32, 100308. [Google Scholar] [CrossRef]
- Li, R.; Wei, C.; Afroz, M.D.; Lyu, J.; Chen, G. A GIS-based framework for local agricultural decision-making and regional crop yield simulation. Agric. Syst. 2021, 193, 103213. [Google Scholar] [CrossRef]
- Asma, F.; Kumar, Y.R.; Bilal, A.L.; Sandeep, K.; Dar, Z.A.; Faisal, R.; Ishfaq, A.; Fouzea, N.; Anil, K. Crop Simulation Models: A Tool for Future Agricultural Research and Climate Change. Asian J. Agric. Ext. Econ. Sociol. 2021, 146–154. [Google Scholar] [CrossRef]
- Kim, J.; Park, J.Y.; Hyun, S.; Yoo, B.H.; Fleisher, D.H.; Kim, K.S. Development of an orchestration aid system for gridded crop growth simulations using Kubernetes. Comput. Electron. Agric. 2021, 186, 106187. [Google Scholar] [CrossRef]
- De Oliveira, F.S.C.; Lilla, M.R.; Albuquerque, F.J. Large-Scale Spatial Modeling of Crop Coefficient and Biomass Production in Agroecosystems in Southeast Brazil. Horticulturae 2018, 4, 44. [Google Scholar] [CrossRef]


| Criteria | Details |
|---|---|
| TS | TS = (“crop spatial pattern”) or TS = (“multiple cropping system” or “multiple cropping index”) or TS = (“crop acreage” or “crop planting area” or “crop area”) or TS = (“cropping pattern” or “crop rotation pattern” or “single cropping” or “sequential cropping” or “intercropping”) |
| Languages | ‘All language’ |
| Document types | ‘All document types’ |
| Period | ‘2005–2020’ |
| Database | ‘Web of Science Core CollectionTM’ |
| Smoothing Method | Advantages | Disadvantages |
|---|---|---|
| Fourier transform |
|
|
| S g filtering |
|
|
| Asymmetric Gaussian function fitting | It can clearly describe the long-term change trend and local mutation information of the vegetation index in time series. |
|
| Wavelet transform |
|
|
| Platform | Country | Dataset | API | WebSite |
|---|---|---|---|---|
| Google earth engine (GEE) | U.S.A. | Remote sensing image, terrain data, land cover, weather, precipitation and atmospheric data, population data and some vector data | JavaScript Python | www.earthengine.google.com (5 June 2021) |
| NASA Earth Exchange (NEX) | U.S.A. | MODIS, Landset, VIIRS, GOES, Sentinel-2, etc. | MATLAB, IDL | www.nasa.gov/nex (5 June 2021) |
| Descartes Labs | U.S.A. | Remote sensing image, meteorological data, elevation, geographical location, land use data | Python | www.descarteslabs.com (5 June 2021) |
| AWS | Australia | Landset | C++, Go, Java, JavaScript, .NET, Node.js, PHP, Python, Ruby | www.aws.amazon.com/cn/earth (5 June 2021) |
| Data Cube | Germany | Landset, Sentinel, MODIS, elevation data, vegetation cover, land cover | Python | www.opendatacube.org (5 June 2021) |
| CODE-DE | China | Sentinel, Landset, land cover | Python | www.code-de.org (5 June 2021) |
| Earth Data Miner | China | Sentinel, Landset, land cover, bio ecological data, atmospheric ocean data, basic geographic data and ground observation data, stratigraphy and paleontology data, China biological species list, microbial resources data and omics data | Python | www.earthdataminer.casearth.cn (5 June 2021) |
| PIE-Engine | China | Landset, Sentinel | JavaScript | www.engine.piesat.cn (5 June 2021) |
Publisher’s Note: MDPI stays neutral with regard to jurisdictional claims in published maps and institutional affiliations. |
© 2022 by the authors. Licensee MDPI, Basel, Switzerland. This article is an open access article distributed under the terms and conditions of the Creative Commons Attribution (CC BY) license (https://creativecommons.org/licenses/by/4.0/).
Share and Cite
Xiao, P.; Qian, P.; Xu, J.; Lu, M. A Bibliometric Analysis of the Application of Remote Sensing in Crop Spatial Patterns: Current Status, Progress and Future Directions. Sustainability 2022, 14, 4104. https://doi.org/10.3390/su14074104
Xiao P, Qian P, Xu J, Lu M. A Bibliometric Analysis of the Application of Remote Sensing in Crop Spatial Patterns: Current Status, Progress and Future Directions. Sustainability. 2022; 14(7):4104. https://doi.org/10.3390/su14074104
Chicago/Turabian StyleXiao, Pengnan, Peng Qian, Jie Xu, and Mengyao Lu. 2022. "A Bibliometric Analysis of the Application of Remote Sensing in Crop Spatial Patterns: Current Status, Progress and Future Directions" Sustainability 14, no. 7: 4104. https://doi.org/10.3390/su14074104
APA StyleXiao, P., Qian, P., Xu, J., & Lu, M. (2022). A Bibliometric Analysis of the Application of Remote Sensing in Crop Spatial Patterns: Current Status, Progress and Future Directions. Sustainability, 14(7), 4104. https://doi.org/10.3390/su14074104