Article

A Study on the Adsorption Characteristics of Thiourea by Typical Minerals from the Bio-Oxidation Residue of Gold Ore

1
National Engineering Research Center for Environment-Friendly Metallurgy in Producing Premium Non-Ferrous Metals, GRINM Resources and Environmental Technology Corporation Limited, Beijing 101407, China
2
General Research Institute for Nonferrous Metals, Beijing 100088, China
3
GRIMAT Engineering Institute Co., Ltd., Beijing 101407, China
*
Author to whom correspondence should be addressed.
Minerals 2022, 12(4), 421; https://doi.org/10.3390/min12040421
Submission received: 20 February 2022 / Revised: 15 March 2022 / Accepted: 15 March 2022 / Published: 30 March 2022
(This article belongs to the Section Mineral Processing and Extractive Metallurgy)

Abstract

:
In order to improve the thiourea gold leaching rate of a low-grade arsenic–sulfur-containing refractory gold ore in Xinjiang, a microbial pretreatment was used to oxidize pyrite and arsenopyrite to obtain a bio-oxidation residue. The main minerals were quartz, mica, and some sulfides that were not fully oxidized. In this study, the static adsorption method was applied to simulate the thiourea adsorption by typical minerals. The results showed that the amount of thiourea adsorbed by the three minerals could be ordered as follows: pyrite > mica > quartz. Quartz had hardly any adsorption of thiourea. The thiourea adsorption capacities of pyrite and mica were about 8.93 mg g−1 and 2.30 mg g−1, respectively. The adsorption process for pyrite conformed to the Freundlich isotherm equation and pseudo-second-order kinetic model, indicating that the adsorption process was a monolayer chemisorption. The adsorption process for mica conformed to the Langmuir isotherm equation and pseudo-second-order kinetic model, indicating that the adsorption process was a monolayer physical adsorption. Fourier transform infrared spectroscopy showed that the adsorption of thiourea on the surface of mica relied on the formation of hydrogen bonds with Si-OH, whereas a new S-S peak was detected on the surface of pyrite, which further indicated that thiourea was chemically adsorbed on the surface of pyrite.

1. Introduction

Thiourea (TU) has been widely discussed for a long time as a non-cyanide reagent for use in precious metal leaching due to its effectiveness in processing some ores, which are refractory to cyanidation and rapid leaching kinetics [1,2,3]. The leaching process can take place in both acidic and alkaline solutions, but due to high consumption in the latter, the pH value is usually less than 2 [4,5]. In the presence of O2 and Fe3+, thiourea and gold can form a stable complex involving Au(TU)2+, as shown below [6].
Au + 2 SC ( NH 2 ) 2 + 0.25 O 2 + H + = Au [ SC ( NH 2 ) 2 ] 2 + + 0.5 H 2 O
Au + 2 SC ( NH 2 ) 2 + Fe 3 + = Au [ SC ( NH 2 ) 2 ] 2 + + Fe 2 +
However, strong oxidizing agents, such as Fe3+ and H2O2, can also lead to high thiourea consumption [7]. The first oxidation product of thiourea is formamidine disulfide, FDS, which is a result of a reversible reaction. Then, in the next oxidation product, FDS can irreversibly decompose to cyanamide and elemental sulfur, according to the reactions:
2TU DS Cyanamide + S 0
The oxidation of thiourea implies more loss of the reagent in the leaching process. The newly generated elemental sulfur can attach to the mineral surface to form a passivation layer, which reduces the gold leaching rate [8,9]. In view of the consumption of thiourea, in addition to the oxidation loss [10,11,12], some scholars have proposed that the loss is related to impurity ion coordination and mineral adsorption. Further study is necessary, because there is still a lack of quantitative research on this topic [13].
With the continuous consumption of high-grade and easily treatable ores, extraction from refractory gold ores has gradually come into prominence [14,15]. The gold in refractory deposits usually occurs in the lattice of pyrite and arsenopyrite in the form of fine particles, and it is difficult for it to come into contact with the leaching agent [16,17,18]. Therefore, to extract gold more easily from refractory gold ores, pretreatment methods, including roasting, chemical oxidation, pressure oxidation, and biological oxidation, can be used to destroy the sulfide lattice.
Bio-oxidation is a technique based on the behavior of bacteria. The microorganisms used in microbial oxidation include Acidithiobacillus, Sulfobacillus, and Leptospirillum. These microorganisms can oxidize Fe2+ and sulfur into Fe3+, H+, and SO42− under acidic conditions and further dissolve metal sulfides in this way [19]. Compared with other methods, bio-oxidation has the advantages of low cost, low equipment requirements, low energy consumption, and environmental friendliness [20,21].
Recently, our laboratory research group proposed a combined process of bio-oxidation followed by thiourea leaching to treat a low-grade refractory gold deposit in Xinjiang. The original gold-bearing sample was identified as a high-sulfur–arsenic fine-sized wrapped-type refractory gold ore. After the bio-oxidation pretreatment, the oxidation rates of the sulfide and arsenic minerals were 80.3% and 41.0%, respectively. The results of the phase analysis showed that the silicate mineral content in the residue was more than 90%, the sulfide mineral content was less than 4%, and the remaining part constituted the other minerals. The gold leaching rate of the residue reached 97.8% under optimal conditions, in which the temperature was 303 K, the pH was 1.5, the thiourea concentration was 25 kg t−1, and the leaching time was 5 h [22].
There are some advantages to the use of the combined process. After the biological oxidation pretreatment, acidic thiourea was used to leach the gold without an acid-base conversion, which led to a great loss of time and money in the cyanide leaching process. In addition, ferric ions, the products of the bio-oxidation process, were used as the oxidants for thiourea gold leaching to improve the leaching efficiency. However, under acidic conditions, thiourea leaching also had some shortcomings, such as high consumption of the reagent. Recently, many scholars have studied the oxidative decomposition loss of thiourea, but few have mentioned the adsorption loss. Therefore, this article focuses on the adsorption of thiourea on the typical mineral quartz, mica, and pyrite of the bio-oxidation residue. The adsorption of thiourea is quantitatively investigated to provide guidance for reducing thiourea consumption in practical applications.

2. Materials and Methods

2.1. Materials and Equipments

Thiourea (TU, supplied by Fuchen Chemical Co., Ltd., Tianjin, China) and sulfuric acid (H2SO4, supplied by Beijing Chemical Factory, Beijing, China) were both of analytical grade. Quartz and mica were purchased from Ye’s Stone Specimen Firm (Guangdong, China). Pyrite was supplied by Zijin Mining Group Co., Ltd. (Fujian, China). The solution’s pH was tested using an Origin 3-Star pH Meter. The liquid and solid were separated by a vacuum filter (BK/ZL-Φ260/Φ200, Wuhan New Materials Industry Park, Wuhan, China). The concentration of thiourea in the solution was determined by a UV spectrophotometer (TU-1800, Beijing Purkinje General Instrument Co., Ltd., Beijing, China). The FTIR transmission spectra were recorded in the range of 400–4000 cm−1 on a Fourier transform spectrometer (Perkin Elmer Frontier, Shiyanjia Lab., Beijing, China).

2.2. Sample Preparation

Quartz, mica, and pyrite were ground by mortar and sieved to obtain mineral samples, over 90% of which had a particle size of −0.074 mm. Before the experiment, the three kinds of minerals were washed with a diluted sulfuric acid with a pH of 3.0 and then washed with deionized water 4–5 times, filtered by a vacuum extraction filter, and dried naturally.

2.3. Detection of the Thiourea Concentration

Standard thiourea solutions with a concentration of 0.25 × 10⁻² g L−1, 0.50 × 10⁻² g L−1, 1.00 × 10⁻² g L−1, 1.50 × 10⁻² g L−1, and 2.00 × 10⁻² g L−1 were prepared with deionized water. The absorbance (A) of the thiourea solution was measured at a wavelength of λ = 236 nm using a TU-1810 UV spectrophotometer (this measurement referred to the absorbance of deionized water), and the regression equation between (A) and the thiourea concentration (C) was established: A = 0.9964C + 0.0394, R2 = 0.9993.

2.4. Adsorption Experiment

A total of 100 mL of thiourea solution with a certain initial concentration was prepared in a 250 mL conical flask, and the pH value of the solution was adjusted with concentrated sulfuric acid, as required. Then, 5.0 g mineral samples were added, covered with rubber plugs, and placed in a constant temperature shaker at a rotational speed of 150 r min−1. Then, they were shaken at 303 K for a period of time and filtered through a filter membrane with a pore size of 0.22 um. The filtrate was diluted, and the absorbance was measured at λ = 236 nm to calculate the thiourea concentration.
According to the obtained data, the adsorption capacity of the minerals was calculated according to Equation (1) [23].
Q t = V ( C 0 C t ) m
where Qt is the adsorption capacity of thiourea on the minerals (mg g−1); C0 is the initial concentration of thiourea (mg L−1); Ct is the concentration of thiourea at t moment (mg L−1); V is the volume of the solution (L); and m represents the mass of mineral samples after adding (g).

2.5. Infrared Spectroscopy Detection

The infrared spectrum of mica, quartz, and pyrite before and after the interaction with thiourea was detected by a Fourier transform infrared spectrometer (Perkin Elmer Frontier, Shiyanjia Lab., Beijing, China) using KBr pellets after vacuum drying. The wave number was in the range of 400–4000 cm−1.

3. Results and Discussion

3.1. Effect of the Adsorption Time
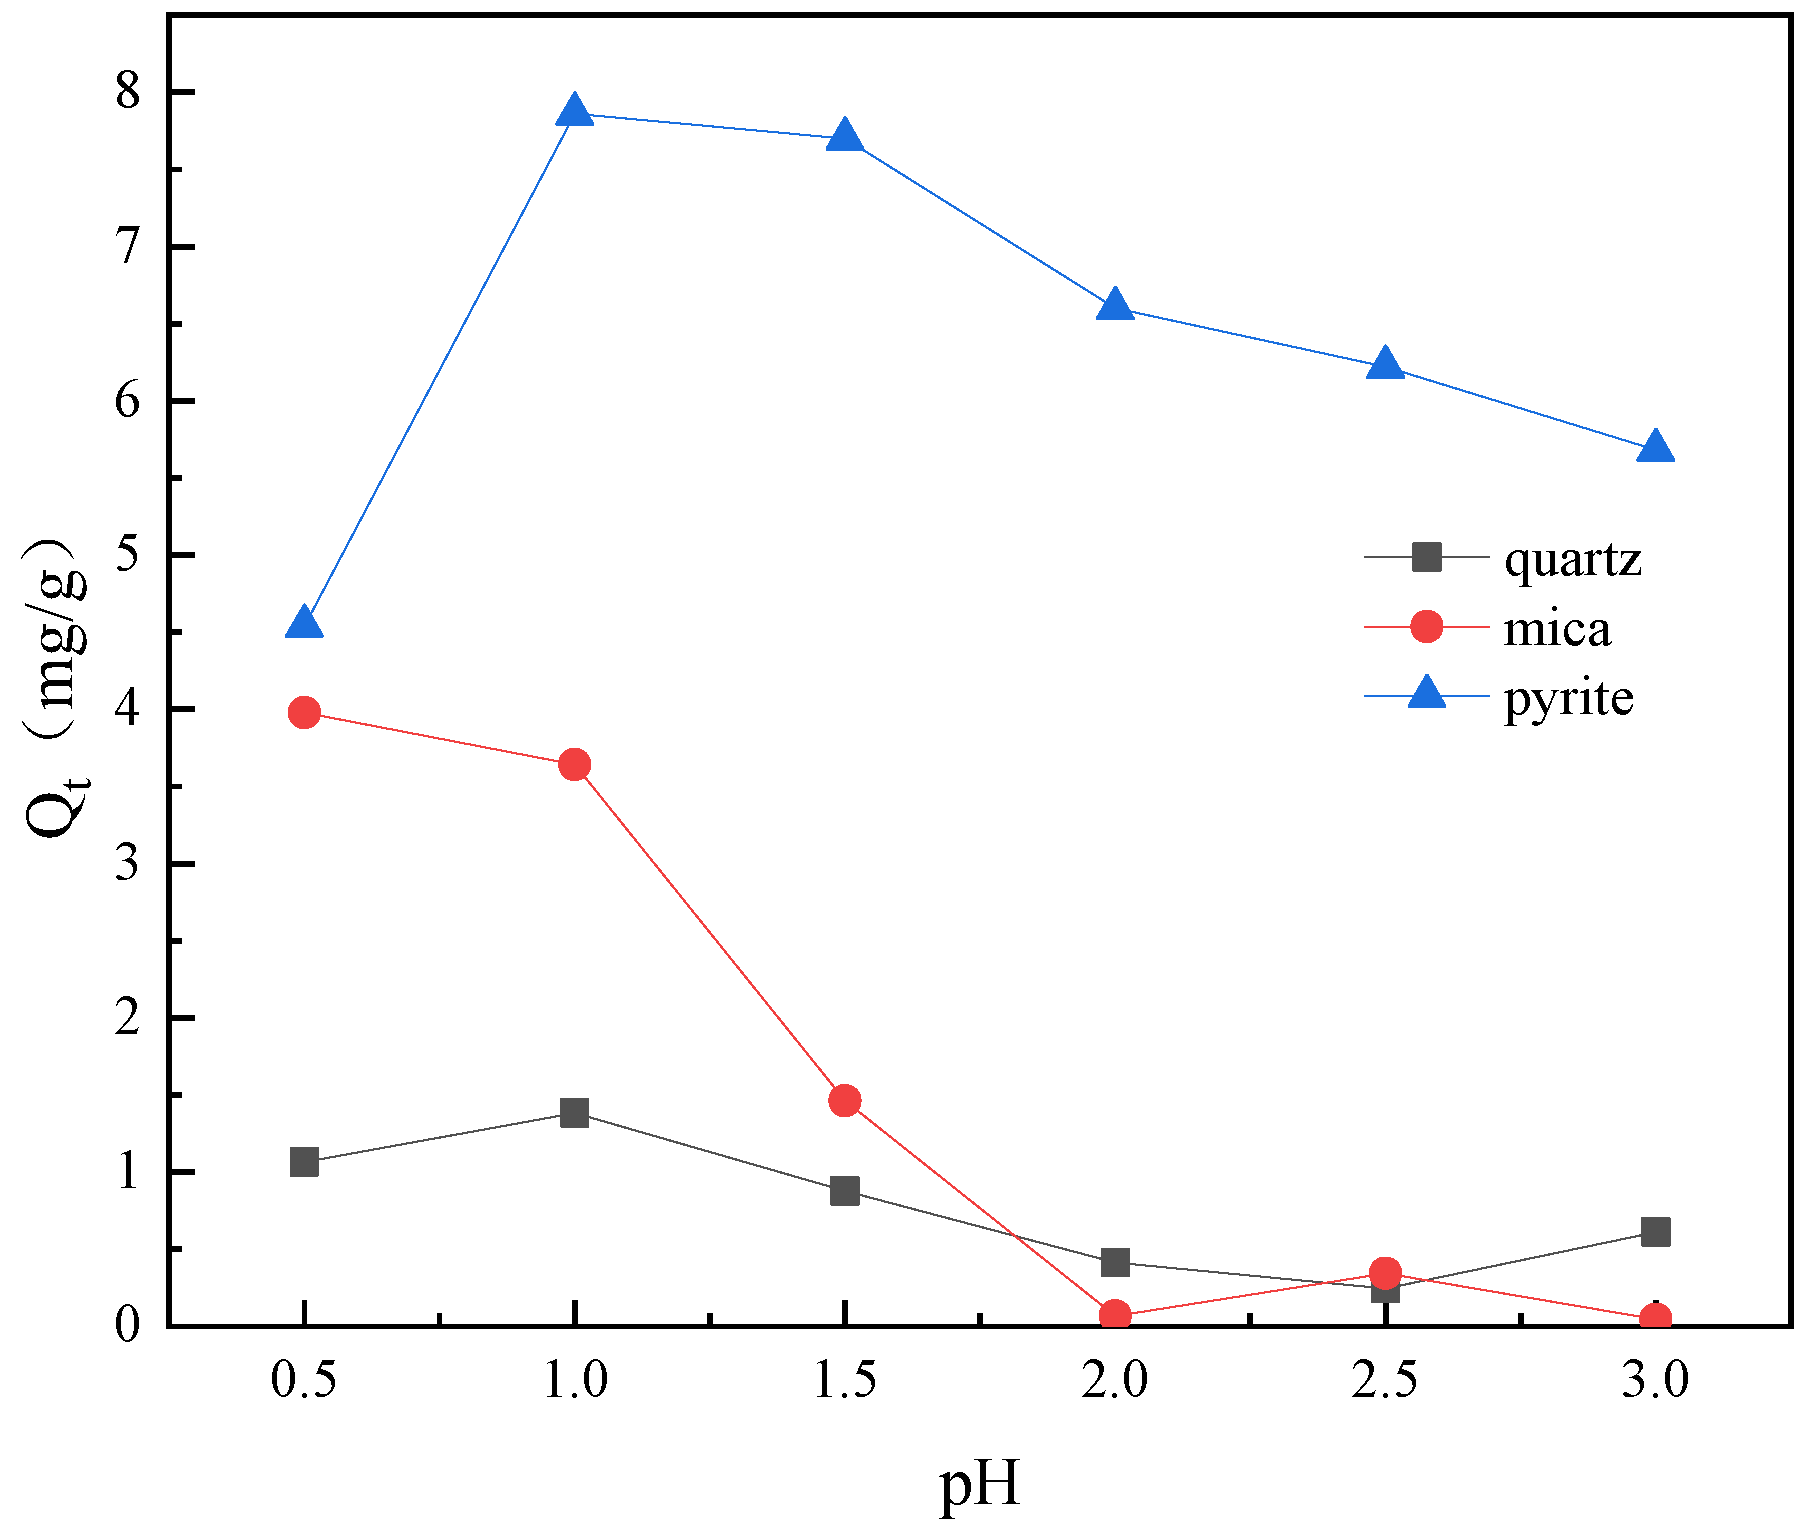
Figure 1 shows the effect of the adsorption time of the thiourea on quartz, mica, and pyrite at 303 K when the initial thiourea concentration was 1.0 g L−1 and the pH value of the thiourea solution was 1.5. It is apparent from Figure 1 that the adsorption capacity of thiourea on the three minerals is different. Pyrite has the largest adsorption capacity for thiourea, followed by mica, and the next is quartz, which almost does not adsorb thiourea. With an increasing adsorption time, the thiourea adsorption capacity of pyrite increases quickly in the first 20 min and then remains stable, which means it has reached an adsorption equilibrium point for pyrite.

3.2. Effect of pH

The effect of pH on the adsorption of thiourea on quartz, mica, and pyrite at 303 K is shown in Figure 2. The initial thiourea concentration was 1.0 g L−1, and the contact time was 60 min. The results indicate that increasing the pH value from 0.5 to 3.0 did not affect the thiourea adsorption on quartz. What was observed was that the adsorption capacity of thiourea on pyrite increased from a pH of 0.5 to 1.0 and then decreased. The Qt of mica decreased in pH value from 0.5 to 3.0. The adsorption capacity of thiourea on the surface of mica and quartz was large under a strong acid condition, and the maximum adsorption capacity of pyrite was at a pH of 1.0. Weak acidity (from pH 1.5 to pH 3) was not conducive to the adsorption of thiourea on the surface of mica and quartz. The solution’s pH played a major role in the adsorption capacity of pyrite and mica, which might be explained by the PZC (point of zero charge) [24]. However, the relationship between the mineral surface potential and the pH was not detected here, and further study on this topic is needed in the future. The optimum pH for leaching is 1.5, so it is more practical to study the adsorption capacity of minerals under this pH value.

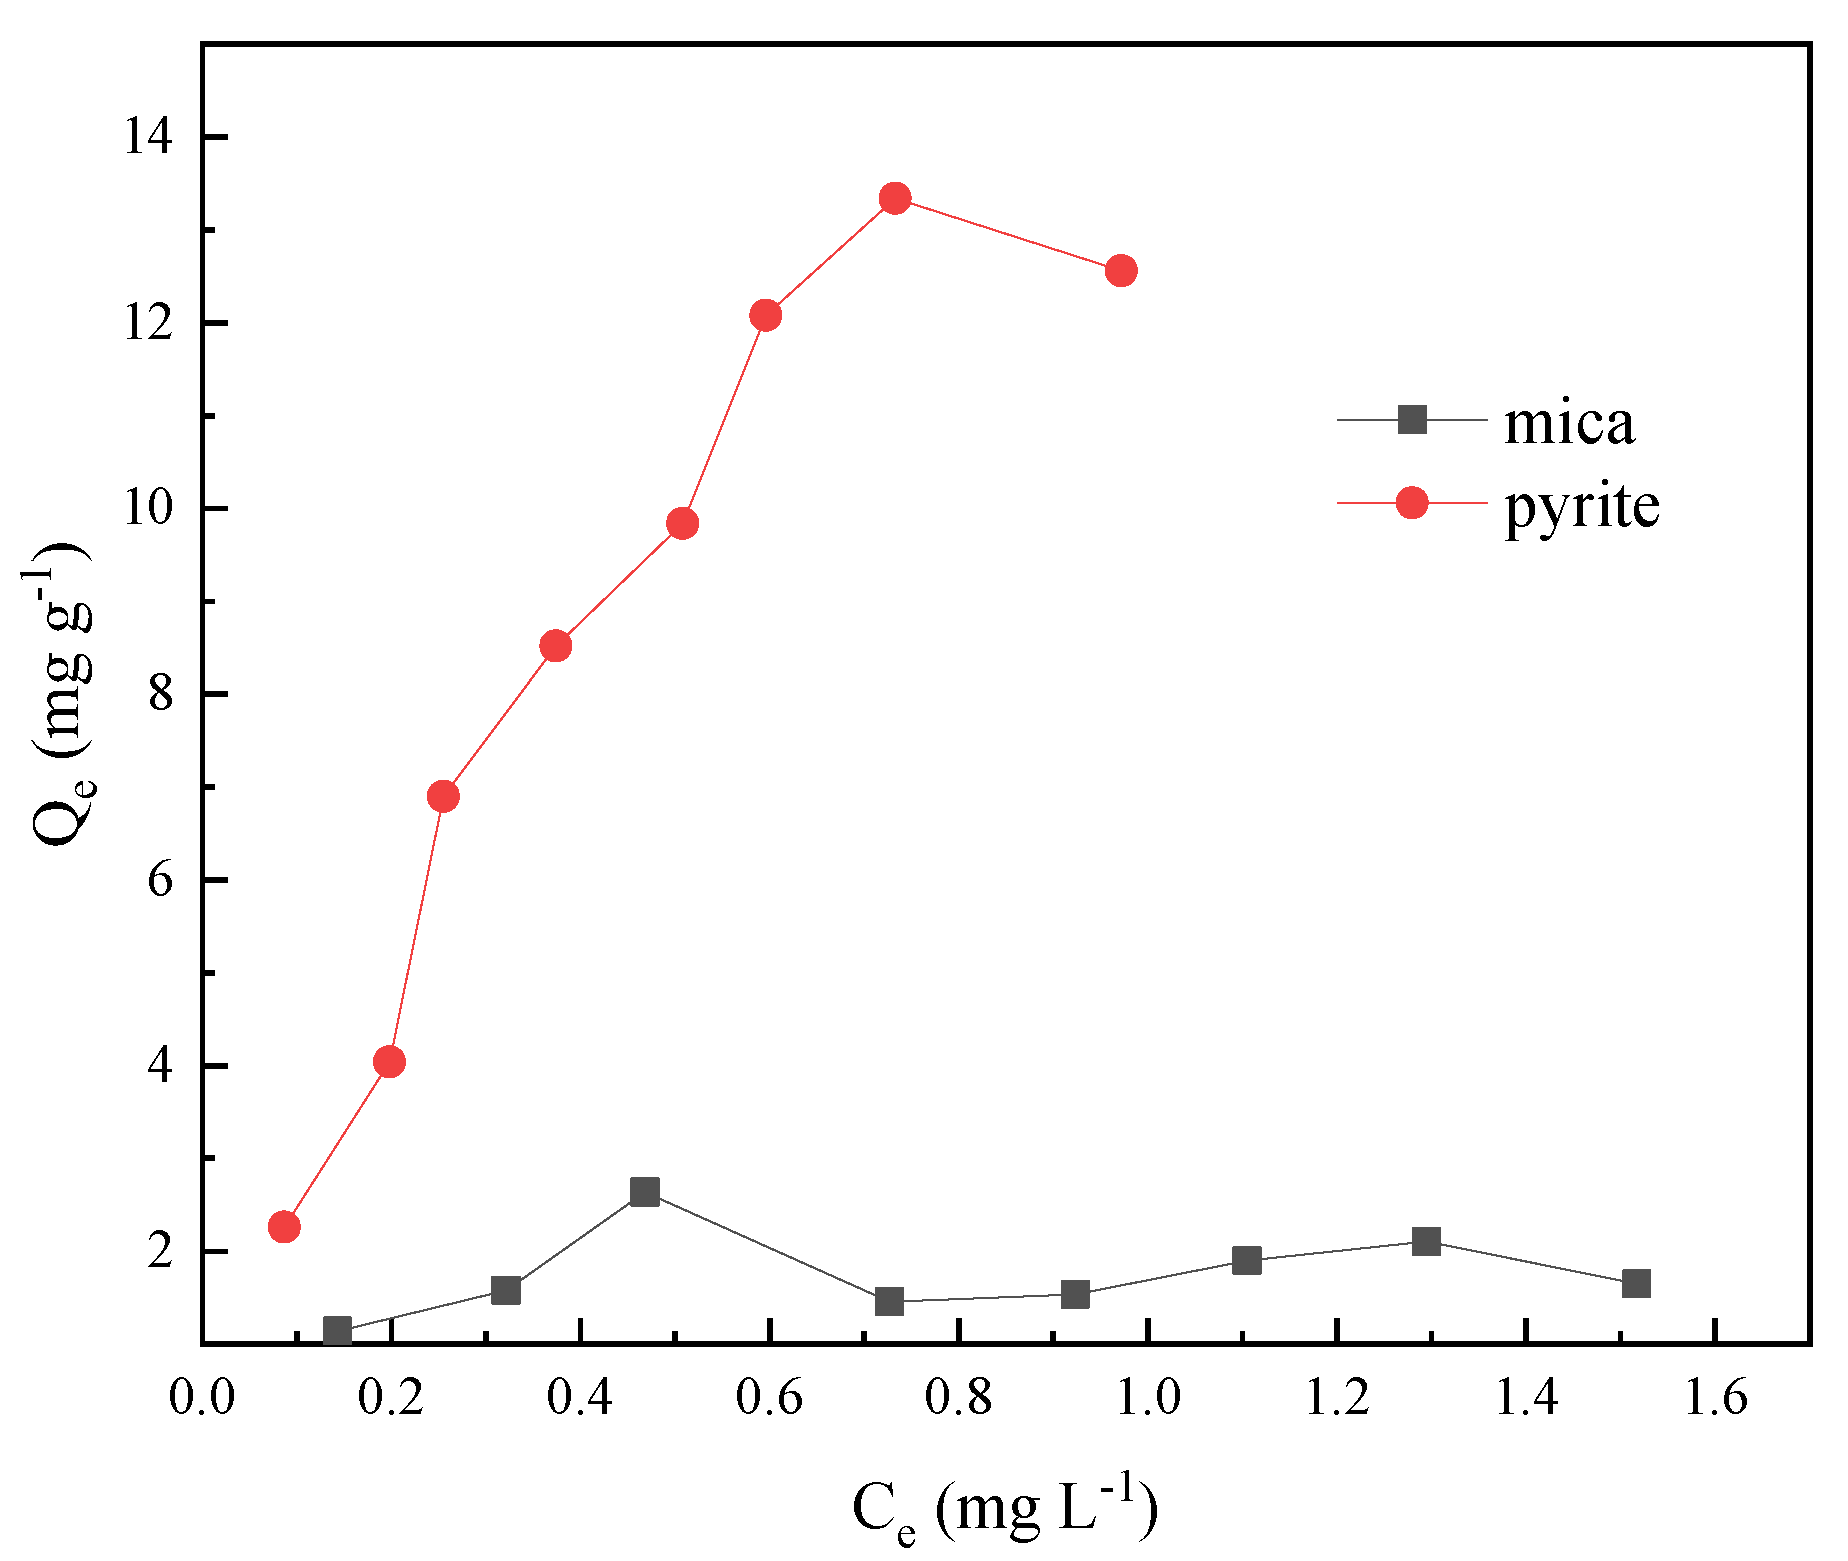
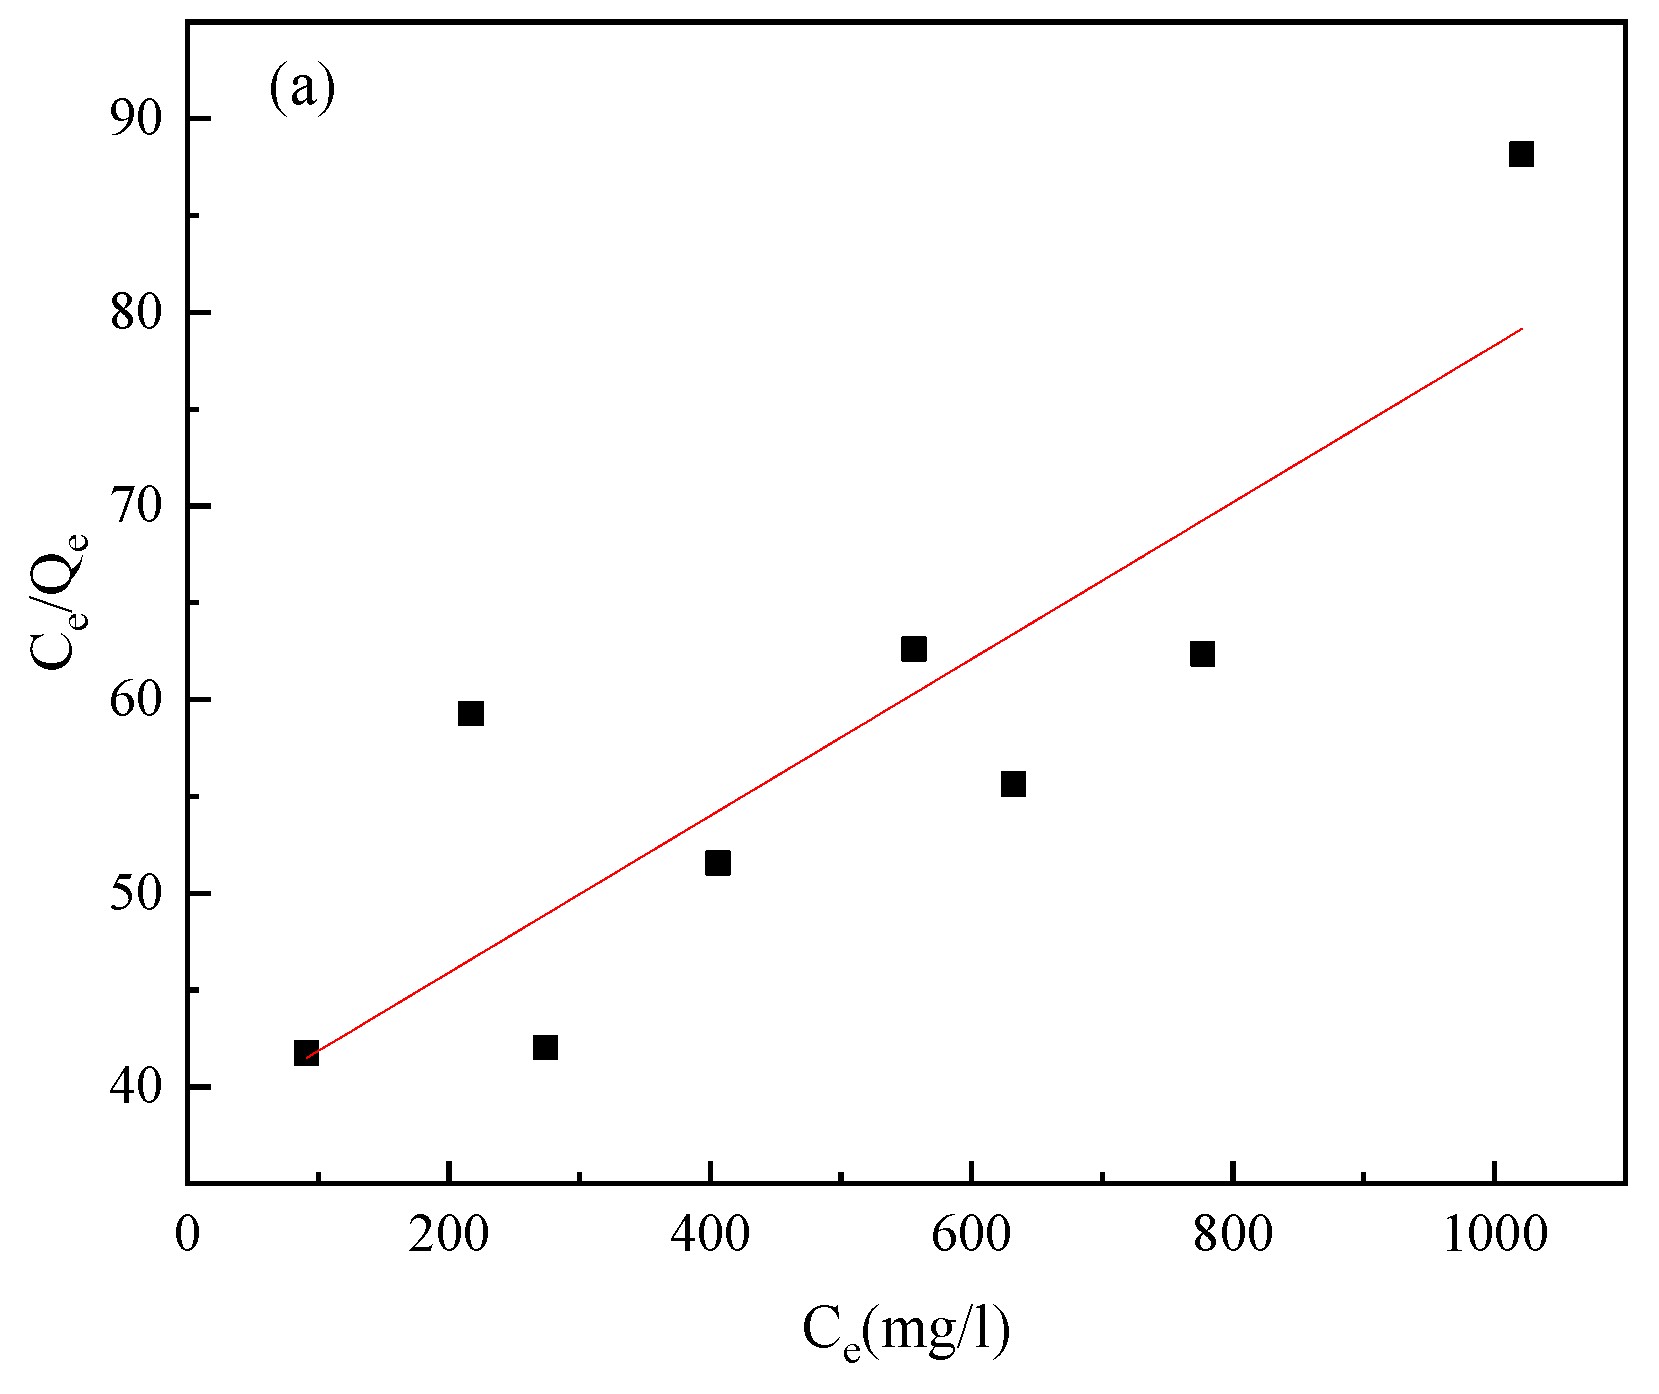
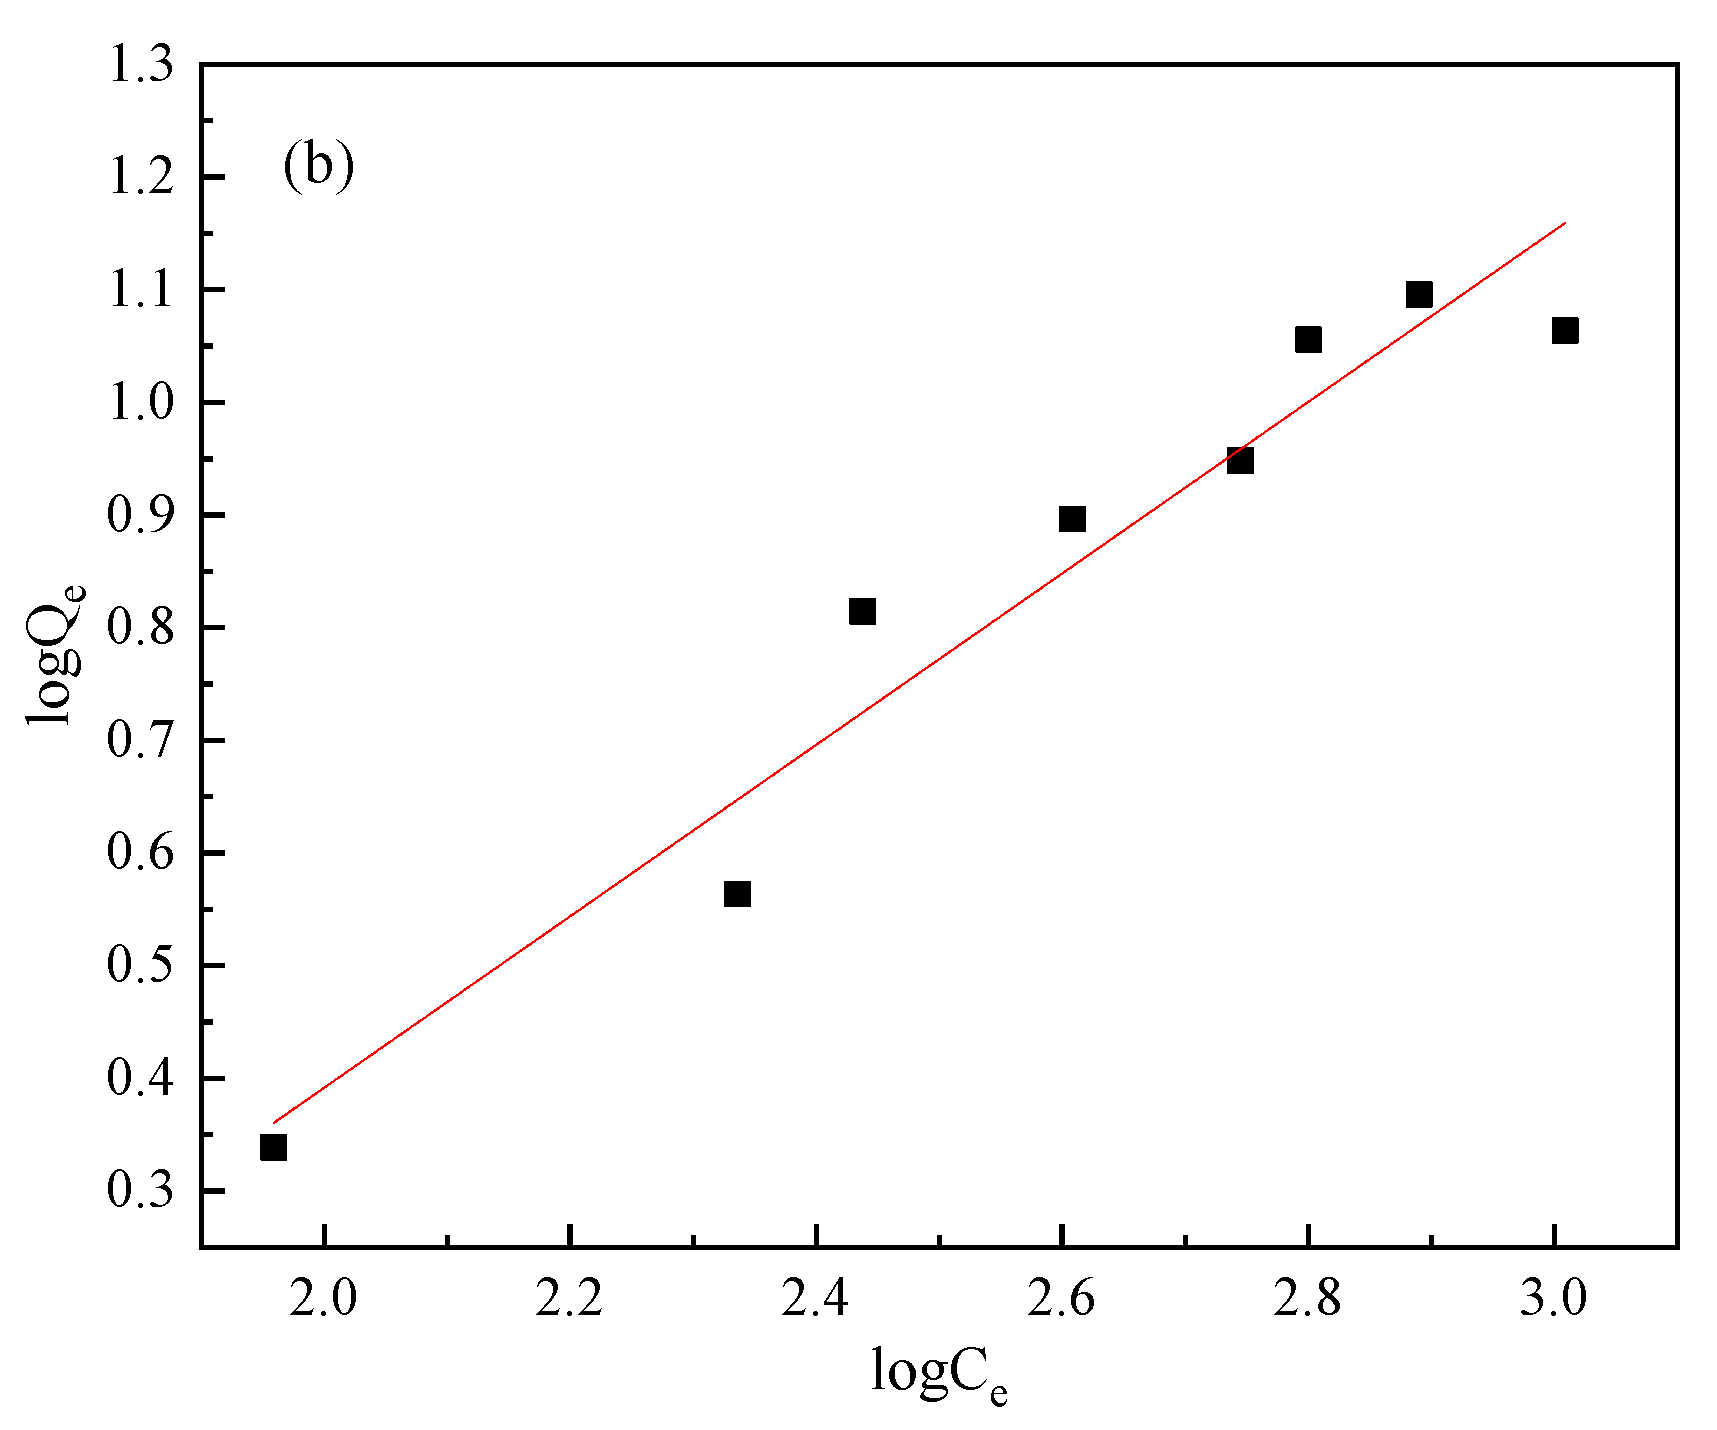
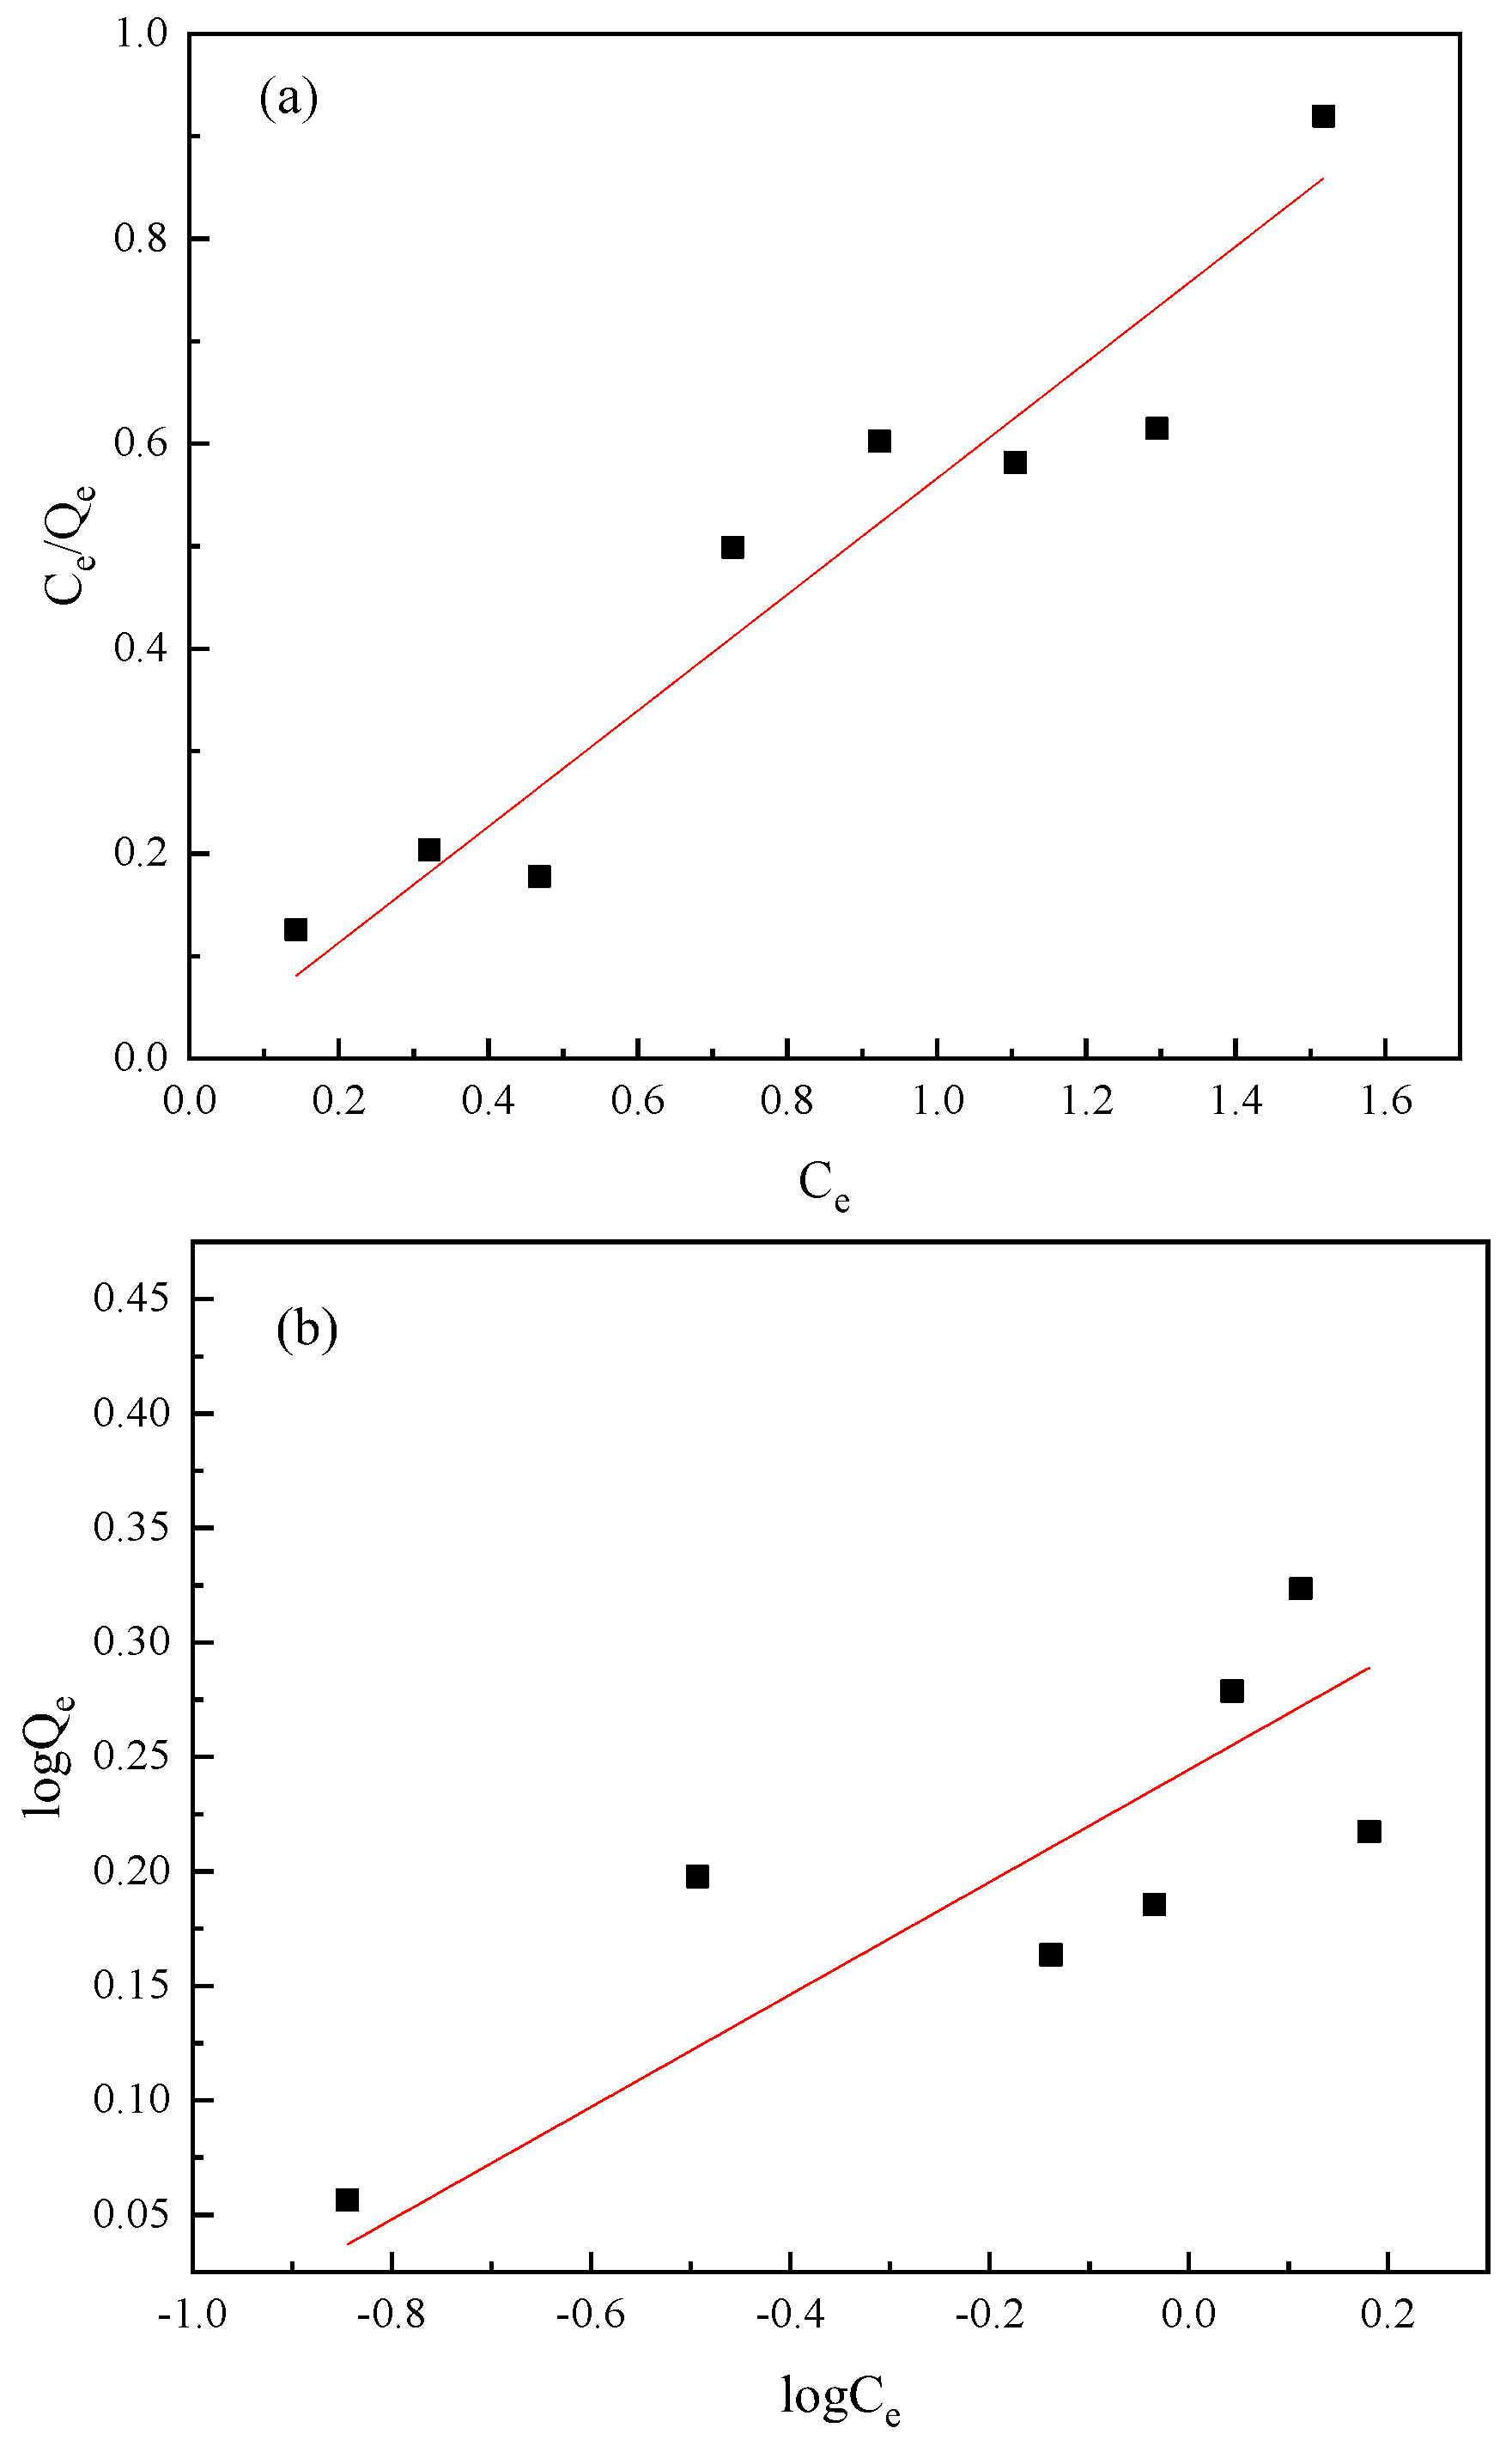
3.3. Adsorption Isotherms

The initial thiourea concentration is an important parameter because this factor can reflect the adsorption isotherms of minerals for a given initial temperature. Hence, the adsorption of thiourea onto the minerals at different initial thiourea concentrations was determined as a function of the equilibrium (residual) of the thiourea concentration, and the corresponding adsorption isotherms are plotted in Figure 3. It can be seen that two minerals remained typical I isotherms under the 303 K condition when the pH value was 1.5 and the contact time was 60 min. In order to illustrate the mechanism of the adsorption systems, several isotherm equations are available, and two important isotherms were selected in this study: the Langmuir and Freundlich isotherms [25].
For the Langmuir isotherm equation:
1 Q e = 1 Q m b + 1 C e Q m
For the Freundlich isotherm equation:
log Q e = 1 n log C e + log K
where Qe is the equilibrium of the thiourea adsorption capacity on the mineral (mg g−1); Ce is the equilibrium of the thiourea concentration in the solution (mg L−1); Qm is the maximum thiourea adsorption capacity on the mineral (mg g−1); b is the Langmuir constant; and K and n are the Freundlich constants expressing adsorption capacity and efficiency, respectively.
The plots of the Langmuir and Freundlich isotherm equations for the adsorption of thiourea onto pyrite and mica at 303 K are shown in Figure 4 and Figure 5, respectively. The parameters and correlation coefficients were obtained from these plots and are listed in Table 1. The fit of the data for thiourea adsorption onto the mica suggests that the Langmuir model gave closer fittings than the Freundlich model, as is obvious from a comparison of the R2 in Table 1.
The results showed that the R2 values of the Langmuir isotherm adsorption equation and the Freundlich adsorption isotherm equation for the adsorption of thiourea by mica were 0.98 and 0.57, respectively, which indicated that the adsorption process of thiourea by mica was more consistent with the Langmuir isotherm adsorption process, which satisfied the monolayer’s physical adsorption. The saturated adsorption capacity for mica was 1.80 mg g−1. The Langmuir and the Freundlich isotherm equations for the pyrite adsorption of thiourea were fitted with an R2 of 0.73 and 0.94, respectively, and the adsorption of thiourea by pyrite was more consistent with the Freundlich adsorption isotherm model, which indicated that the adsorption was a multi-molecular layer chemical process and that there was a chemical interaction between the adsorbate and the adsorbent. Calculated from the Freundlich equation, the value of n was 1.32, which was greater than 1. The value of n roughly represents the adsorption ability of the adsorbent, and the larger it is, the easier it is to adsorb [26]. This showed that pyrite more easily adsorbed the thiourea molecules in the solution than did mica.

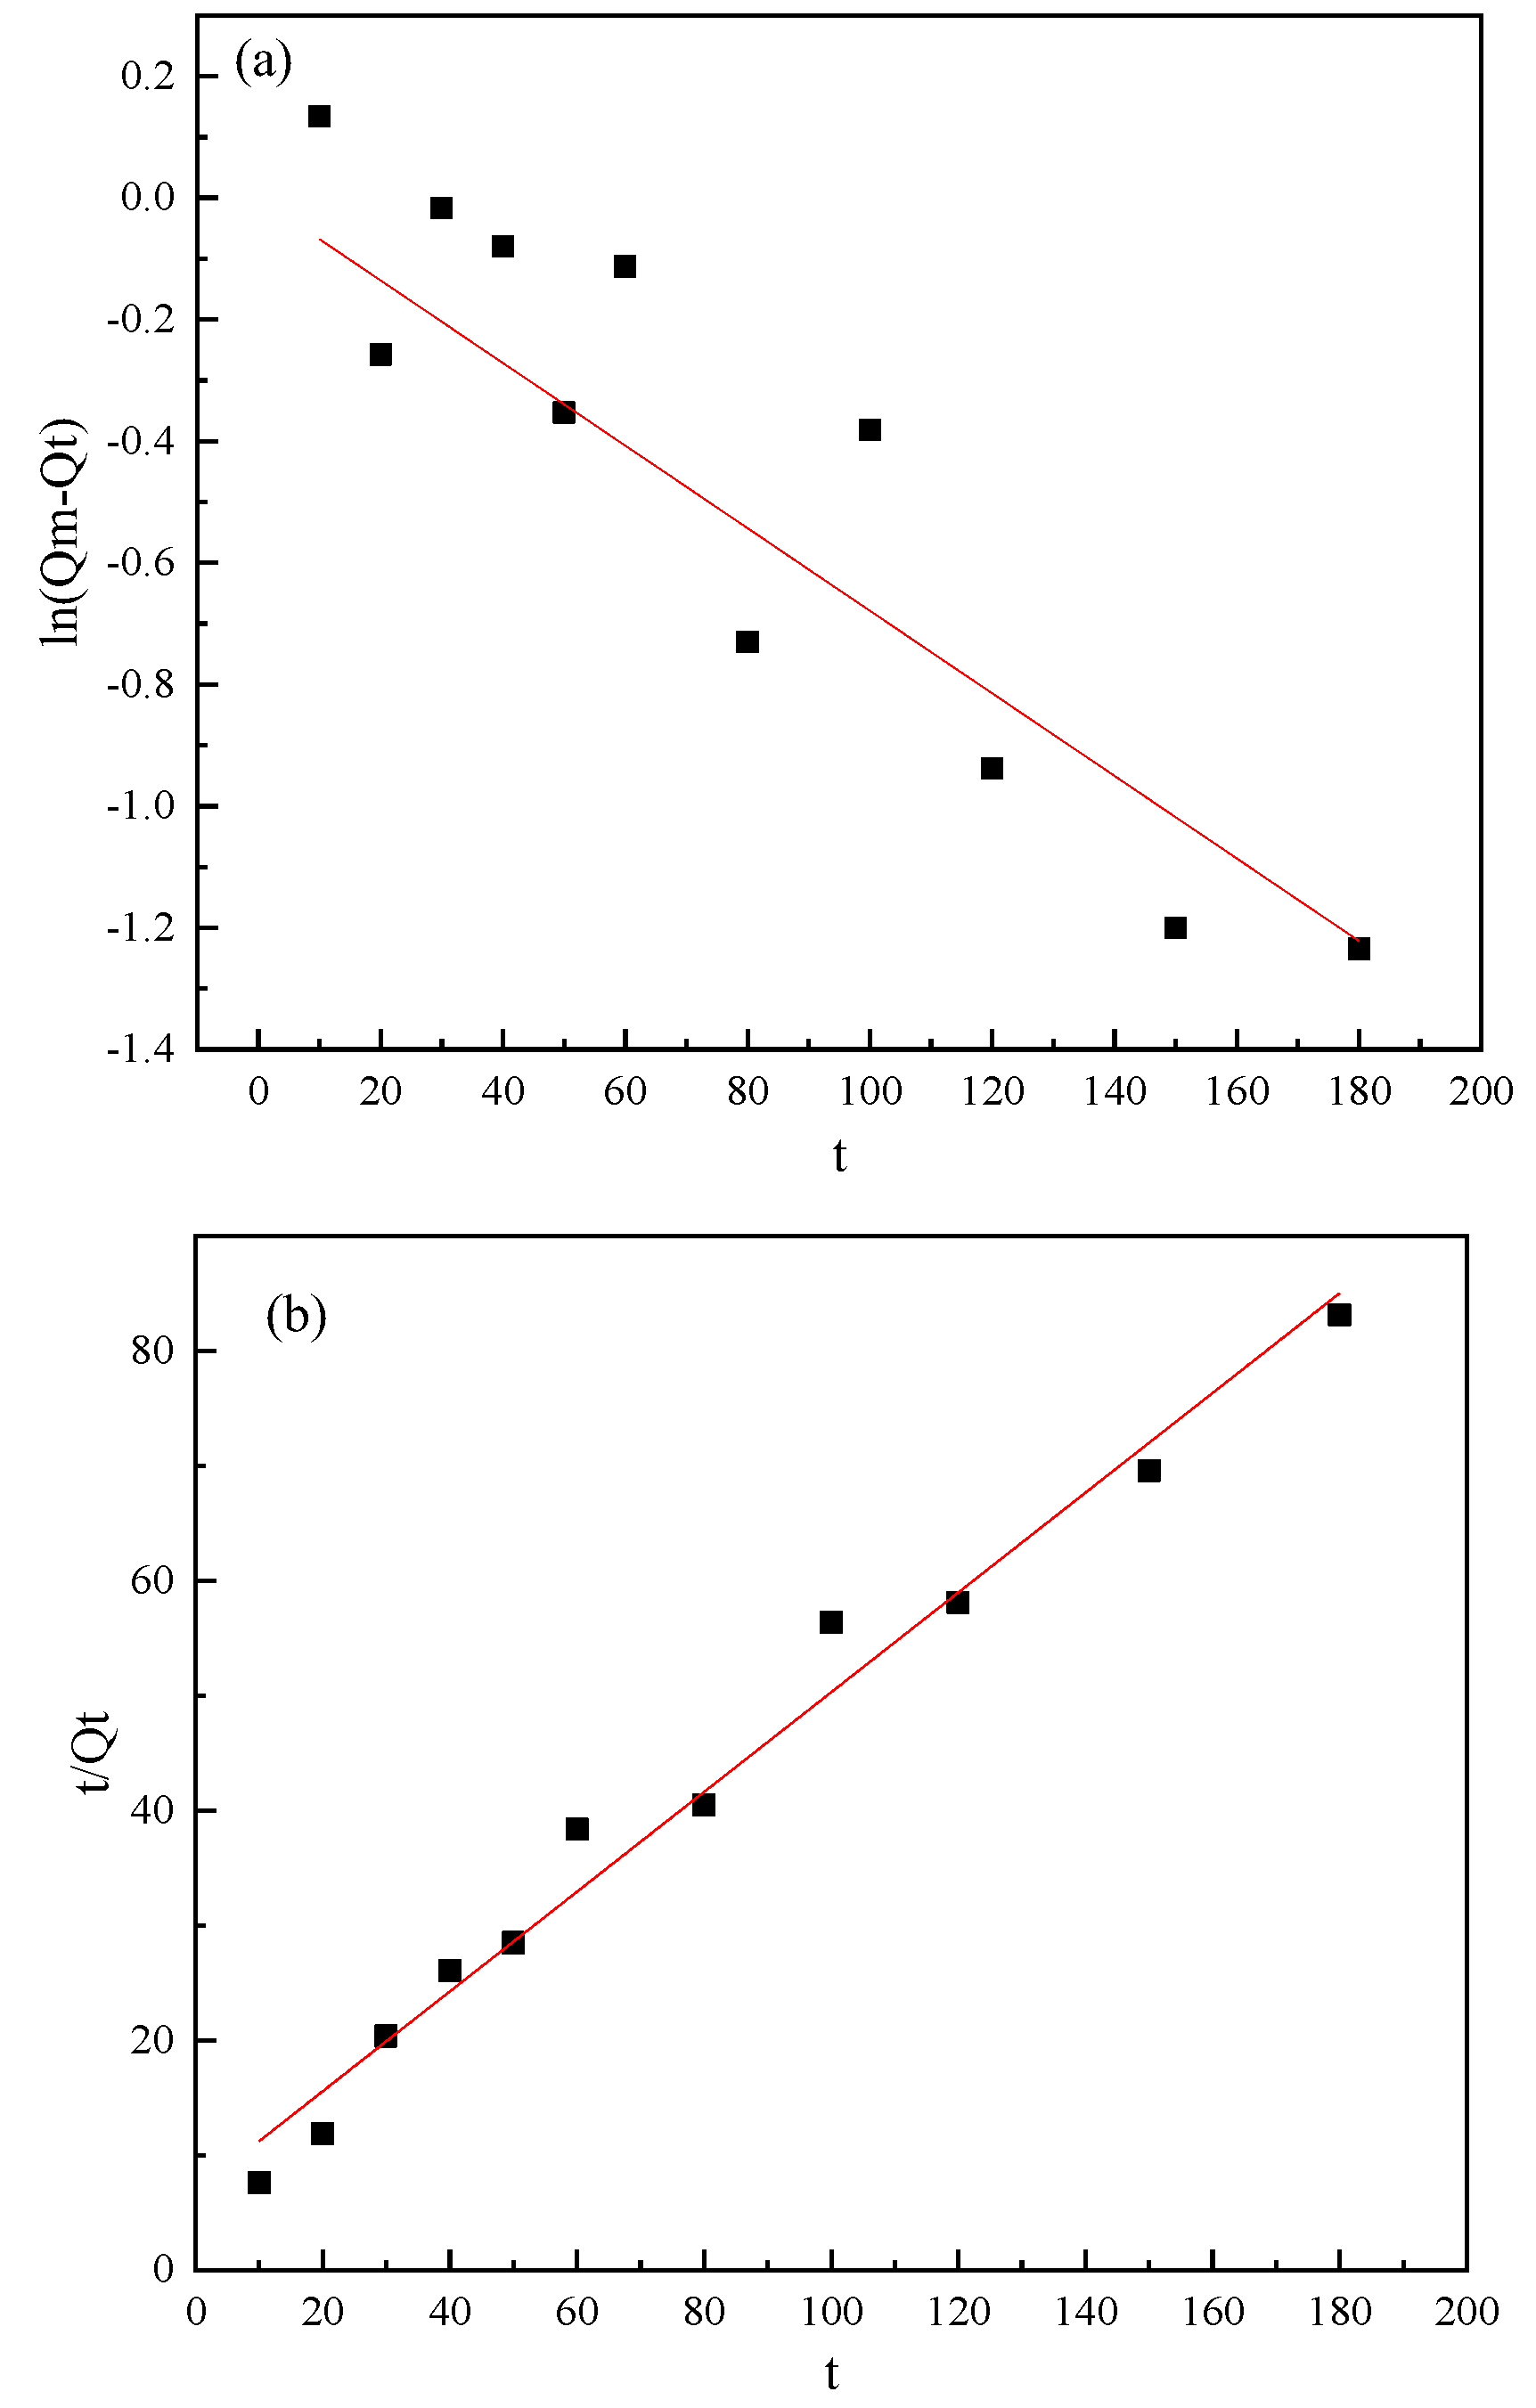
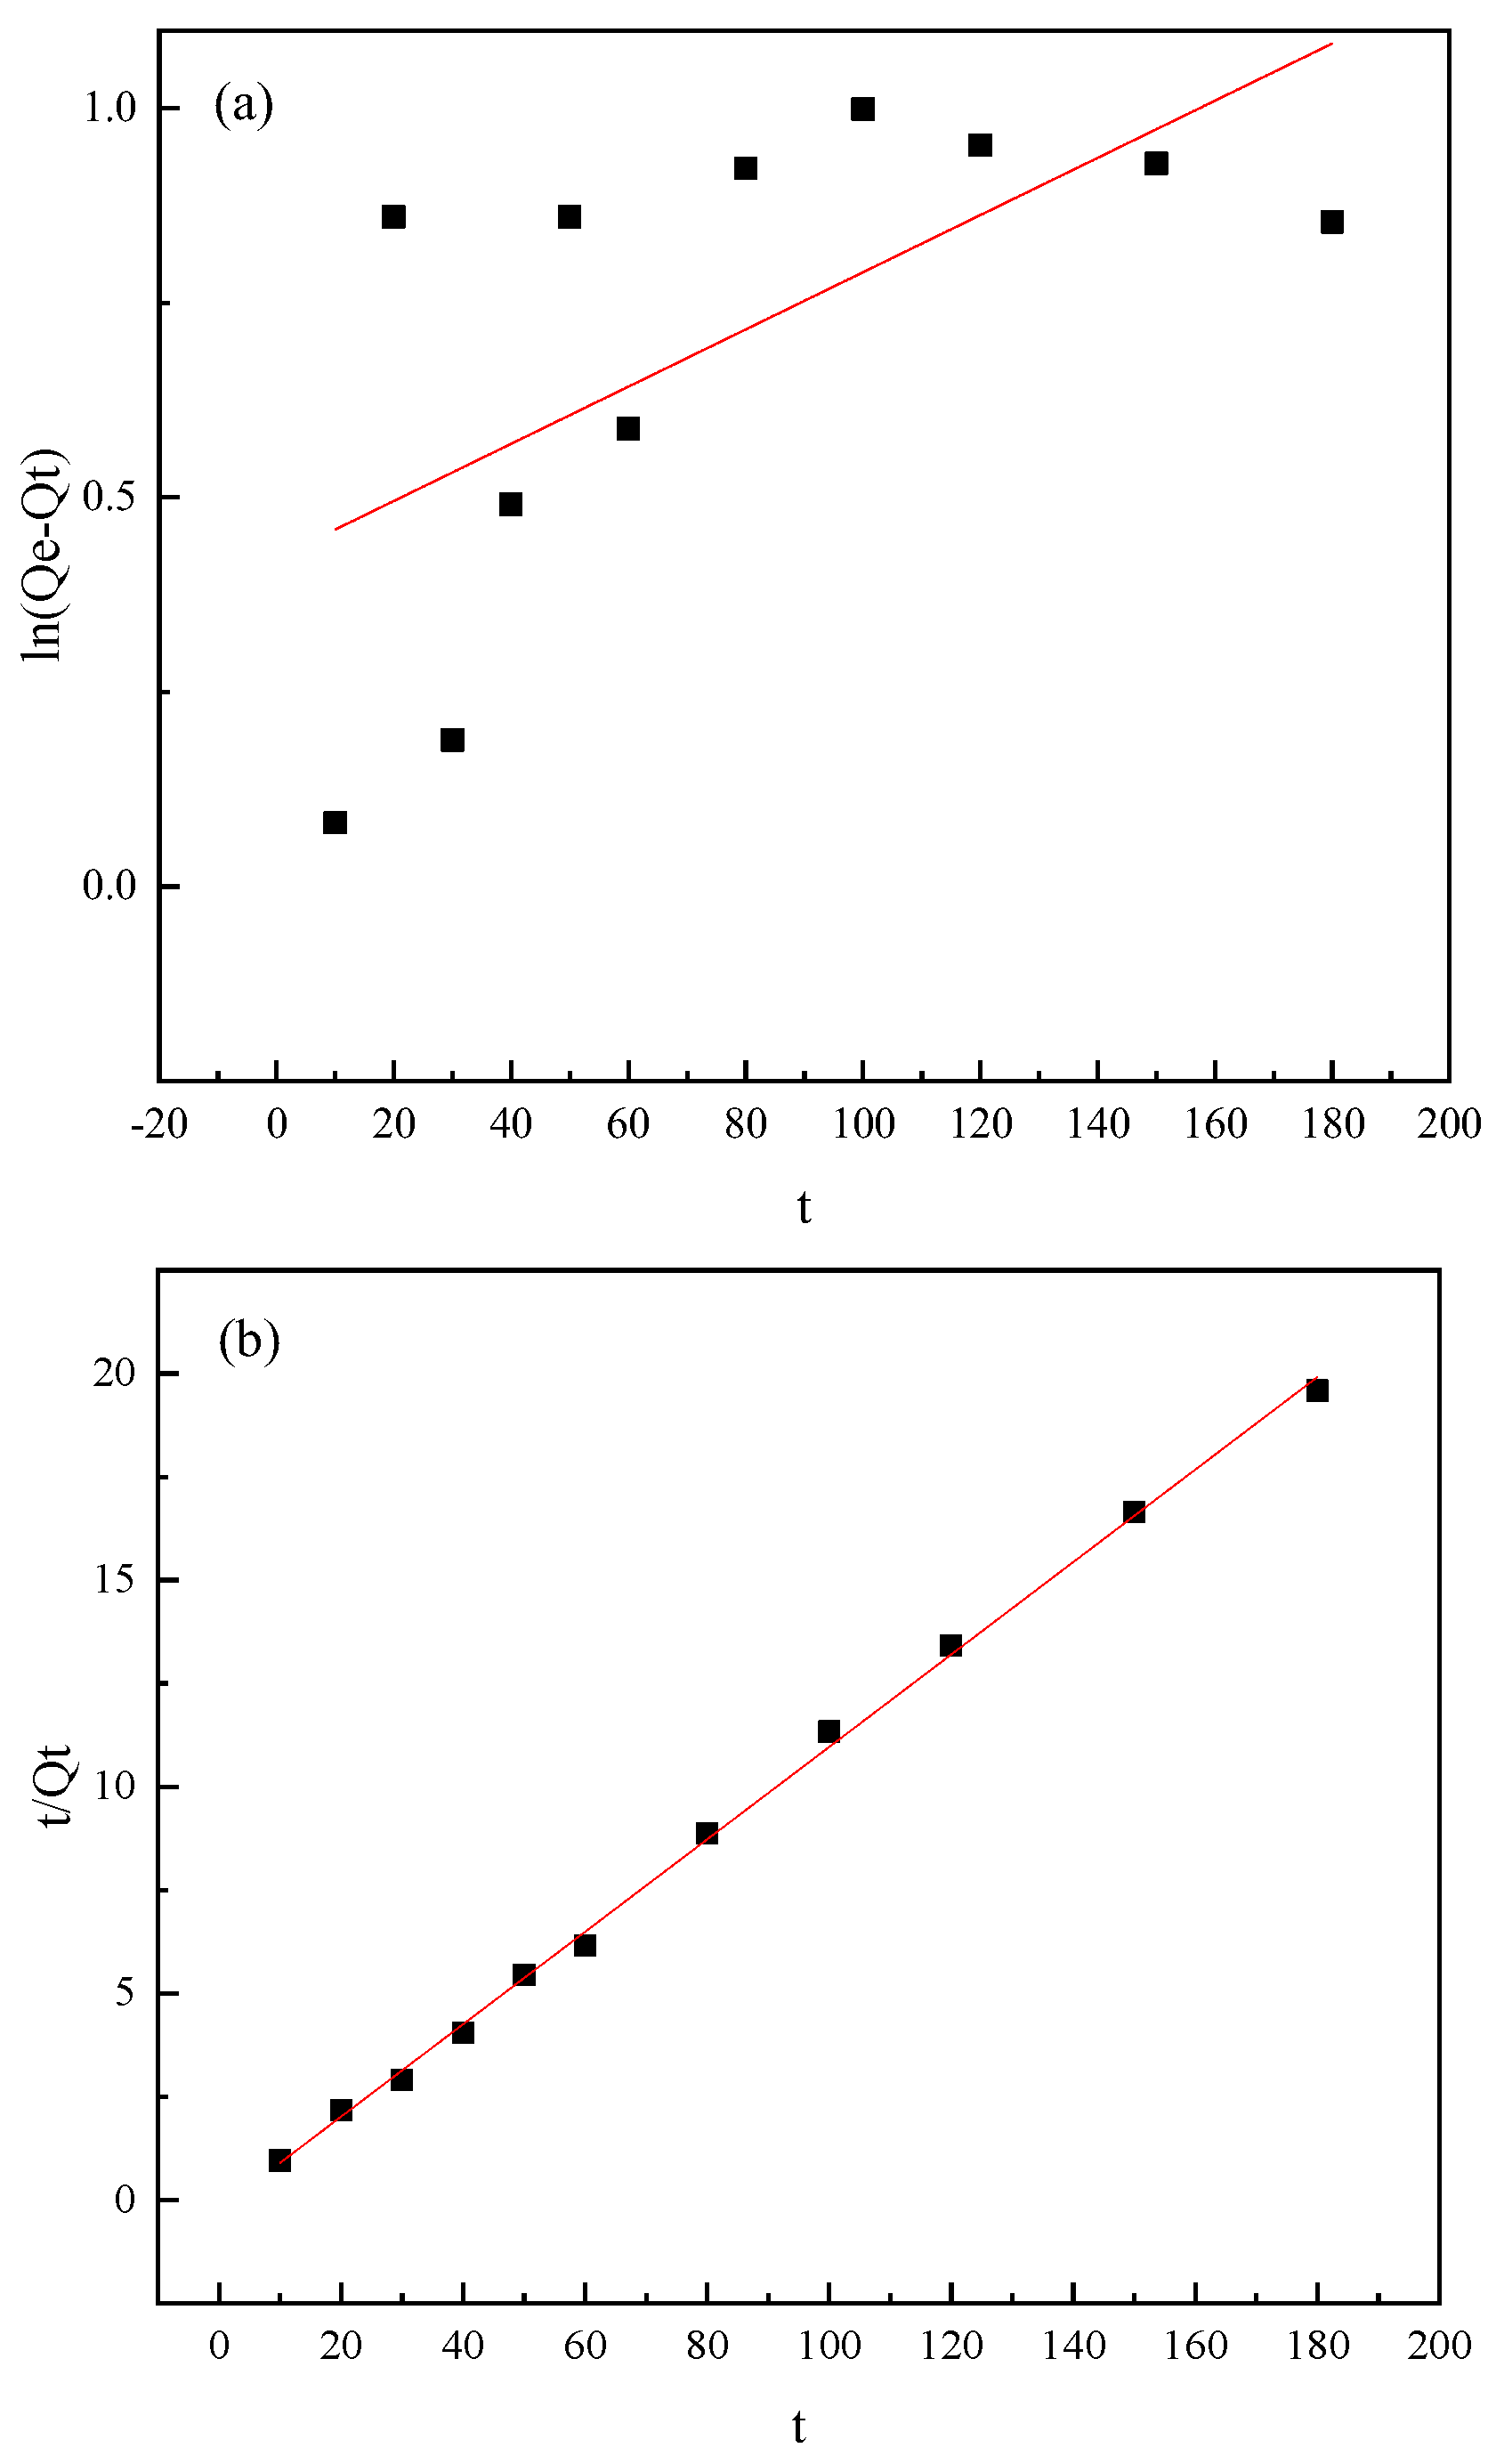
3.4. Kinetic Studies

Although the adsorption isotherm equations can provide some thermodynamic parameters, they do not explain the mechanism of the adsorption dynamic process. Moreover, the thermodynamic equilibrium is an ideal process, and the actual process is often dynamically balanced.
In order to examine the controlling mechanisms of the adsorption process, such as mass transfer and chemical reaction, pseudo-first-order and pseudo-second-order kinetic equations [27] were used to test the experimental data shown in Figure 1.
For the pseudo-first-order kinetic equation:
ln ( Q e Q t ) = ln Q e k 1 t
For the pseudo-second-order kinetic equation:
t Q t = 1 k 2 Q e 2 + t Q e
where Qt is the amount of the thiourea absorbed on the mineral at t moment (mg g−1), and Qe is the equilibrium of the thiourea adsorption capacity on the mineral (mg g−1). The k1 and k2 values were calculated from the linear plot of ln(Qe − Qt) versus t and listed in Table 2, and the figures are shown in Figure 6 and Figure 7.
It can be intuitively seen from the fitted line in the figure that the pseudo-second-order kinetic equation can better describe the adsorption process of thiourea by mica and pyrite. Both correlation coefficients were higher than 0.98. Moreover, the calculated Qe value also agreed with the experimental data in the case of pseudo-second-order kinetics. These results suggest that the adsorption data are well represented by pseudo-second-order kinetics.

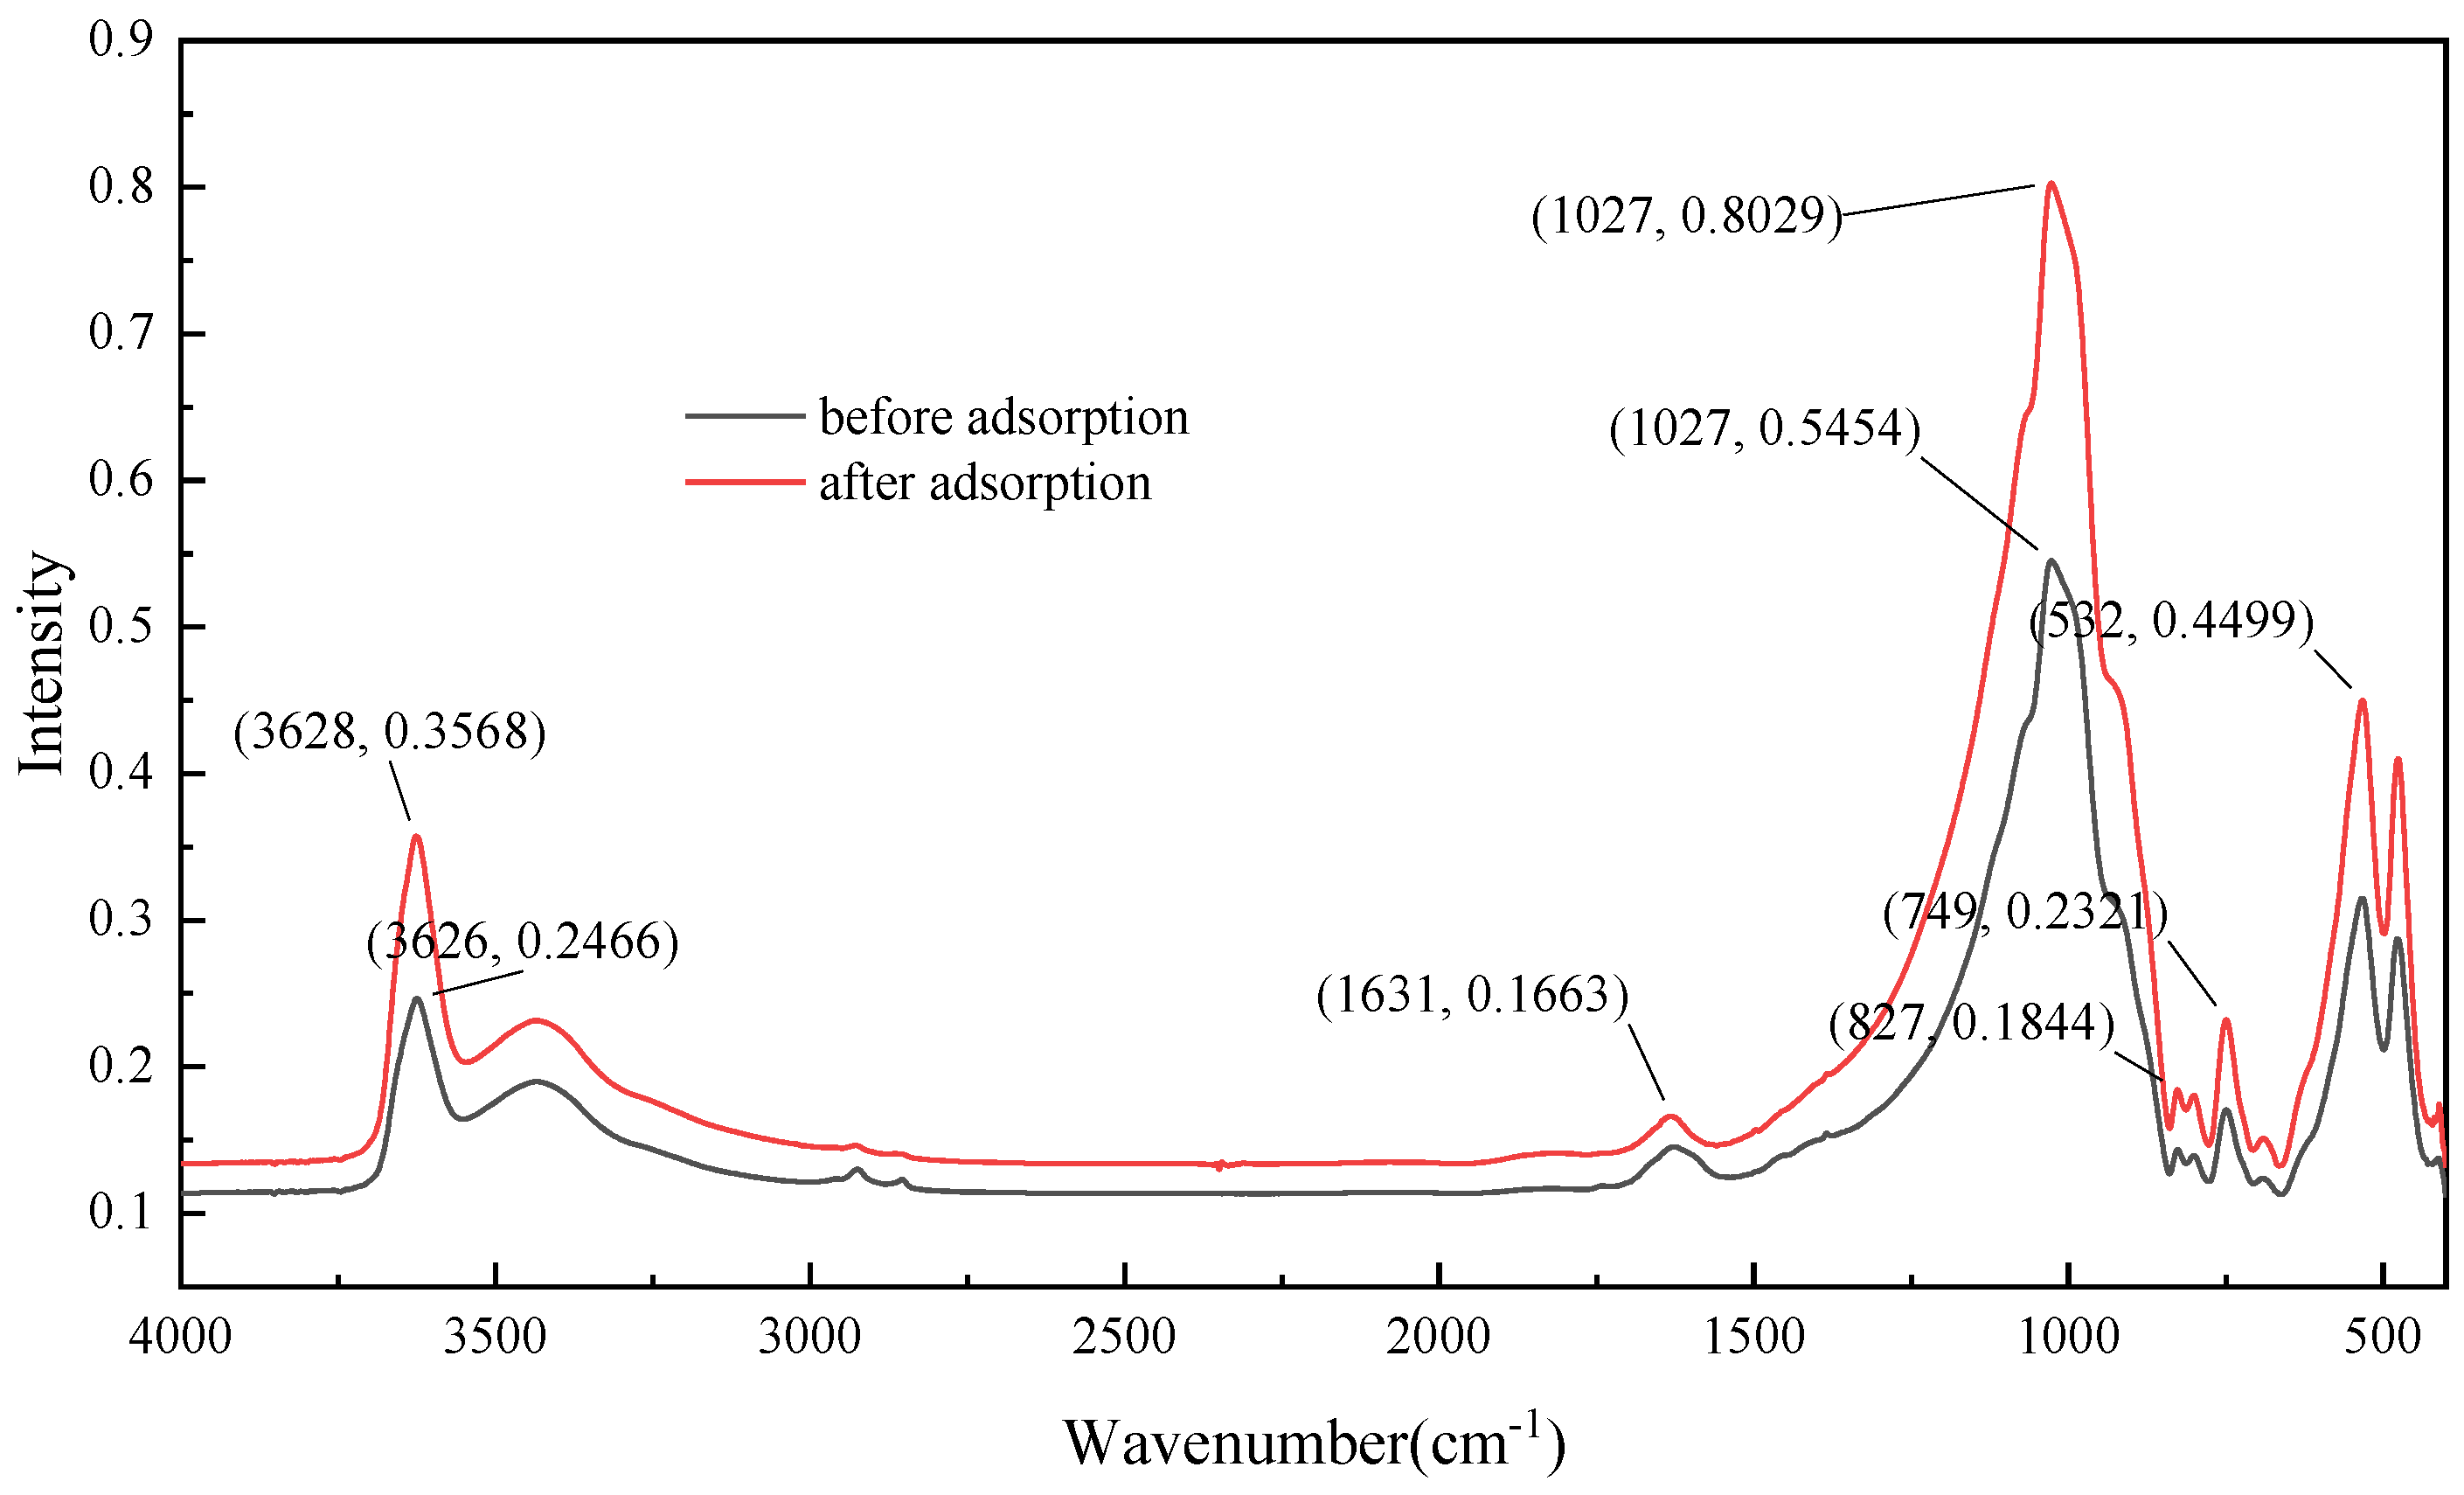
3.5. FT-IR Analysis of Adsorption

According to the fitting and calculating results obtained by the thermodynamic isotherm equation, the adsorption processes of mica and pyrite conformed to physical adsorption and chemical adsorption, respectively. Therefore, it can be inferred that the process of thiourea adsorption on real bio-oxidation residue is a mixture of physical adsorption and chemical adsorption.
In order to further clarify the mechanism of the adsorption of thiourea by mica and pyrite, Fourier transform infrared spectroscopy was used to characterize the surface before and after the adsorption of thiourea by mica and pyrite. The results are shown in Figure 8 and Figure 9.
Figure 8 shows the FT-IR spectra of pyrite. It can be seen from the FT-IR spectrum of blank pyrite in Figure 8 that, before the adsorbing of thiourea, there were strong peaks at around 3430 cm−1 and around 1630 cm−1, which were the result of the interaction between pyrite and water. Among these peaks, the sharp peak at 3430 cm−1 was the stretching vibration peak caused by the -OH intermolecular hydrogen bond generated by the adsorbed water, and the sharp peak near 1630 cm−1 was the bending vibration peak caused by the -OH bond generated by the physically adsorbed water. The peaks at 419 cm−1, 592 cm−1, 830 cm−1, and 1130 cm−1 were characteristic peaks of pyrite, and the peaks at 419 cm−1 and 830 cm−1 were due to the Fe-S bond stretching vibration. The peaks at 592 cm−1 and 1130 cm−1 can be attributed to the disulfide bond stretching vibrations [28,29]. After the adsorption of thiourea, the stretching vibration peak of the Fe-S bond at 419 cm−1 was weakened, and the stretching vibration peak at 830 cm−1 disappeared. The stretching vibration peak of the disulfide bond at 1130 cm−1 was weakened, and the peak at 830 cm−1 disappeared. It can be inferred that the S-S and S-Fe bonds of pyrite were broken in the thiourea solution, and a new S-S bond was formed with S in the thiourea molecule, indicating that pyrite had a chemical adsorption effect on thiourea [13]. In addition, the adsorption process conformed to the Freundlich isotherm adsorption equation and the pseudo-second-order kinetic equation, indicating that the adsorption of thiourea by pyrite was a multi-layer molecular chemisorption process.
It can be seen from the FT-IR spectrum of the thiourea adsorption on mica in Figure 9 that 3626 cm−1 was the vibrational absorption peak of the Si-OH bond of mica [30], and the peak shift occurred after the adsorption of thiourea, indicating that the surface of mica was dominated by a hydrogen bond to combine with thiourea. The peak at 1027 cm−1 was the antisymmetric stretching vibration peak of the Si-O bond of mica, and at the peaks at 827 cm−1 and 749 cm−1 were the Si-O-Si symmetrical stretching vibration peaks of mica. The peaks at 532 cm−1 could be attributed to the Si-O-Al stretching vibration, which was caused by other metallic elements [31,32]. Except for the -OH bond, the other mica characteristic peaks did not shift or disappear, indicating that the adsorption of thiourea by mica was a physical adsorption process based on the hydrogen bonds.

4. Conclusions

  • The typical minerals in the bio-oxidation residue of refractory gold ore in Xinjiang have a certain adsorption effect on thiourea, and the order, according to the adsorption capacity from large to small, is pyrite, mica, and quartz.
  • The adsorption of thiourea on pyrite is an adsorption process that conforms to the Freundlich isotherm equation and pseudo-second-order kinetic equation. The saturated adsorption capacity is 8.93 mg g−1 of pyrite. The adsorption of thiourea on mica is an adsorption process that conforms to the Langmuir isotherm equation and the pseudo-second-order kinetic equation. The saturated adsorption capacity is 2.30 mg g−1 of mica.
  • Combining the adsorption mechanism of the two minerals, it can be seen that the adsorption of thiourea by the pre-oxidation residue is a mixed process of physical adsorption and chemical adsorption.

Author Contributions

Conceptualization, S.C. and B.W.; methodology, S.C.; software, S.C and M.W.; validation, B.W. and J.W.; formal analysis, S.C. and H.S.; investigation, S.C.; resources, B.W.; data curation, S.C.; writing—original draft preparation, S.C.; writing—review and editing, B.W.; visualization, M.W.; supervision, B.W.; project administration, J.W.; funding acquisition, H.S. All authors have read and agreed to the published version of the manuscript.

Funding

This research was funded by the National Natural Science Foundation of China (No. 52104269, No. 51504031).

Data Availability Statement

The data that support the findings of this study are available from the corresponding author upon reasonable request.

Acknowledgments

The authors are grateful to the financial support from the National Natural Science Foundation of China (Grant No. 52104269, 51504031) and the members of the GRINM Group Co., Ltd., China and GRIMAT Engineering Institute Co., Ltd., China.

Conflicts of Interest

The authors declare no conflict of interest.

References

  1. Boboev, I.R.; Selnitsin, R.S.; Kholikov, T.A.; Sharipov, B.K. Technology of Gold Extraction from Mature Dumps by Thiourea Leaching. Russ. J. NonFerrous Met. 2020, 61, 257–264. [Google Scholar] [CrossRef]
  2. Boboev, I.R.; Kurbonov, S.K.; Sel’Nitsyn, R.S. Use of Thiourea Leaching During Gold-Containing Dump Treatment. Metallurgist 2019, 63, 633–641. [Google Scholar] [CrossRef]
  3. Deng, T.; Liao, M. Gold recovery enhancement from a refractory flotation concentrate by sequential bioleaching and thiourea leach. Hydrometallurgy 2002, 63, 249–255. [Google Scholar] [CrossRef]
  4. Vargas, C.; Navarro, P.; Espinoza, D.; Manríquez, J.; Mejía, E. Dissolution Behavior of Gold in Alkaline Media Using Thiourea. Int. J. Nonferrous Met. 2019, 8, 1–8. [Google Scholar] [CrossRef] [Green Version]
  5. Intan, N.R.; Yu, T.; Naoko, O. Thiourea Bioleaching for Gold Recycling from E-waste. Waste Manag. 2019, 84, 158–165. [Google Scholar]
  6. Schulze, R.G. New Aspects in Thiourea Leaching of Precious Metals. JOM 1984, 36, 62–65. [Google Scholar] [CrossRef]
  7. Guo, X.-Y.; Zhang, L.; Tian, Q.-H.; Qin, H. Stepwise extraction of gold and silver from refractory gold concentrate calcine by thiourea. Hydrometallurgy 2020, 194, 105330. [Google Scholar] [CrossRef]
  8. Le, G.; Li, W.J.; Song, K.; Song, Y.S.; Chen, Y.; Bai, A.P.; Cheng, Y. Electrochemical Dissolution Behavior of Gold and Its Main Coexistent Sulfide Minerals in Acid Thiocyanate Solutions. Rare Met. 2022, 41, 254–261. [Google Scholar] [CrossRef]
  9. Li, W.J.; Zhou, H.; Bai, A.P.; Song, Y.S.; Cai, L.L.; Zheng, S.L.; Zhang, Q.D.; Cao, S. Electrochemical adsorption and pas-sivation on gold surface in alkaline thiourea solutions. Rare Met. 2020, 39, 951–958. [Google Scholar] [CrossRef]
  10. Bolzán, A.; Piatti, R.; Arvia, A. Electrochemical processes at gold|thiourea-containing aqueous acid solution interfaces. J. Electroanal. Chem. 2003, 552, 19–34. [Google Scholar] [CrossRef]
  11. Yan, M.; Liu, K.; Jiang, Z. Electrochemical oxidation of thiourea studied by use of in situ FTIR spectroscopy. J. Electroanal. Chem. 1996, 408, 225–229. [Google Scholar] [CrossRef]
  12. Liu, B.; Gao, Q.Y.; Feng, J.M.; Lu, Y.C. Reaction Dynamics in the Oxidation of Thiourea. Chem. Res. Appl. 2006, 18, 758–764. [Google Scholar]
  13. Lan, X.Z.; Zhang, J.; Yuan, Z.C.; Jia, Y.P.; Cheng, W.Q. A Study of Reagents Consumption During Extracting Gold and Silver by Thiourea, J. Xi’an Inst. Metall. Cons. Eng. 1994, 25, 167–171. [Google Scholar]
  14. Yang, B.; Tong, X.; Xie, X.; Wang, X. Study on the Gold Recovery from Flotation Tailings of a Refractory Gold Ores in Gansu Province by a Process Combing Mineral Processing and Metallurgy. Gold Sci. Technol. 2020, 28, 123–131. [Google Scholar]
  15. Wu, B. Current Status and Progress of the Research on Complex Refractory Gold Ore Pretreatment Technology. Gold 2020, 5, 69–78. [Google Scholar]
  16. Ren, C.G.; Zhou, S.J.; Wang, K.R.; Zhou, Y.Q. A Study on Existing State of Superfine Golden Minerals and Inclusions with Scanning Proton Microprobe. Nucl. Technol. 1993, 16, 479–482. [Google Scholar]
  17. Zheng, C.J.; Xiong, Y.; Hu, J.P. Analysis of the Occurrence in Microarea for WRAP Type Gold Mine by SEM, PTCA. Part A Phys. Test. 2006, 42, 184–186. [Google Scholar]
  18. Qiu, Z.M.; Rang, M.; Qiu, L. W. Discovery of Gold with Negative Oxidation Number in Pyrite and Arsenopyrite. J. Chang. Univ. Earth Sci. 1994, 24, 168–173. [Google Scholar]
  19. Zhang, S.; Yang, H.; Ma, P.; Luan, Z.; Tong, L.; Jin, Z.; Sand, W. Column bio-oxidation of low-grade refractory gold ore containing high-arsenic and high-sulfur: Insight on change in microbial community structure and sulfide surface corrosion. Miner. Eng. 2020, 175, 107201. [Google Scholar] [CrossRef]
  20. Monachon, M.; Berenguer, M.A.; Joseph, E. Chapter One-Biological Oxidation of Iron Sulfides. Adv. Appl. Microbiol. 2019, 107, 1–27. [Google Scholar]
  21. Zhao, H.-F.; Yang, H.-Y.; Tong, L.-L.; Zhang, Q.; Kong, Y. Biooxidation-thiosulfate leaching of refractory gold concentrate. Int. J. Miner. Met. Mater. 2020, 27, 1075–1082. [Google Scholar] [CrossRef]
  22. Ren, C.Y. Study on the Mechanism and Process of Gold Leaching by Thiourea in the Acid System of Biological Pre-Oxidation Residue of Refractory Gold Ore Containing Arsenic; General Research Institute for Nonferrous Metals: Beijing, China, 2020; p. 18. [Google Scholar]
  23. Zhong, X.; Jiang, E.C.; Lu, L.Y.; Gao, Z.N.; Wang, M.F. Preparation of rice husk biochar and adsorption characteristics of urea nitrogen. J. Agro-Environ. Sci. 2021, 40, 2150–2158. [Google Scholar]
  24. Balram, S.Y.; Sudip, D. Effect of Time, pH, and Temperature on Kinetics for Adsorption of Methyl-orange Dye into the Modified Nitrate Intercalated MgAl LDH Adsorbent. Inorg. Chem. Commun. 2022, 137, 109203. [Google Scholar] [CrossRef]
  25. Zhang, Y.Y.; Xu, N.; Wu, Y.; Zhang, G.Y.; Zhou, Y.J.; Niu, Y.N. Study on the adsorption of methylene blue by the glass pumice. Anhui Chem. Ind. 2021, 47, 31–33. [Google Scholar]
  26. Liu, H.W. Study on the Preparation and Adsorption Properties of Modified Clay for Heavy Metal Ion; Northwest Normal University: Lanzhou, China, 2011. [Google Scholar]
  27. Chen, H.; Wang, A.Q. Adsorption characteristics of Cu(II) from aqueous solution onto poly(acrylamide)/attapulgite composite. J. Hazard. Mater. 2009, 165, 223–231. [Google Scholar] [CrossRef]
  28. Shi, S.; Wu, Q.Y.; Li, X.Z.; Huang, M.H. Adsorption of Sb(V) in Water by Natural Pyrite: Performance and Mechanism. Environ. Sci. 2020, 41, 4124–4132. [Google Scholar]
  29. Tu, Y.B.; Han, P.W.; Zhang, X.M.; Du, Y.C.; Wang, Y.L.; Ye, S.F. Adsorption of Cyanide by Typical Minerals of Cyanide Slag. CIESS J. 2019, 70, 2684–2690. [Google Scholar]
  30. Liang, L.; Wang, Y.B.; Lin, X.T.; Wang, W.W.; Wen, K. Effect Mechanism of Electrochemical Modification on Calcium-activated Muscovite. Conserv. Util. Miner. Resour. 2021, 41, 107–113. [Google Scholar]
  31. Jin, X.T.; Li, G.G.; Liao, B.B.; Li, X.M.; Long, C. Gemological and Vibrational Spectrum Characteristics of Micaceous Quartzose Jade ‘Strawberry Crystal’. J. Gems Gemmol. 2021, 23, 19–28. [Google Scholar]
  32. Guo, G.W. Preparation of Ultra-fine Powder of Muscovite and Research of Aid-grinding Mechanism; Xi’an University of Architecture and Technology: Xi’an, China, 2015. [Google Scholar]
Figure 1. Effect of time on the adsorption of thiourea on quartz, mica, and pyrite.
Minerals 12 00421 g001
Figure 2. Effect of pH values on the adsorption of thiourea on quartz, mica, and pyrite.
Minerals 12 00421 g002
Figure 3. Equilibrium adsorption capacity of thiourea on mica and pyrite.
Minerals 12 00421 g003
Figure 4. Fitting results of the isotherm equations for thiourea’s adsorption on mica: (a) Langmuir isotherm equation and (b) Freundlich isotherm equation.
Minerals 12 00421 g004
Figure 5. Fitting results of the isotherm equations for thiourea’s adsorption on pyrite: (a) Langmuir isotherm equation and (b) Freundlich isotherm equation.
Minerals 12 00421 g005aMinerals 12 00421 g005b
Figure 6. Kinetic fitting of thiourea adsorption on mica: (a) pseudo-first-order kinetic plot and (b) pseudo-second-order kinetic plot.
Minerals 12 00421 g006
Figure 7. Kinetic fitting of thiourea adsorption on pyrite: (a) Pseudo-first-order kinetic plot and (b) pseudo-second-order kinetic plot.
Minerals 12 00421 g007
Figure 8. FT-IR spectrum of pyrite before and after thiourea adsorption.
Minerals 12 00421 g008
Figure 9. FT-IR spectrum of mica before and after thiourea adsorption.
Minerals 12 00421 g009
Table 1. Fitting results of the isotherm equations for thiourea’s adsorption on mica and pyrite.
MineralsItemsFitting ResultsParameters
MicaLangmuir equationCe/Qe = 0.5561Ce + 0.0001bQmR2
5.59 × 1031.800.98
Freundlich equationlogQe = 0.2456logCe − 0.244KnR2
--0.57
PyriteLangmuir equationCe/Qe = 0.0405Ce + 37.808BQmR2
1.07 × 10−324.690.73
Freundlich equationlogQe = 0.761logCe − 1.130KnR2
0.071.320.94
Table 2. Kinetic fitting results of thiourea adsorption on mica and pyrite.
MineralsItemsFitting ResultsParameters
MicaPseudo-first-order modelln(Qe − Qt) = −0.00679tQek1R2
1.010.00680.91
Pseudo-second-order modelt/Qt = 0.434t + 6.902Qek2R2
2.300.0270.98
PyritePseudo-first-order modelln(Qe − Qt) = 0.0367t + 0.422Qek1R2
1.53−0.0370.34
Pseudo-second-order modelt/Qt = 0.112t − 0.09Qek2R2
8.93−0.140.99
Publisher’s Note: MDPI stays neutral with regard to jurisdictional claims in published maps and institutional affiliations.

