Review

Applicability of Hydropower Generation and Pumped Hydro Energy Storage in the Middle East and North Africa

by
Shaima A. Alnaqbi
1,
Shamma Alasad
2,
Haya Aljaghoub
1,
Abdul Hai Alami
2,*,
Mohammad Ali Abdelkareem
2 and
Abdul Ghani Olabi
2
1
Industrial Engineering and Engineering Management Department, University of Sharjah, Sharjah P.O. Box 27272, United Arab Emirates
2
Sustainable and Renewable Energy Engineering Department, University of Sharjah, Sharjah P.O. Box 27272, United Arab Emirates
*
Author to whom correspondence should be addressed.
Energies 2022, 15(7), 2412; https://doi.org/10.3390/en15072412
Submission received: 3 March 2022 / Revised: 16 March 2022 / Accepted: 22 March 2022 / Published: 25 March 2022

Abstract

:
Energy storage for medium- to large-scale applications is an important aspect of balancing demand and supply cycles. Hydropower generation coupled with pumped hydro storage is an old but effective supply/demand buffer that is a function of the availability of a freshwater resource and the ability to construct an elevated water reservoir. This work reviews the technological feasibility of hydropower generation and also pumped hydro storage and its geographical distribution around the world. There is also an emphasis on installations in the Middle East and North Africa (MENA) in terms of available capacity as well as past and future developments and expansions. A discussion is presented on a project taking place in the United Arab Emirates (UAE) in the Hatta region, which has a water reservoir that would be fit for utilization for pumped hydro storage applications. Once the project is commissioned in 2024, it will provide an estimated 2.06 TWh per year, helping the UAE achieve the goal of relying on 25% renewable energy resources in their energy mix by 2030. These results were obtained by using EnergyPLAN software to project the effect of utilizing various energy resources to face the expected demand of ~38 TWh in 2030.

1. Introduction

Energy generation in conventional power plants supplies a power level over time known as the base load. The selection of the size and capacity of such power plants depends on statistical and predictive information about the daily, monthly and seasonal load requirements. [1]. This base load value is generally constant, and increasing it would require significant investment if capacity were to be added. This is due to direct expenses from the addition and operation of power units such as steam turbines, gas turbines, and diesel engines [2]. These components are usually connected to electrical generators with alternating power supplied directly into the grid [3]. The utilization of energy storage is shown schematically in Figure 1; storage technologies need to be active during times of low demand while utilities are supplying base load [4].
Energy storage should be an integral part of any power network to provide a balance between projected demand and available capacity [5]. It is a time-dependent buffer that allows operation to continue at base load, charging when base load is higher than the demand and discharging when demand is higher. Storage also helps create and maintain flexible and reliable grid interchanges and operation. Thus, storage is an enabler technology that leads directly to cost savings, improved consistency and flexibility of operation, the utilization of mixed generation sources, and the mitigation of adverse environmental impacts [6]. The emphasis on energy storage requires the exploration and adaptation of various storage technologies [7]. Although electrochemical storage in batteries seems to be the most widely used storage technology, luckily it is not the only one. Figure 2 shows the main categories of available storage technologies, namely chemical, electrochemical, thermal, and mechanical.
Good practice for enhanced efficiency necessitates the proper selection, installation, and operation of storage technologies to match the power/energy source in the required application [8]. The selection of such technologies depends on available budget as well as geographical and natural resources of the chosen site. For example, in concentrating solar power plants, sensible and latent heat storage facilities are available to temporarily store the thermal energy, which will later be also utilized in thermal form to run the Rankine power cycle, or be cycled back to the concentrating collector field [9].
Moreover, and in-line with the topic of this paper, pumped hydro storage (PHS) projects require a height differential as well as abundant water resources. Once these two factors are available, PHS installations provide a quasi-perfect buffer in terms of capacity and fast response, making it the most reliable storage option for countries with proximity and access to water. This is reflected in the data depicted in Figure 3, where the worldwide PHS storage is shown to have a dominating share (96.44%) of the installed storage capacity. This is understandable given the magnitude and physical storage capacity of global PHS installations.
In this study, a demonstration of the importance of hydropower generation and pumped hydroelectric storage technologies is given, with a focus on installations in the Middle East and North Africa (MENA) region. Case studies will be presented from selected countries in the region to highlight how both hydropower and PHS can contribute to the energy mix in each locale. These projects are significant, as the countries in the MENA region either lack generous aquatic resources or the strategic financial means to implement such megaprojects, but nevertheless are interested in pursuing them. A comprehensive collection and discussion of the latest information and numbers on hydropower and PHS is the prime contribution of this study, in addition to highlighting the PHS technology aspirations of the UAE, a country with scarce water resources, presented via EnergyPLAN simulation software. EnergyPLAN is a modeling tool suitable for building a roadmap to having 100% renewable energy resource implementation [11]. EnergyPLAN is designed to conduct a thorough technical and economic analysis of the energy system by taking into consideration various data inputs as well as energy regulations. An analysis is then conducted on the obtained results to visualize the impact of implementing various energy-system strategies. The results of the simulation focus on the effect of the 250 MW PHS storage project on the energy map of the UAE; the country is expected to generate 75% of its energy from renewable resources by 2050. These insights are unique to this study, especially in terms of understanding and appreciating the perspective of a country such as the UAE, that will still be rich in fossil fuels for the next 150 years, and yet is interested in investing in PHS projects despite having mostly dry conditions, except in target mountainous areas. Such information might encourage neighboring countries to follow suit as an investment in a renewable future.

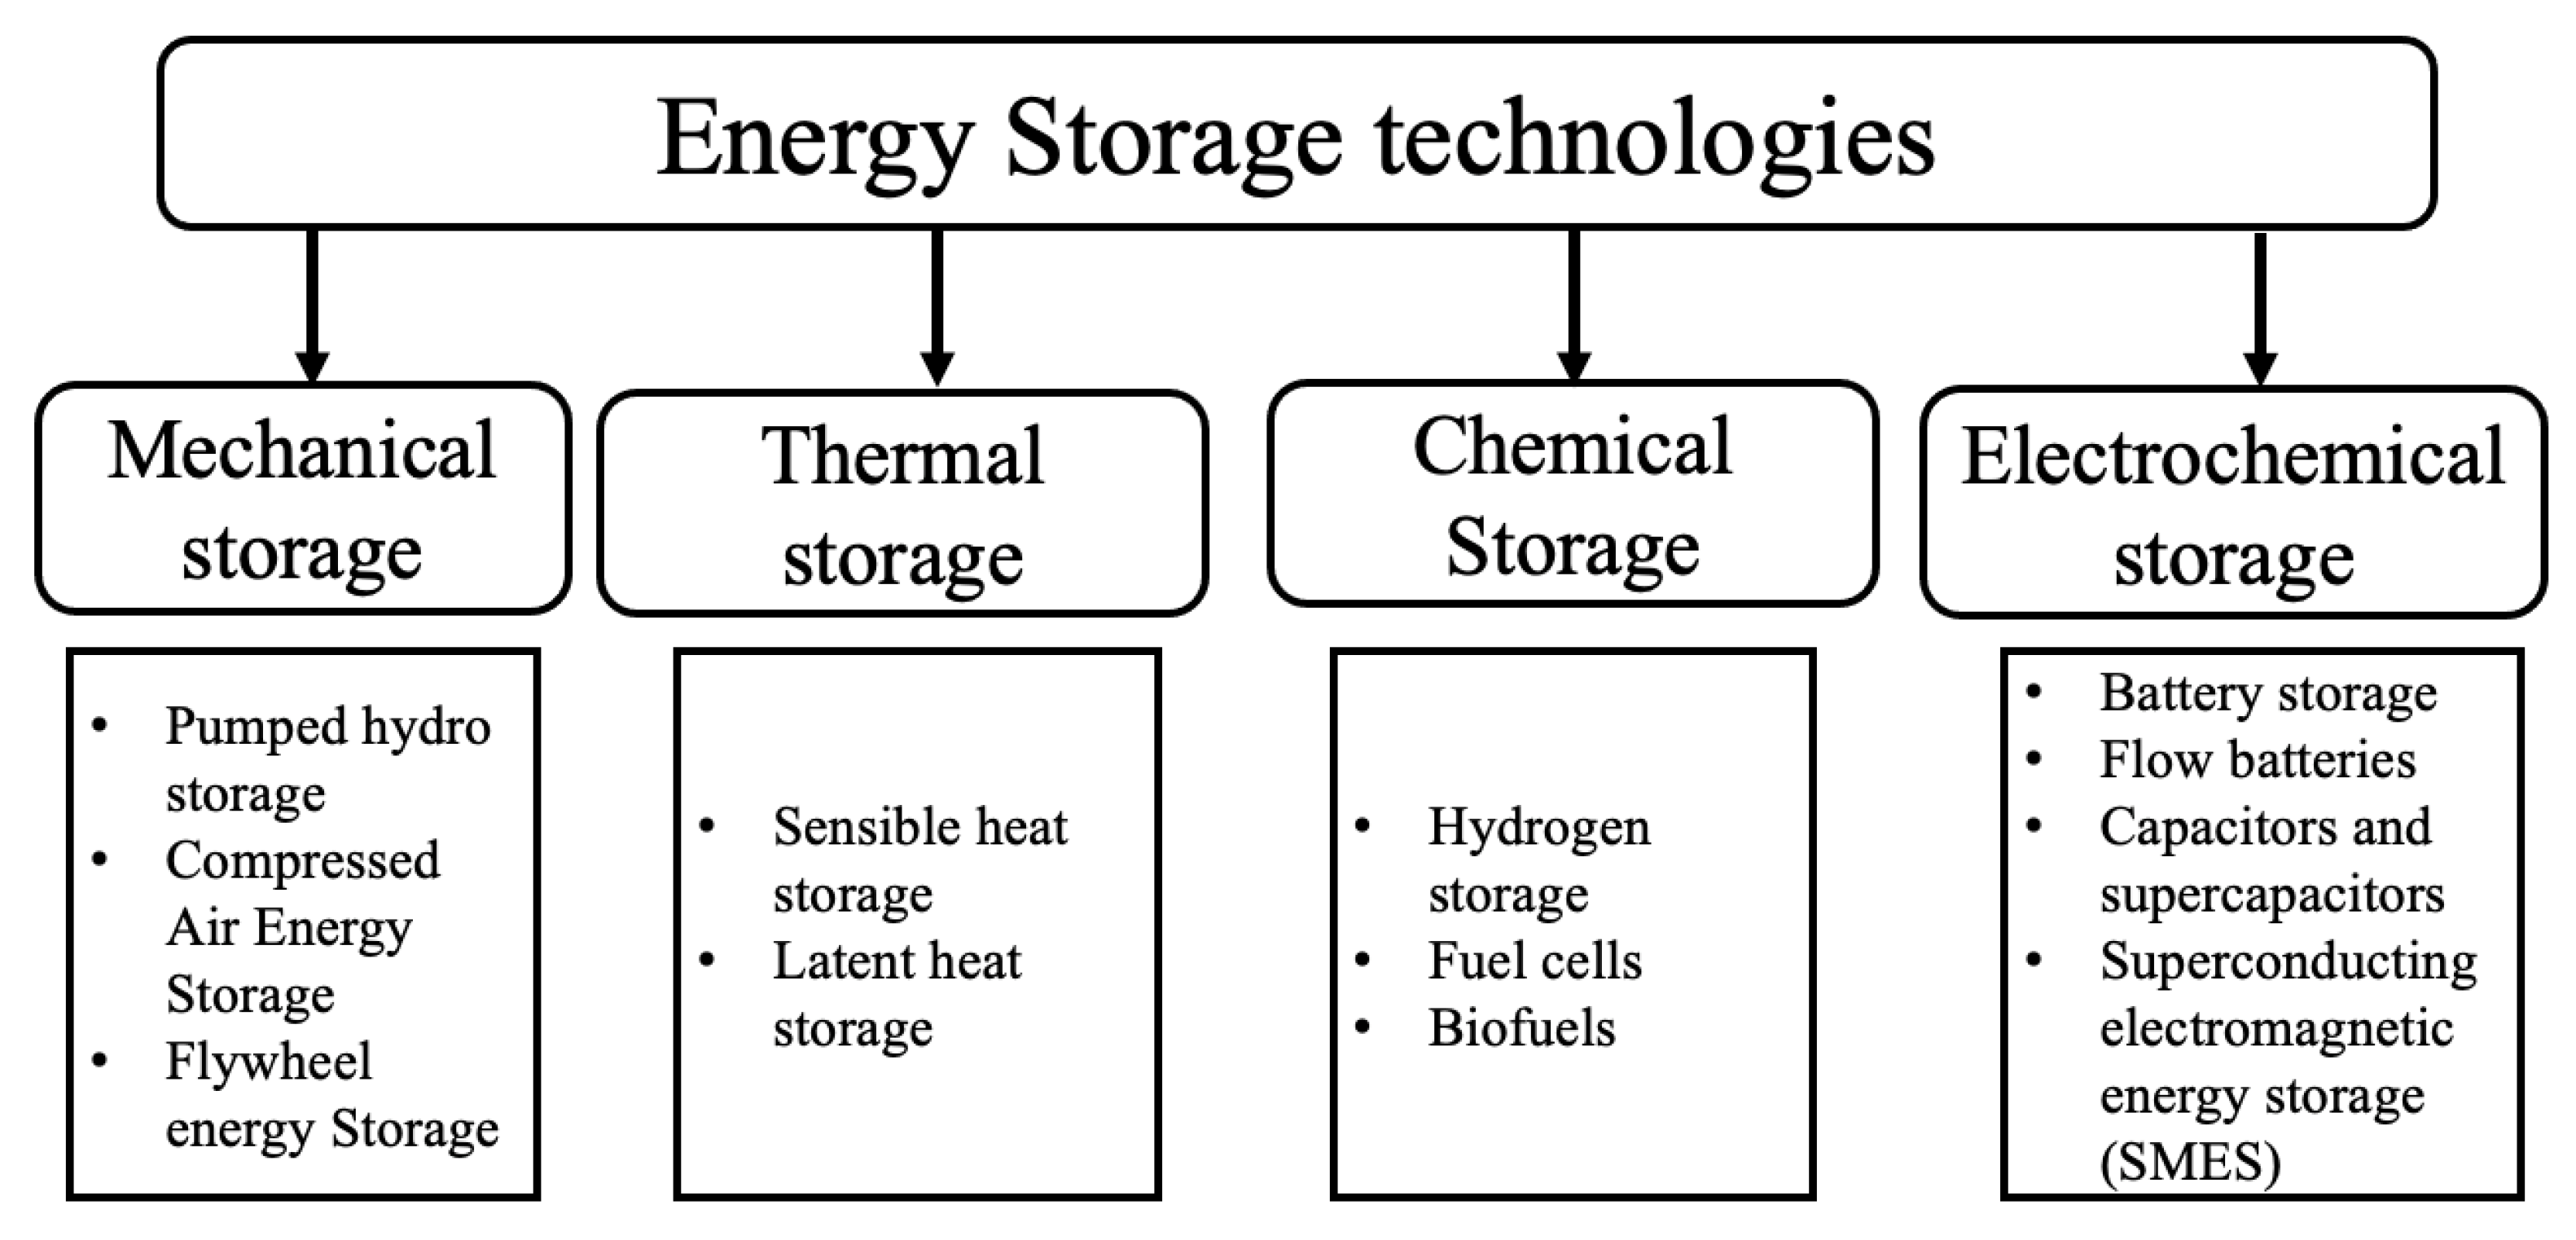
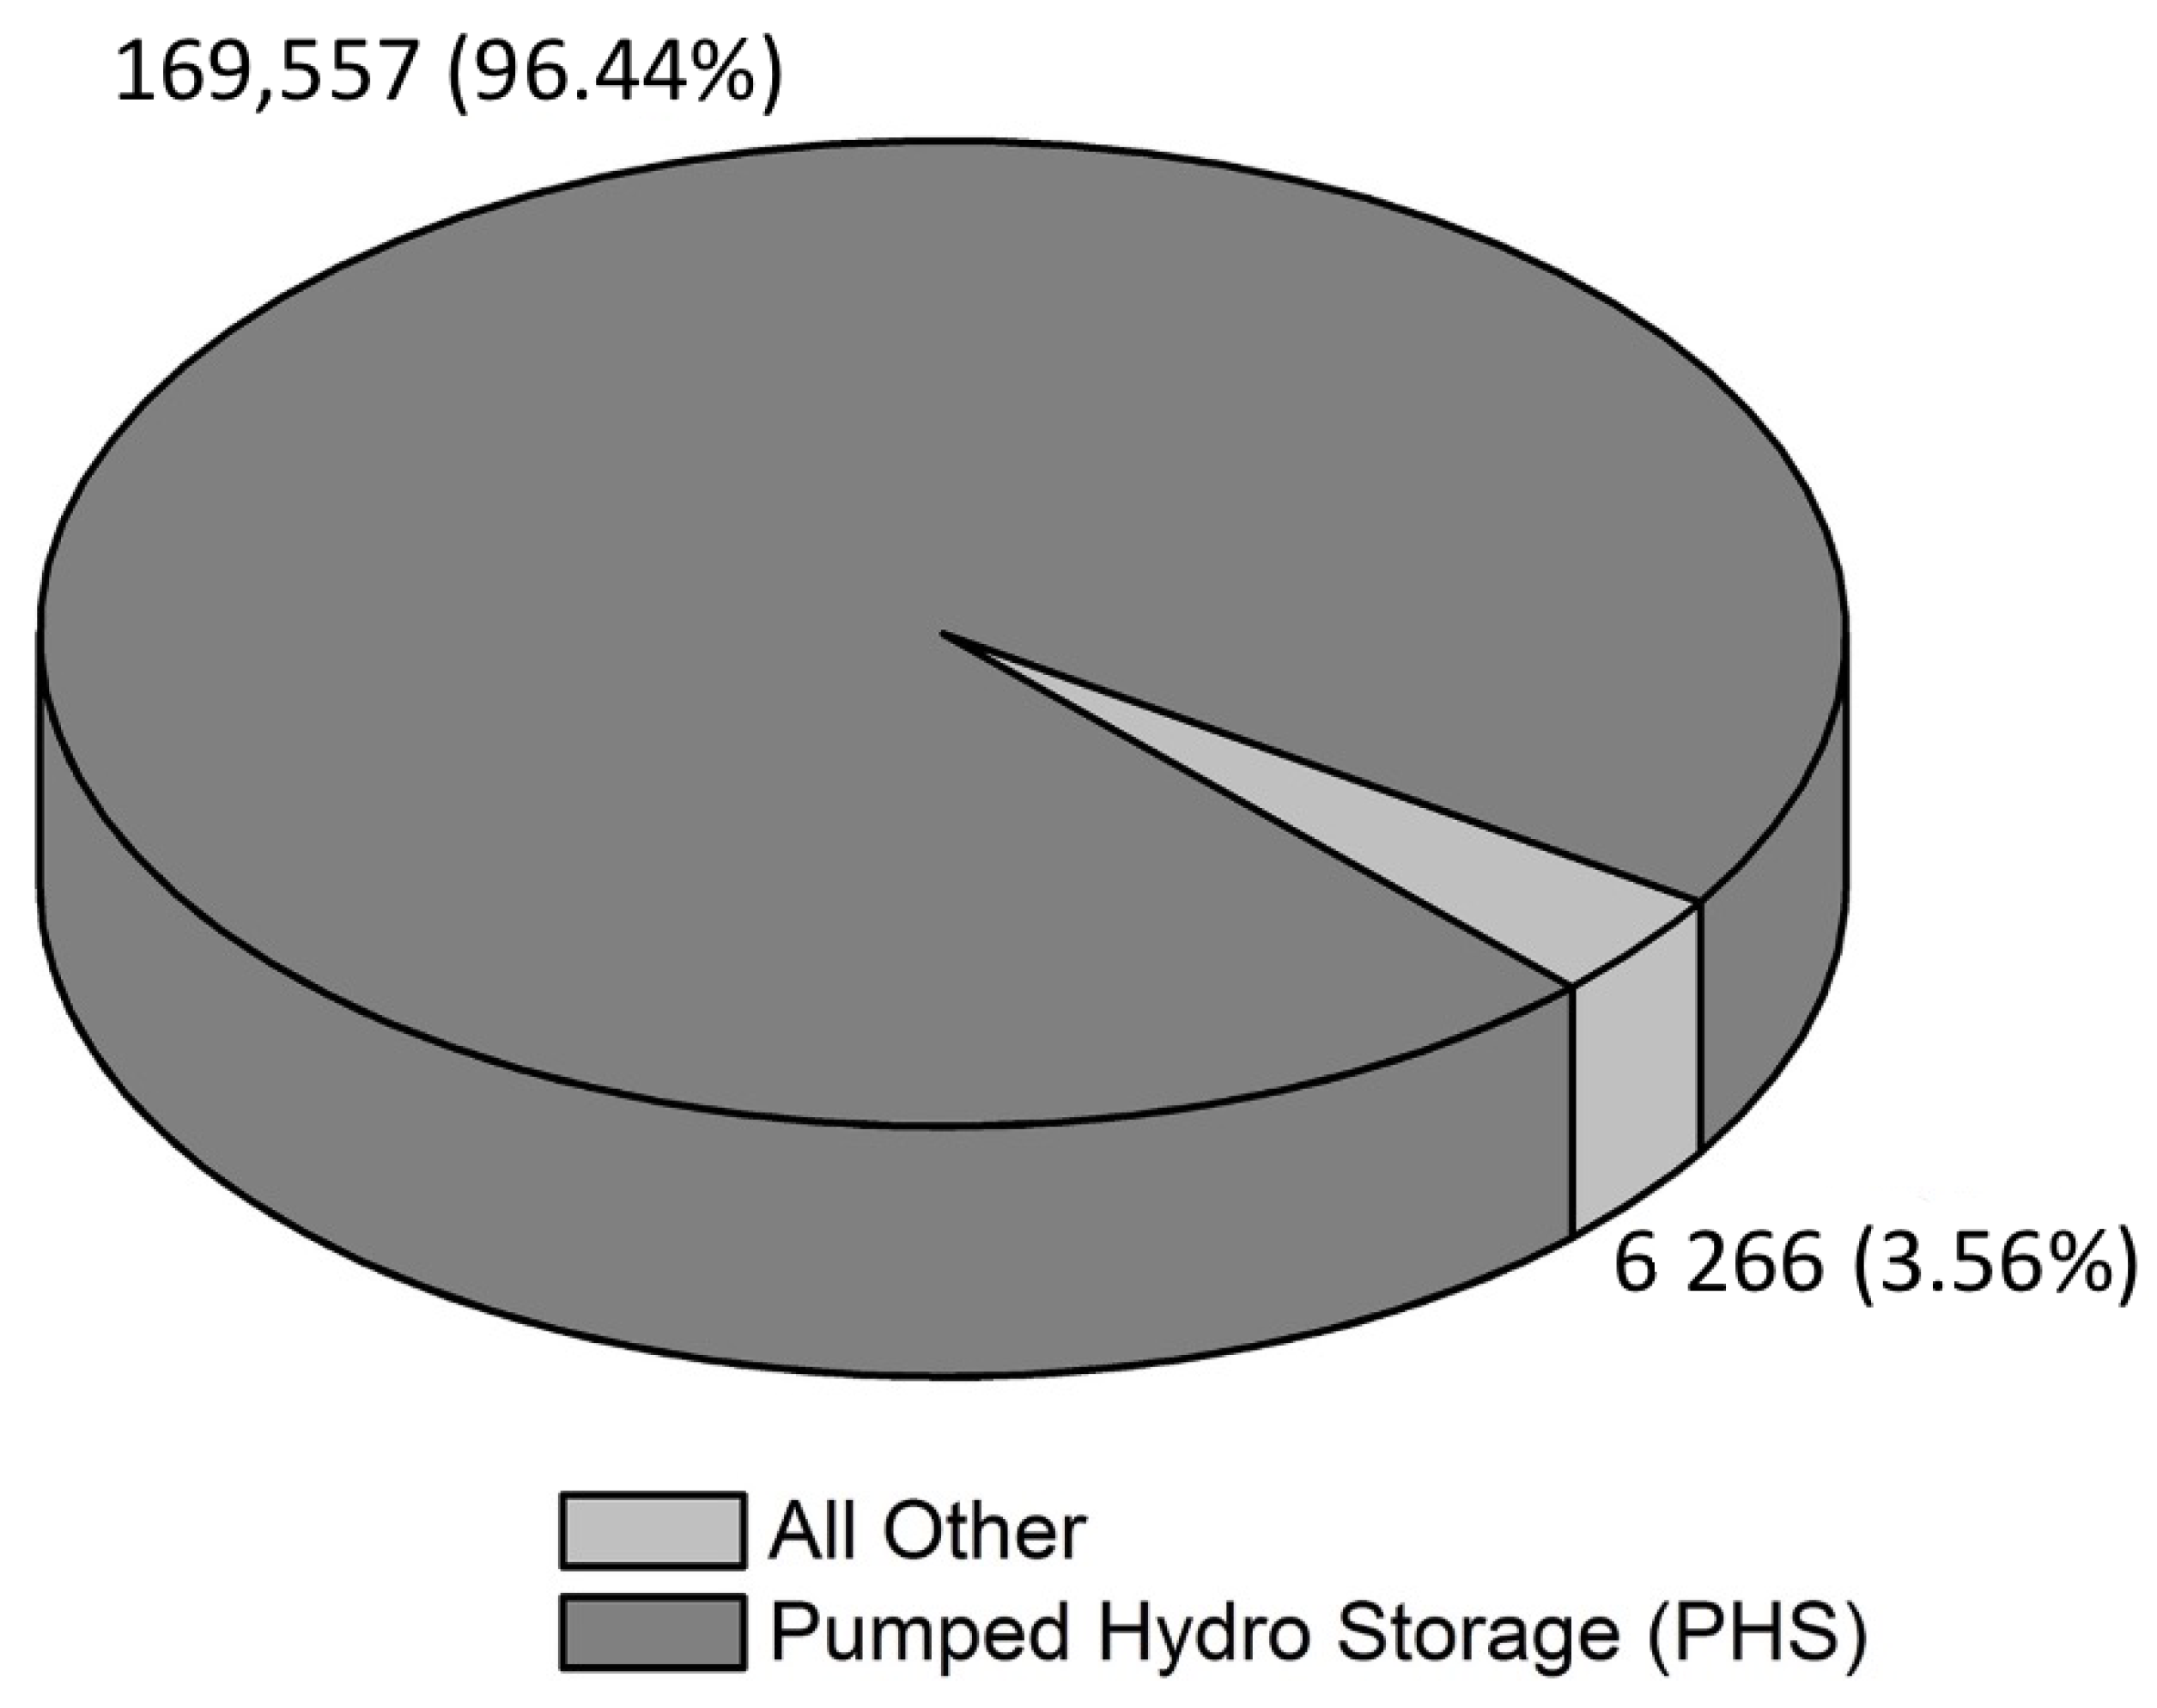
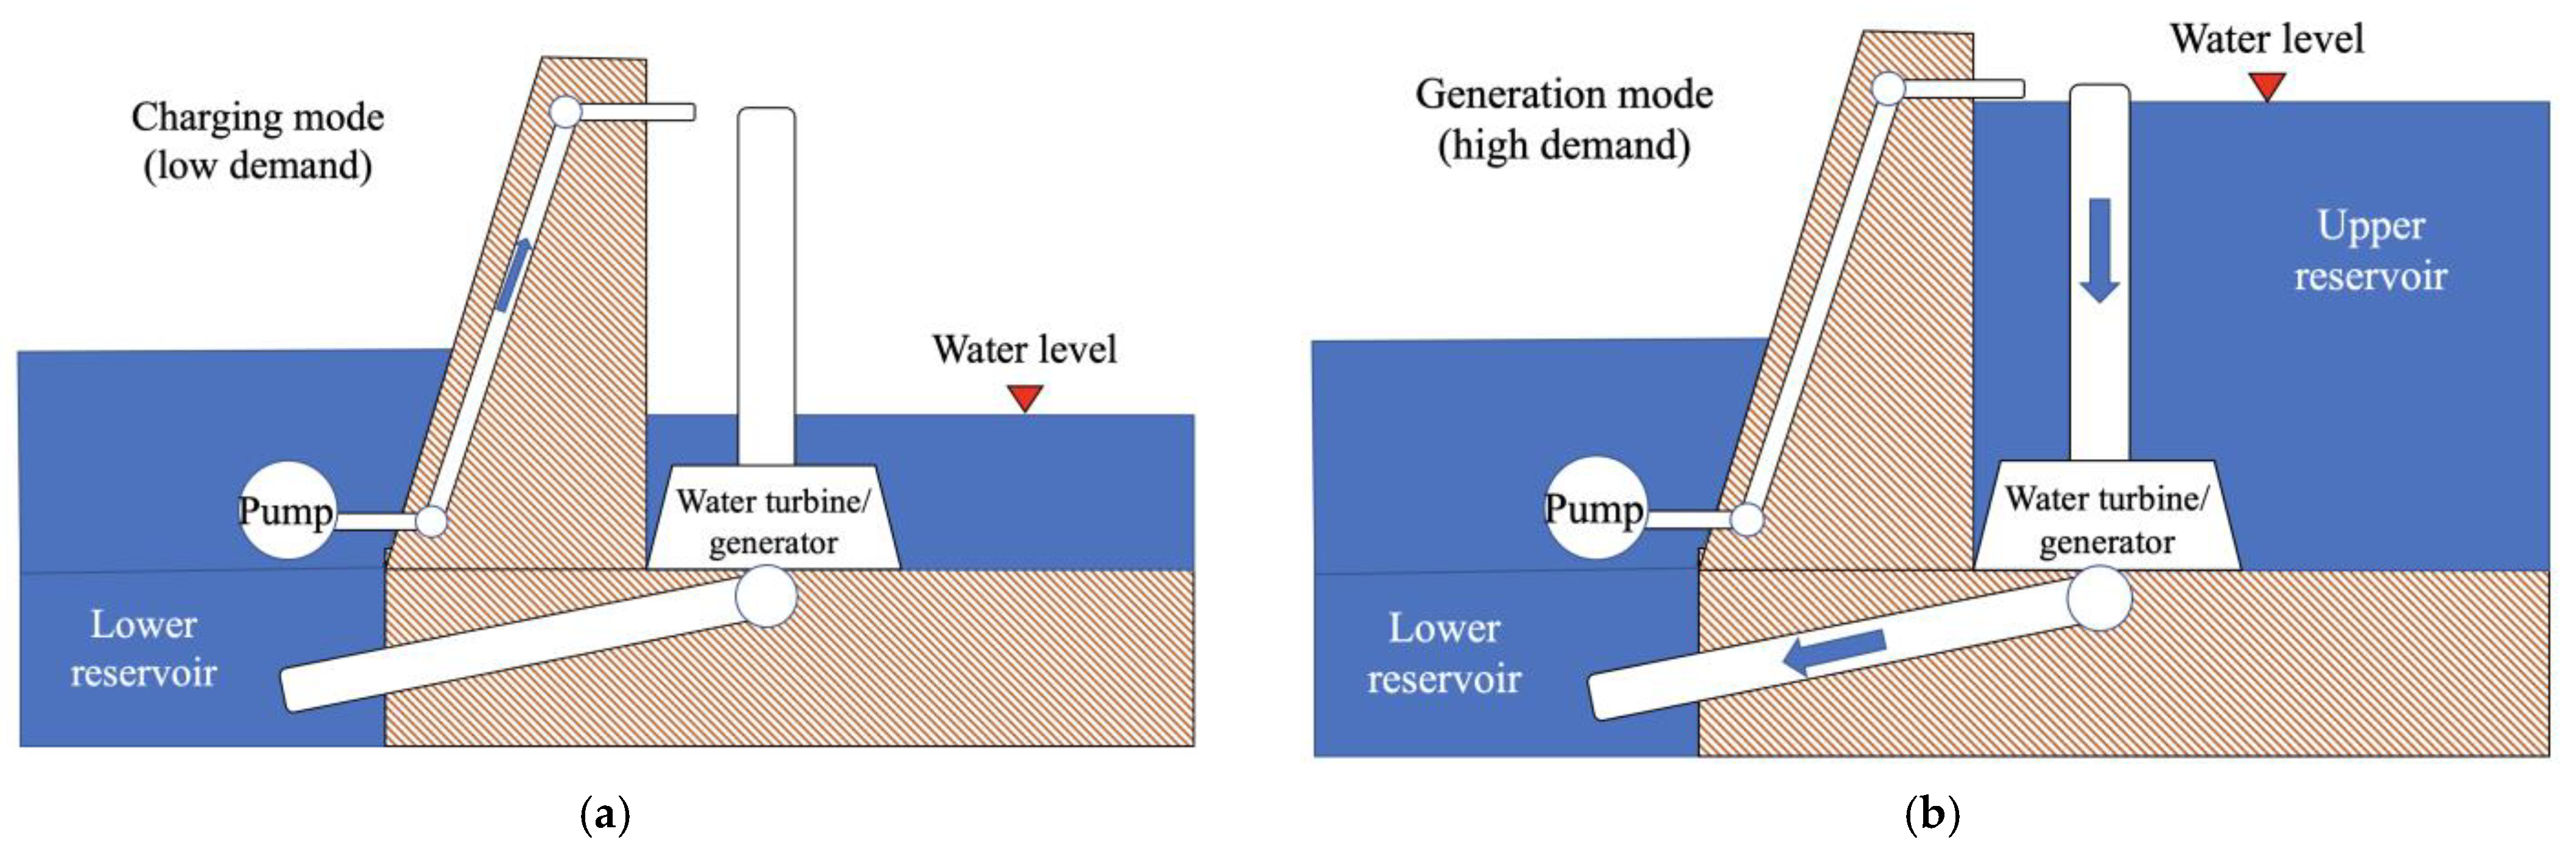
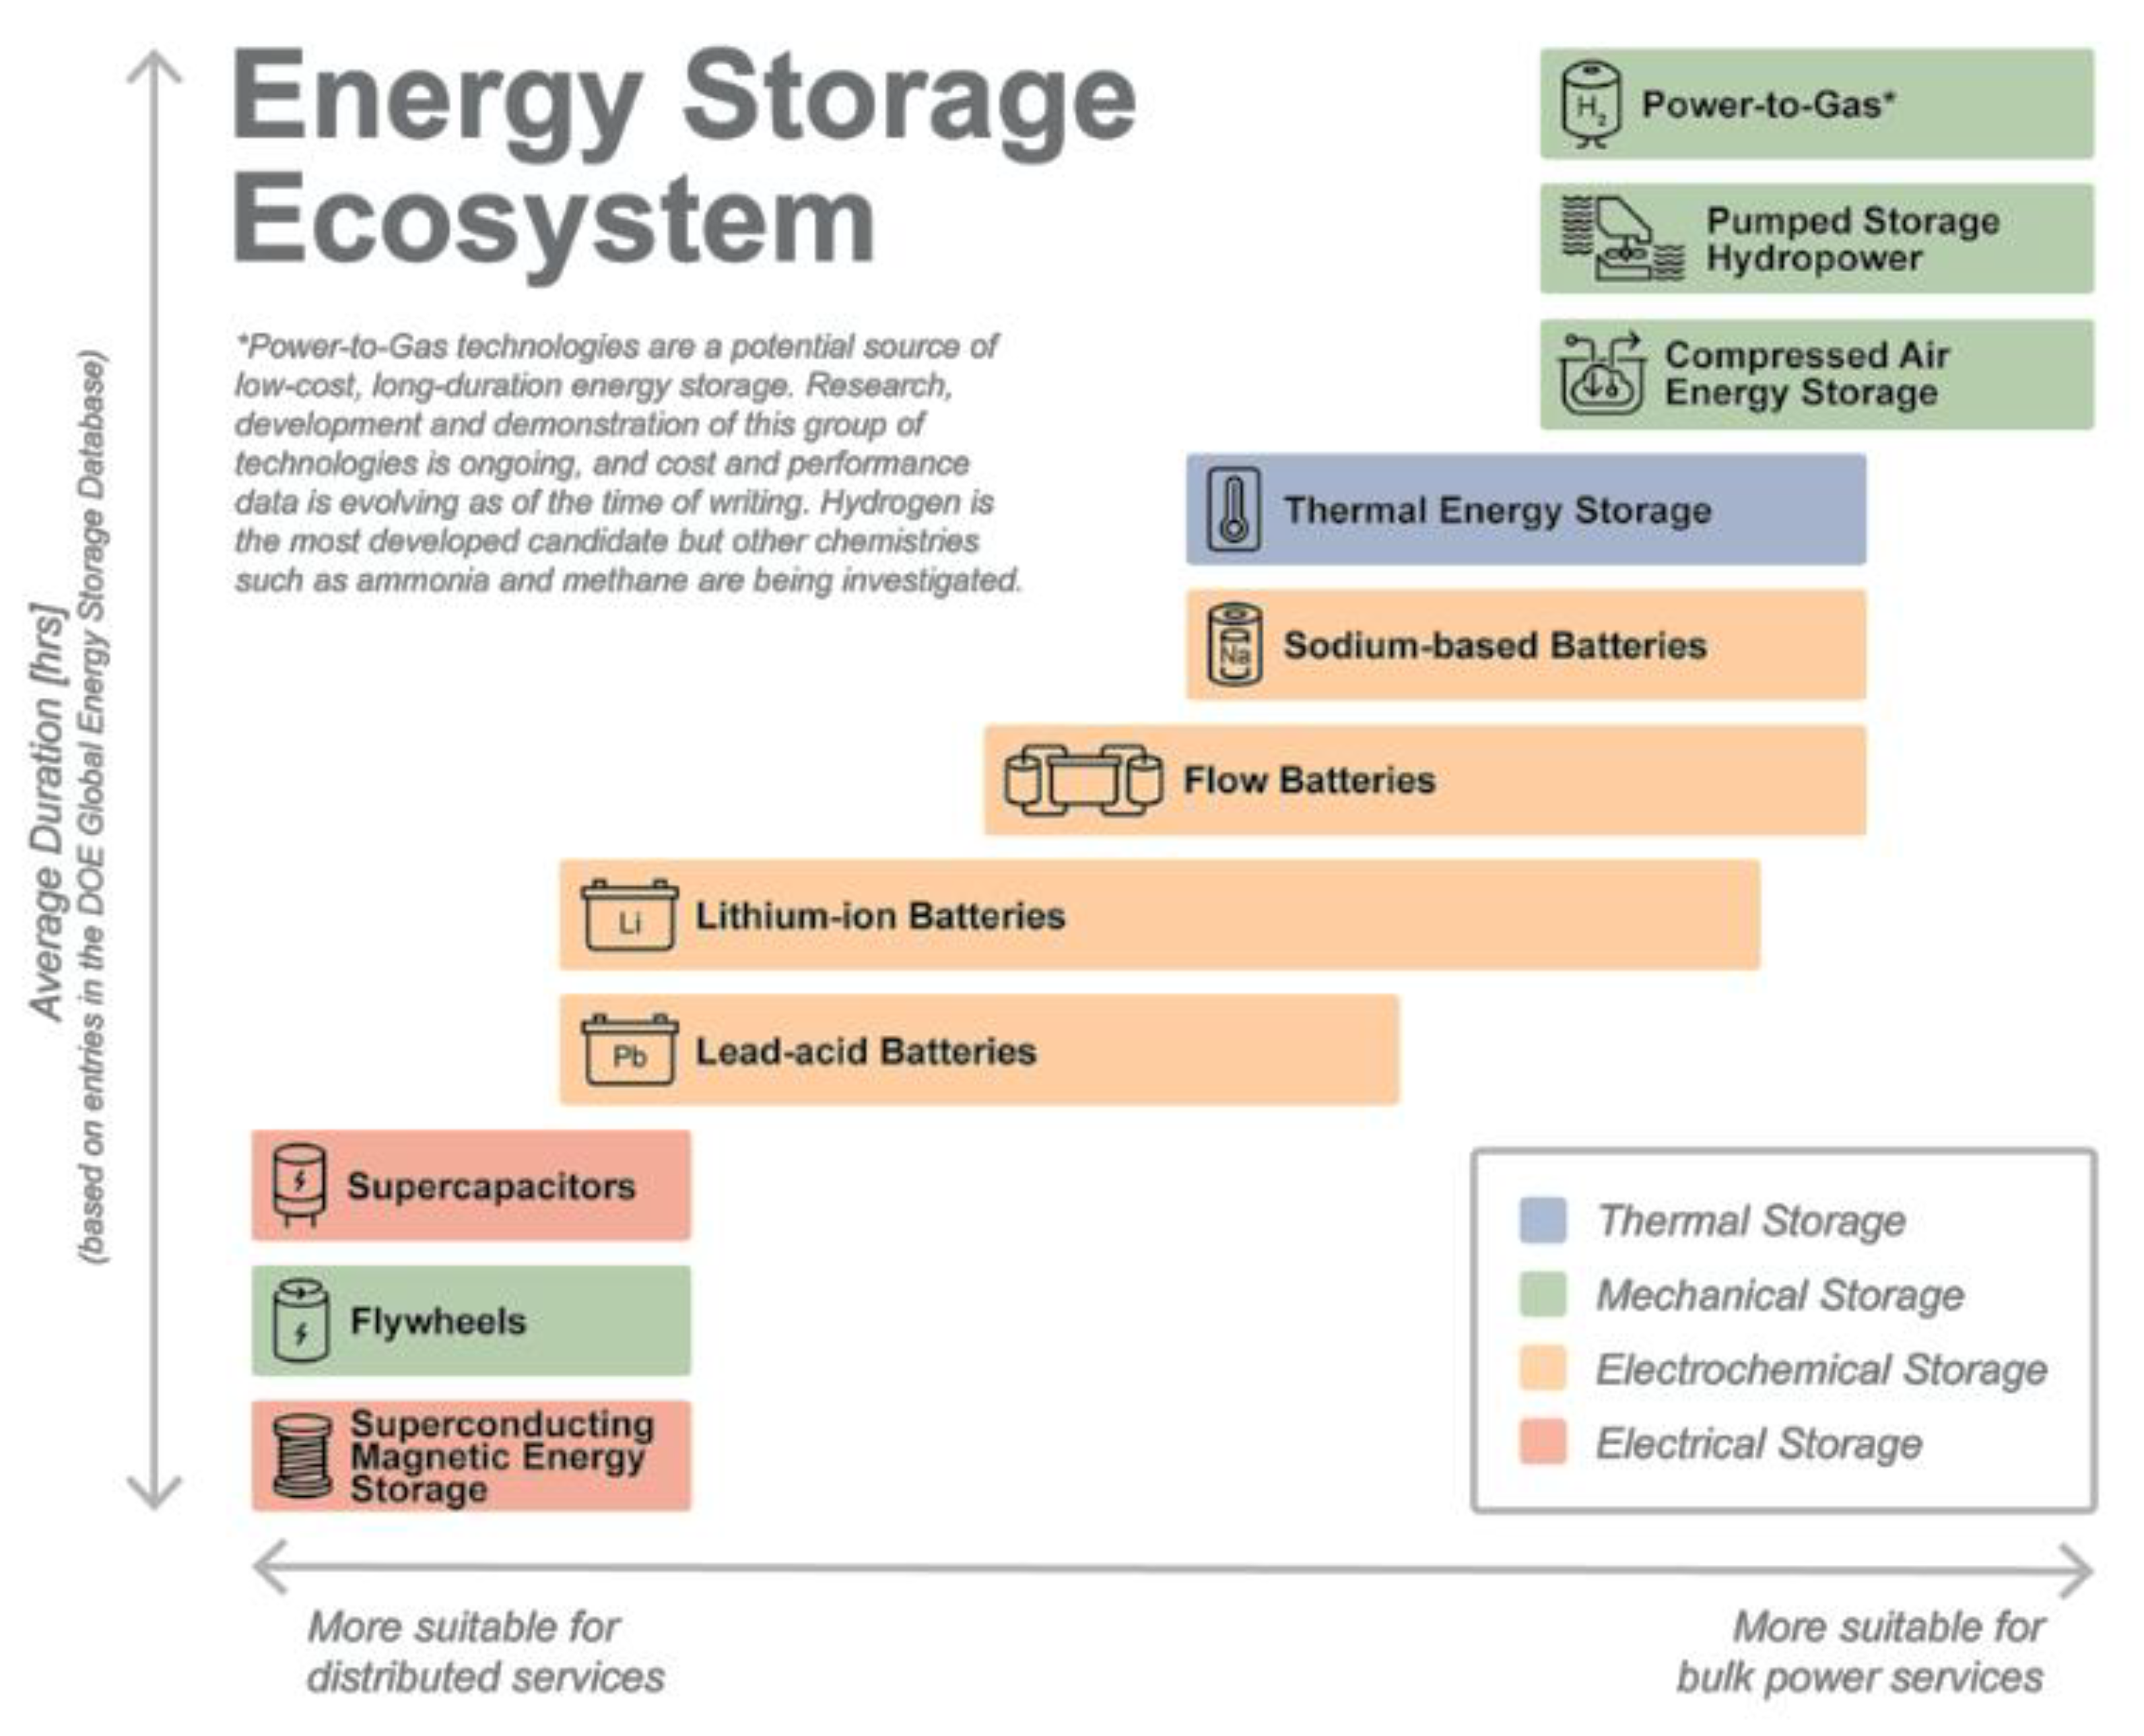
2. Introduction to Hydropower and Pumped Hydro Storage

In view of grid-scale energy storage (or large-scale energy storage), pumped hydro storage provides the scale and capacity to readily absorb grid fluctuations [12]. The storage operation requires two water storage reservoirs, water turbines and water pumps; usually the power required from the pumps are smaller than that extracted from the turbines. The two reservoirs are located at a height differential which is proportional to the amount of energy stored. Energy is generated when water flows from the upper reservoir towards the lower one (discharge mode), and by turning the water turbine by virtue of the conversion of the sizeable water head. The coupled electrical generators are responsible to generate electrical power that is fed to the grid. When demand is low, surplus grid power is used to operate the pump (charge mode), driving water to the upper over the entire period that the demand is low and supply exists [13]. Figure 4a,b depict the charge and discharge processes, respectively [14].
The operational flexibility of PHS systems can be described in two ways: (i) an open loop operation where there is continuous hydrological contact with a natural body of water; or (ii) closed loop operation where the tanks are not connected to an external body of water. In the latter type, the low-cost, spare electrical power is used off-peak to operate the pumps. Just like any energy conversion device, there are losses that occur during pumping and generation processes, making the plant a net energy consumer in general. On the other hand, its increased revenues come from selling more electricity during periods of high electricity demand. Moreover, if an upper lake (reservoir) is capable of collecting reasonable amounts of rain, or is fed by a river, then the production may be net energy similar to a conventional hydroelectric plant [15]. In 2017, dammed hydroelectricity was the largest form of grid energy storage, plus conventional hydroelectric generation with pumped storage hydroelectricity. The continuing advancement of technology has allowed commercially viable enterprises to store energy during peak production and release during peak demand, and when production drops unexpectedly to allow time to move slow response resources. There are other alternatives to grid storage: the first is to use peak power plants to fill the supply gaps; the second is the demand response to shift the load to other times, yet another inter-area power transaction [16]. In 2020, the US Department of Energy’s Global Energy Storage Database reported that PHS accounts for about 95% of all storage facilities globally and is the largest form of energy storage in the grid. The energy efficiency of PHS is between 70% and 80%, and it may sometimes reach 87% [17]. Table 1 presents the general advantages and disadvantages of PHS technology.
For a particular site to be favorable for pumped storage hydropower, there are some key technical considerations to be assessed [14]. They include:
  • Topographic conditions that provide sufficient water head between upper and lower reservoirs;
  • Strong geotechnical sites where no avalanches or landslides are expected;
  • Availability of sufficient quantities of water;
  • Access to electrical transmission networks.
The minimum practical head for an f-stream pumped storage project is generally around 100 m, with higher heads being preferred. Some projects have been built with heads exceeding 1000 m, necessitating the use of separate pumps and turbines for the pumping and generation operations, respectively, or the utilization of multiple-stage pump/turbines to minimize operational losses resulting from equipment overload. The volume of water available is also an important factor, and hence there is need for a permanent and dense water supply to back up the system operation.
By observing worldwide growth in power generation projects, hydroelectric power generation is gradually becoming more prominent, with new capacity added to the installed capacity every year. The increase was around 2.3% in 2019 from the 2018 statistics of the total global generation estimated at 4306 TWh [18]. Naturally, this growth is governed by changing weather patterns and other environmental operating conditions that affect availability and the volume of water bodies that PHS relies on. Figure 5 shows the hydropower capacity globally, with countries such as China having one third of the worldwide share. Brazil electricity production from hydropower has reached ~9% in 2019, which is understandable given access to the Amazon and the amenable topography of the nation. In addition, the total projects in the country produce about 4.95 GW, which is equivalent to one-third of the global additions of hydropower production. Hydropower production remains stable (without increasing or decreasing) somewhat in its level of production, and has not changed since 2018, providing approximately 70.5% of the country’s electricity supply. The electricity production of Canada and the United States amounted to about 7% each from hydropower sources [1].
As an energy storage technology, pumped hydro storage combines many attractive traits that augment the simple comparison of Table 1. In a recent (July 2021) report by the National Renewable Energy Laboratory (NREL), PHS charge/discharge cycles were found to take from several hours to days, with a reaction time from several seconds to minutes, and a round trip efficiency of more than 80% [19]. The report showed that PHS systems (the upper right-hand corner in Figure 6) absorb all supply/demand discrepancies with ease.

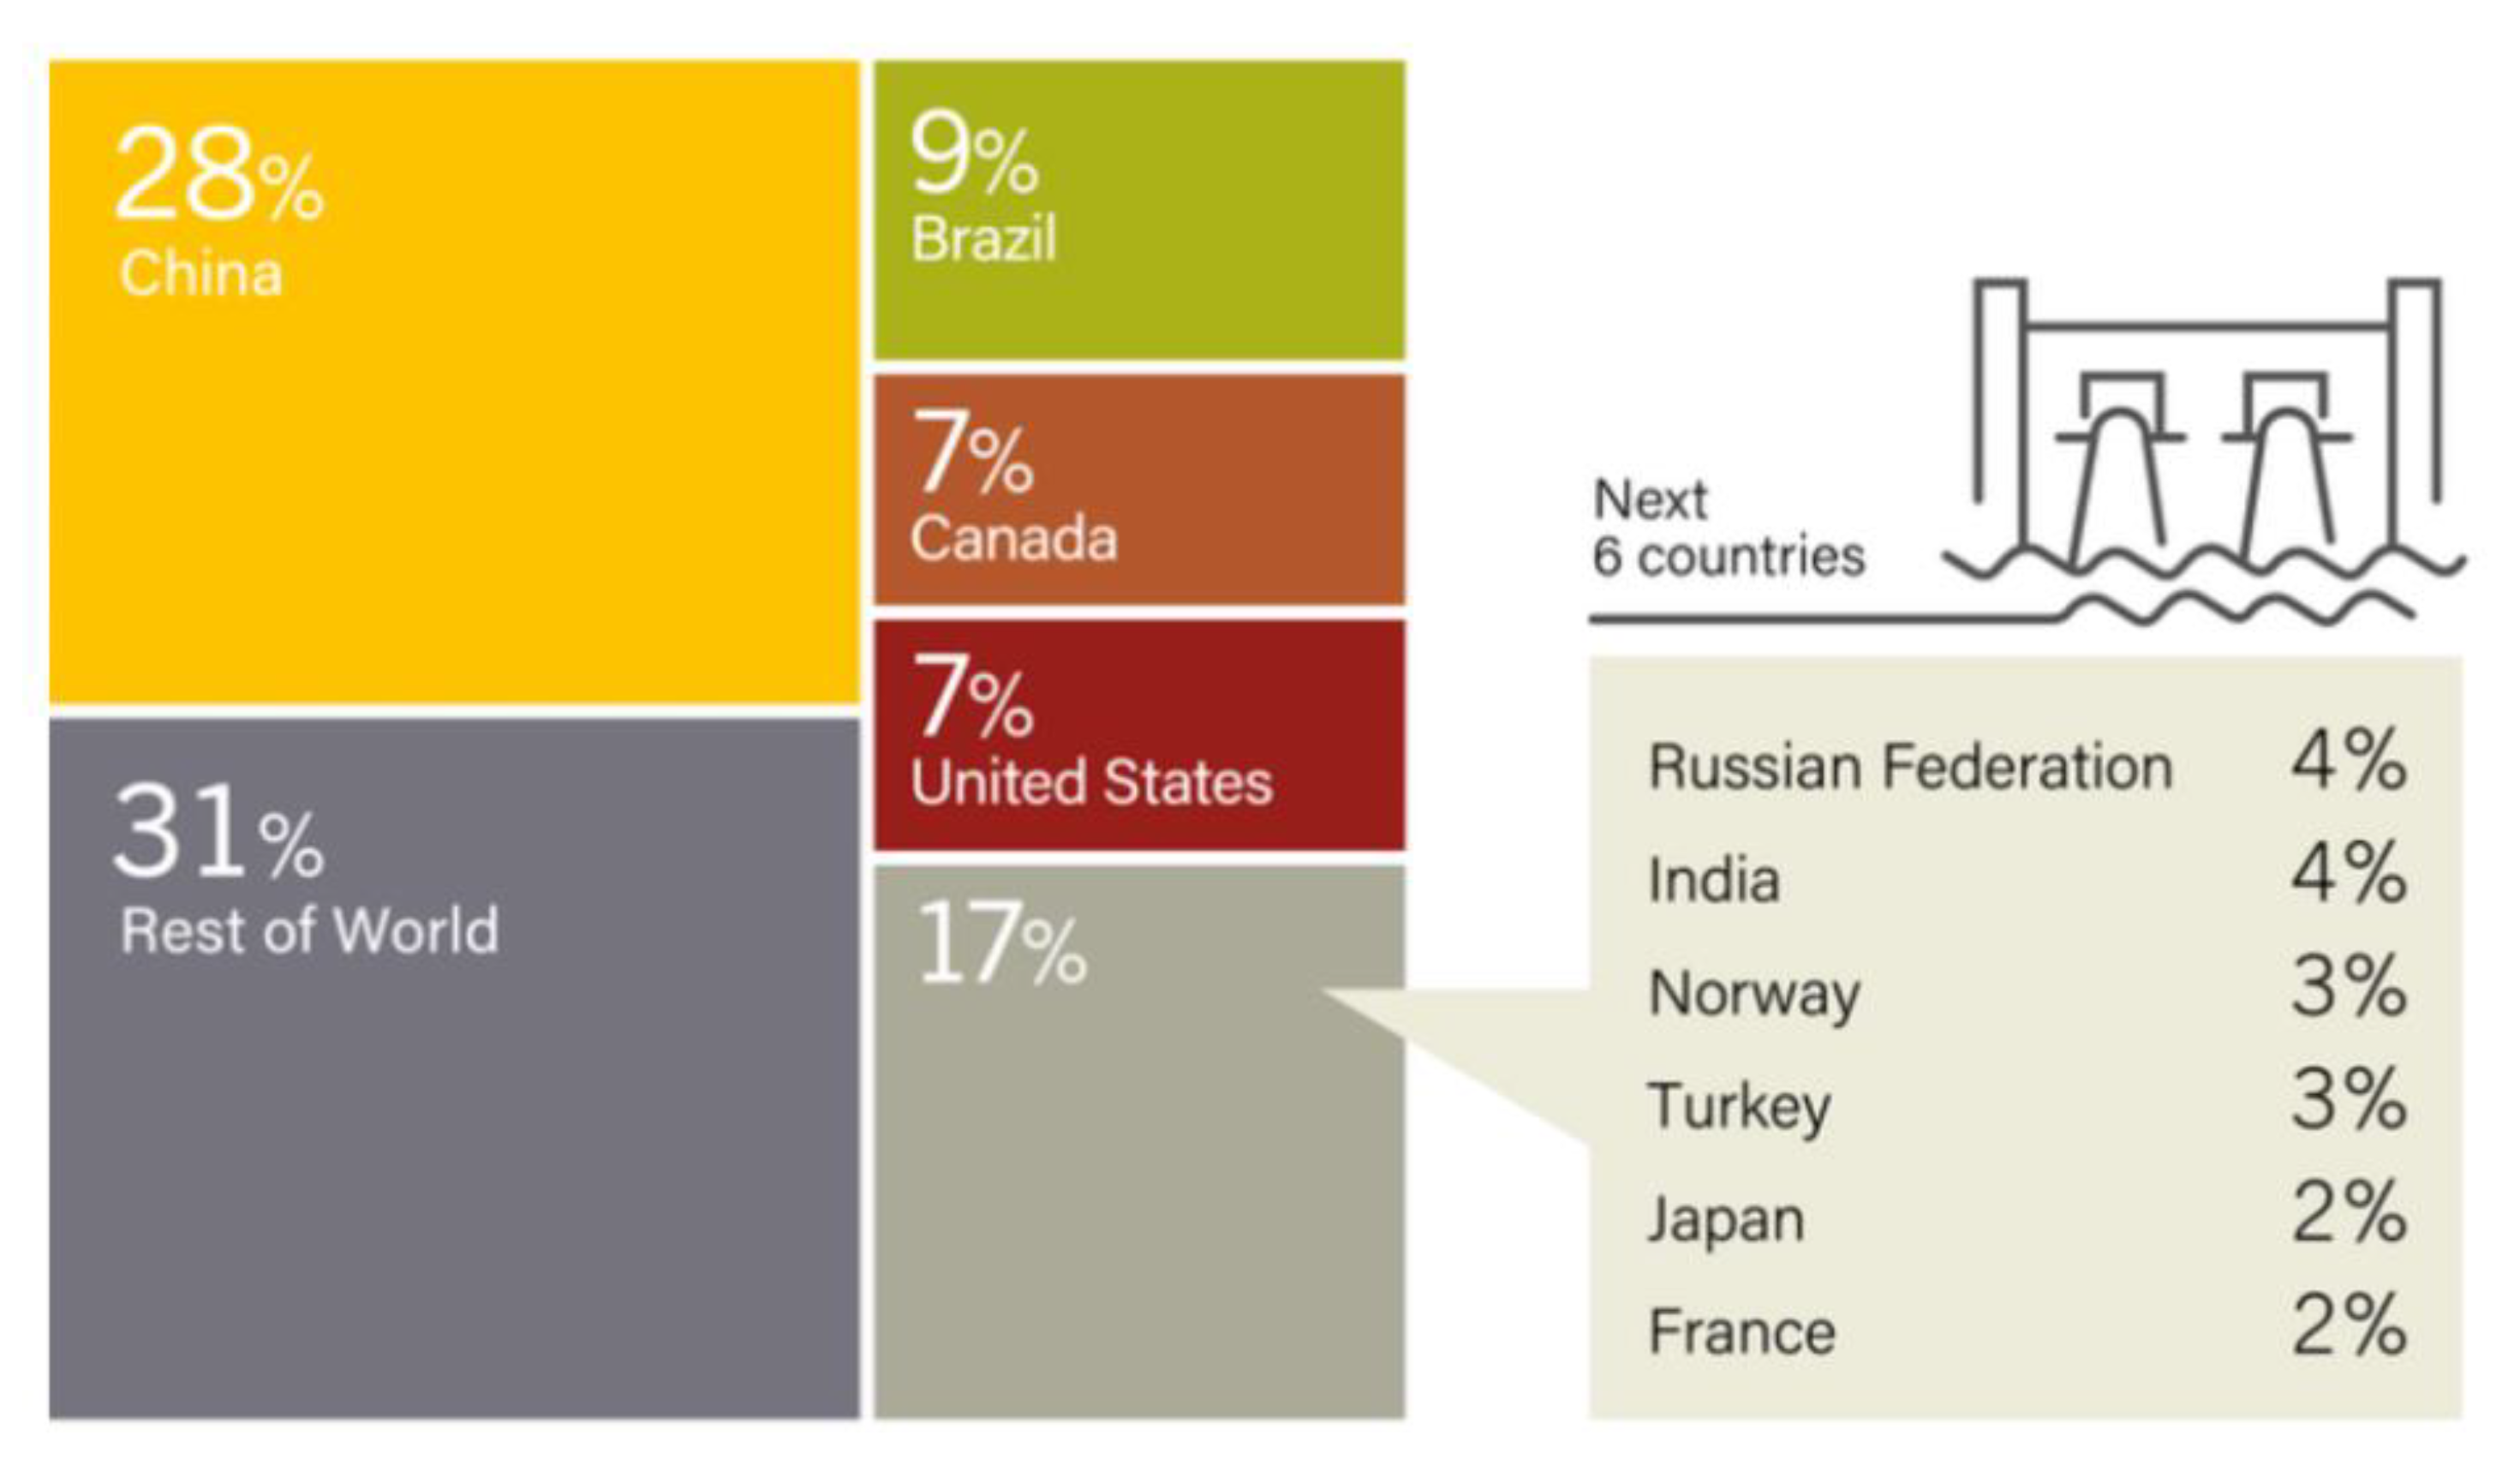
3. Global Hydropower Projects

Pumped hydro storage systems are responsible for supplying 95% of the global electrical energy storage power capacity (GW) and 90% of the world’s energy storage (GWh) [20]. However, despite these advantages, various researchers turn a blind eye to pumped hydro and presume that pumped hydro lacks future development [21]. This limited attention towards pumped hydro storage systems is due to the geographical needs that limit the development of pumped hydro systems to areas near river valleys. This challenge is tackled by closed-loop pumped hydro storage systems, also known as off-river pumped hydro storage systems, which are placed away from rivers. Closed-loop pumped hydro systems contain small upper and lower reservoirs placed on hills away from rivers. The water circulating between the upper and lower reservoirs is continuously recycled between the reservoirs. Hence, water is supplied solely from the gap created from the occurrences of evaporation and rainfall. Globally, about 61,600 locations were identified as potential closed-loop pumped hydro storage sites. These 616,000 sites can potentially supply a storage capacity of about 23,000 TWh. For instance, the Ffestiniog Power Station is a closed-loop pump hydro storage system located in Wales, away from rivers. Moreover, in the United States, the Raccoon Mountain is a closed-loop pumped hydro storage system which does not utilize river water for energy generation [20].
It is interesting to note that, for some countries that appear in Table 2, relying on conventional hydropower generation would score them a lower capacity in the pure pumped hydro storage statistics (see Table 3). These countries’ need for storage could be less significant than the amounts generated by hydropower. For example, consider Canada: they have generated 81,058 MW of power, while having provisions for only 174 MW in PHS, due to the continuously flowing falls in Niagara, and have historically created transmission challenges rather than storage challenges for the country [14].
Table 2 shows hydropower capacity production in MW from 2010 to 2020 for different continents, highlighting countries with the highest capacity projects.
The importance of the data presented above for the MENA region can be emphasized by noticing that, for example, between 2010 and 2020, Egypt had the highest growth in hydropower projects among African countries, being a host of the River Nile. Other countries in Africa, such as the Democratic Republic of the Congo and, in 2016, South Africa, are following suit. From 2017 to 2020, Ethiopia had the highest growth, and production amount remained constant until 2020, when capacity was 4071 MW with the introduction of their latest hydropower projects and the accompanying dams. In 2018 and 2020, South Africa was the second country after Ethiopia, and Egypt was the third. We also note that the production capacity of Egypt has been stable over the past ten years, and is about 2851 MW. Looking at Asian countries, from 2010 to 2019 China topped the largest production capacity. Its peak in 2020 was about 371,160 MW, followed by India with 50,680 MW. Moving to European countries, from 2010 to 2020, Norway was the highest producing country, followed by Italy, with production capacities of 33,003 MW and 22,448 MW, respectively. Coming to Eurasia, from 2010 to 2020, the Russian Federation was the highest in capacity, followed by Turkey, with 51,811 MW and 30,984 MW, respectively, in 2020. Looking at North America, from 2010 to 2020, the United States was the highest in capacity followed by Canada and then Mexico, scoring 103,058 MW, 81,058 MW, and 12,671 MW, respectively, in 2020. Regarding South America, from 2010 to 2020, Brazil was the highest in capacity, followed by Venezuela, with 109,318 MW and 16,521 MW, respectively, in 2020 [22]. Figure 7 depicts the area (in blue) defined as the MENA region.
These statistics highlight the importance of this technology on a strategic scale to achieve energy security for these regions. The technology is environmentally friendly and clean while also providing adequate flood control for the neighboring agricultural societies [24]. These installations can also be coupled with renewable energy resources that not only enhance the reliability of operation but also reduce the strain on the grid at times of high demand.
The following sections will focus on major projects of the MENA region, as its countries are striving to possess a diverse energy mix. Some of these countries would not consider pumped hydro storage projects feasible, as they have access to major rivers that are not likely to run out, such as the Nile, hence resulting in the virtually stagnant statistics from countries such as Egypt. Other countries in the Arabian desert, such as the United Arab Emirates, have ambitious PHS projects that sound contradictory to their water status, but are important for energy security in the future.

4. Case Studies of Projects from the MENA Region

4.1. Ethiopia Hydropower

Ethiopia is one of the countries that is rapidly advancing in energy infrastructure, especially hydropower, with plans for new dams to be commissioned by 2025. Since 2011, Ethiopia has implemented a flexible climate green economy strategy which, in turn, replaces the country’s traditional development by harnessing sustainable green energy such as hydropower, wind energy, geothermal energy, solar energy, and biomass. The country’s first growth and transformation plan for 2010 aimed to quadruple the installed capacity by prioritizing large water developments (due to their abundance) and achieving the required total installed capacity, with the government announcing that hydropower will eventually account for about 90% of the energy supply. Ethiopia has abundant water resources that are distributed across eight major basins which have an exploitable hydropower potential of 45,000 MW [25]. More than half of this potential is located in the Abay and Omo River Basins. In 2010, the Tana Beles hydropower plant located in the Amhara region using the Lake Tana water source was the largest hydropower plant with a capacity of 460 MW and a cost of investment of USD 500 million. The underground powerhouse contains four Francis turbines, each with a capacity of 115 MW for a 460 MW total installed capacity. The maximum flow rate is 16 m3/s, and the minimum flow rate is 77 m3/s. The generated power is at maximum for only five months, following the rainy seasons in Ethiopia; for the rest of the months, it produces less than half of the maximum capacity. In summer season there is a great reduction in capacity, and the energy demand reaches its maximum. Hence, the available power is not enough to deliver the demand of the grid [26].
The idea of the large Grand Ethiopian Renaissance Dam (GERD), which was completed with a capacity of 6000 MW, emerged after 2009, using the river’s flow rate of nearly 1541 m3/s of the yearly water discharge. The aim of the dam was to build a reservoir covering a capacity of about 74 billion cubic meters (BCM) of water at complete fill-in level [27]. Moreover, the recently completed Gibe III Project has a capacity of 1870 MW. In 2016, Gibe III, the longest compressed concrete dam in the world, was opened with a height of 246 m and a peak length of 630 m. The construction was funded by an estimated USD 1.8 billion from the Ethiopian government (40%), with the rest financed by Exim Bank (60%) [28].

Future Project in Ethiopia

Table 4 shows a list of all Ethiopian interconnected system (ICS) power plants that were developed and run by the Ethiopian Electricity Corporation (EEP) in 2017. Included in the table is the Grand Renaissance Hydropower Project (GRHEP), previously known as the Millennium Project for Ethiopia, located on the Blue Nile River in the state of Penchengul Gumuz. The project will be the largest of its kind for hydropower in the African continent, and also the largest power plant under implementation in the world with an installed capacity of 6450 megawatts. It is located 750 km northwest of the capital, Addis Ababa, and 40 km from the borders of its neighbor, Sudan. Construction of the hydropower project began in 2011, with a value of USD 4.5 billion. The Ethiopian government also implemented the project through the Ethiopian Electricity Corporation (EEP). The project will generate 15,128 GWh of energy annually upon operation, which amounts to approximately four times the country’s current electricity generating capacity [29]. Water security is a significant side benefit of this major project, which will provide not only water storage for irrigation, but also flooding control under the highly unpredictable weather conditions that vary between draught and heavy rains due to the erratic weather conditions caused by global warming [30].

4.2. Egypt

Egypt’s production in 2011 was about 156.6 TWh in total, of which 12.9 TWh came from hydropower generation, as seen in Table 5. In 2012, the per capita consumption of electricity was about 1910 kilowatt hours/year, and the potential of hydropower in the same year was about 3664 megawatts. Most of the sources for generating electricity supply in Egypt are thermal and hydropower plants. Egypt has number of actual hydroelectric power stations, as described below.

4.2.1. Aswan Low Dam

Also called the old Aswan Dam, built between 1899 and 1902, the Aswan Low Dam is a dam based on gravity on the Nile River in Aswan, Egypt. This dam was built at the former first waterfall at the Nile River, where it is located at an altitude of 1000 km above the river. The aim of building the dam was to store annual flood water, which has a role in contributing to support the irrigation process as well as population growth in the area. These heights still did not meet the irrigation requirements of the area, and it was overtaken in 1946 in an attempt to increase the altitude. As a result, this led to the construction of the Aswan High Dam, 6 km from the source [45].

4.2.2. Esna Dam

The Esna Hydroelectric Power Plant is located in Esna, Egypt. The plant was designed with a capacity of 86 MW and contains six units, all of which were commissioned in 1993. The operation of the plant is controlled by the Ministry of Water Resources and Public Works [46].

4.2.3. HPP Assiut

For the Andritz Hydro project, the first equipment was delivered in the early 1920s. Since then, Andritz Hydro has delivered or rehabilitated around 45 units with a total capacity of around 700 MW. The hydroelectric power station, Assiut Barrages, has four turbines, generators, and electro-mechanical equipment. The dam was originally established in 1903 and is the oldest dam in the Egyptian section of the Nile. The installation of the station was completed in 2017, which greatly improved the irrigation and navigation conditions in the country [47].

4.2.4. Aswan High Dam

In Egypt, between 1960 and 1970, the Aswan High Dam was built, and it is the largest dam in the world, built across the Nile at Aswan. The importance of this dam is summed up in its ability to better control floods, as well as to provide an increased stock of water for irrigation, in addition to its ability to generate hydroelectric power. Therefore, the High Dam had a great impact on raising the level of the economy and culture in Egypt. Most of the hydroelectric power generation in Egypt comes from the Aswan High Dam, as it has a generating capacity of 2.1 GW. Due to low water levels, the dam is rarely able to operate at its full designed capacity [48].

4.2.5. Naga Hammadi

The Nag Hammadi Dam was designed to provide irrigation to the Nile Valley, regulate the flow of the river, and generate electricity. The electrical energy is generated by having four turbines with a capacity of 16 megawatts each, resulting in this dam generating 64 megawatts of electricity [49].

Future Projects in Egypt

The Attaqa project is an important future hydropower project with 2.4 GW capacity, along with provisions for PHS. Water is pumped to Mount Attaqa from the Suez area [16]. Table 6 shows the most important hydroelectric power stations in Egypt, as Attaqa is the newest project in the country that focuses exclusively on PHS. This project is being built with a capacity of 2400 megawatts on Mount Attaqa in Suez, Egypt. The project is expected to cost about USD 2.6 billion and will take about seven years to construct, which means that it is expected to be completed in 2024 [25].

4.3. Sudan

In Sudan, there are number of hydroelectric power stations. Being on the River Nile right before it enters Egypt and having a considerable length of it running through its land, there is great potential to supply the whole country from hydropower. Table 7 shows the operational, under construction, and planned projects. Total installed and potential hydroelectric power is 4176 MW, and the actual installed capacity is 1585 MW, about 38% of the planned. Hydropower has provided the highest share of about 70% of the total power supply among other energy sources, although the capacity is about 54% of the total power capacity. This is seen as a result of the high outage of thermal power generation [52].

Future Projects in Sudan

Table 8 shows that Kajbar is the most recent project in hydropower in Sudan. We will show herein describe the details of this project. The location of this station is on the Nile River in northern Sudan. Kajbar will have a power generation capacity of about 360 megawatts, enough to power more than 202,000 homes in Sudan. The project contains six turbines, each of 60 MW, and an installed capacity of 360 MW. The project started in 2017, and the expected completion date is unknown. This project encountered difficulties, including significant opposition from local communities. The reservoir created by the Kajbar Dam will flood about 110 square kilometers of the Nile Valley, and this requires the resettlement of 10,000 people, i.e., from about 10–12 villages. In addition to that, the project will flood about 500 archaeological sites [53].

4.4. Morocco

There are 26 hydroelectric power plants in Morocco with a total capacity of 1360 MW. These plants include Al Wahda Dam, which is the second largest dam in Africa with a capacity of 460 MW. In 2008, the country set aspirations to add about 580 megawatts of hydropower by the year 2020, by developing a number of projects related to energy and electricity generation. In 2012, Morocco was found to have the potential for micro and mini-hydropower plants, as highlighted by the United Nations. However, the main issues affecting small hydropower development are the reduced rainfall and water availability in Morocco. Limited budget for ambitious energy projects is also stifling any growth in these hydropower projects [57].

4.5. Algeria

The total flows falling on the Algerian territory are important, estimated at 65 billion cubic meters, but they are of relatively little benefit to the country. This is due to the scarcity of rainfall and the percentage of rain concentration in limited areas, in addition to the high evaporation rate. There are about 103 dams in the country and more than 50 dams are currently operating. In 2012, electricity production in the country from hydropower sources reached 622 GWh, or approximately 1.08%. In 2015, production was 0.21%. At the highest value in 1973, the production of electric energy reached 26.80%. Table 9 shows that the total Algerian hydroelectric production in 2003 amounted to 269.208 megawatts, equivalent to 1% of the total electricity production. Hydropower is not a major contributor to electricity generation in Algeria, due to the limited replenishment of water resources caused by low values of yearly precipitation [58]. Table 9 lists the available hydroelectric power projects in Algeria.

4.6. Tunisia

Hydroelectricity in Tunisia is considered on a small scale [71]. The Tunisian public water company—the National Company for Exploitation and Distribution—owns about 1300 pumping stations. Electricity consumption in pumping stations is large, with the largest plants consuming more than 1.0 GW hour of electricity annually. Likewise, the drinking water network has great potential to generate electricity using the overpressure of the grid system [18,72]. Table 10 presents Tunisian electricity capacity by hydropower in 2018 and 2019. Hydropower in Tunisia is still a limited resource in the available energy mix, resulting in a consistent generated capacity from hydropower systems.

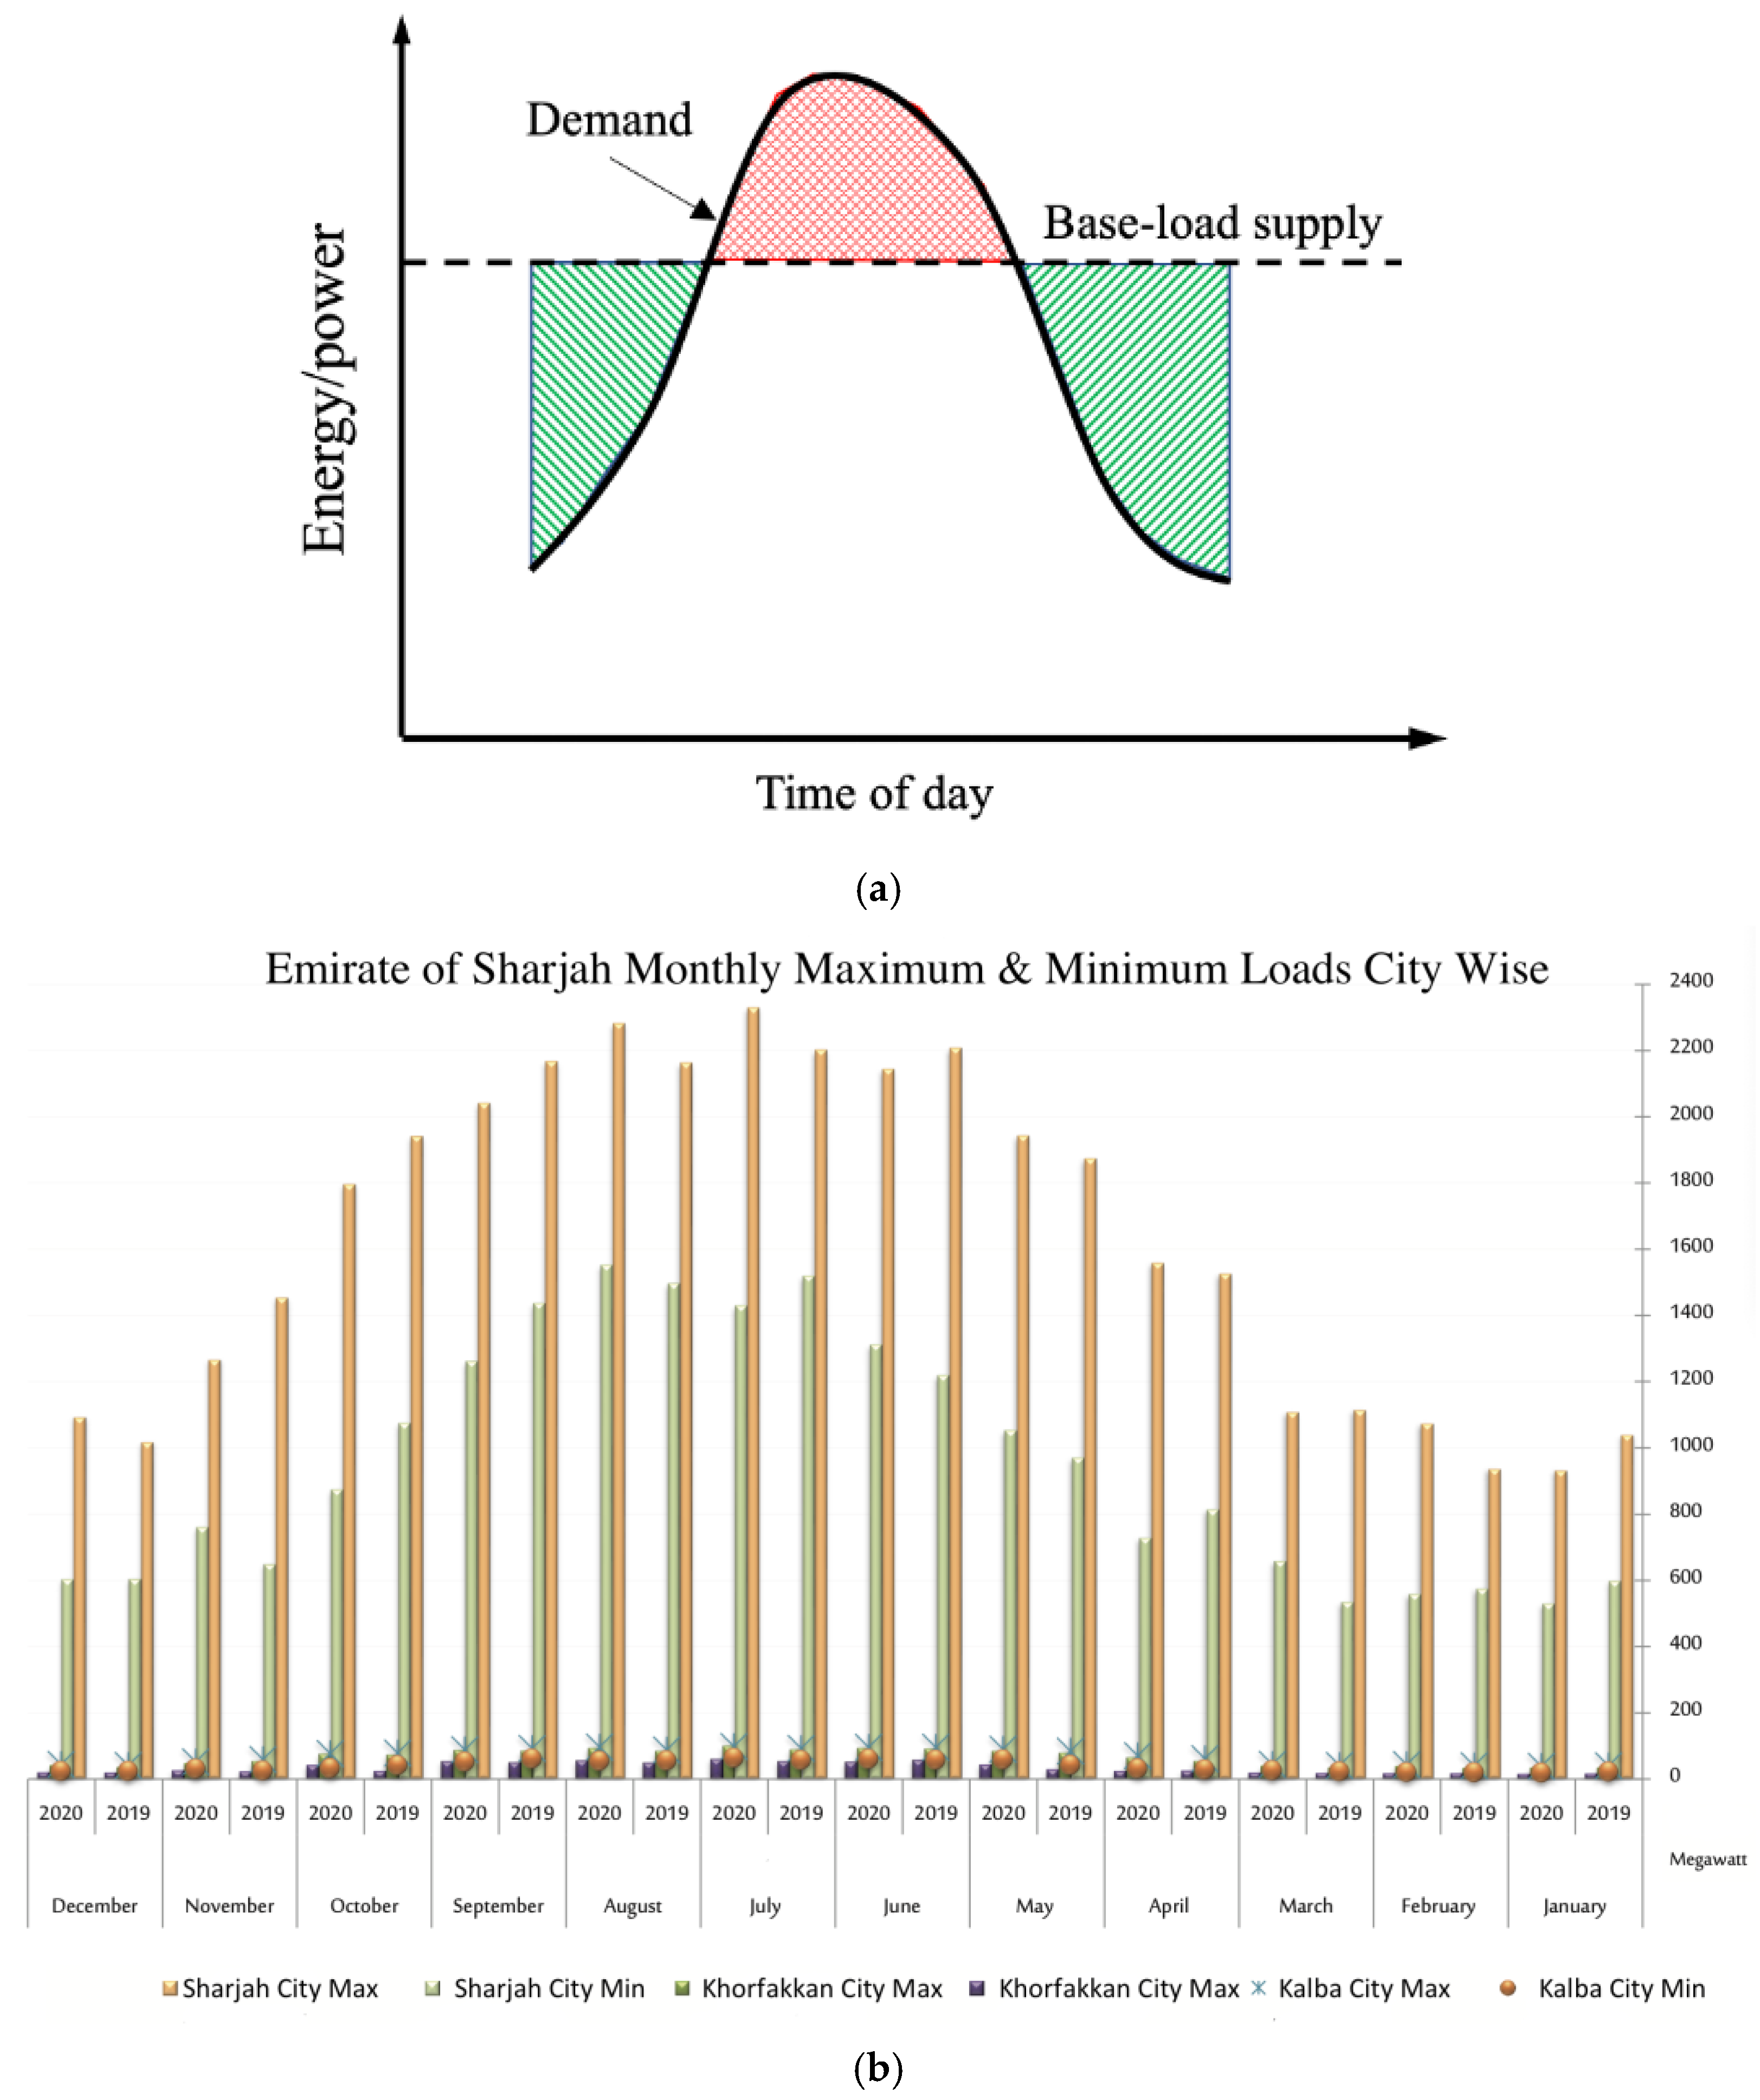
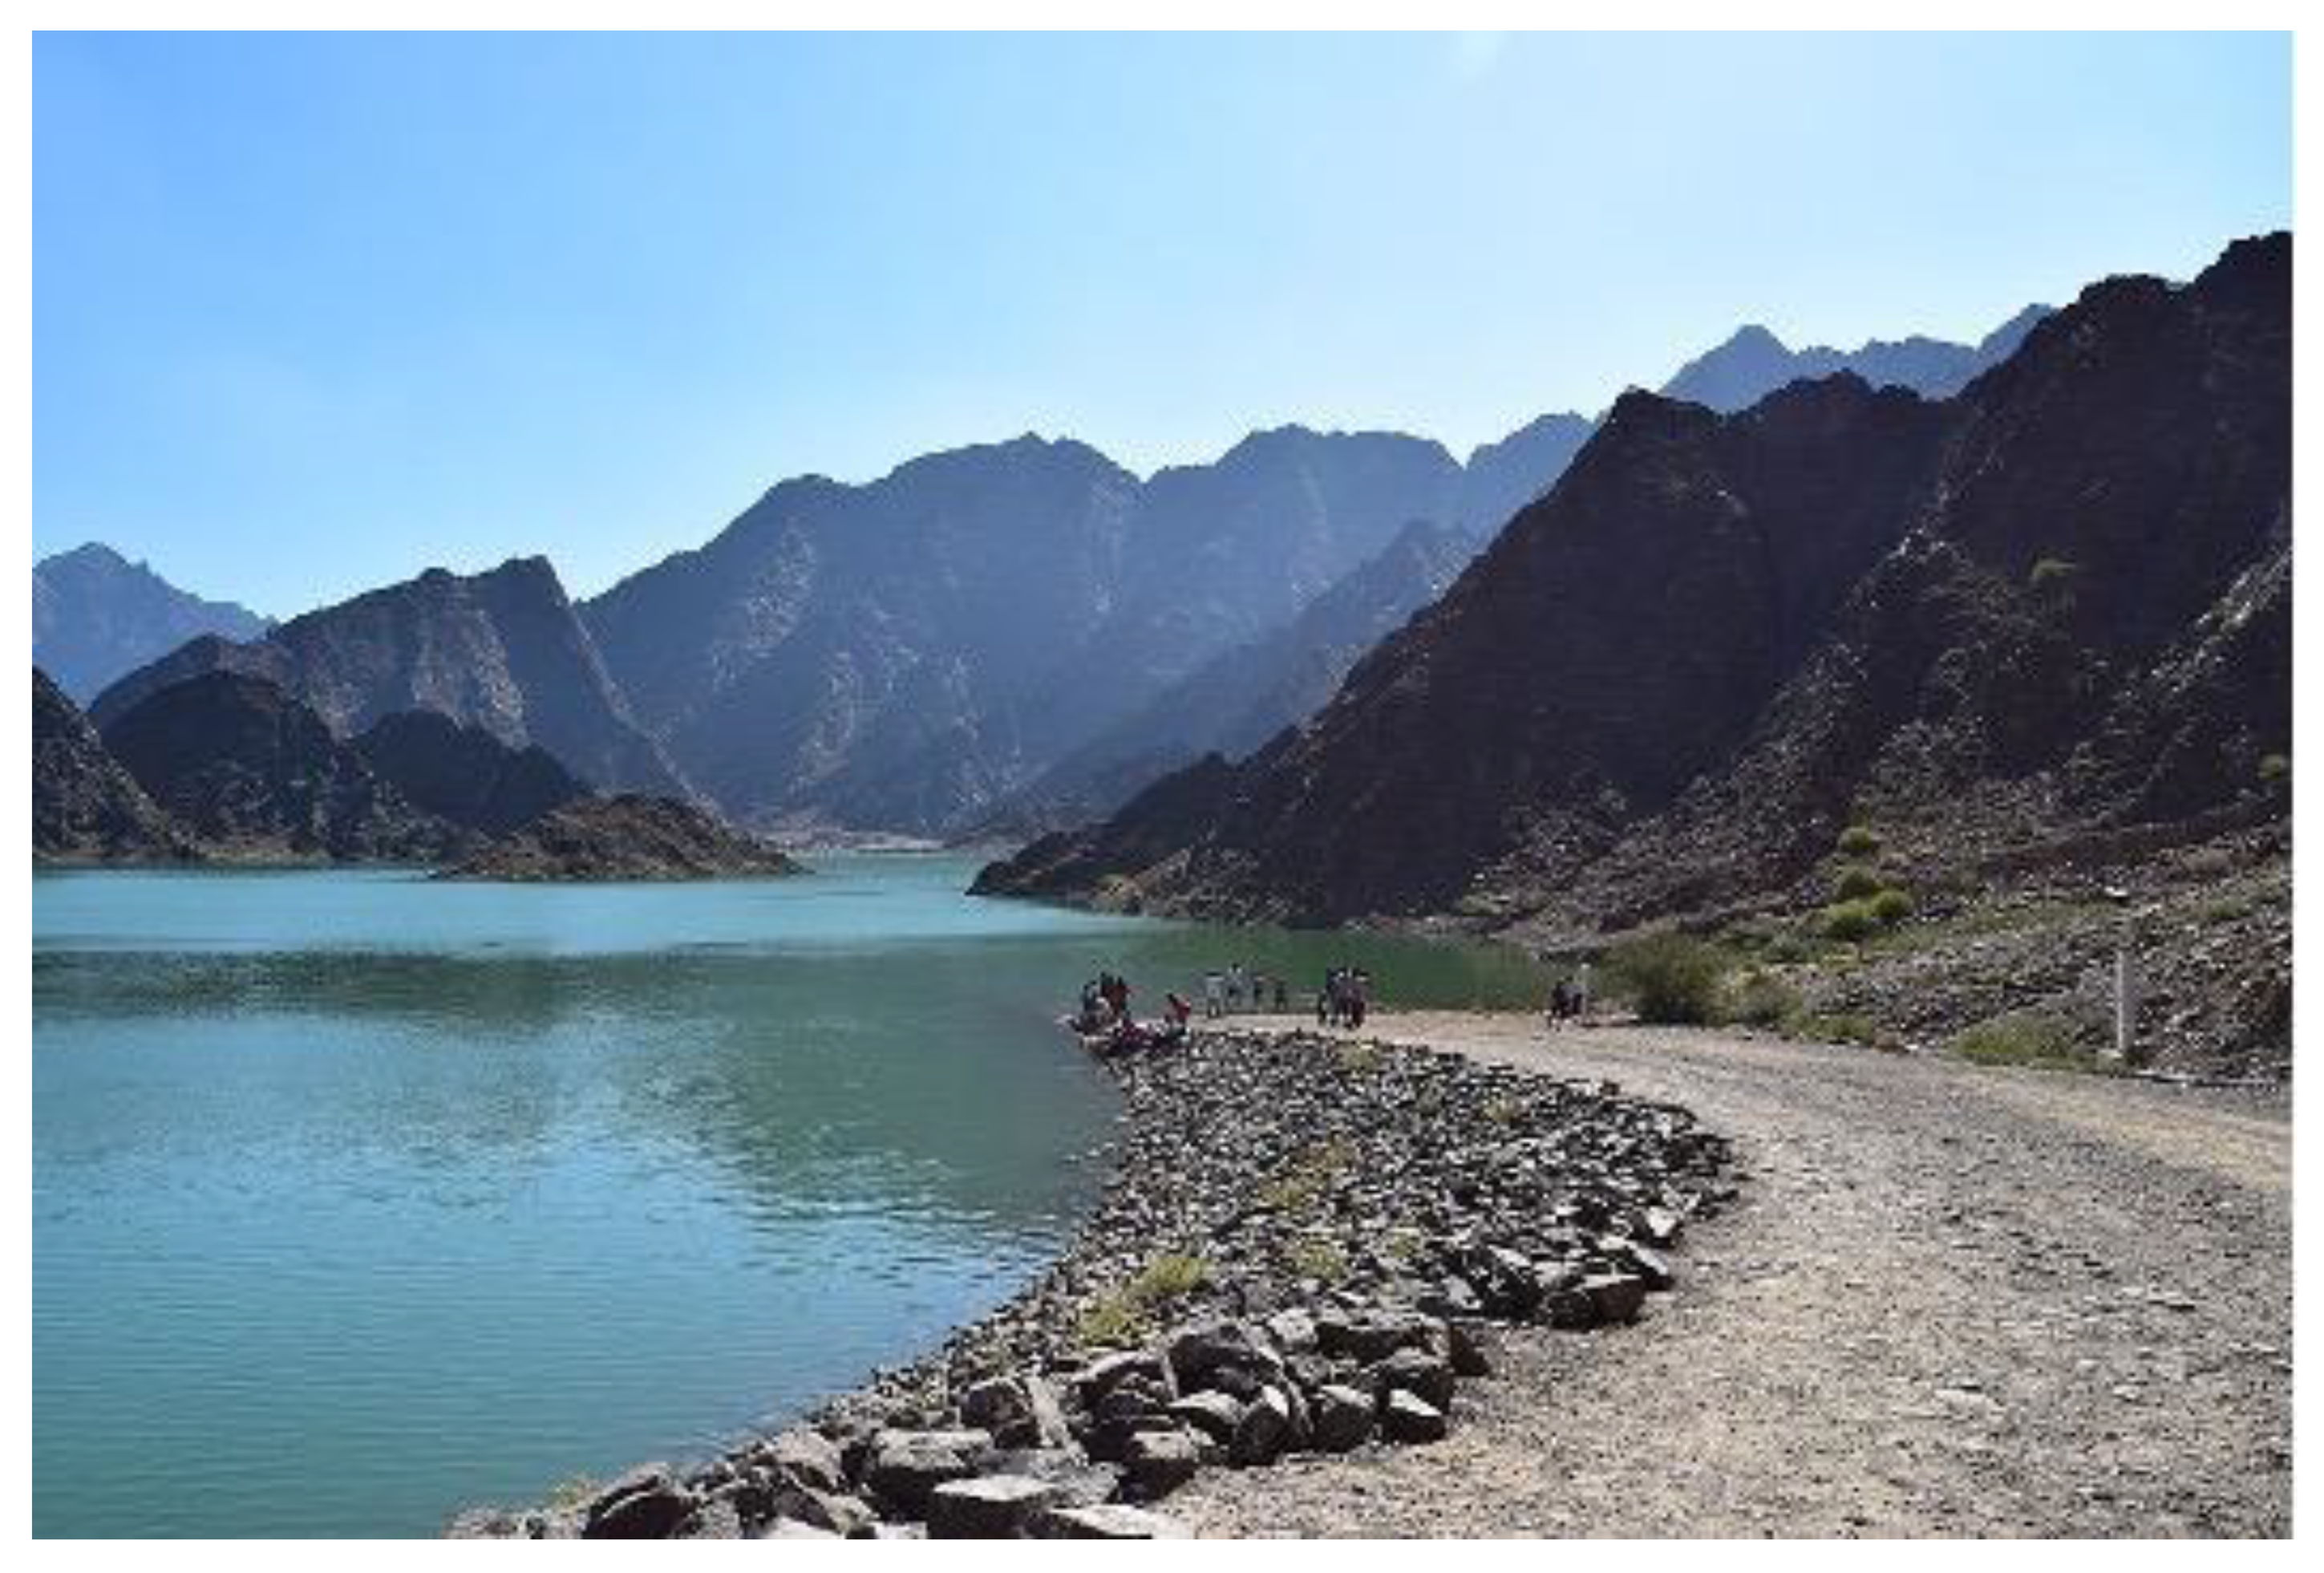
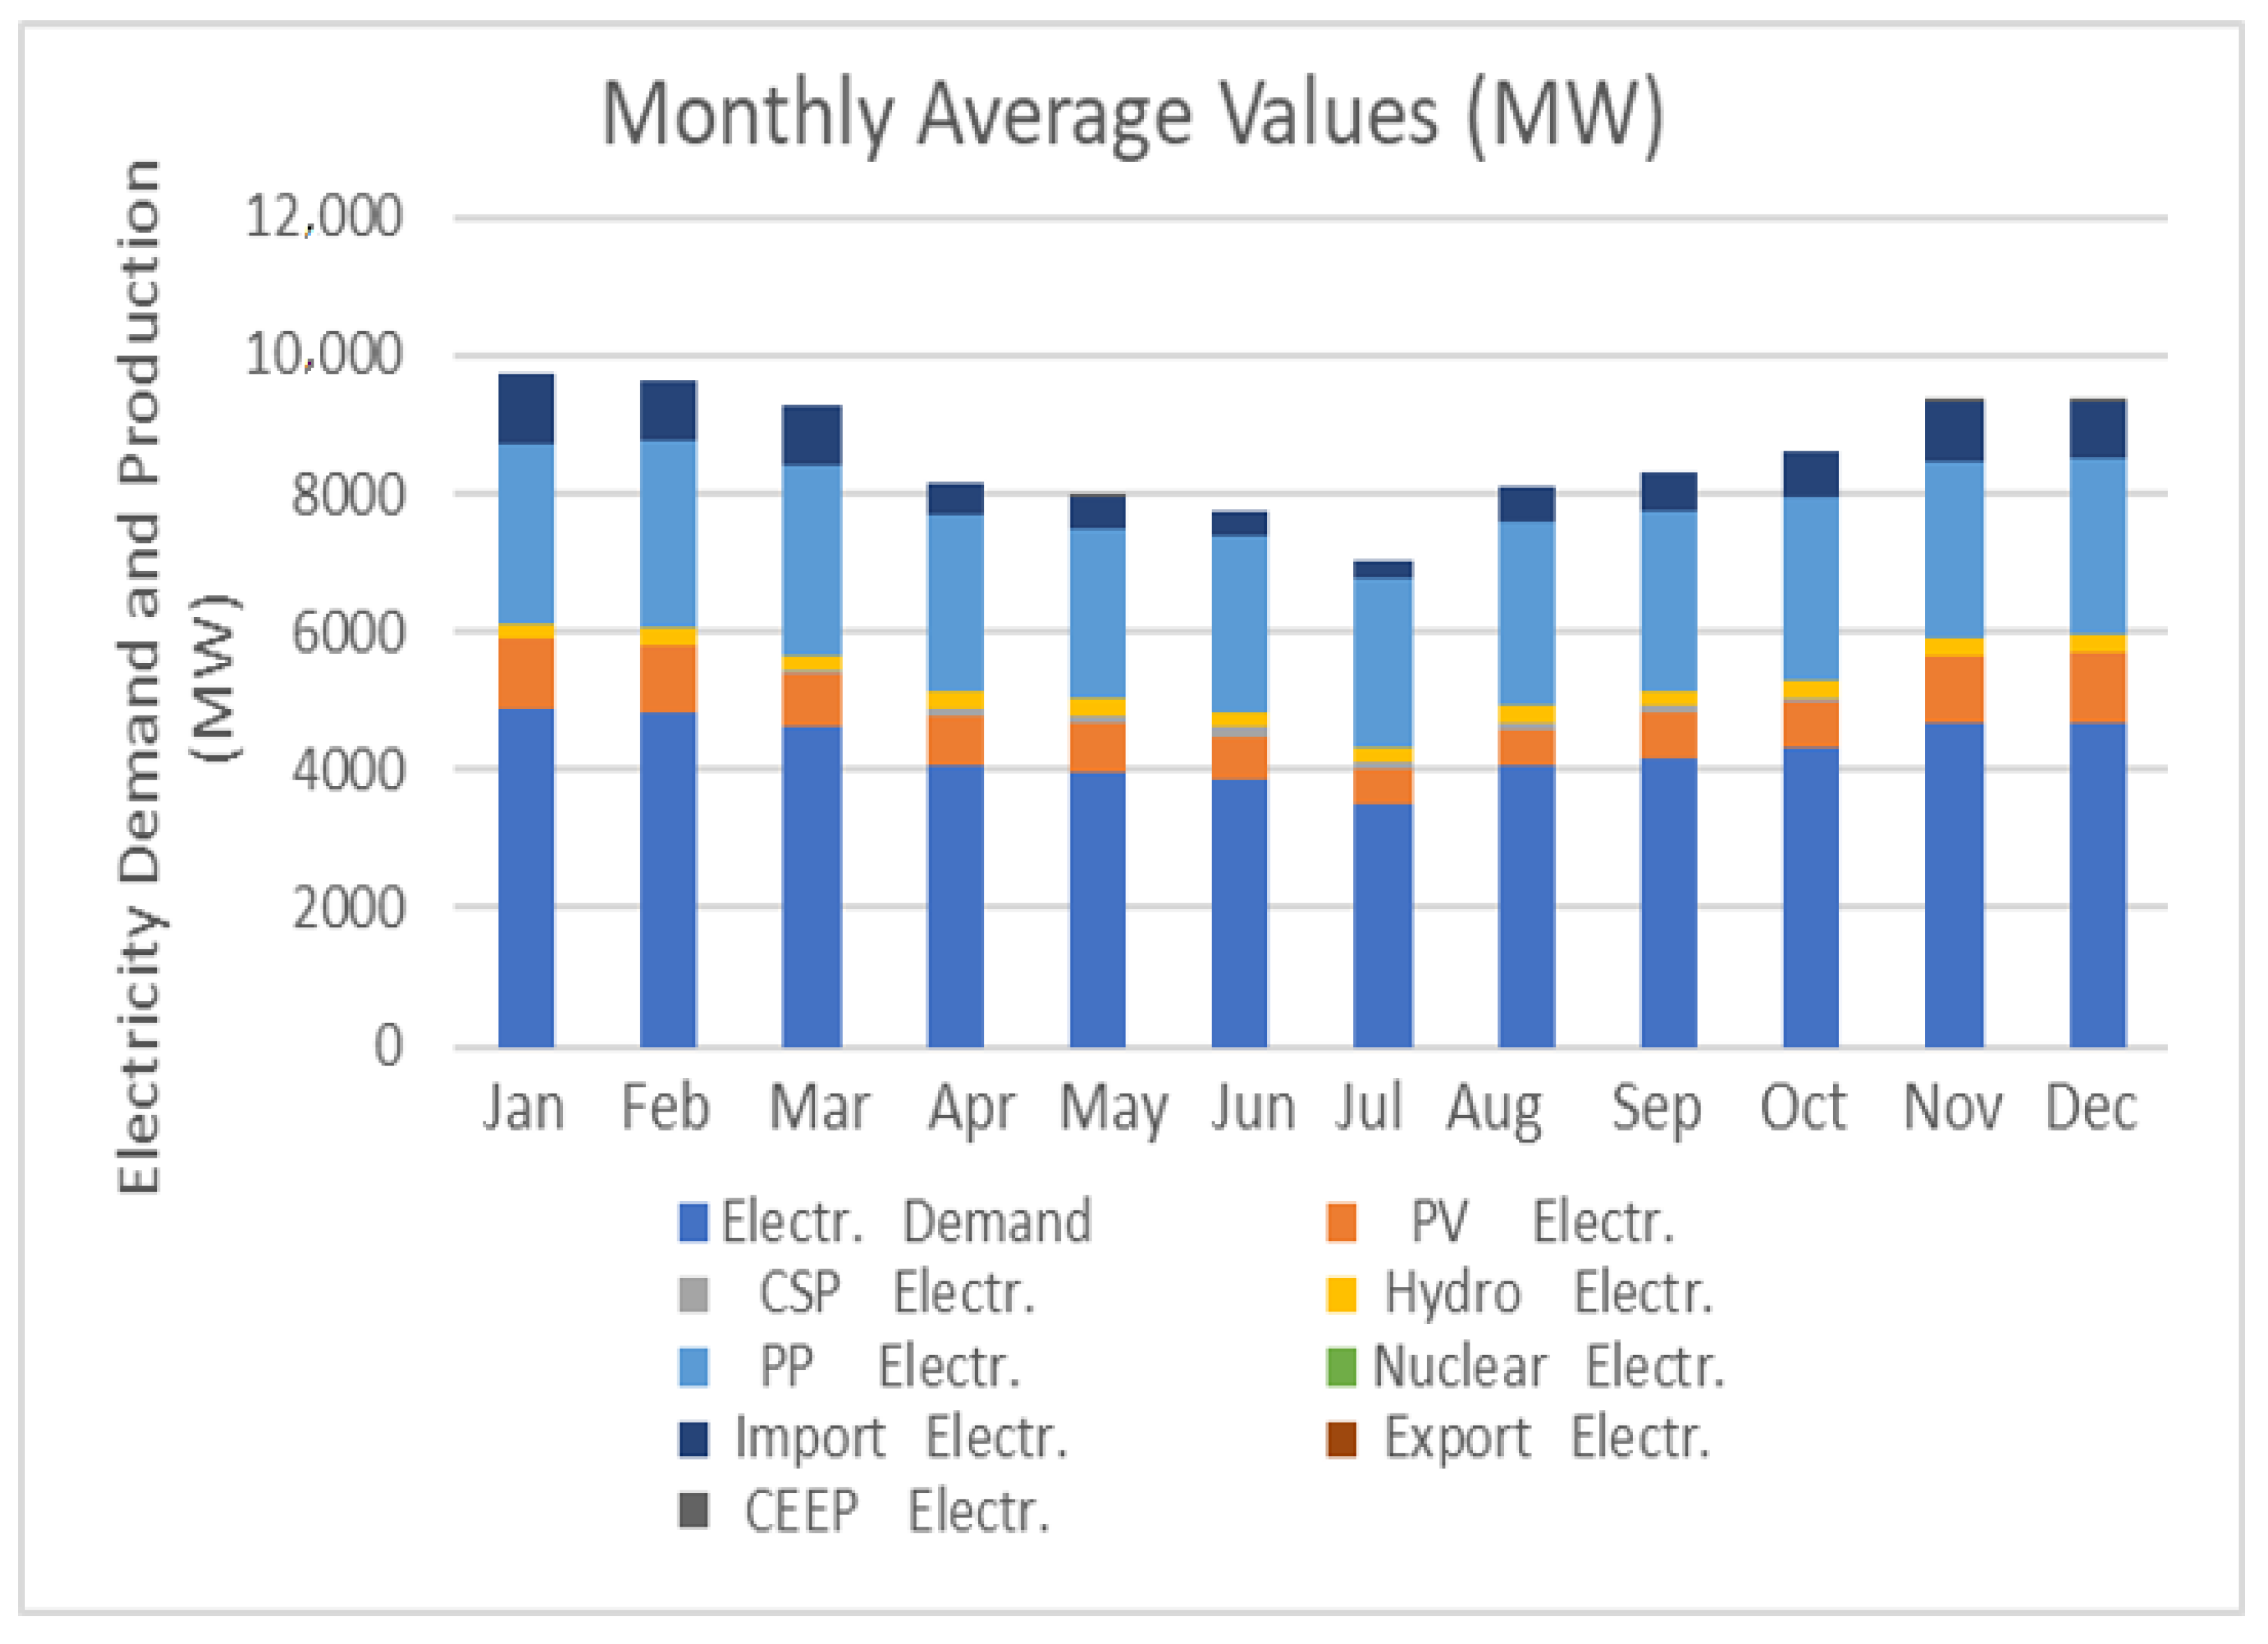
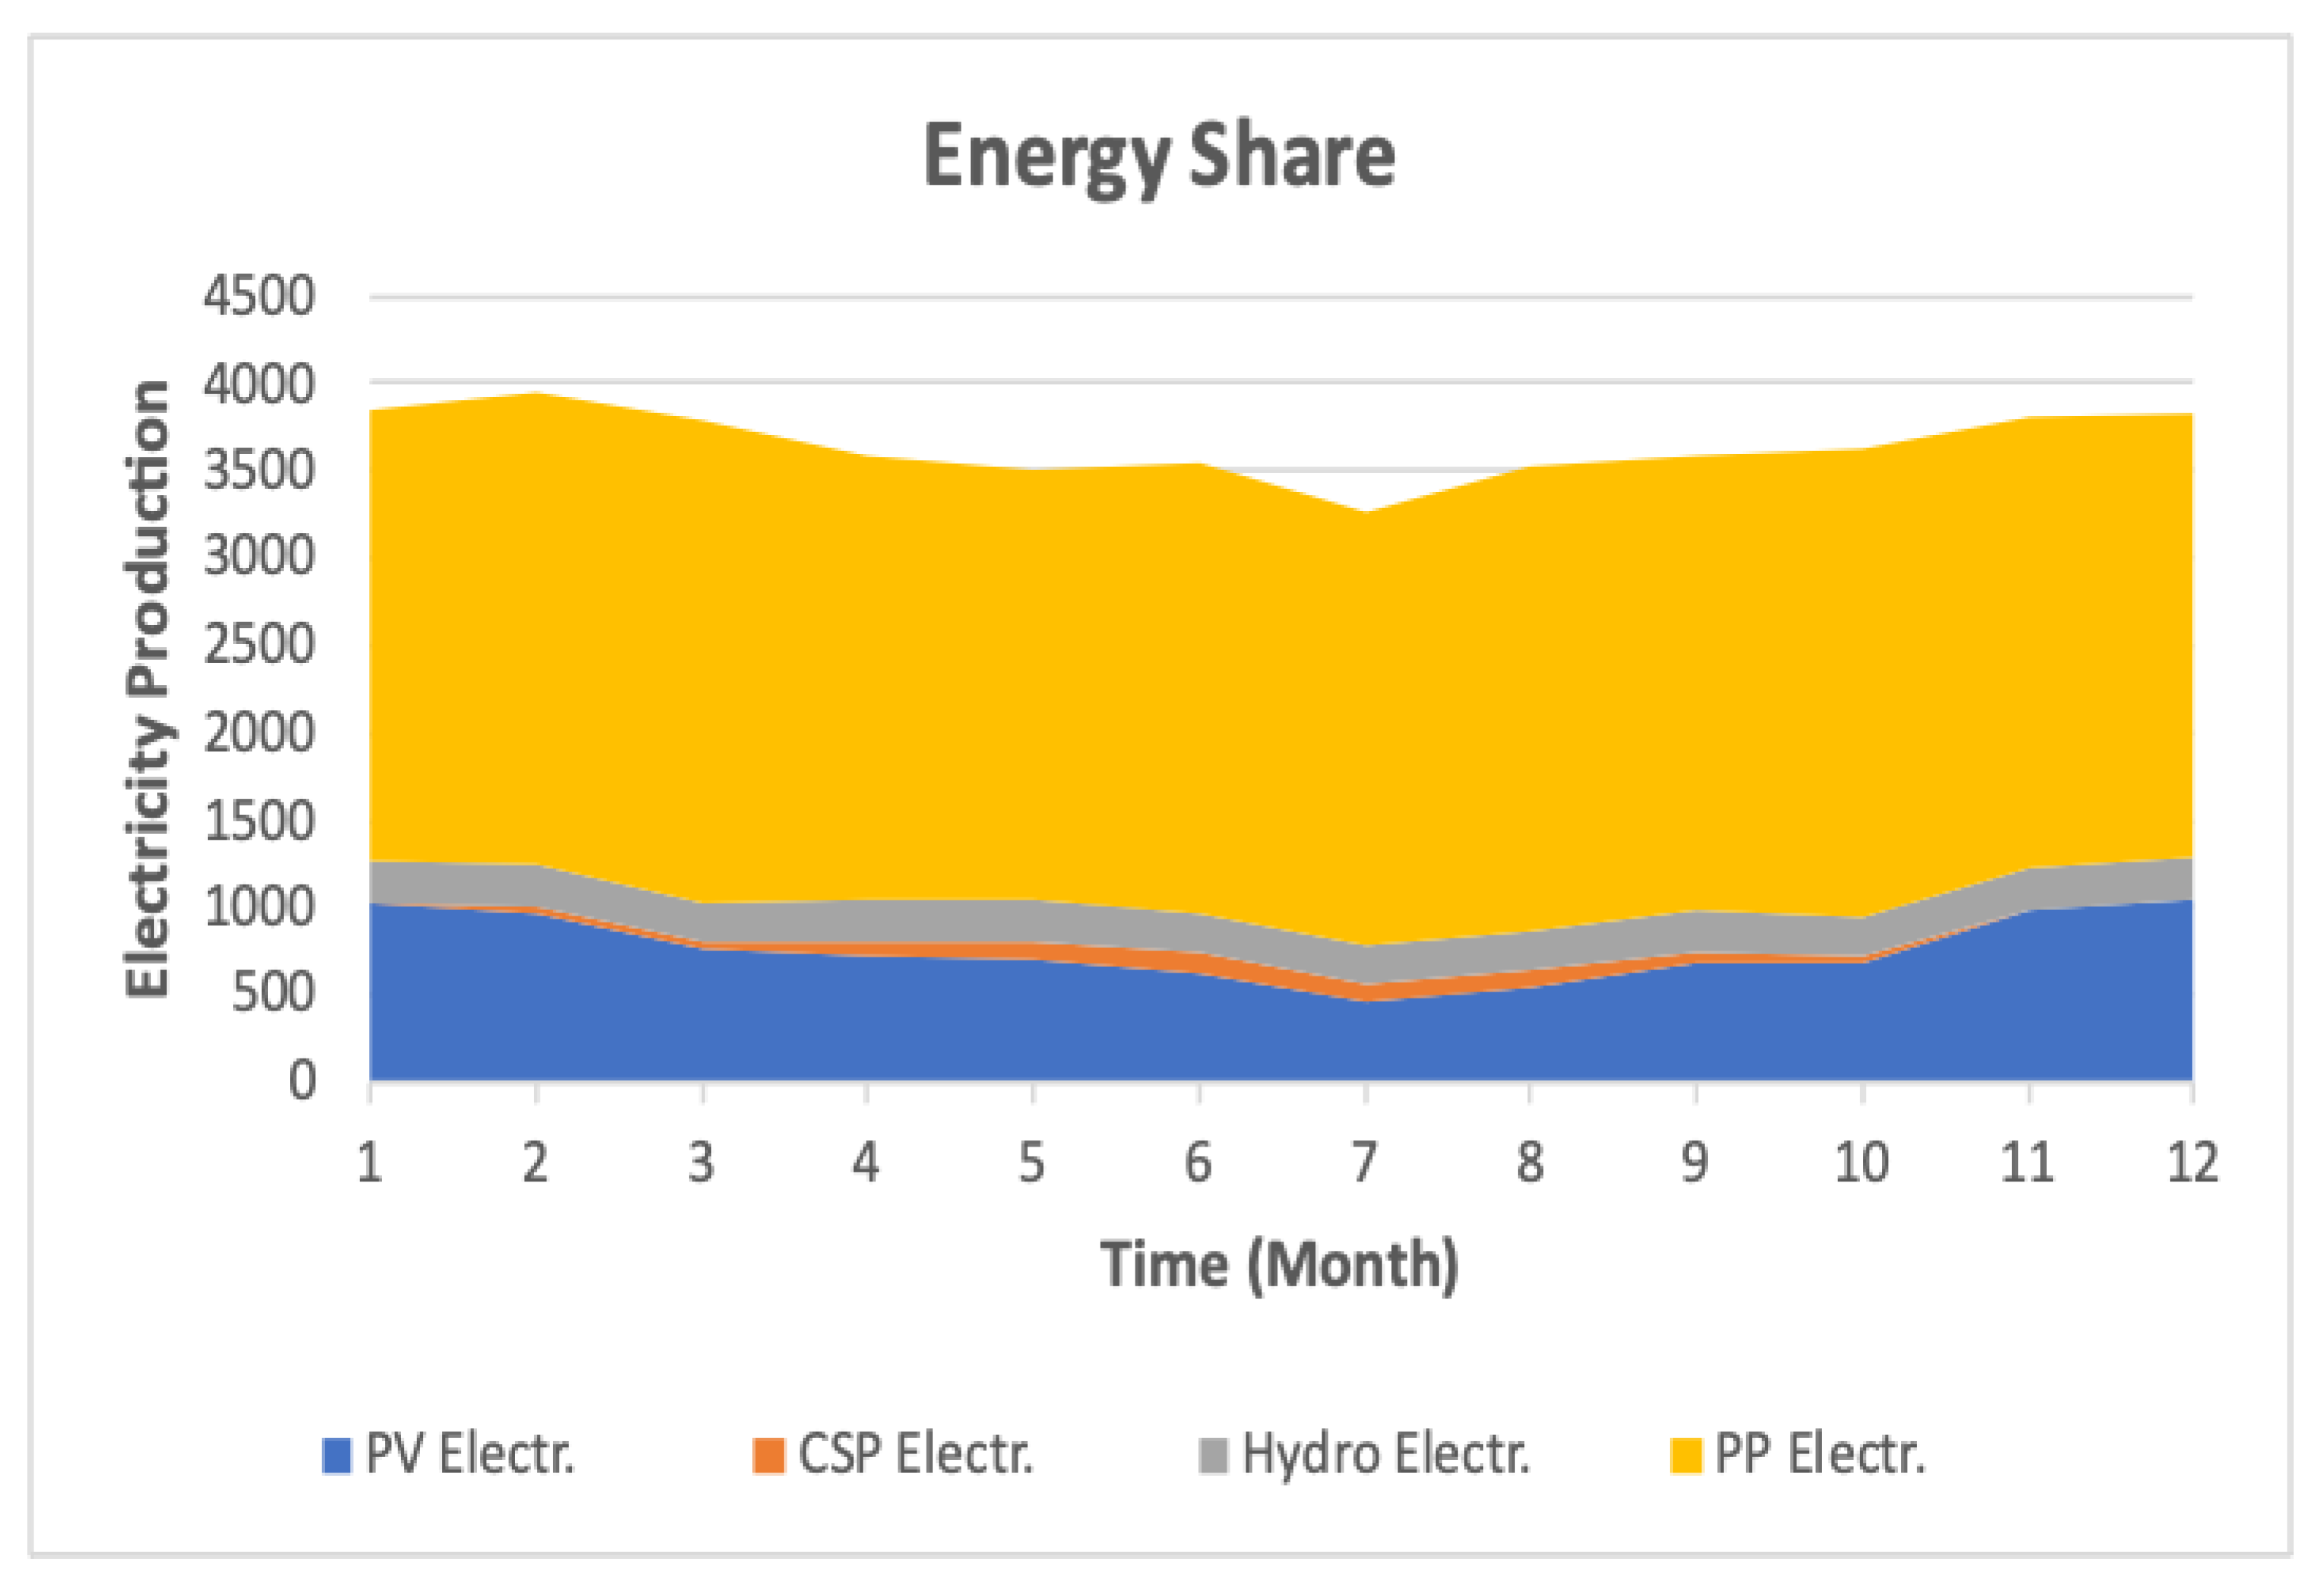
4.7. UAE Projects and Potential

The United Arab Emirates is located at the tip of the Arabian desert. With only one oasis located at the south of the country, the UAE has limited fresh bodies of water and inconsistent rainfall to warrant the serious consideration of PHS as a form of energy resource. This fact is emphasized by the heavy reliance on abundant and cheap fossil fuel resources of oil and natural gas that diminishes the return of other resources or even energy storage. Nevertheless, the UAE is considering many renewable and sustainable energy projects to prepare for a post oil and gas future. The freshwater scene remains sporadic and unreliable, except in mountainous regions in the southeast near the Omani border that is subject to summer monsoon rains that collect behind small dams. A total of 150 dams exist in the UAE, sixteen of which are made of concrete and provide the promise of PHS potential [72]. The total water accumulation is shown in Figure 8, where the fluctuating nature of water availability is clear and is mainly due to inconsistencies in rainfall and prolonged drought seasons witnessed by the UAE in recent years [73].
Currently, there are two sources of freshwater in the UAE: (1) non-conventional (processed) resources (desalinated water, treated wastewater); and (2) natural resources (seasonal floods, springs, aflaj, groundwater). More information can be found in Table 11.
The UAE Ministry of Agriculture and Fisheries has constructed 45 dams, providing the total storage capacity of surface water amounting to 75 million cubic meters. Table 12 shows the capacity of each dam. By the end of 2002, the total dams in the country increased to 88 dams, with a total storage capacity of about 100 million cubic meters.
One promising project is taking place in the Hatta region in Dubai. The expected capacity of this project is 250 MW, at a cost of USD 391 million [74]. The project is designed to use and store water from the existing Hatta dam, which was built in the 1990s, for generating electricity during peak demand periods. The lower reservoir will be located near the Hatta Dam, approximately 400 m above sea level. The lower reservoir will have the capacity to hold approximately 1716 million gallons of water. The upper reservoir will be constructed in the shape of a lake in the mountain, approximately 700 m above sea level and 300 m above the dam level. The upper reservoir will be capable of storing up to 4.5 Mm3 of water. The distance between the two reservoirs will be up to 4 km [74]. The project is designed to achieve 80% power generation and storage cycle efficiency within 90 s, in response to the demand for peak electricity. Figure 9 shows the Hatta dam project location.
The UAE has been a leader in PV-based electricity generation in the Gulf region. The UAE continues to invest in the market of solar energy, as it has been proved that the incorporation of PV panels will provide a promising renewable source of energy that is abundant and non-exhaustible [75]. The government aims to increase the share of solar energy projects through projects tendered at Mohammed bin Rashid Al Maktoum Solar Park. The current tally is 3,069,866 PV modules with a capacity of 800 MW that can supply 240,000 residences with clean energy [76], and the plan will see the installed capacity of up to 3 GW in 2030. The UAE has a main target in reducing the carbon footprint and its associated costs. Thus, the UAE projects that by the year 2030, 25% of its energy production will be through clean resources, whereas by 2050 this percentage shall increase to 75% generation via clean resources [77].
To quantify the significance of PHS projects in the UAE, the results of an EnergyPLAN simulation run was added to project the energy mix for the year 2030, where the target is to rely on 25% renewable energy resources in the oil-rich country to meet demand. This is shown in Figure 10, where employing various renewable energy sources to satisfy 25% of the electricity demand is achieved. Focusing on pump hydroelectricity production, an increase in its utilization is projected throughout January, February, October, November, and December, while the production decreases through June, July, August, and September. This is explained by the enhancement of rainfall and the consequent availability of water resources in the Hatta dam location. It is noted that the ratio of electricity export to electricity import is negligible. The electricity import especially increases during the beginning and the end of the year, due to the increasing demand for electricity, at which time the export critical excess electricity production (CEEP) is insignificant Thus, to balance electricity import and export, electricity production needs to significantly increase during high-demand periods. Table 13 shows the capacities and costs of the renewable energy sources used as input for simulations in EnergyPLAN.
The monthly energy shares of hydropower are shown in Figure 11. It is indeed clear that in winter and spring there is ample opportunity to recharge the upper reservoir; this can be completed by pumping when the water supply is high, unlike in summer where it falls to its minimum values due to the harsh climatic conditions that are inducive to significant evaporation losses.
Table 14 demonstrates the electricity share (TWh/year) for various energy sources available in the UAE to meet the projected demand of 37.78 TWh in 2030. The first portion shows the resource coverage with and without the PHS coverage from the Hatta project (TWh/year). The projected generation share of pump hydro far surpasses the current (2020) share of PV and CSP systems combined at 2.07 TWh. Hence, to achieve the goal of supplying 25% of the total electricity demand by renewable energy sources, the current capacity (250 MW) of pump hydro storage in Hatta is more than enough to contribute to the achievement of this goal. On the other hand, other renewable sources, such as PV systems, must achieve an increase in the electricity share from 1.66 to 6.74 (TWh/year) to achieve this goal.

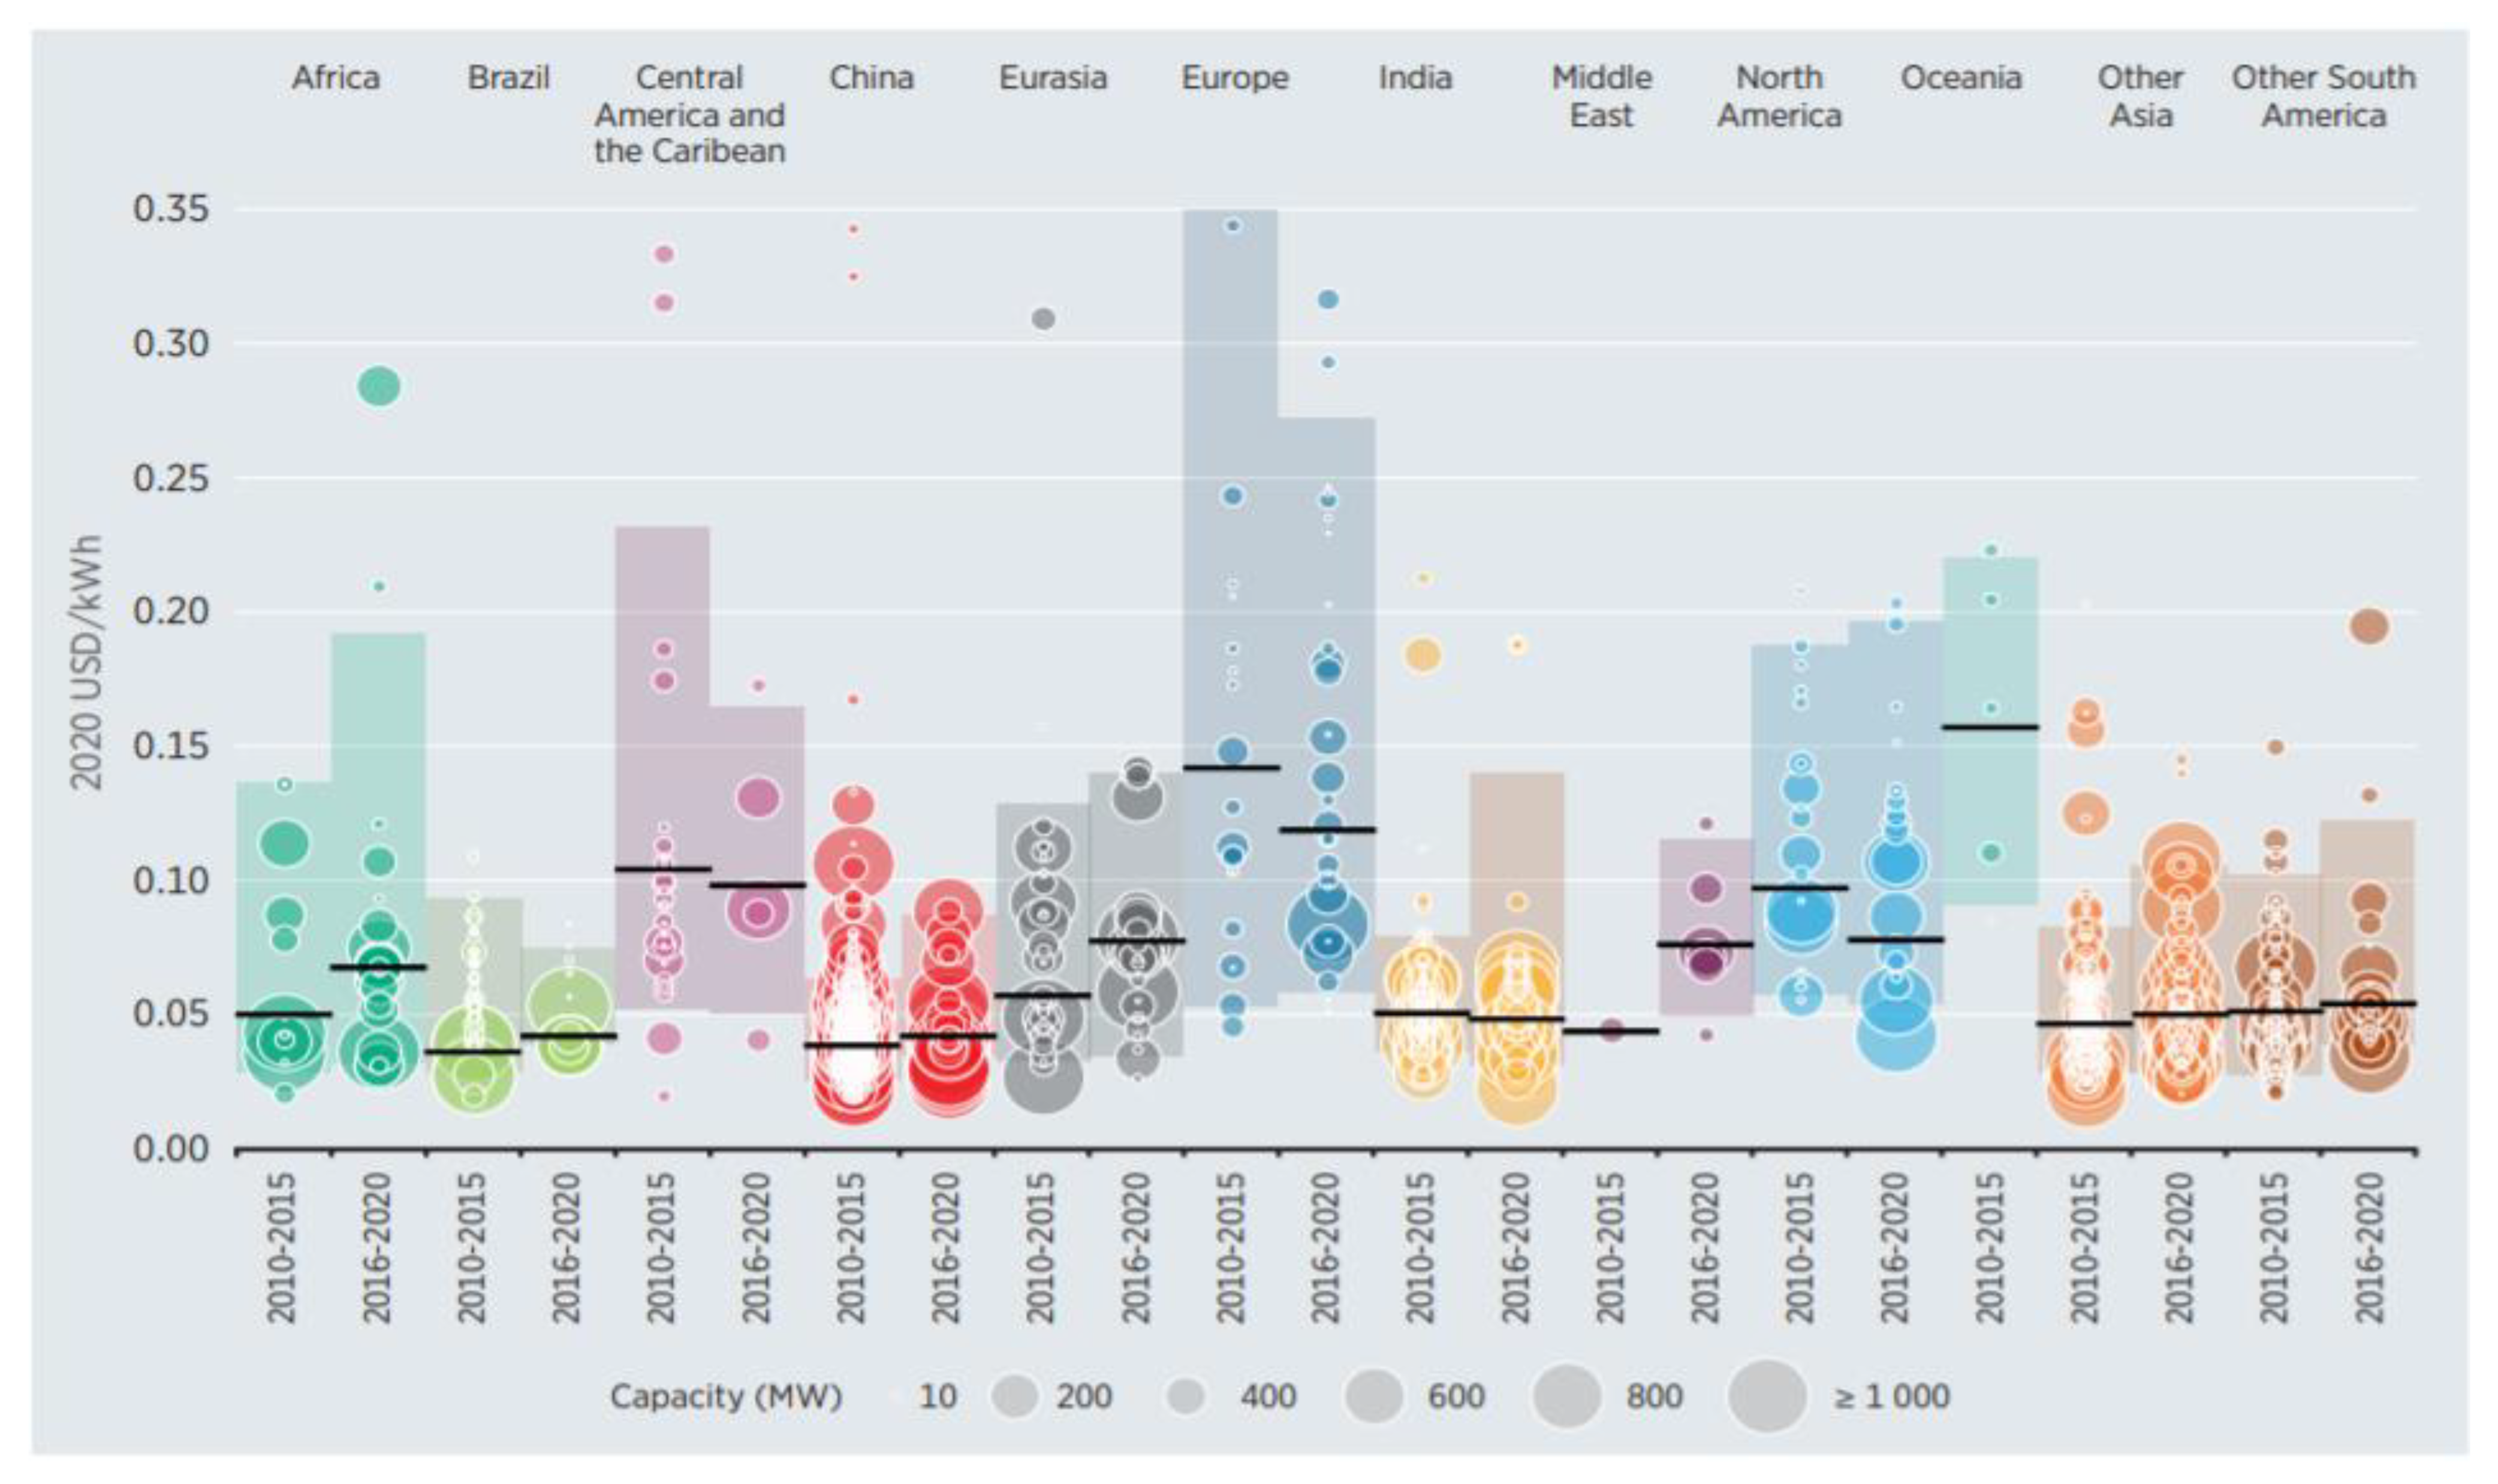
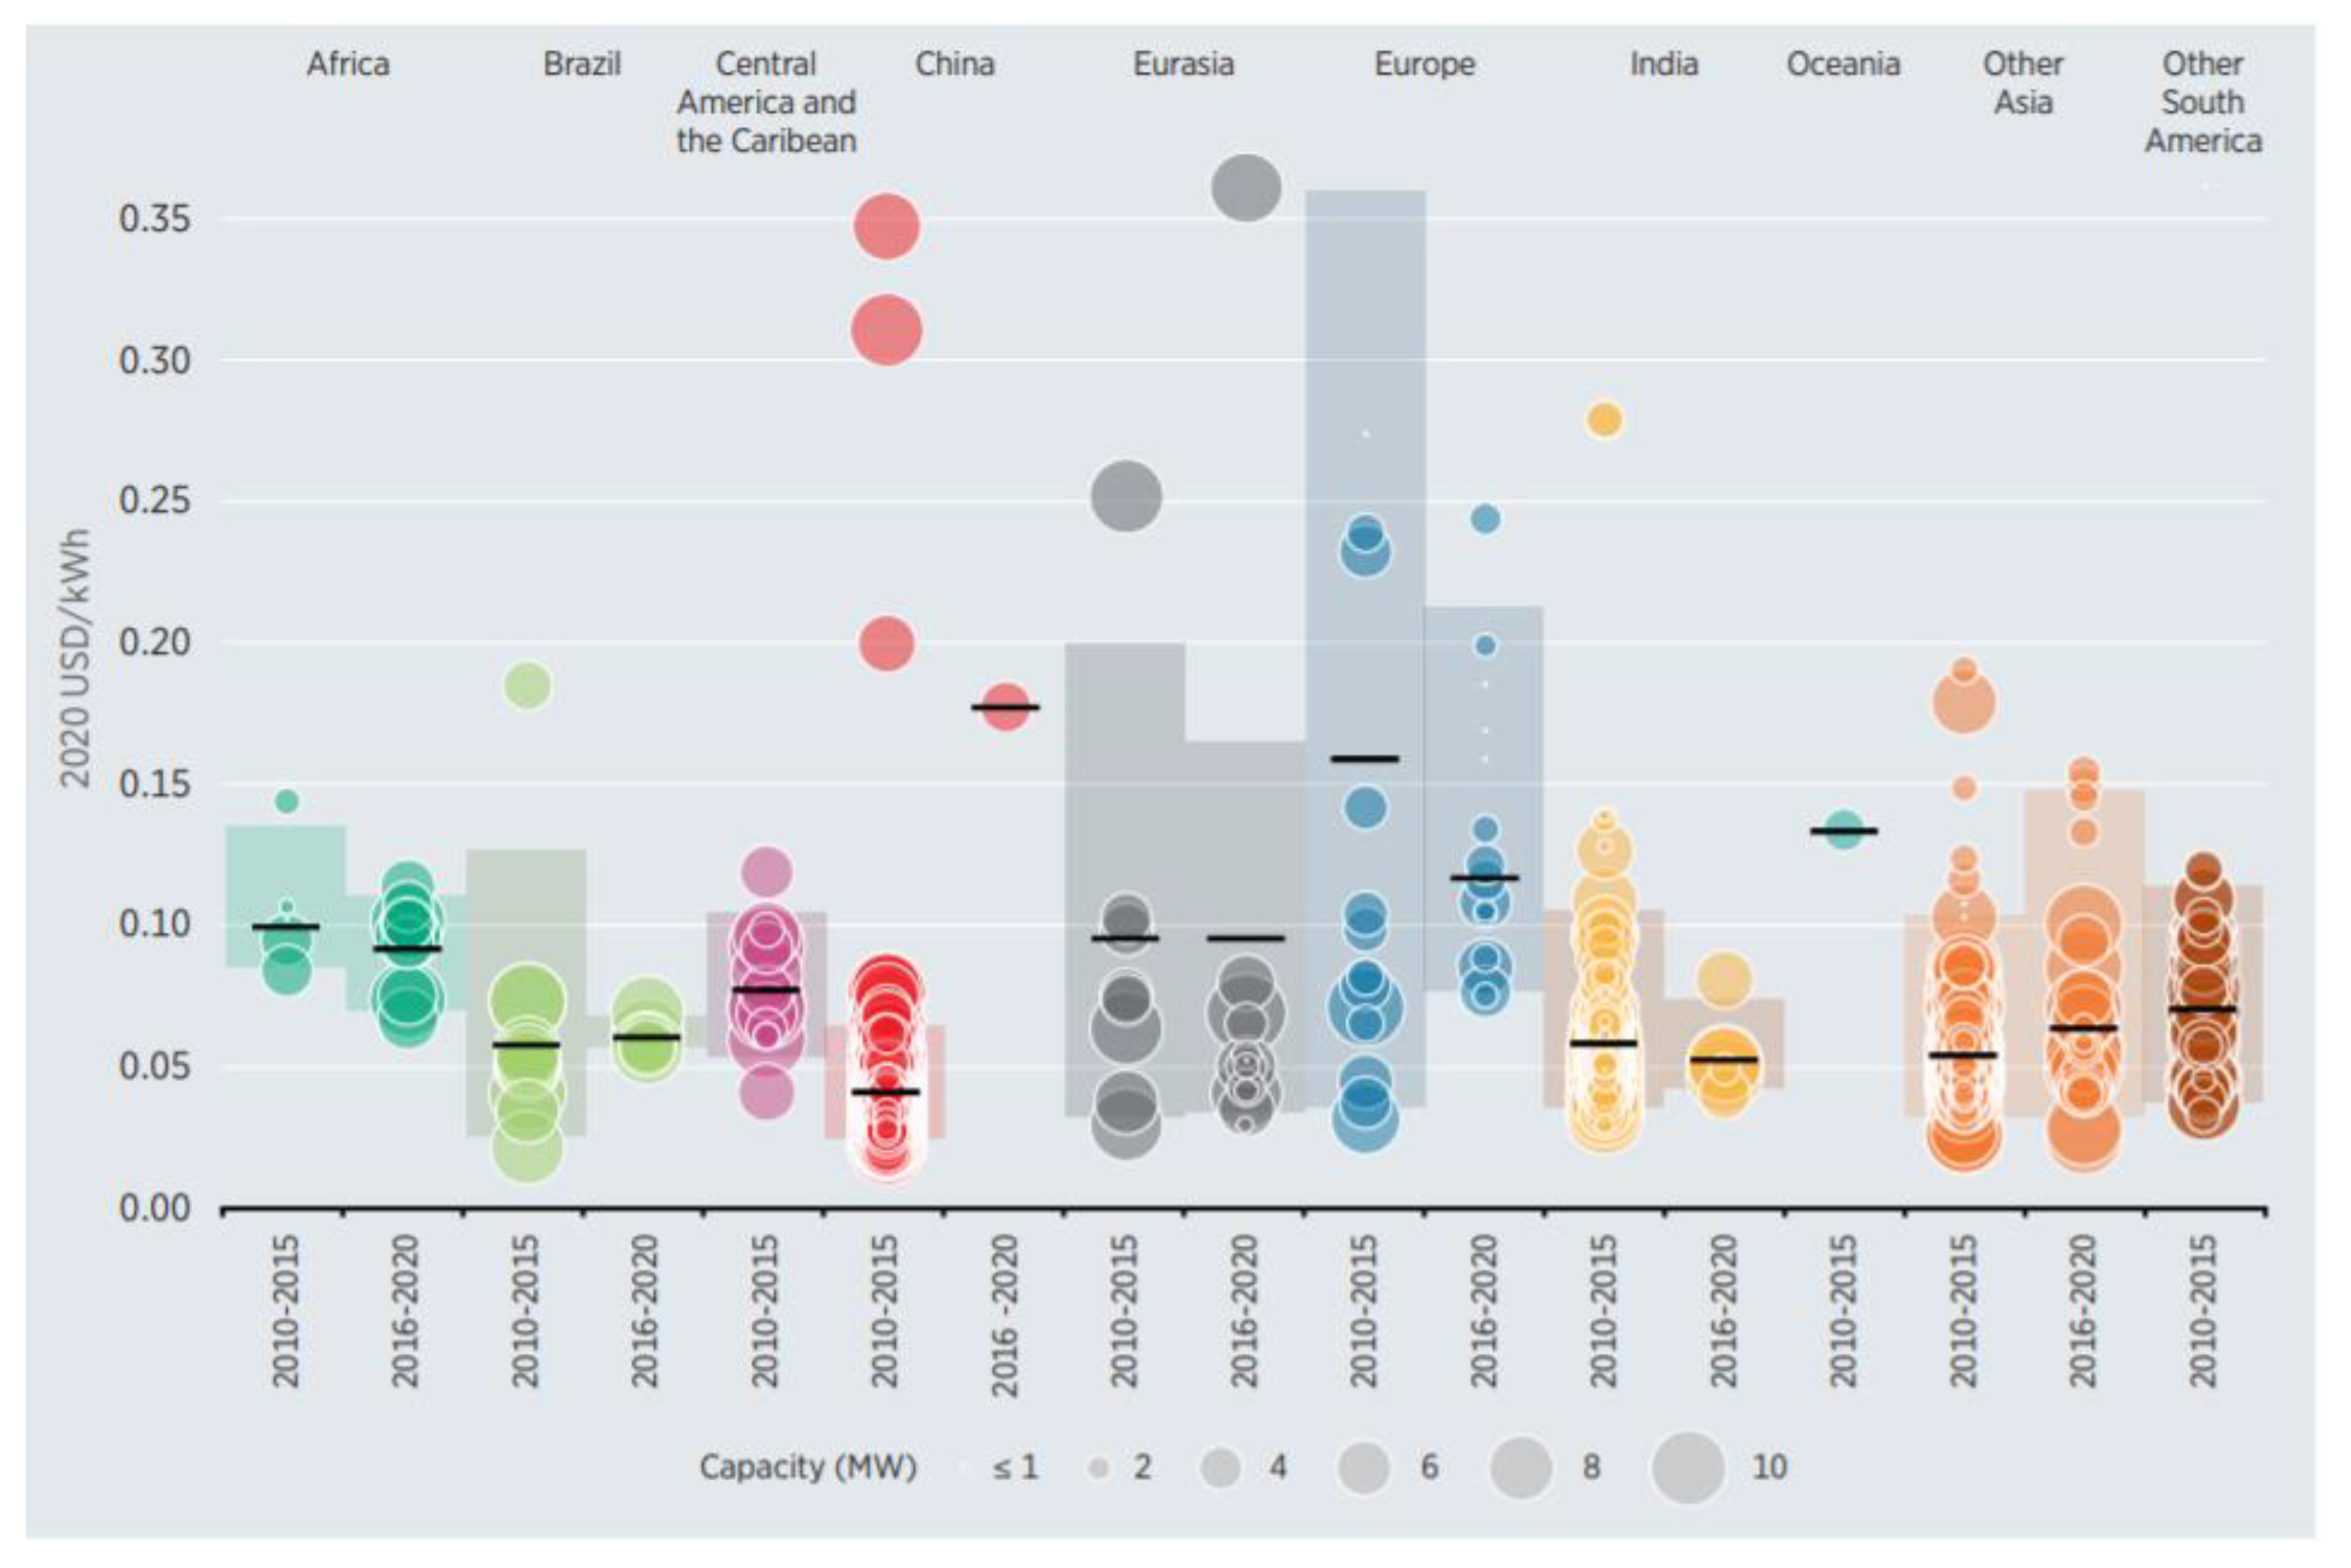
5. Hydropower Economical Point of Views

The installed costs for large and small hydro plants were compared, which showed that small hydropower projects have costs between 20 and 80% higher than large hydropower plants. However, this is not the case for regions of Central America and the Caribbean and Oceania, where large hydropower plants have high installed costs, since a small number of these projects are developed [81].
The LCOE (USD/kWh) versus the capacity (MW) of large and small hydropower plants are plotted in Figure 12 and Figure 13. For large hydropower projects, the Middle East and African regions saw an increase in the average LCOE between 2010–2015 and 2016–2020. On the other hand, in Europe and North America, the LCOE weighted average reduced, while it stayed approximately the same in China with a small increase.
In small hydropower plants, the trends in Brazil and Europe were similar, while in Africa the weighted average LCOE reduced [81].
The future of renewable energy systems in the MENA and Europe was also modelled and compared. The assessment of renewable energy systems showed that the MENA region had a lower levelized cost of electricity (LCOE) than Europe. The main factors contributing to the system cost and capacity mix are the resource quality, reservoir hydropower abundance, and the topological and temporal variations of nature in variable renewable energy resources [82].
Figure 14 depicts the optimal generation mix based on the total electricity generation share. Either hydropower, wind power, PV, or biogas turbines will satisfy the demand of electricity [82].
In addition, the expansion of hydropower in the MENA region has more potential compared to Europe, which may result in a higher difference in system LCOE between the two regions [82].

6. Discussion

As seen from the presented data, the feasibility of developing pumped hydro storage plants is inhibited not only by the geographical location of the region and the availability of water, but also with the large budget required to plan, execute and operate such projects. Countries such as Ethiopia, Egypt, and Sudan that are located near the Nile River gain an unlimited supply of water, making hydropower generation a feasible primary source of renewable energy. However, these countries have numerous financial and institutional challenges that cause significant delays in execution. Ethiopia’s Grand Ethiopian Renaissance Dam, which has an installed capacity of 6000 MW and utilizes the river’s significant flow rate of about 1541 m3/s, surpasses the initial Lake Tana water hydropower plant with a total of 460 MW [83,84]. Similarly, the Aswan Low Dam, the Esna Dam, the HPP Assiut, the Aswan High Dam, and the Naga Hammadi are projects responsible for hydropower generation in Egypt. The Aswan High Dam required the most investment during its construction, around USD 1 billion; however, it has an installed capacity of 2100 MW. The Attaqa project, on the other hand, required significantly higher investments for construction, about USD 2.6 billion, to produce a slightly higher capacity, about 2400 MW. All these projects rely heavily on water flow from the Nile. On the other hand, other projects originating in countries with scarce water supply struggle with hydropower generation. For example, due to limited rainfall, water availability, and low budget, in Morocco, a total of 26 plants generate a total capacity of 1360 MW, which is almost equivalent to the generation of one plant residing by the River Nile. Similarly, Algeria suffers from a scarcity of rainfall and high evaporation rates; hence, its total hydropower capacity amounts to 296.208 MW, which is equivalent to 1% of the total electricity production in Algeria. This being said, even if the availability of water resources is limited, some countries have the will and courage to invest in these strategic projects. The UAE is an example of a country that is working hard to diversify its energy–water portfolio, with many leading and innovative projects such as the Hatta dam. This project is not only a technical marvel, but also a formidable touristic attraction where people come from across the globe to take paddle-boat tours in the lower reservoir. Even during scarce rainy seasons, the reservoir is capable of saving the rainwater for energy storage and local irrigation processes.

7. Conclusions and Future Work

In this work, various pumped hydro storage and hydropower projects have been presented for the MENA region, with a focus on the ambitious projects in the UAE. Being an old technology, PHS utilization is very effective and is still ranked highly among large-scale energy storage technologies. This is mainly due to its large capacity to absorb large fluctuations in supply/demand cycles, which will keep PHS relevant and will continue to do so for decades to come. This is the case in countries that have access to fresh bodies of water, such as rivers and large lakes. Dams built around these rivers and lakes can be either natural or man-made; the latter can utilize a branch of a nearby rivers to create a man-made river. Countries such as Egypt and Sudan have large potential to harvest PHS energy from the River Nile, which also regulates irrigation projects and seasonal flooding control. These projects have strategic importance for these countries, knowing that Egypt, for example, produces 8% of all its electricity every year from various PHS storage projects. This being said, the projects in Egypt are stagnant, with only 32 MW of added capacity since 2017, due to the abundance of natural gas and the ease of covering the demand by using gas turbines. On the other hand, Ethiopia has seen a great increase with hundreds of megawatts added every year in hydropower projects. Other countries in the MENA region also use PHS projects for energy storage and load leveling, such as Morocco, Tunisia, and Algeria, who have projects at a limited scale but are nonetheless worth mentioning. The limitations of budget, infrastructural projects, and also rainfall amplify the challenges that are faced by these nations.
On the other hand, the desert country of the United Arab Emirates is attempting to vary its energy portfolio by investing into PHS in the Hatta region, while still relying on oil and gas revenues. The technology in general is very effective, although it is still limited in scale, but it can provide an option in the energy mix that the UAE is trying to maintain. Once the project is operational in 2024, it will provide an estimated 2.06 TWh every year, helping the UAE achieve the goal of relying on 25% renewable energy resources in their energy mix by 2030. EnergyPLAN software was used to project the effect of utilizing various energy resources to face the expected demand of ~38 TWh in 2030, and PHS is proven to provide good potential given the limited rainfall in the country and the abundance of conventional fossil fuel resources.
A current trend of the utilization of PHS systems is coupling with other resources, especially renewable sources, to allow a reduction in variable renewable energy (VRE) curtailment. In such a scheme, PHS installations are coupled with wind generators, floating photovoltaic panels, or solar thermal power plants to achieve frequency regulation, fast ramping, and capacity firming [83]. Evidently, and although PHS is an old technology, its main innovation lies in utilization and coupling with other resources, especially renewables. With the strong move towards renewables in almost all of the countries reviewed in this article, PHS will play a central role in the stability of energy supply and the proliferation of renewables.

Author Contributions

Conceptualization, A.H.A.; methodology, A.H.A.; data curation, S.A.; writing—original draft preparation, S.A.A., H.A., S.A., A.H.A. and M.A.A.; writing—review and editing, S.A.A., H.A., S.A., A.H.A., M.A.A. and A.G.O.; supervision, A.H.A. and A.G.O.; All authors have read and agreed to the published version of the manuscript.

Funding

This research received no external funding.

Institutional Review Board Statement

Not applicable.

Informed Consent Statement

Not applicable.

Data Availability Statement

Not applicable.

Conflicts of Interest

The authors declare no conflict of interest.

References

  1. Alami, A.H. Introduction to Mechanical Energy Storage BT. In Mechanical Energy Storage for Renewable and Sustainable Energy Resources; Alami, A.H., Ed.; Springer International Publishing: Cham, Switzerland, 2020; pp. 1–12. ISBN 978-3-030-33788-9. [Google Scholar]
  2. Hai Alami, A. Analytical and Experimental Evaluation of Energy Storage Using Work of Buoyancy Force. J. Renew. Sustain. Energy 2014, 6, 013137. [Google Scholar] [CrossRef]
  3. Olabi, A.G.; Saleh, B.A.; Abdelghafar, A.A.; Baroutaji, A.; Sayed, E.T.; Alami, A.H.; Rezk, H.; Abdelkareem, M.A. Large-Vscale Hydrogen Production and Storage Technologies: Current Status and Future Directions. Int. J. Hydrogen Energy 2020, 46, 23498–23528. [Google Scholar] [CrossRef]
  4. Sharjah Electricity Water and Gas Authority SEWA. The Annual Statistical Book; SEWA: Sharjah, United Arab Emirates, 2020. [Google Scholar]
  5. Abdelkareem, M.A.; Elsaid, K.; Wilberforce, T.; Kamil, M.; Sayed, E.T.; Olabi, A. Environmental Aspects of Fuel Cells: A Review. Sci. Total Environ. 2021, 752, 141803. [Google Scholar] [CrossRef] [PubMed]
  6. Child, M.; Kemfert, C.; Bogdanov, D.; Breyer, C. Flexible Electricity Generation, Grid Exchange and Storage for the Transition to a 100% Renewable Energy System in Europe. Renew. Energy 2019, 139, 80–101. [Google Scholar] [CrossRef]
  7. Alami, A.H. General Concepts BT. In Mechanical Energy Storage for Renewable and Sustainable Energy Resources; Alami, A.H., Ed.; Springer International Publishing: Cham, Switzerland, 2020; pp. 13–20. ISBN 978-3-030-33788-9. [Google Scholar]
  8. Rabaia, M.K.H.; Abdelkareem, M.A.; Sayed, E.T.; Elsaid, K.; Chae, K.-J.; Wilberforce, T.; Olabi, A.G. Environmental Impacts of Solar Energy Systems: A Review. Sci. Total Environ. 2021, 754, 141989. [Google Scholar] [CrossRef]
  9. Alami, A.H. Thermal Storage. In Mechanical Energy Storage for Renewable and Sustainable Energy Resources; Springer International Publishing: Cham, Switzerland, 2020; pp. 27–34. ISBN 978-3-030-33788-9. [Google Scholar]
  10. Khan, N.; Dilshad, S.; Khalid, R.; Kalair, A.R.; Abas, N. Review of Energy Storage and Transportation of Energy. Energy Storage 2019, 1, e49. [Google Scholar] [CrossRef]
  11. Connolly, D.; Lund, H.; Mathiesen, B.; Leahy, M. A Review of Computer Tools for Analysing the Integration of Renewable Energy into Various Energy Systems. Appl. Energy 2010, 87, 1059–1082. [Google Scholar] [CrossRef]
  12. Gür, T. Review of Electrical Energy Storage Technologies, Materials and Systems: Challenges and Prospects for Large-Scale Grid Storage. Energy Environ. Sci. 2018, 10, 2696–2767. [Google Scholar] [CrossRef]
  13. Zhao, G.; Davison, M. Optimal Control of Hydroelectric Facility Incorporating Pump Storage. Renew. Energy 2009, 34, 1064–1077. [Google Scholar] [CrossRef]
  14. Alami, A.H. Pumped Hydro Storage BT. In Mechanical Energy Storage for Renewable and Sustainable Energy Resources; Alami, A.H., Ed.; Springer International Publishing: Cham, Switzerland, 2020; pp. 51–65. ISBN 978-3-030-33788-9. [Google Scholar]
  15. Uría-Martínez, R.; Johnson, M.; O’Connor, P. 2017 Hydropower Market Report; Department of Energy, Water Power Technologies Office: Washington, DC, USA, 2018. [Google Scholar]
  16. Abdellatif, D.; AbdelHady, R.; Ibrahim, A.; El-Zahab, E. Conditions for Economic Competitiveness of Pumped Storage Hydroelectric Power Plants in Egypt. Renew. Wind Water Sol. 2018, 5, 1. [Google Scholar] [CrossRef] [Green Version]
  17. Petrescu, R.V.; Petrescu, F.T. Hydropower and Pumped Storage. Alternative Energy Magazine, 26 November 2015. [Google Scholar]
  18. Whiteman, A.; Rueda, S.; Akande, D.; Elhassan, N.; Escamilla, G.; Arkhipova, I. Renewable Capacity Statistics 2020; IRENA: Abu Dhabi, United Arab Emirates, 2020. [Google Scholar]
  19. Bowen, T.; Chernyakhovskiy, I.; Xu, K.; Gadzanku, S.; Coney, K. USAID Grid-Scale Energy Storage Technologies Primer; USAID: Washington, DC, USA, 2021. [Google Scholar]
  20. Stocks, M.; Stocks, R.; Lu, B.; Cheng, C.; Blakers, A. Global Atlas of Closed-Loop Pumped Hydro Energy Storage. Joule 2021, 5, 270–284. [Google Scholar] [CrossRef]
  21. Jacobson, M.Z.; Delucchi, M.A.; Bauer, Z.A.F.; Goodman, S.C.; Chapman, W.E.; Cameron, M.A.; Bozonnat, C.; Chobadi, L.; Clonts, H.A.; Enevoldsen, P. 100% Clean and Renewable Wind, Water, and Sunlight All-Sector Energy Roadmaps for 139 Countries of the World. Joule 2017, 1, 108–121. [Google Scholar] [CrossRef] [Green Version]
  22. International Renewable Energy Agency. Renewable Capacity Statistics 2021 Statistiques de Capacité Renouvelable 2021 Estadísticas de Capacidad Renovable 2021; IRENA: Abu Dhabi, United Arab Emirates, 2021; ISBN 9789295111905. [Google Scholar]
  23. Available online: https://commons.wikimedia.org/wiki/File:MENA.svg (accessed on 1 March 2022).
  24. Rehman, S.; Al-Hadhrami, L.; MahbubAlam, M. Pumped Hydro Energy Storage System: A Technological Review. Renew. Sustain. Energy Rev. 2015, 44, 586–598. [Google Scholar] [CrossRef]
  25. Amin, A.Z. Africa 2030: Road Map for a Renewable Energy Future; IRENA: Abu Dhabi, United Arab Emirates, 2015. [Google Scholar]
  26. Tilahun, M.A. Feasibility Study of Pumped Storage System for Application in Amhara Region, Ethiopia. Master’s Thesis, School of Industrial Engineering and Management (ITM), Energy Technology, Heat and Power Technology, Stockholm, Sweden, 2018. [Google Scholar]
  27. Ahmed, A.T.; Helmy Elsanabary, M. Hydrological and Environmental Impacts of Grand Ethiopian Renaissance Dam on the Nile River. In Proceedings of the Eighteenth International Water Technology Conference, IWTC, Sharm El-Sheikh, Egypt, 12–14 March 2015; pp. 336–347. [Google Scholar]
  28. Degefu, D.M.; He, W.; Zhao, J.H. Hydropower for Sustainable Water and Energy Development in Ethiopia. Sustain. Water Resour. Manag. 2015, 314, 305–314. [Google Scholar] [CrossRef] [Green Version]
  29. Zwaan, B.; Boccalon, A.; Longa, F. Prospects for Hydropower in Ethiopia. Energy Strateg. Rev. 2017, 19, 19–30. [Google Scholar] [CrossRef]
  30. Moss, S. Weatherwatch: Ethiopia’s Contrasting Altitudes Bring Extreme Rain and Shine. The Guardian, 25 May 2020. [Google Scholar]
  31. Ingwani, E.; Gumbo, T.; Gondo, T. The General Information about the Impact of Water Hyacinth on Aba Samuel Dam, Addis Ababa, Ethiopia: Implications for Ecohydrologists. Ecohydrol. Hydrobiol. 2010, 10, 341–345. [Google Scholar] [CrossRef]
  32. Lautze, J.; McCartney, M.; Kirshen, P.; Olana, D.; Jayasinghe, G.; Spielman, A. Effect of a Large Dam on Malaria Risk: The Koka Reservoir in Ethiopia. Trop. Med. Int. Health 2007, 12, 982–989. [Google Scholar] [CrossRef]
  33. Regasa, M.S.; Nones, M. Effects of Land Cover/Use Changes on the Ethiopian Fincha Dam Capacity. Development 2020, 17, 18. [Google Scholar]
  34. Devi, R.; Tesfahune, E.; Legesse, W.; Deboch, B.; Beyene, A. Assessment of Siltation and Nutrient Enrichment of Gilgel Gibe Dam, Southwest Ethiopia. Bioresour. Technol. 2008, 99, 975–979. [Google Scholar] [CrossRef]
  35. Ambelu, A.; Lock, K.; Goethals, P.L.M. Hydrological and Anthropogenic Influence in the Gilgel Gibe I Reservoir (Ethiopia) on Macroinvertebrate Assemblages. Lake Reserv. Manag. 2013, 29, 143–150. [Google Scholar] [CrossRef] [Green Version]
  36. Zaniolo, M.; Castelletti, A.; Giuliani, M.; Burlando, P. Seasonal Drought Forecasts to Optimally Balancing Multisector Interests during Reservoir Filling Transients. In Proceedings of the AGU Fall Meeting Abstracts, San Francisco, CA, USA, 9–13 December 2019; Volume 2019, p. H23G-08. [Google Scholar]
  37. Hayicho, H.; Alemu, M.; Kedir, H. Assessment of Land-Use and Land Cover Change Effect on Melka Wakena Hydropower Dam in Melka Wakena Catchment of Sub-Upper Wabe-Shebelle Watershed, South Eastern Ethiopia. Agric. Sci. 2019, 10, 819–840. [Google Scholar] [CrossRef] [Green Version]
  38. Ali, D.A.; Deininger, K.; Monchuk, D. Using Satellite Imagery to Assess Impacts of Soil and Water Conservation Measures: Evidence from Ethiopia’s Tana-Beles Watershed. Ecol. Econ. 2020, 169, 106512. [Google Scholar] [CrossRef] [Green Version]
  39. Welde, K.; Gebremariam, B. Effect of Land Use Land Cover Dynamics on Hydrological Response of Watershed: Case Study of Tekeze Dam Watershed, Northern Ethiopia. Int. Soil Water Conserv. Res. 2017, 5, 1–16. [Google Scholar] [CrossRef]
  40. McCartney, M.P.; Shiferaw, A.; Seleshi, Y. Estimating Environmental Flow Requirements Downstream of the Chara Chara Weir on the Blue Nile River. Hydrol. Process. An Int. J. 2009, 23, 3751–3758. [Google Scholar] [CrossRef]
  41. Yihdego, Y.; Khalil, A.; Salem, H.S. Nile River’s Basin Dispute: Perspectives of the Grand Ethiopian Renaissance Dam (GERD). Glob. J. Hum. Soc. Sci 2017, 17, 1–21. [Google Scholar]
  42. Jembere, D.; Yihdego, Y. Engineering Rock Mass Evaluation for a Multi-Purpose Hydroelectric Power Plant: Case of Genale Dawa (GD-3), Ethiopia. Geotech. Geol. Eng. 2016, 34, 1593–1612. [Google Scholar] [CrossRef]
  43. Gebreyohannes, T.; De Smedt, F.; Walraevens, K.; Gebresilassie, S.; Hussien, A.; Hagos, M.; Amare, K.; Deckers, J.; Gebrehiwot, K. Regional Groundwater Flow Modeling of the Geba Basin, Northern Ethiopia. Hydrogeol. J. 2017, 25, 639–655. [Google Scholar] [CrossRef]
  44. De Waal, D.J.; Verster, A.; Bloemfontein, S.A. Losses Due to Spillage at Gariep Dam. In Proceedings of the 7th International Probabilistic Workshop, Delft, The Netherlands, 25–26 November 2009; pp. 23–33. [Google Scholar]
  45. Cook, T. Engineering Modernity: The Aswan Low Dam and Modernizing the Nile. PhD Thesis, Western Oregon University, Monmouth, OR, USA, 2013. [Google Scholar]
  46. Raslan, Y.; Salama, R. Development of Nile River Islands between Old Aswan Dam and New Esna Barrages. Natl. Water Res. Cent. 2015, 29, 77–92. [Google Scholar] [CrossRef] [Green Version]
  47. Hill, T.J.F. Assiut Barrage, to Rehabilitate or to Rebuild. In Improvements in Reservoir Construction, Operation and Maintenance, Proceedings of the 14th Conference of the British Dam Society at the University of Durham, Durham, UK, 6–9 September 2006; Thomas Telford Publishing: London, UK, 2006; pp. 224–235. [Google Scholar]
  48. Abu-Zeid, M.; El-Shibini, Z. Egypt’s High Aswan Dam. Int. J. Water Resour. Dev. 2010, 13, 209–218. [Google Scholar] [CrossRef]
  49. Sattar, A.; Raslan, Y. Predicting Morphological Changes DS New Naga-Hammadi Barrage for Extreme Nile Flood Flows: A Monte Carlo Analysis. J. Adv. Res. 2014, 5, 97–107. [Google Scholar] [CrossRef] [Green Version]
  50. Abd-El Monsef, H.; Smith, S.E.; Darwish, K. Impacts of the Aswan High Dam after 50 Years. Water Resour. Manag. 2015, 29, 1873–1885. [Google Scholar] [CrossRef]
  51. Mansour, B.G.S.; Nashed, N.F.; Mansour, S.G.S. Model Study to Optimize the Hydraulic Performance of the New Naga Hammadi Barrage Stilling Basin. In Proceedings of the Bridging the Gap: Meeting the World’s Water and Environmental Resources Challenges, Orlando, FL, USA, 20–24 May 2001; pp. 1–9. [Google Scholar]
  52. Rabah, A.; Nimer, H.; Doud, K.; Ahmed, Q. Modelling of Sudan’s Energy Supply, Transformation, and Demand. J. Energy 2016, 2016, 16. [Google Scholar] [CrossRef] [Green Version]
  53. Bosshard, P. Kajbar Dam Sudan. 2016. Available online: https://www.banktrack.org/project/kajbar_dam/pdf (accessed on 1 March 2022).
  54. Elgameel, M.; Abdellatif, M. Operation of Roseires and Sennar Dams Using Artificial Neural Network. Master’s Thesis, University of Khartoum, Khartoum, Sudan, 2004. Available online: https://core.ac.uk/download/pdf/71674486.pdf (accessed on 1 March 2022).
  55. Zoellner, F.; Scheid, Y.; Mukthar, M. Implementation of the Dam Complex at Upper Atbara, Sudan, in Challenging Site Conditions, Environmental Science Conference. 2017. Available online: https://www.semanticscholar.org/paper/Implementation-of-the-Dam-Complex-at-Upper-Atbara%2C-Zoellner-Scheid/57533d5e6c5462e216bda0b2bb5712eb05d85f7a (accessed on 1 March 2022).
  56. Kajbar, T. Kajbar Dam, Sudan. 2010. “Status Report: Africa-EU Energy Partnership,” European Union Energy Initiative. 2014. Available online: http://www.euei-pdf.org/ (accessed on 1 March 2022).
  57. Kousksou, T.; Allouhi, A.; Jamil, A.; El Rhafiki, T.; Arid, A.; Zeraouli, Y. Renewable Energy Potential and National Policy Directions for Sustainable Development in Morocco. Renew. Sustain. Energy 2015, 47, 46–57. [Google Scholar] [CrossRef]
  58. Stambouli, A. An Overview of Different Energy Sources in Algeria. Jordan Engineering Association Conference. 2018. Available online: http://www.jeaconf.org/UploadedFiles/Document/db8b44dd-8036-47ef-a62a-080f35315daa.pdf (accessed on 1 March 2022).
  59. Euei Pdf on behalf of Aeep. Status Report: Africa-EU Energy Partnership. Eur. Union Energy Initiat. 2014. Available online: https://africa-eu-energy-partnership.org/wp-content/uploads/2020/04/04_150902_euei_aeep_status-report_en_rz_05_web_0.pdf (accessed on 1 March 2022).
  60. United Nations Industrial Development Organization (UNIDO). World Small Hydropower Development Report 2016; United Nations Industrial Development Organization: Vienna, Austria, 2016; Volume 650. [Google Scholar]
  61. Remini, B.; Kettab, A.; Hihat, H. Choking up of Ighil Emda Dam with Mud. La Houille Blanche 1995, 1995, 23–31. [Google Scholar] [CrossRef] [Green Version]
  62. Bouraiou, A.; Necaibia, A.; Boutasseta, N.; Mekhilef, S.; Dabou, R.; Ziane, A.; Sahouane, N.; Attoui, I.; Mostefaoui, M.; Touaba, O. Status of Renewable Energy Potential and Utilization in Algeria. J. Clean. Prod. 2020, 246, 119011. [Google Scholar] [CrossRef]
  63. Ott, J.C. Construction of Bou-Hanifia Dam, Algeria (La Construction Du Barrage de Bou-Hanifia (Algerie)); Britt, S., Translator; U.S. Geological Survey: Reston, VA, USA, 1946. [Google Scholar]
  64. Remini, B.; Ouidir, K. Le Barrage Reservoir D’erraguene (algerie): Une Experience De Plus D’un Demi-siecle Dans Le Soutirage Des Courants De Densite. Larhyss J. 2017, 14, 213–244. [Google Scholar]
  65. Gupta, H.K.; Rastogi, B.K. Seismic Reservoir Sites: Their Geology and Seismicity. In Dams and Earthquakes; Chapter 3; Elsevier: Amsterdam, The Netherlands, 1976; Volume 11, pp. 43–117. ISBN 0165-1250. [Google Scholar]
  66. Ullah, I.; Rasul, M. Recent Developments in Solar Thermal Desalination Technologies: A Review. Energies 2018, 12, 119. [Google Scholar] [CrossRef] [Green Version]
  67. Nadir, M.; Boualem, R. Study of Beni Haroun Dam Pollution (Algeria). Desalin. Water Treat. 2016, 57, 2766–2774. [Google Scholar] [CrossRef]
  68. Diaf, M.; Hazzab, A.; Yahiaoui, A.; Belkendil, A. Characterization and Frequency Analysis of Flooding Solid Flow in Semi-Arid Zone: Case of Mekerra Catchment in the North-West of Algeria. Appl. Water Sci. 2020, 10, 59. [Google Scholar] [CrossRef] [Green Version]
  69. Ghernaout, D.; Benblidia, C.; Khemici, F. Microalgae Removal from Ghrib Dam (Ain Defla, Algeria) Water by Electroflotation Using Stainless Steel Electrodes. Desalin. Water Treat. 2015, 54, 3328–3337. [Google Scholar] [CrossRef]
  70. Horchani, A. Water in Tunisia: A National Perspective; National Academic Press: Washington, DC, USA, 2007. [Google Scholar]
  71. UNEP, United Nations Environment Programme. Document Repository, Energy Profile Tunisia. 2021. Available online: https://wedocs.unep.org/bitstream/handle/20.500.11822/20592/Energy_profile_Tunisia.pdf?sequence=1&isAllowed=y (accessed on 1 March 2022).
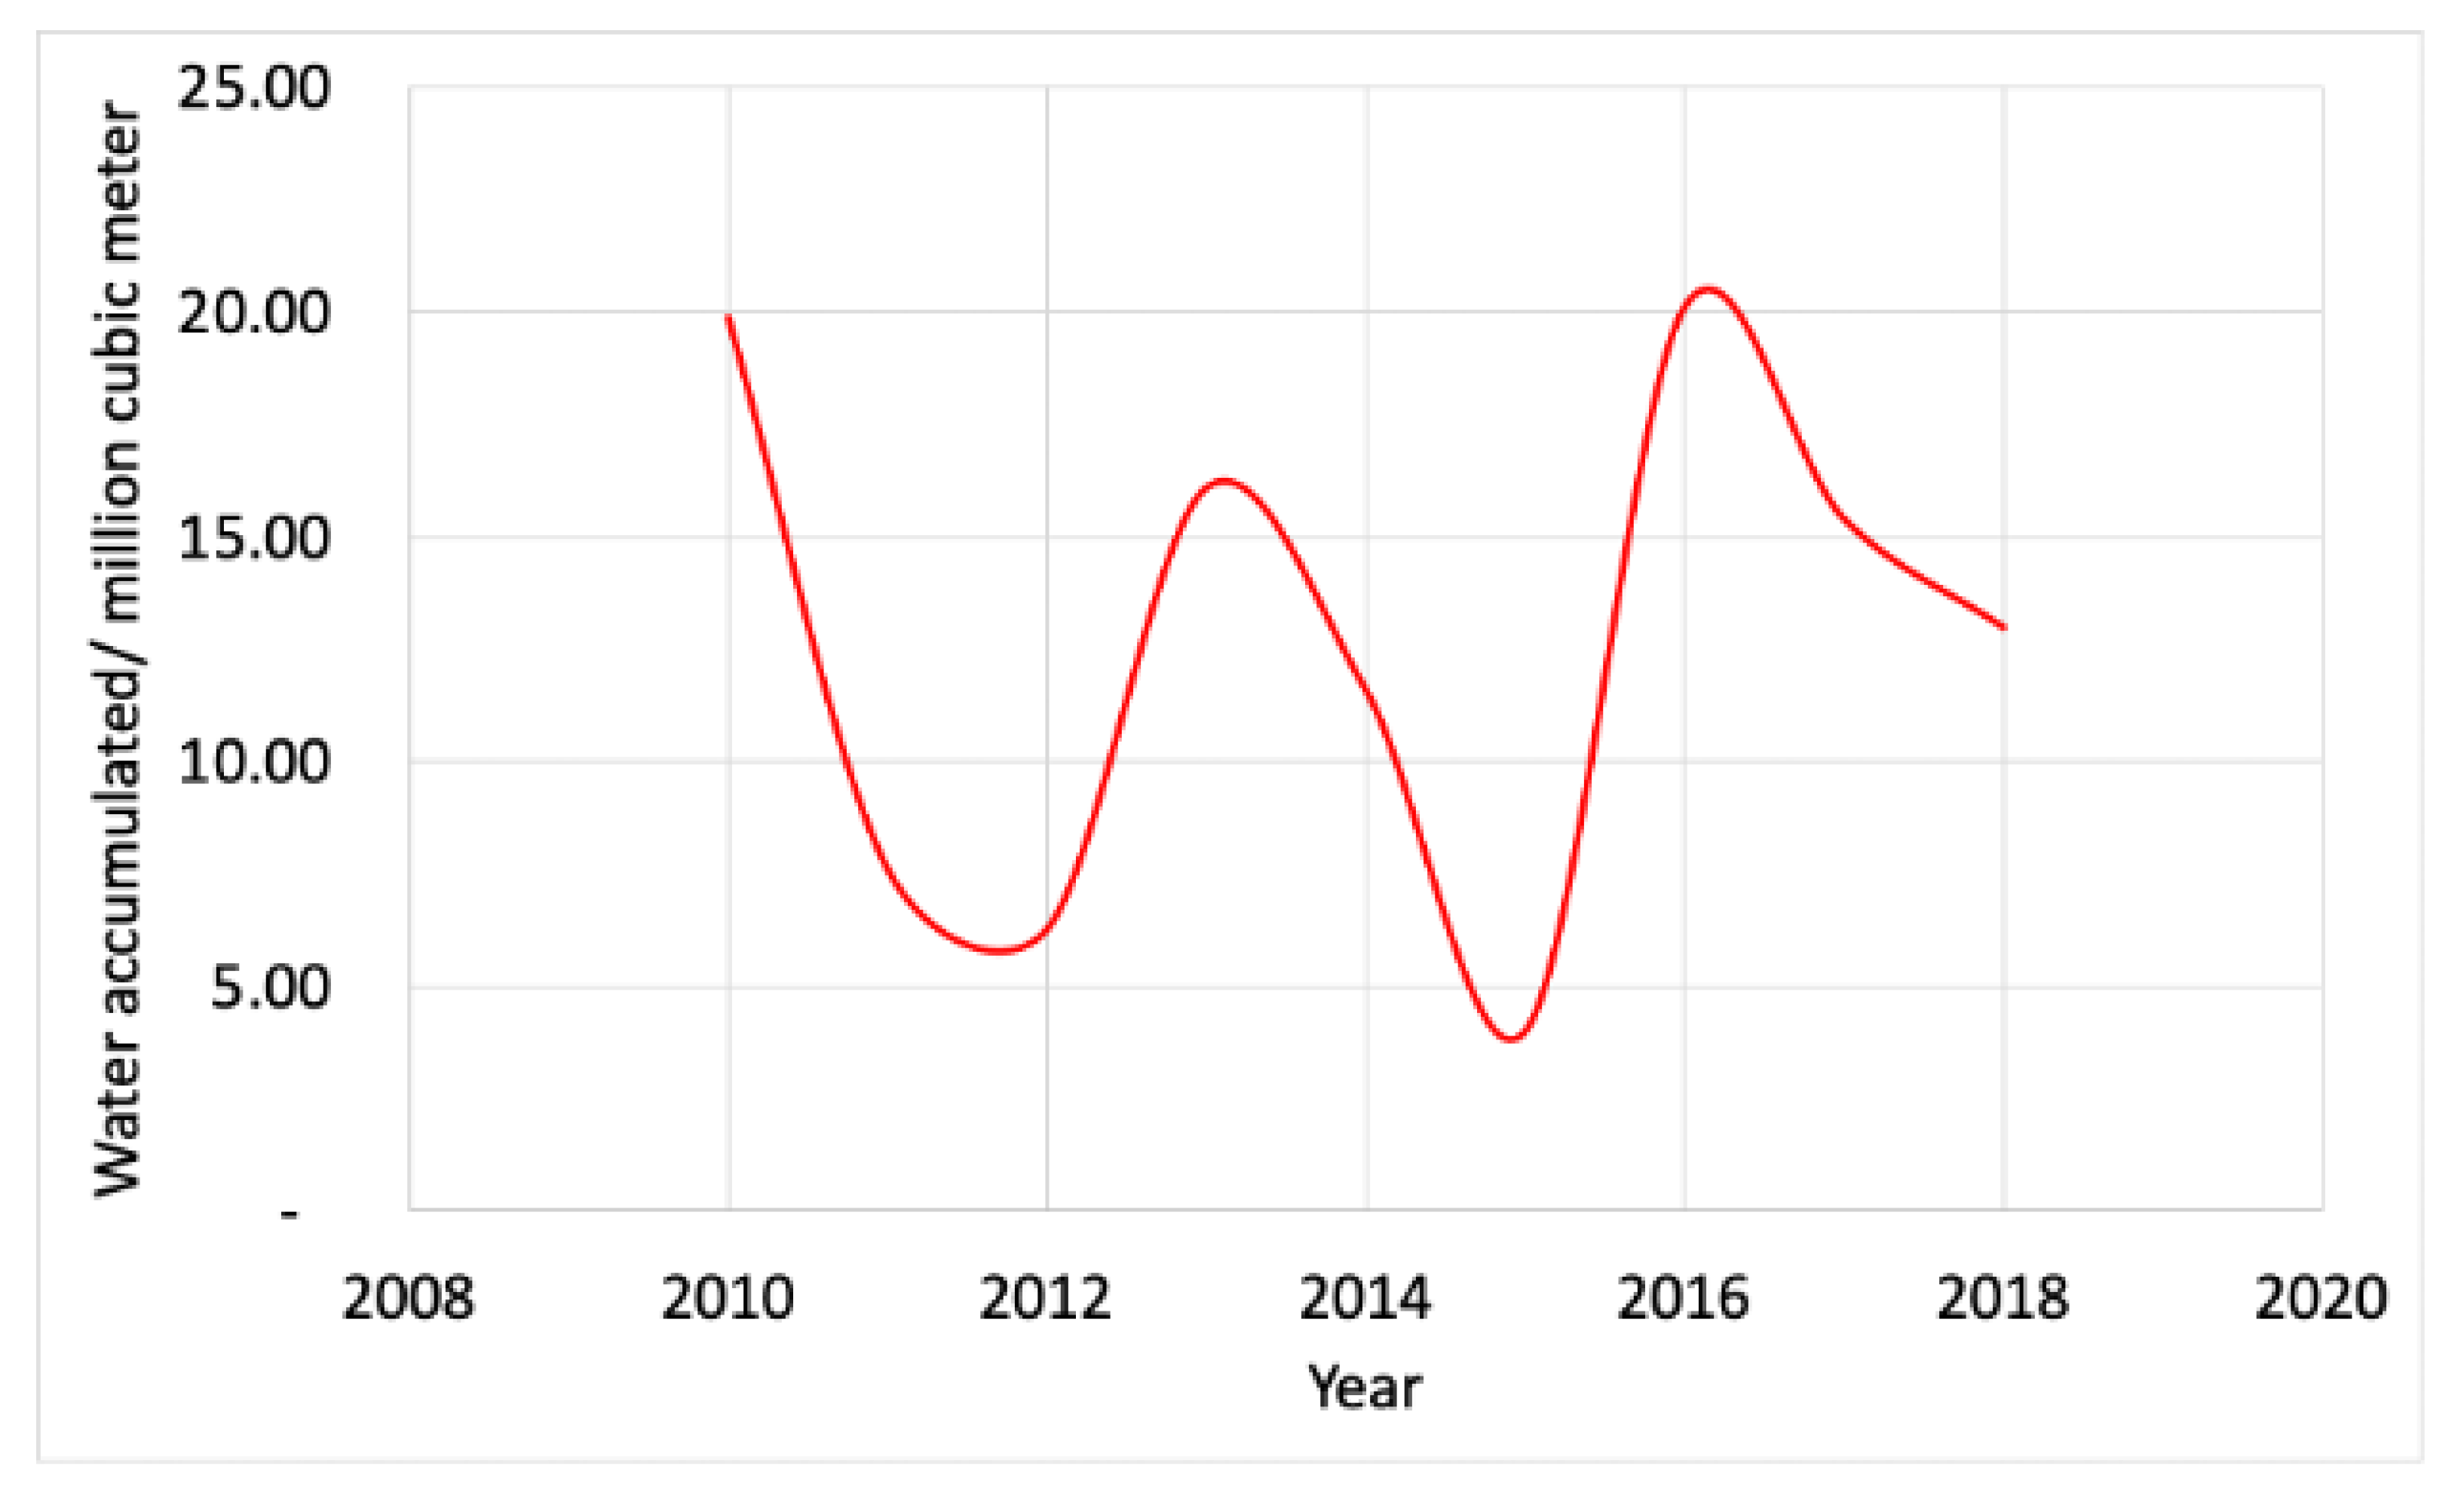
  72. Ministry of Energy and Industry. Total Water Accumulated in-MOEI Dams in Million Cubic Meter. 2020. Available online: https://data.bayanat.ae/ar/dataset/total-water-accumulated-in-moei-dams-million-cubic-meter (accessed on 1 March 2022).
  73. Sanderson, D. UAE Water Resources under “Extreme Stress”, New Report Finds. The National, 8 August 2019. [Google Scholar]
  74. NS Energy. Hatta Pumped Storage Hydroelectric Project, NS Energy Business. 2019. Available online: https://www.nsenergybusiness.com/projects/hatta-pumped-storage-hydroelectric-project/ (accessed on 1 March 2022).
  75. Jamil, M.; Ahmad, F.; Jeon, Y.J. Renewable Energy Technologies Adopted by the UAE: Prospects and Challenges–A Comprehensive Overview. Renew. Sustain. Energy Rev. 2016, 55, 1181–1194. [Google Scholar] [CrossRef] [Green Version]
  76. Gulf News. Mohammed Bin Rashid Al Maktoum Solar Park Launches Third Phase in Dubai. UAE—Gulf News, 12 December 2020. [Google Scholar]
  77. UAE Energy Strategy 2050—The Official Portal of the UAE Government. 2020. Available online: https://u.ae/en/about-the-uae/strategies-initiatives-and-awards/federal-governments-strategies-and-plans/uae-energy-strategy-2050 (accessed on 1 March 2022).
  78. “Jebel Ali M-Station, Dubai—UAE’s biggest power and desalination facility,” Power Technology. 2015. Available online: https://www.power-technology.com/projects/jebel-ali-m-station/ (accessed on 1 March 2022).
  79. DEWA. DEWA Signs MoU with Masdar and EDF for Phase 3 of Mohammed bin Rashid Al Maktoum Solar Park, and with EDF for Hatta Hydroelectric Plant|EDF Middle East. 2017. Available online: https://www.dewa.gov.ae/en/about-us/media-publications/latest-news/2017/11/dewa-signs-mou-with-masdar-and-edf-for-phase-3-of-mohammed-bin-rashid-al-maktoum-solar-park (accessed on 1 March 2022).
  80. Dubai Pushes Solar Power Cost to World’s Lowest as Largest Single-Site Solar Park Set to Rise. Environment—Gulf News, 19 March 2018.
  81. Blakers, A.; Stocks, M.; Lu, B.; Cheng, C. A Review of Pumped Hydro Energy Storage. Prog. Energy 2021, 3, 022003. [Google Scholar] [CrossRef]
  82. IRENA. Renewable Power Generation Costs in 2020; IRENA: Abu Dhabi, United Arab Emirates, 2020; ISBN 978-92-9260-244-4. [Google Scholar]
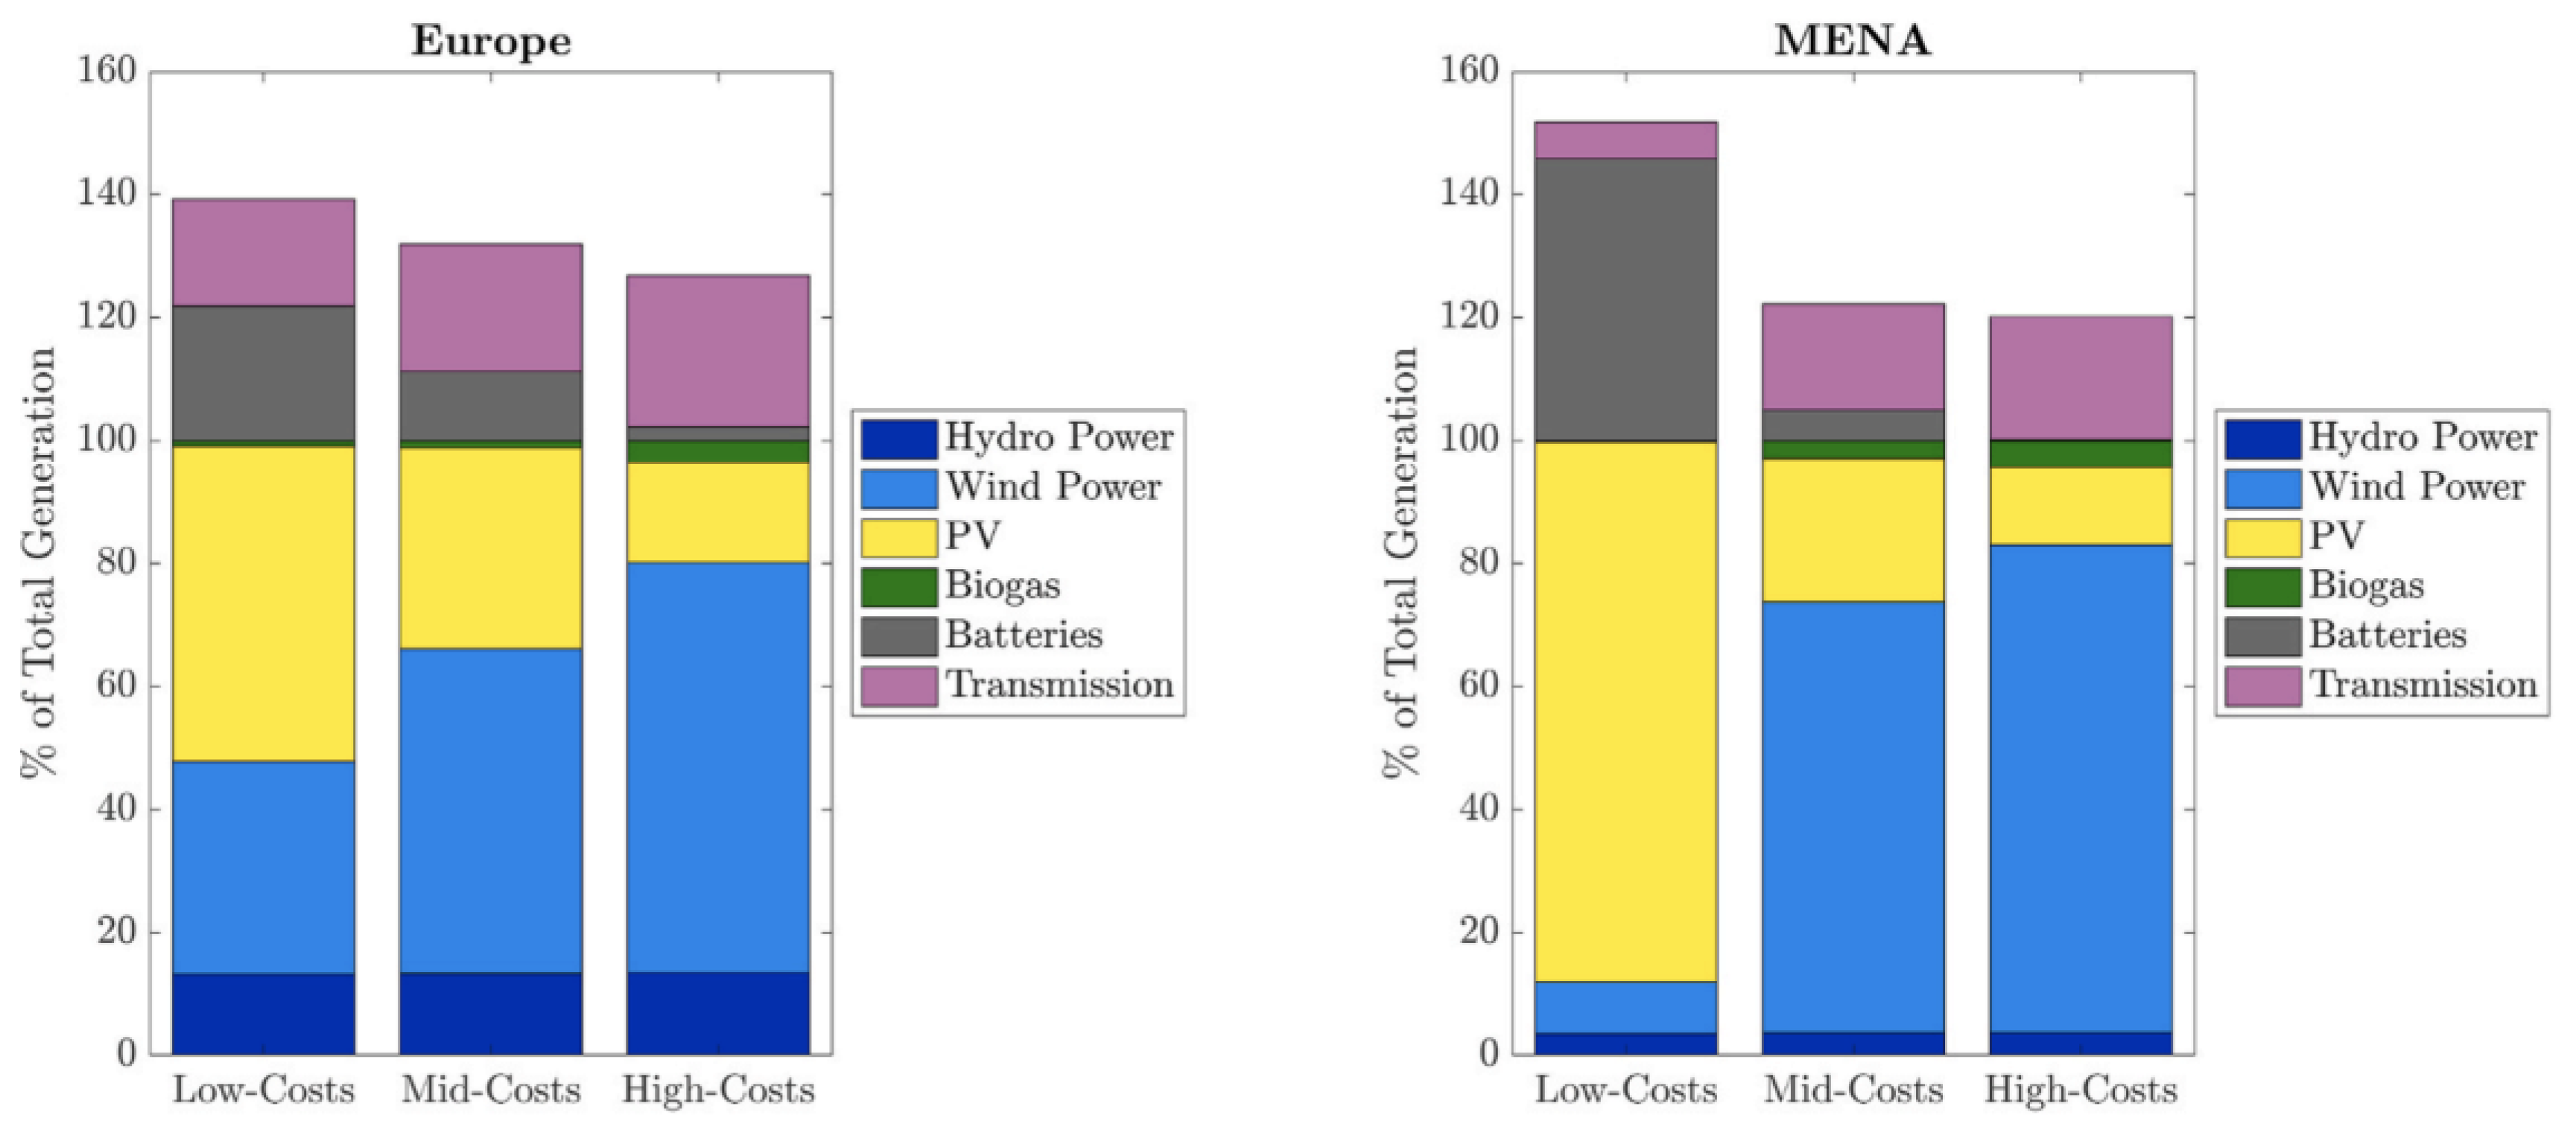
  83. Fälth, H.E.; Atsmon, D.; Reichenberg, L.; Verendel, V. MENA Compared to Europe: The Influence of Land Use, Nuclear Power, and Transmission Expansion on Renewable Electricity System Costs. Energy Strateg. Rev. 2021, 33, 100590. [Google Scholar] [CrossRef]
  84. IRENA. Innovative Operation of Pumped Hydropower Storage Innovation Landscape Brief; IRENA: Abu Dhabi, United Arab Emirates, 2020; pp. 1–24. [Google Scholar]
Figure 1. (a) A depiction of potential time for energy storage based on daily demand variation; green areas are where storage is permissible to keep powerplant operating at base load and (b) is actual demand for the Emirate of Sharjah, UAE, in 2020 compared to 2019.
Energies 15 02412 g001
Figure 2. General classification of available storage technologies.
Energies 15 02412 g002
Figure 3. Grid-connected operational capacities of all storage technologies, all capacities are in MW [10].
Energies 15 02412 g003
Figure 4. Operation of PHS system in (a) charge and (b) discharge.
Energies 15 02412 g004
Figure 5. Hydropower global capacity, shares of top 10 countries and the rest of world, 2019 [18].
Energies 15 02412 g005
Figure 6. Ecosystem of energy storage technologies and services [19].
Energies 15 02412 g006
Figure 7. Depiction of the MENA region (in blue) [23].
Energies 15 02412 g007
Figure 8. Total water accumulation in dams [72].
Energies 15 02412 g008
Figure 9. The Hatta dam project location [74].
Energies 15 02412 g009
Figure 10. Projection of the monthly average electricity demand and production in the UAE in 2030.
Energies 15 02412 g010
Figure 11. Fluctuations in the monthly energy share for several renewable energy sources in the UAE.
Energies 15 02412 g011
Figure 12. Total installed cost for large hydropower plants by country/region, 2010–2020 [82].
Energies 15 02412 g012
Figure 13. Total installed cost for small hydropower plants by country/region, 2010–2020 [82].
Energies 15 02412 g013
Figure 14. Optimal electricity generation mix in MENA and Europe.
Energies 15 02412 g014
Table 1. Advantages and disadvantages of PHS.
AdvantagesDisadvantages
Renewable and clean (since water is the working fluid).The initial capital cost of PHS installations is sometimes prohibitively high; thus, modular pumped hydro systems are more attractive in terms of direct cost reductions.
Has the capability of easily meeting energy demand fluctuations.Potential site-specific negative environmental impacts, especially on aquatic life.
Low maintenance and operational costs.The electrical energy used to pump water back from the lower reservoir to the upper can come from various energy sources, such as nuclear energy plants that are coal-fired, producing energy that cannot be adjusted to follow the fluctuations of the load. Hence, the new forms of PHS, including ternary pumped hydro and adjustable-speed pumped hydro, could be utilized to overcome this challenge.
PHS can be used even if there is little available natural water and store it in artificial dams.Geographical altitude and amount of water availability.
It is sometimes subject to social and environmental issues if the place is of natural and tourist beauty.
Table 2. Hydropower capacity of production in MW from 2010 to 2020 on different continents [18].
Africa
CAP (MW)20102011201220132014201520162017201820192020
Egypt28002800280028002800280028002800283228322832
Morocco17701770177017701770177017701770177017701770
Sudan15931593159315931593159315931753190719071907
Tunisia6262626262626262626262
South Africa21352135213521352132214731463479347934793479
Algeria228228228228228228228228228228288
Ethiopia18751972197219721972215921593817381738174071
Asia
Afghanistan241245273277280284329333333333333
Japan47,73648,41948,93448,93249,59750,03550,11750,01450,03150,00850,016
Indonesia37413953415651775242532256665703577259766210
China216,057232,980249,470280,440304,860319,530332,070343,775352,261358,040370,160
India40,65142,41743,03544,17345,40747,10347,62449,53650,08250,22550,680
Europe
Norway29,69329,96930,50931,03331,24031,37131,83431,93032,53032,79733,003
France25,42525,64225,65725,64625,57725,55225,62125,70725,72725,86925,897
Italy21,52021,73721,88022,00922,09822,22022,29822,42622,49922,54122,448
Eurasia
Russian Federation47,30147,34449,31049,96850,70950,99851,01651,24151,33351,81951,811
Turkey15,83117,13719,60922,28923,64325,86826,68127,27328,29128,50330,984
North America
USA101,023100,943101,107101,589102,162102,240102,692102,703102,847102,769103,058
Canada75,57375,53775,53775,53775,53779,42080,25980,83181,00481,05381,058
Mexico11,59711,57111,62611,63312,46412,22312,58012,64212,64212,67112,671
South America
Brazil80,70382,45784,29486,01989,19491,65196,930100,333104,482109,143109,318
Venezuela14,62414,62414,62414,88114,88115,13816,52116,52116,52116,52116,521
Table 3. Statistics on pure pumped hydro storage (PHS) in the world [22].
CAP (MW)20102011201220132014201520162017201820192020
World99,756102,993105,617106,856108,597111,853116,942119,849120,496120,844121,273
Africa18641864186418641864186428633196319631963196
Morocco464464464464464464464464464464464
South Africa14001400140014001400140023992732273227322732
Asia49,26352,41554,83556,03557,21858,33861,99864,66865,26865,56865,598
China16,93018,38320,33321,53322,11023,03026,69029,39029,99030,29030,320
Chinese Taipei26022602260226022602260226022602260226022602
India47864786478647864786478647864786478647864786
Japan19,74920,64921,11921,11921,72421,92421,92421,89421,89421,89421,894
Korea Rep39004700470047004700470047004700470047004700
Philippines736736736736736736736736736736736
Thailand560560560560560560560560560560560
Eurasia12161216121612161216121612161216135613561356
Russian Fed12161216121612161216121612161216135613561356
Europe26,70126,70826,83926,85727,32628,33228,60128,47328,33428,33428,318
Belgium13071307130713101310131013101310131013101310
Bosnia Herzegovina420420420420420420420420420420420
Bulgaria864864864864864864864864864864864
Czechia11471147114711721172117211721172117211721172
France18081808180818081728172817281728172817281728
Germany58115811565056505654566655785493535553555355
Ireland00292292292292292292292292292
Italy39573957395739573982398239823940394039403940
Lithuania760760760760760760760760760760760
Luxembourg11001100110011001296129612961296129612961296
Poland14061406140614061406140614131423142314231423
Romania9292929292929292929292
Serbia614614614614614614614614614614614
Slovakia916916916916916916916916916916916
Slovenia180180180180180180180180180180180
Spain24492465246524552455328033213321332133213321
Sweden108999999999999NANANANA
Switzerland456456456456456469527527527527527
UK24442444244424442444260026002600260026002600
Ukraine8628628628621186118614211509150915091509
European Union (28)24,34924,35624,48724,50524,65025,64325,61925,40325,26425,26425,248
Middle East240240240240240128012801280128012801580
Iran IR 104010401040104010401040
Iraq240240240240240240240240240240240
N America18,68818,76618,83918,86018,95019,04019,20119,23319,27819,32619,441
Canada177177174174174174174174174174174
USA18,51118,58918,66518,68618,77618,86619,02719,05919,10419,15219,267
Oceania810810810810810810810810810810810
Australia810810810810810810810810810810810
S America974974974974974974974974974974974
Argentina97497497497974974974974974974974
Table 4. Ethiopian hydropower plants.
ICS Power PlantRiverInstalled Capacity (MWe)Operational SinceCostRefs.
Aba SamuelAkaki6.61932USD 14 million[31]
Koka (Awash I)Awash431960USD 34.9 million[32]
Awash II + IIIAwash641966
1971
[32]
FinchaFincha1341973 [33]
Fincha Amerti Neshe (FAN)Amerti/Neshe952011USD 147.3 million[33]
Gilgel Gibe IGilgel Gibe1842004 [34]
Gilgel Gibe IIGilgel Gibe /Omo4202010 [35]
Gilgel Gibe IIIOmo18702016USD 1.870 billion[35]
KoyshaOmo(2160)Under
construction
[36]
Melka WakenaShebelle1531989 [37]
Tana BelesBeles4602010USD 500 million[38]
TekezeTekeze3002010USD 360 million[39]
Tis Abay I + IIBlue Nile84.41953
2001
[40]
GERD HidaseBlue Nile(6450)Under construction, 65% complete (4/2018)USD 4.8 billion[41]
Genale Dawa IIIGanale2542017
Operational, but out of use for social reasons
USD 451 million[42]
Genale Dawa VIGanale(257)First quarter of 2020USD 451 million[42]
Geba I + IIGebba(385) USD 124 million Geba 2[43]
GRHEPBlue Nile6450Started: 2011
Pre-generation works are expected to be completed by December 2020; project completion expected by 2022
USD 4.5 billion[44]
Table 5. Egypt electricity capacity by hydropower.
Hydro and MarineCapacity by YearsCapacity
201812,726 GWh
2019/20202851 MW
Table 6. Egypt hydropower plants.
NameInstalled Capacity (MWe)Operational DateCostRefs.
Aswan High Dam2100 MWConstruction: 1960
Completed: 1968
Officially inaugurated: 1971
USD 1 billion[50]
Assiut32 MW
annual production: 245 million kWh
Construction began: 1898
Opening date: 1903
GDP 870,000
4 turbines, each with a capacity of 8 MW
[47]
Naga Hammadiproduce 64 MW2002 to 2008EUR 300M (USD 421 M)[51]
AttaqaPHS production capacity of 2400 MW2024 completion dateUSD 2.6 billion[16]
Table 7. Sudan hydroelectric power plant (operational, under construction, and planned) [52].
Capacity
InstalledNominalProduction
NumberNameYearMWMWGWh
Operational Plants
1Merowe Dam2009125012405580
2Roseires Dam19662802701050
5Sennar Dam1962151249
3Jebel Aulia Dam2003301955
4Khasm El Girba Dam1964101015
 Subtotal A158515516749
Plants Under Construction
5Upper Atbra and Sitat2015323320834
6Sennar upgrading20151113.766
Planned plants
7Shereik4202103
8Kajbar3601799
9Sabaloka205866
10Dal Low6482185
11Dagash3121349
12Mograt3121214
 Subtotal B22579515
Total (A + B) 38416,264
Available power%3839
Table 8. Sudan hydropower plants.
NameGeneration CapacityOperational SinceCostRefs.
Merowe DamAnnual generation: 5.5 TWhConstruction began: 2004
Opening date: 2009
EUR 1.2 billion[53]
Roseires Dam280 MW2012USD 396 million[54]
Upper Atbara and Setit380 GWh annuallyConstruction began: 2011
Opening date: 2017
USD 1.9 billion[55]
KajbarInstalled capacity: 360 MWStarted 2017—expected completion date unknownUSD 700 million[56]
Table 9. Algeria hydroelectric production in 2003 [58].
PlantInstalled Power (MW)Ref.PlantInstalled Power (MW)Ref.
Darguina71.5[57]Ighzernchebel2.712[59]
Ighil Emda24[60]Gouriet6.425[61]
Mansouria100[62]Bouhanifia5.700[63]
Erraguene16[64]Oued Fodda15.600[65]
Souk El Djemaa8.085[66]Beni Behde3.500[67]
Tizi Meden4.458[68]Tessala4.228[69]
Ghrib7[70]Total269.208
Table 10. Tunisian electricity capacity by hydropower [18].
Hydro and MarineCapacity by YearsGeneration
201866 MW
2019–202066 MW
Table 11. UAE Non-Conventional and Conventional Water Resources.
Processed Water ResourcesNatural Water Resources
–475 million m3 per year of desalinated water
–150 million m3 of treated water
–125 million cubic meters per year from seasonal floods
–3 million cubic meters per year from permanent springs
–22 million cubic meters per year from seasonal springs
–20 million cubic meters per year from falaj drainage
–109 million cubic meters annually of aquifer recharge
Table 12. Main dams constructed in the UAE.
NoNameCapacity (Mm3)NoNameCapacity (Mm3)
1Bih7.513Siji0.750
2Ham7.00014Sufni0.460
3Hadf0.30015Burak0.280
4Zikt3.50016Shawkah0.272
5Tawayyaien19.50017Dalm0.272
6Hatta4.50018Safad, Thyib0.260
7Shuaib20.00019Ghalilah0.250
8Shi3.00020Merbih, Kadfaa0.242
9Warraiyaa5.50021Kidaa0.220
10Gulfa0.12522Shaam0.152
11Eden0.05023Ramth0.134
12Gheli0.12024Mai0.113
Table 13. Input data for the power plants.
Conventional/Non-Conventional Power PlantsCapacity MW (MegaWatts)Efficiency (%)Costs (MDKK)LocationReference
Conventional power plant (Jebel Ali Power Plant)288585.8%16,685Jebel Ali, Dubai[78]
Dammed Pumped Hydropower25080%3210Hatta, Dubai[79]
Photovoltaic (PV) panels/farms800NA5820MBRAK Solar Park[76]
Concentrated Solar Power (CSP)700NA23,690MBRAK Solar Park[80]
Table 14. Total annual electricity production required for the achievement of the 2030 goal of utilizing renewable energy sources to supply 25% of the electricity in the UAE.
YearElectricity Share (TWh/year)
Current energy mix
PV1.66
CSP0.49
PHS0
Power plant26.87
Import8.76
Export0
Total37.78
25% renewable share of electricity
PV6.74
CSP0.49
PHS2.07
Power plant22.78
Import5.69
Export0
Total37.78
Publisher’s Note: MDPI stays neutral with regard to jurisdictional claims in published maps and institutional affiliations.

