Review

Mapping in the Topic of Mathematical Model in Paddy Agricultural Insurance Based on Bibliometric Analysis: A Systematic Review Approach

1
Department of Mathematics, Faculty of Mathematics and Natural Science, Universitas Padjadjaran, Sumedang 45363, Indonesia
2
School of Mathematical Sciences, Faculty of Science and Technology, Universiti Kebangsaan Malaysia, Bangi 43600, Malaysia
*
Author to whom correspondence should be addressed.
Computation 2022, 10(4), 50; https://doi.org/10.3390/computation10040050
Submission received: 19 February 2022 / Revised: 18 March 2022 / Accepted: 22 March 2022 / Published: 24 March 2022

Abstract

:
Bibliometric analysis is the quantitative study of bibliographic material. In this paper, a systematic review of papers, authors, and journals is carried out. This is necessary to determine and set targets to be achieved in further research. The main objective of this study is to identify some of the most relevant research and the latest trends according to the information found in the Google Scholar, Publish or Perish, Science Direct, and Dimension databases. The methods used are classification, analysis of the most cited journals of all time, and the most prolific and influential authors. The results are information on the number of papers, citations, researchers, h-index, g-index, major reference journals, and visualization of research roadmaps for the topic of agricultural insurance mathematical models. The research findings identify the core themes, which are used as research gaps for future research.

1. Introduction

The background of this research is to investigate the core theme of mathematical model research for rice agricultural insurance by analyzing citations of papers in journals. This aims to determine the evolution and research trends of the mathematical model of rice agricultural insurance in the future. Research on rice farming insurance in Indonesia started in 2015 [1]. Paddy farming is the main source of livelihood for rural communities in Indonesia. In its implementation, paddy farming faces various risks. These risks include the risk of crop failure due to climate change, such as floods, drought, and other parties [2,3]. Farmers can transfer these risks to other parties to overcome losses. One of them is through the paddy agricultural insurance program which is one of the Ministry of Agriculture’s programs [4,5]. A lot of research on agricultural insurance has been undertaken, as indicated by various publications that have been published. In this paper, a literature review study will be conducted on journals related to the topic of agricultural insurance, especially paddy farming. From the search results of study materials or literature studies, it turns out that agricultural insurance has been introduced since 1899 and, according to its development there have been many studies conducted by [6,7].
Some countries that have implemented agricultural insurance such as the United States and Japan began around 1899 and 1939, while in Brazil it started in 1954 [8]. Canada and Mexico have implemented agricultural insurance programs and operated a number of companies for their operations since 1961 and 1964 from paper [9]. India has been running this program since 1979. In Thailand, insurance for paddy farming started in 2008, while in Malaysia it only started in 2013. Several studies have also been carried out, for example [10], which discusses the price of weather insurance contracts based on the temperature index using the index model and modeling the insurance approach. The results obtained are significant differences between the approach with the historical burn method and the index insurance model. Rainfall index-based insurance research with the Black Scholes model approach for determining premium prices was carried out [11]. Research by [12] conducted a study to measure the operational risk of agricultural insurance losses using Value at Risk and Conditional Value at Risk. Especially for paddy farming insurance, the same method is used for cases that occur in the territory of Indonesia as studied [13,14]. Research conducted by [15,16] discusses index insurance in which a guarantor’s benefit is claimed if agricultural land is exposed to the risk of excessive rainfall. Climate data and results are used to develop insurance for the excess rainfall index. There are also several studies that discuss the impact of climate change on the agricultural sector. Yield variability due to uncertain climatic conditions indicates increased production risk. Research on optimal drought index insurance to design weather index insurance was carried out by [17,18,19,20]. In this study, we evaluated the demand for weather index insurance (WII) among smallholder producers in the South Tharaka sub-county of the Tharaka Nithi region in the arid and semi-arid lands (ORG) of Kenya, focusing on the role of underlying risk. The results estimate the discrepancy between WII payments and actual losses and test the WII approach as a risk management tool. Research conducted by [21] estimates the rainfall index insurance risk base for grasslands and forages. Research conducted by [22,23] discusses weather index insurance, use of agricultural inputs and crop productivity in Kenya.
For more details, this study examines all research results that have been published in the indexed journals Scopus and Google Scholar. The data source/digital library used is from four main sources, namely Publish or Perish, Dimensions (https://www.dimensions.ai/, accessed on 26 October 2020), Science Direct (https://www.sciencedirect.com, accessed on 26 October 2020), and Google Scholar (https://scholar.google.com/, accessed on 11 November 2020).
Based on the background of the problem, this paper discusses a literature study as a first step to determine study materials that can be researched related to the determination of insurance premiums for rice farming. The purpose of this study is to uncover or identify the position of the research and obtain novelty from the mathematical model of determining insurance premiums for rice farming. This is done to find out the evolution and trends of future rice agricultural insurance research.

2. Materials and Methods

2.1. Materials

A systematic literature review is carried out through several stages, including a recorded/documented selection process, bibliometric analysis, and literature review in the form of analysis and synthesis of the selected articles. This paper uses an analysis or bibliometric method also known as Scientometrics (the measurement and analysis of scientific literature), which is part of the research evaluation methodology from a variety of literature that has been produced, and allows bibliometric analysis using a separate method [24,25]. The bibliometric method is a literature measurement method using a statistical approach so that it includes the application of quantitative analysis. This study uses bibliometric analysis techniques to provide an overview of the research conducted in the science of conditional based maintenance (CBM). The aim of this paper is to determine the most influential research that has been carried out in this area. In this paper, a methodology is proposed. First, collect articles using the Web of Science based on selected keywords from 1970 to 31 December 2017. Next, determine the most influential journals, articles, keywords, authors, and institutions [26,27,28]. The research uses bibliometric methods, the scope of which is to analyze literature sections or topics (metadata), including analyzing citations, publication trends, author collaborations, agency collaborations, title trend terms, abstract trend terms, author keyword trending terms, and journals and public relations [29,30,31,32].
This literature review research paper is based on the results of a preliminary review of the literature review, and performs a bibliographical analysis of all published papers related to the keywords “crop failure risk”, “extreme value theory”, “insurance index”, “risk”, “premium”, “benefit”, and “threshold”. Based on the results of a Publish or Perish search that included all references, it was found that agricultural insurance has been practiced in many countries for decades. The United States and Japan implemented agricultural insurance in 1899 and 1939, respectively, while Brazil began theirs in 1954. Canada and Mexico have provided agricultural insurance since 1961 and 1964, respectively [8]. India has been running this program since 1979. In Thailand, rice farming insurance started in 2008, while in Malaysia it only started in 2013 [9]. Meanwhile, in Indonesia, research on rice farming insurance was started in 2015 by [1]. Based on the results of a literature review on the results of previous research, so far there are several methods that have been used to determine the risk and price of agricultural insurance premiums in general. Research on determining the price of a weather index insurance contract using only the temperature index was carried out by [9]. Research [10,32], examined the determination of insurance prices based on the rainfall index using the Black-Scholes scheme. Research conducted by [13] discusses the determination of agricultural insurance premium prices based on the rainfall index using the mixed exponential distribution generation method. Research conducted by [33] discusses determining the maximum limit of loss-based agricultural insurance premiums using uncertainty theory. Meanwhile, [31] conducted a study to measure the risk of loss through Conditional Value at Risk using extreme value theory. Decision making for agricultural risk assessment with the application of extreme value theory was carried out by [34,35]. Meanwhile [36,37,38] conducted a study on the design of index insurance with rainfall and temperature indices based on utility functions. Finally, studies on loss risk management in agricultural insurance were carried out by [39,40], whereas [7,40] conducted research on loss risk management in agricultural insurance using the disaster model. This research is used to determine agricultural risk prices in Senegal based on health risks, wildlife and ducks, and rainfall using a general linear model (GLM).
Initially, the premium calculation only used the rainfall index, without taking into account other factors and results. The method used also refers to or adopts the method used for other cases, including the Black-Scholes principle with a history burn model for detention. Other methods that have been investigated for threshold are catastrophe and history burn methods. All of the above studies were carried out to determine the price of agricultural insurance premiums in general, only [8,13,32] which discussed rice farming insurance. However, the results of numerical calculations show results that are far above the amount set by the government for the premium price. Therefore, research still needs to be done to develop a model for formulating rice farming insurance premiums. The research was conducted using the principle of extreme value, which accommodates various factors causing losses while still paying attention to fairness. To this point, so far no one has conducted research to determine premium prices using the extreme value principle method, especially for rice farming. Therefore, the research to be carried out is expected to be original in nature.

2.2. Methods

Bibliometrics is the application of mathematical and statistical analysis to patterns found in the publication and use of documents in the form of textbooks, journal articles, student dissertations, or other sources [41]. Bibliometric mapping will be beneficial for both the scientific community and the general public, because it can help transform publication metadata into maps or visualizations that are easier to manage and process in order to gain more useful insights, for example visualizing keywords to identify themes or research clusters in a particular discipline. It involves the mapping of authors from specific journals to identify the geographical scope of authors and journals, and the mapping of institutional and international collaborations as part of a framework for identifying emerging technologies [25]. Bibliometric analysis consists of four steps, namely the search stage, filtering stage, checking bibliometric attributes, and bibliometric analysis [29,30]. The stages in the research were carried out as follows.
  • Search stage. The database source used for the initial data search is Google Scholar, with the help of Publish or Perish (PoP) software, Science Direct, and Dimensions used in scientific journal searches. The bibliographic search in this study was limited to several aspects, including the bibliography, titles used, and keywords. The years of the search for this study was limited the six years from 2015–2020.
  • Bibliographic screening stage. This selection is done to sort or select the journals to be analyzed. The selected bibliography comes from journal articles and conference papers.
  • Checking bibliographic attribute stage. The application for analysis is included in the Mendeley_02.ris bibliography file. To analyze the filtered bibliography, the bibliographic metadata is thoroughly examined. The examination includes the author’s name, article title, author’s keywords, abstract, year, volume, issue number, page, affiliation, country, number of citations, article links, and publisher, which is then carried out by bibliometric analysis.
  • Bibliometric analysis stage. Bibliometric analysis was carried out based on seven aspects, namely the formulation of the proposed problem.
Bibliometric analysis was carried out based on the formulation of the problem proposed. Visualization of the results of bibliometric analysis is used VOS viewer application. The use of the VOS viewer is done to help obtain easy and clear information. The results can provide a variety of interesting visuals, examinations, and investigations.
Meanwhile, the quality of scientific papers can be analyzed based on paper citations, namely by counting the number of citations carried out by other researchers. The number of citations indicates that their paper has made a significant contribution to the development of science [42,43]. The number of citations to a work shows how often the work is the subject of discussion or discussion among scientists [44]. The publication trend analysis was conducted to measure the writer’s productivity. The aim is to find out the number of studies produced by prolific researchers and authors in scientific journals over a certain period of time [45,46,47]. An important analysis result shows that the number of articles published on agricultural insurance issues, particularly rice farming over the last five years, has been generally stable.
For the search stage, the software used in tracing scientific journals by searching bibliographies is Publish or Perish (PoP). The database sources used for searching on PoP are Google Scholar and Scopus. The choice of Google Scholar and Scopus is because Google Scholar and Scopus are the largest and the primary databases that provide peer-reviewed literature and publications. Bibliographic searches in this study are limited in several aspects. First, by the type of bibliography used in the types of journal articles, chapters, books, and conference papers. Second, the title used is “Paddy Agricultural Insurance”. Third, the author’s keywords are used, namely “index insurance, paddy insurance”. Fourth, the search year for this study was limited to the six years from 2015–2020.

3. Results

In this study, the author only focused on the results of publications and reviews of research articles by searching Google Scholar, Science Direct, and Dimensions databases to find all articles that included the search term “Paddy Agriculture Insurance”. The analysis includes all papers published from January 2015 to June 2020. After the search is complete, all records are exported in RIS/Ref Manager format for further analysis. All papers analyzed are in the form of those that appear in research journals.
The research results can be divided into four sections, which consist of the results of mathematical studies and the results of data analysis. The two results turned out to be in agreement.

3.1. Search and Selection Stage

The Bibliographic Selection stage is carried out to sort or select the journals to be analyzed. The library materials used are journal articles. Biometrics mapping was carried out by VOS viewer and Mendeley software, while data mining was carried out using Science Direct, Publish or Perish, Google Scholar, and Dimensions, and the results obtained as shown in Table 1.
Table 1 shows the results of the recapitulation of article selection each year, from 2015–2020. From the summary search results in Table 1, obtained via Science Direct are 395 titles in stage A, 157 titles in stage B, 125 titles in stage C, and 27 titles in stage D. Publish or Perish found 450 titles in stage A, 221 titles in stage B, 231 titles in stage C, and 50 titles in stage D. Google Scholar found 1850 titles in stage A, 205 titles in stage B, 190 titles in stage C, and 53 titles in stage D. Meanwhile, Dimensions, generated 1966 titles in stage A, 241 titles in stage B, 227 titles in stage C, and 25 titles in stage D. The total search results were 4461 titles in stage A, 824 titles in stage B, 773 titles in stage C, and 155 titles in stage D.

3.2. Filtering Stage

The next step was to conduct a semi-manual examination for each data source obtained. The search results were then refined manually by filtering the data by eliminating several article titles that are not relevant to the research topic being conducted. The selected criteria are related to keywords and the research methodology. The processed data was then exported to Mendeley for easy citation. The results obtained consisted of 109 titles of papers with 1512 citations for the last six years with an emphasis on the proximity of the title and the selected keywords. Table 2 shows the results of the recapitulation of the selection of articles each year based on keywords created by stratification from the total results of the data mining carried out from 2015–2020.
Table 2 shows the complete results of citations for each year, while the citation pattern for each step is presented in Table 3. The following is a list of the number of papers per year and the number of citations per year. Although the number of papers is reduced, it will increase citations/papers and other indexes. Furthermore, Table 3 presents the statistical results for each stage of paper selection. This process is assumed to converge to the point of searching for papers that will be used as the main reference material to answer research questions, namely the model for determining moderate premiums for paddy agricultural insurance.

3.3. Checking Attribute Stage

The results of the paper selection for the 2015–2020 publication year are presented in Table 3. Column A shows the number of initial papers. Column B is the result of the first stage of semi-manual selection, the number of papers was reduced from 450 papers with the number of citations from 3717 to 231 papers with the number of citations 2417. In the second stage of selection the number of papers was reduced to 221 with the number of citations 1080, and in the third stage, 50 were filtered. papers with 768 citations. Meanwhile, Cites/year, Cites/paper, Author/paper, h-index, g-index, hI-norm, hI-annual, and Papers with ACC 1,2,5,10, 20, more details can be seen in Table 3.
The search results are then refined by filtering the data by eliminating several article titles that are not relevant to the research topic being conducted. The selected criteria are related to the keywords and the research methodology. The processed data is then exported to Mendeley for easy citation. The results obtained were 50 titles with 768 citations for the last six years with an emphasis on the proximity of the title and the selected keywords.

3.4. Refinement

Datasets from data mining contain articles related to paddy farming insurance and index-based insurance. Duplicate articles, editorials, news, announcements, proceedings, and dissertations are removed to obtain data that matches the keywords in the paper search process. The dataset used for bibliographic mapping analysis did not require further filtering. The number of articles retained was 251. These articles were then screened individually to ensure relevance using the following criteria. First, the article must have a lot of citations. Second, the article must present a complete paddy farming insurance model and not just a conceptually unimplemented agricultural insurance model. Third, the literature review papers were excluded from removal. Fourth, articles that only focus on general topics and articles whose keywords only appear in the reference section were also excluded. Finally, the article must answer research questions related to the topic of the multi-index paddy agriculture insurance premium model (for example, the relationship to the risk of crop loss, the relationship to the index, the relationship to the threshold, and the premium.
The PoP search found 155 paper titles related to the search for the keywords “paddy agricultural insurance” or “agricultural insurance” or “index insurance” or “paddy insurance” or “paddy insurance” or “crop insurance”. Next, improvements were made by using the keywords “index insurance”, “risk”, “premium”, “benefit”, and “threshold” to reduce the total number of papers to 109. Further improvements were made using the keywords “paddy insurance”, “wheat index”,” extreme values”, and “yields”, which reduced the total to 50 papers. Searching with the “insurance index” keyword resulted in nine papers, then improvements were made with the keywords “paddy insurance”, “index”, “climate”, and “yield rate”, which reduced the total to four papers that were closest to the designed research question. The results of the selection bibliographies and citations in Table 1 are based on the proximity of the title and the insurance keyword index. The next stage is the Bibliographic Attribute Stage, and the application for analysis is included in the Mendeley_02.ris bibliography file. In order to analyze the filtered bibliography, the bibliographic metadata is thoroughly examined. Checks include author name, article title, author keywords, abstract, year, volume, issue number, page, affiliation, country, number of citations, article links, and publisher.
A summary of the material from the results of a more in-depth study is presented in Table 4.
The next search was carried out by smoothing, using the keywords “index insurance”, “extreme value theory”, “generalized Pareto distribution”, “block maxima”, “peak over threshold”, and “paddy insurance” resulting in 4 papers. The results are given in Table 5.
Based on Table 5, the year of publication is from 2018 to 2019, the number of years of citation obtained by the author from 2018 to 2019 is two, the number of papers published in the journal is four, the number of citations is nine, citations/year are 4.50, which are then divided by two years of publication, meaning 2.25 citations/papers obtained from the number of citations divided by the number of papers, authors/papers is 2.75. Authors with an h-index of 2, meaning that every published article has been cited at least twice. Meanwhile, the g-index value is the result of the accumulation of papers cited by other papers. Selection is made to select journals that will be used as the main reference by taking into account the results obtained in Table 4 and the index values obtained in Table 5. The selected results are four papers that become the main references and the results are presented in Table 6. This reference can be used as a reference. the main factor in determining agricultural insurance premiums.
Table 6 is the final result of the literature review that will be used as the main study material in this paper. There are four main papers that will be used as references in the research that will be studied based on the problem of the model for determining the multi-index-based paddy agriculture insurance premium that will be carried out. The four topics are as follows: Index Insurance Design, The Impacts of Multiperil Crop Insurance on Indonesian Paddy Farmers and Production, Natural Catastrophe Models for Insurance Risk Management, and Agricultural Risk Pricing in Senegal. These will be used as the theoretical basis in determining the model for determining premium-based paddy agriculture insurance. multi index.

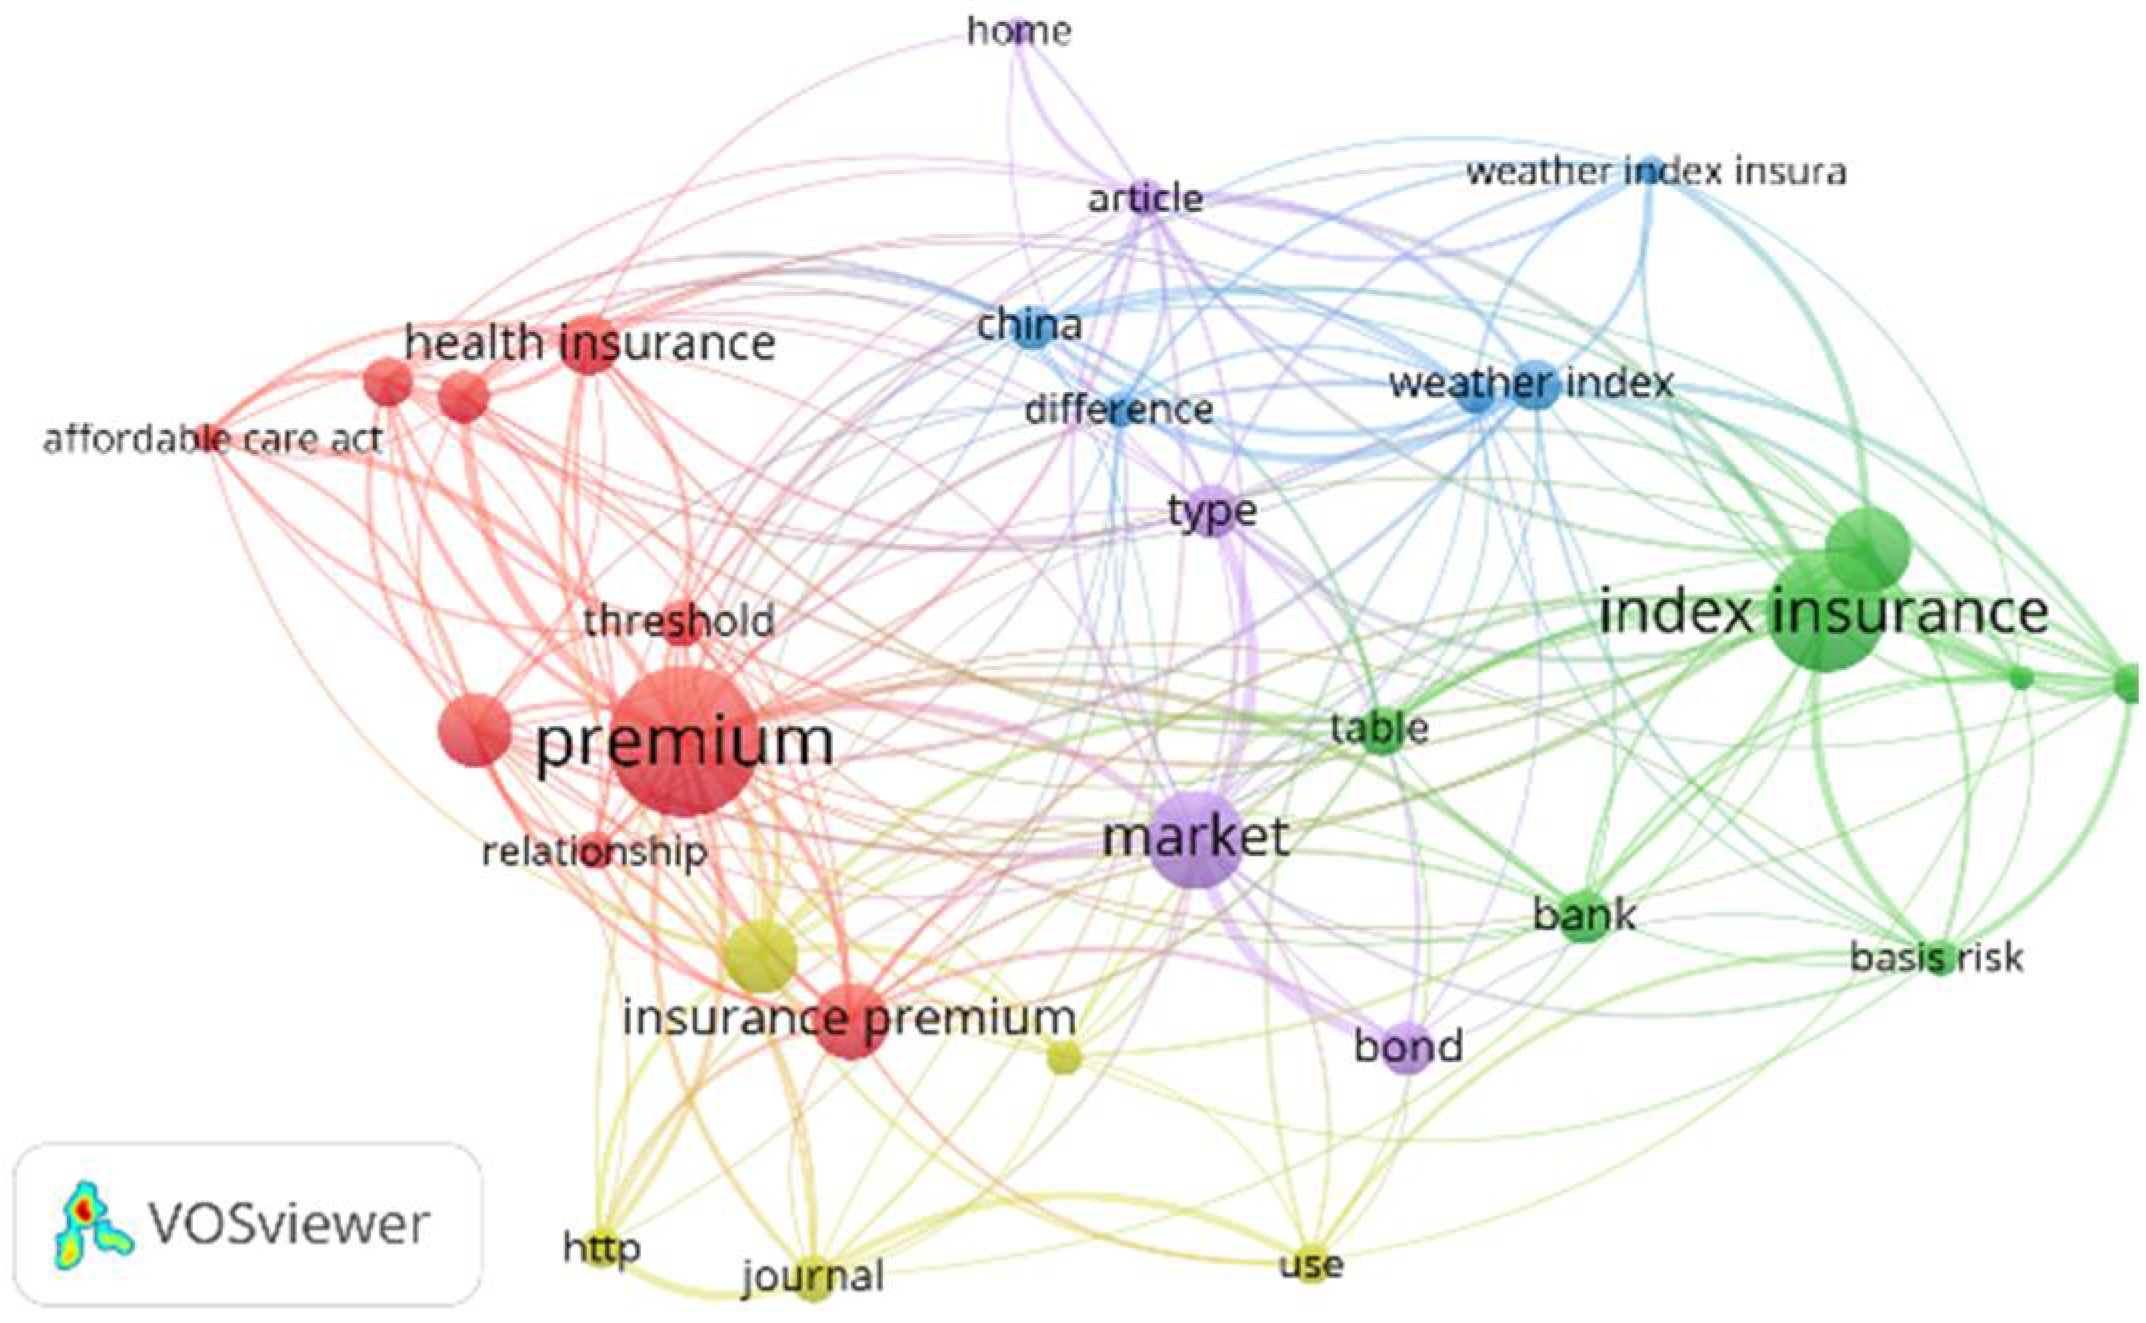
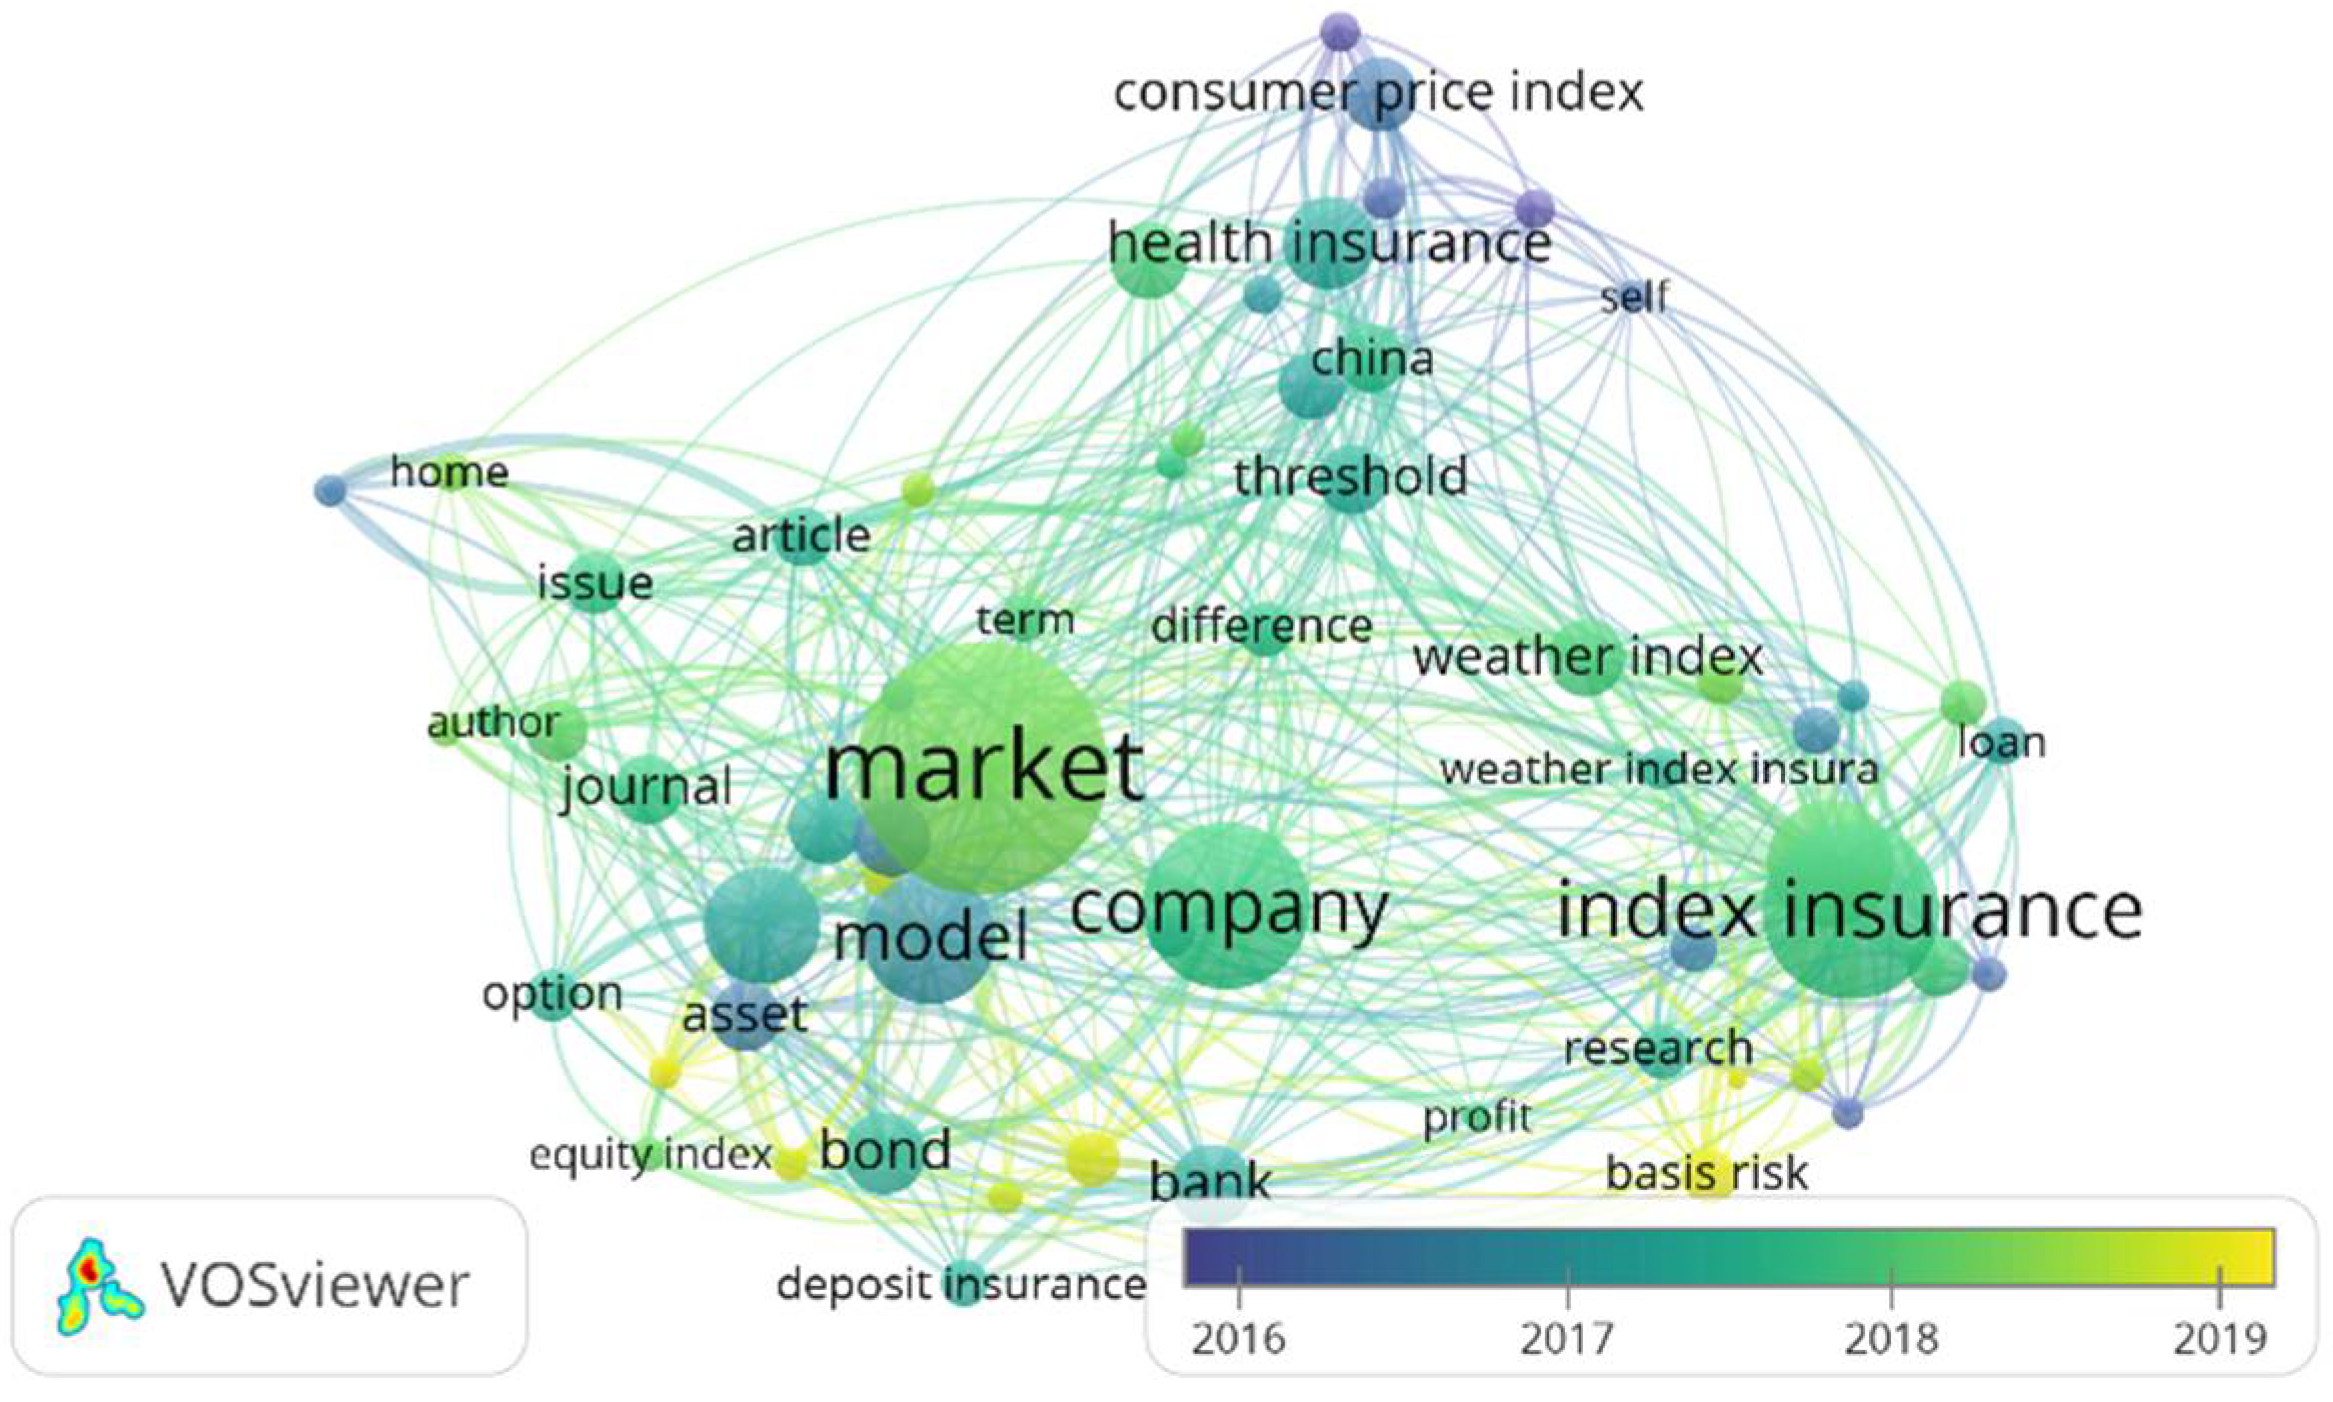
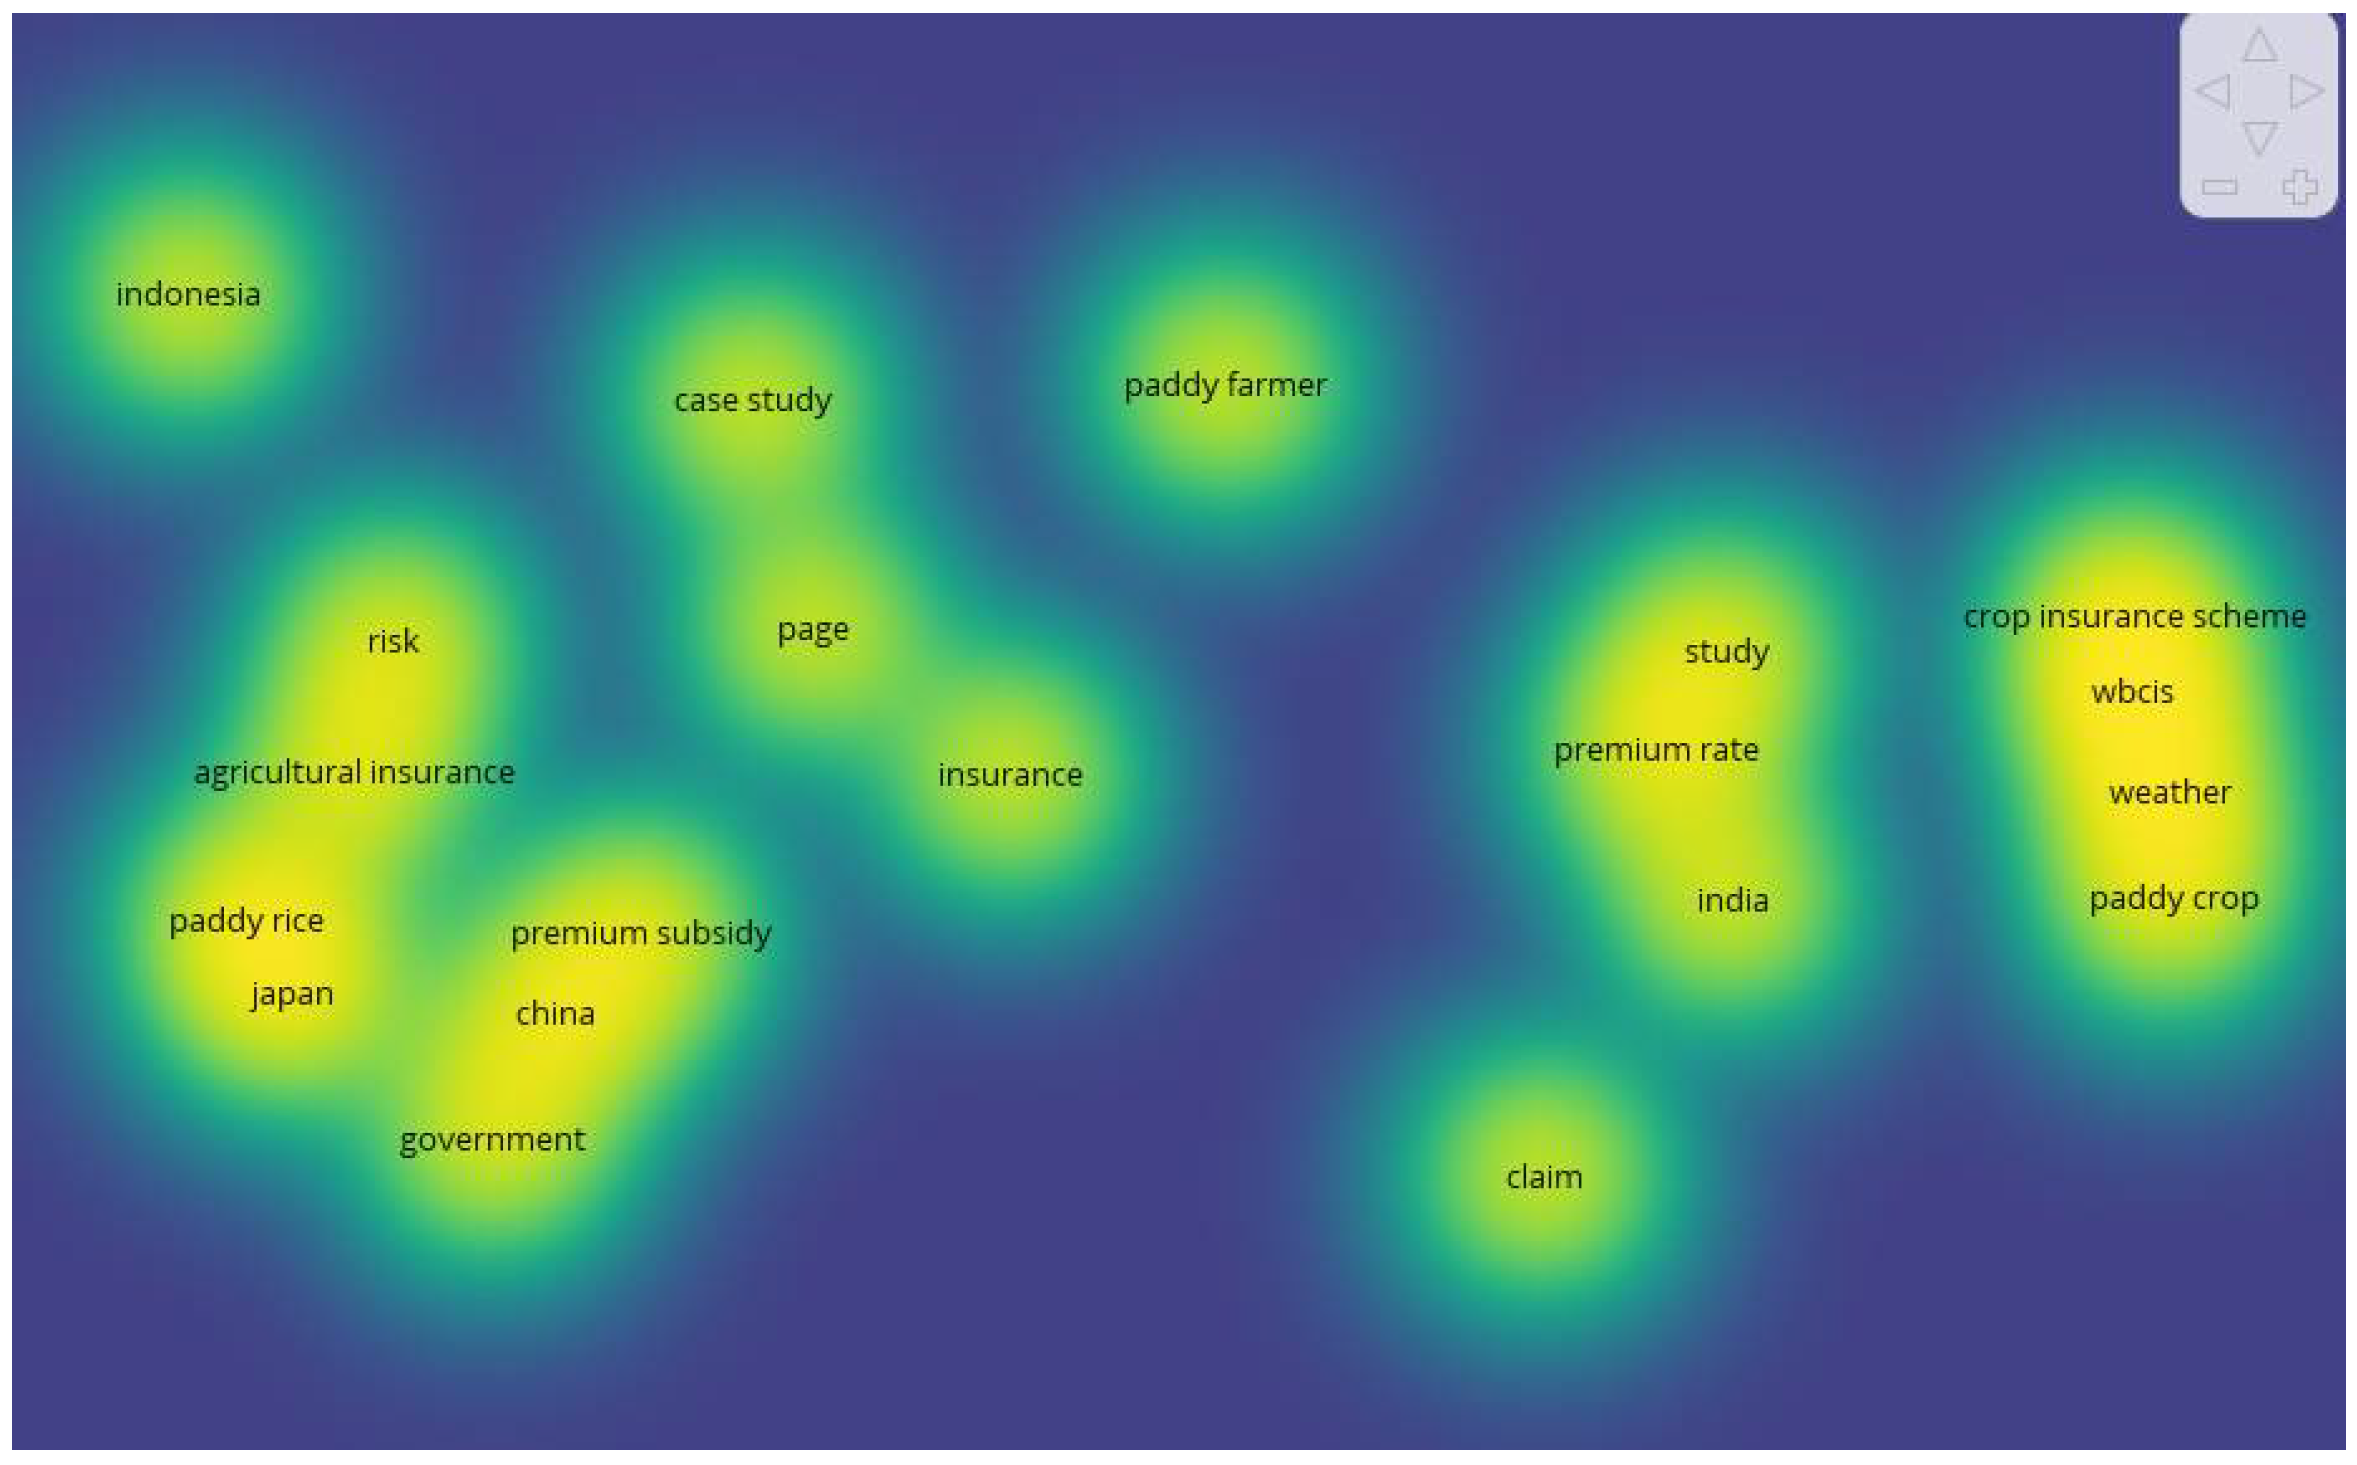
3.5. Bibliometric Analysis Stage
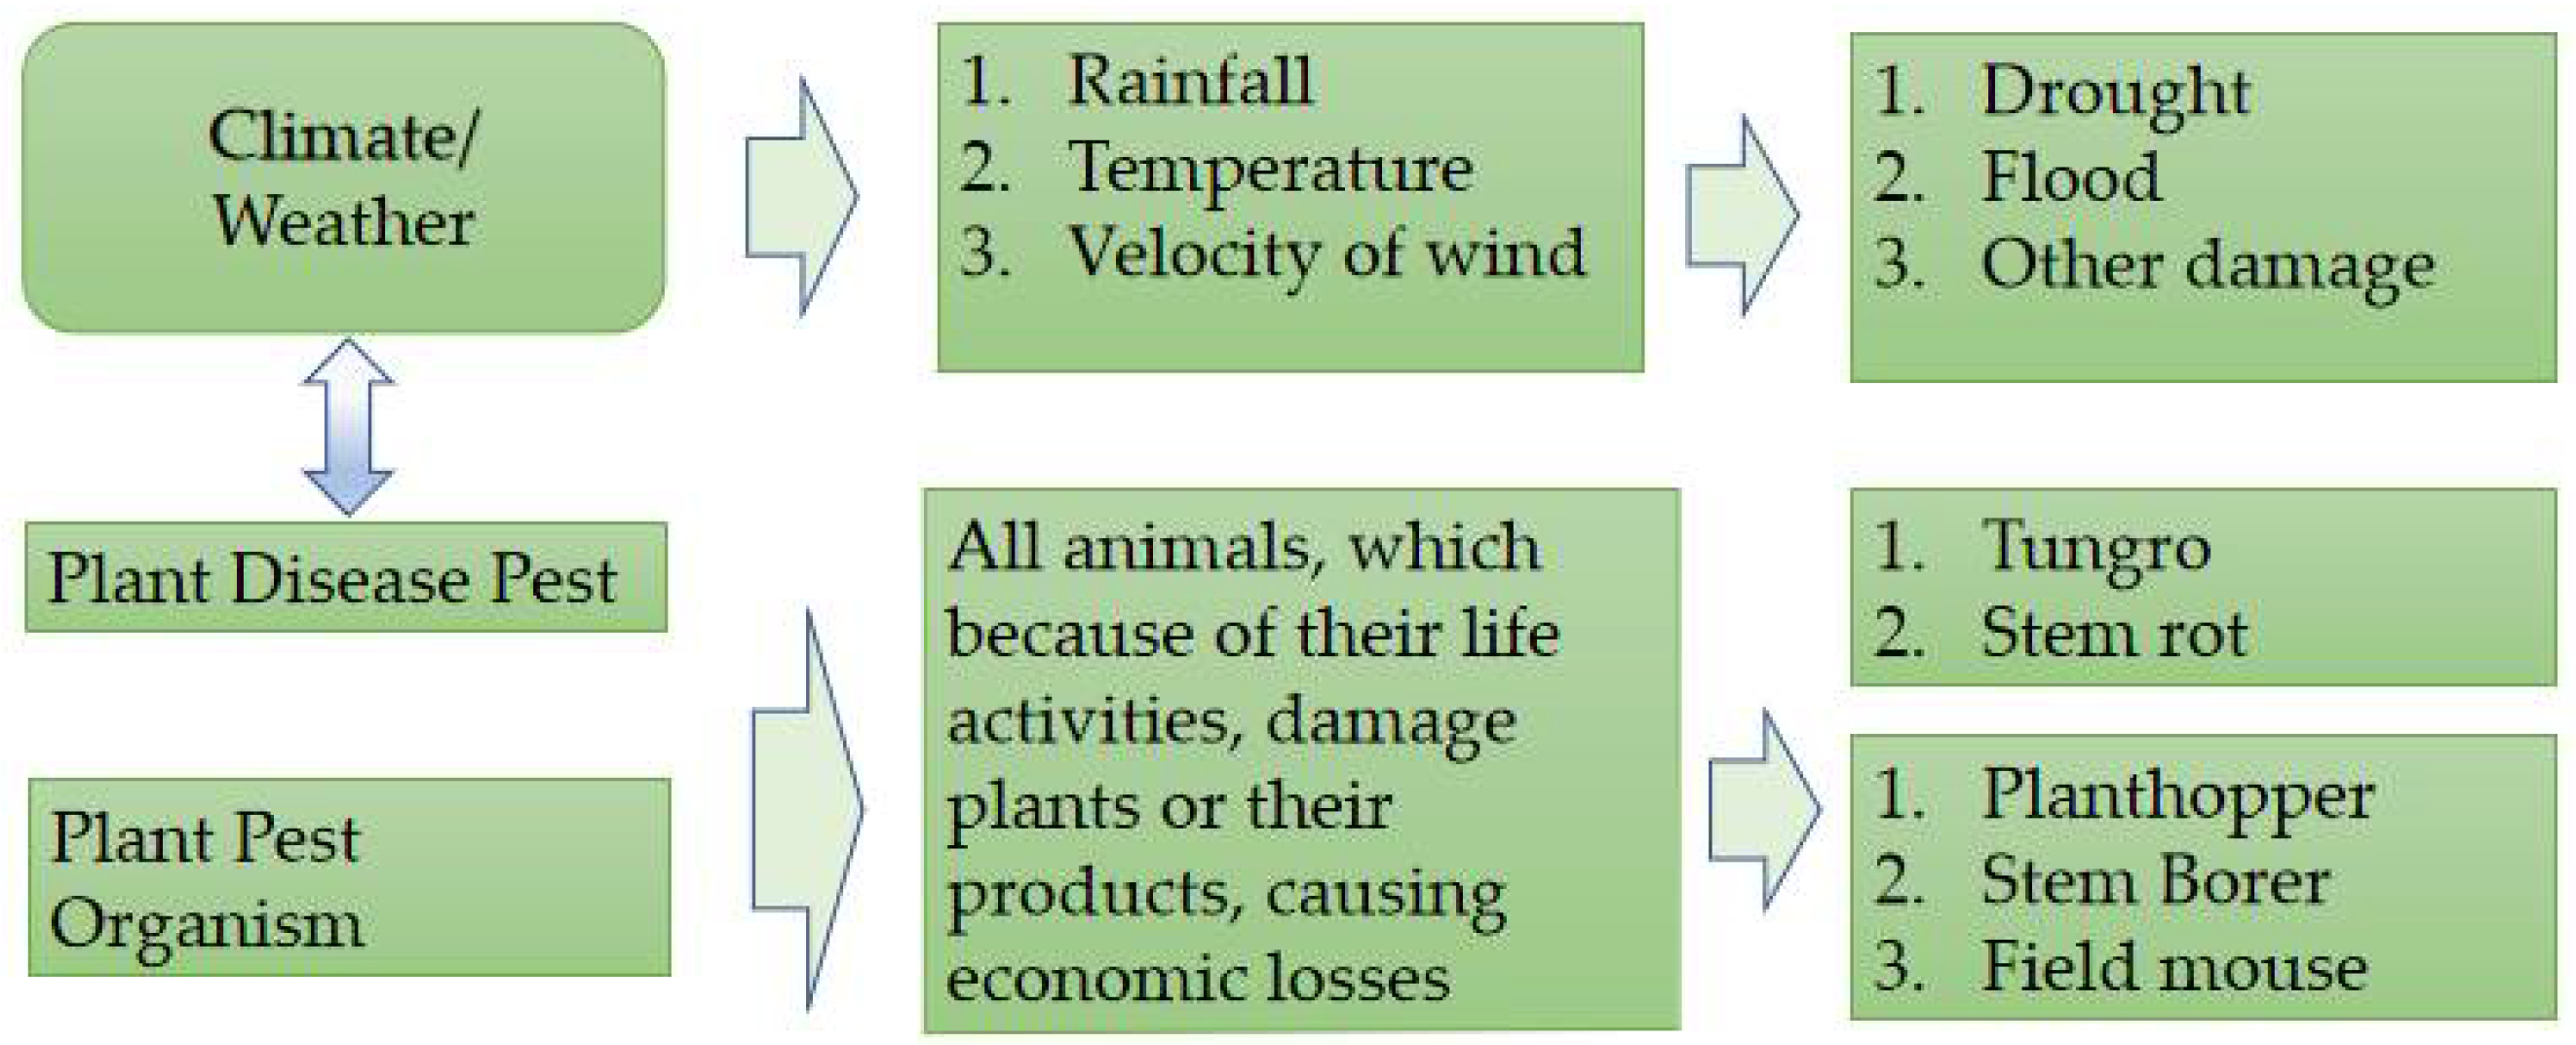
The next step is the term trend analysis of the title, which aims to analyze the content, patterns, and trends of a collection of documents by measuring term strength and by counting the number of keywords from research documents that appear simultaneously in the article under study. The minimum number of occurrences of 10 terms out of 1123 terms, 20 meet the threshold. For each of the 20 terms, a relevance score will be calculated. Based on this score, the most relevant terms will be selected. Network visualization analysis, the term trend of the author of network visualization keywords, is presented in Figure 1 and Figure 2. The following is a visualization image in VOS Viewer, before and after selecting the data.
Visualization is used to see the network connections between items. Based on Figure 1, the results of the network visualization form four clusters, namely red, green, purple, and yellow, which are connected to each other. Each cluster consists of several items that are connected to each other. From Figure 1, there are two major parts that are not yet connected, namely the issue of premiums and index insurance, so there is an opportunity to examine the part that involves both of these things. The next step is to see the suitability between keywords based on the Vos Viewer plot.
Figure 2 shows the visualization of the paddy farming insurance network with 11 items, namely the government, paddy farmers, insurance companies, index insurance, rainfall, temperature, premium rate, insurance, weather, claims, and premium subsidies. Author Collaboration Analysis, in the context of research and writing collaboration, is needed, given that research is not always done individually [41]. Because of this, cooperation between researchers and between agencies is needed both in terms of ideas or ideas, funding, facilities and equipment, as well as opportunities to share knowledge, expertise, and certain techniques in a science [43]. The results of this study, obtained four authors have a strong relationship with each other based on the method used. Each author in each link group is different.
The density visualization map is used to see the depth of publication. In Figure 3 it can be seen that the lightest color indicates that a topic is widely used in research related to agricultural insurance, while the light color means that the topic is used less in research related to agricultural insurance. The agricultural insurance density visualization map is presented in Figure 3.
Based on the density map, it can be seen that there has been no research on the topic of multi-index-based paddy agricultural insurance that shows the level of disturbance and undesirable conditions. This triggers researchers to conduct research on a multi-index-based paddy agricultural insurance model to determine the premium that must be paid. Based on a comprehensive literature study, there is no study that determines the multi-index-based paddy agricultural insurance model to determine the premium that must be paid. The formulation of the problem in this study is that the weather index is not the only appropriate tool for determining paddy agricultural insurance premiums because there are other factors that cause losses for farmers. This fact shows that a new approach is needed in determining paddy farm insurance premiums.

4. Discussion

In this section, we discuss the results of the analysis we obtained from the literature review. There are not many literature reviews conducted regarding agricultural insurance studies in particular. Likewise, none of the previous articles conducted a comprehensive systematic literature review on rice farming insurance. However, there are several studies that can be used as a reference and comparison with the research we did. These papers include [48], “Climate Change, Insurance, and Households: A Literature Review.” The next study used as a comparison is [49] who discussed access to rural credit markets in developing countries in a literature review focusing on the case of Vietnam. Agricultural research and development: A brief review of the literature by [50] undertook a literature review of Crop insurance in India. Finally, [51] conducted a literature study entitled “Insurance Awareness: Literature Review”, which was published in the International Journal of Asian Social Sciences.
The results of a bibliometric analysis is based on publication years, citation years, papers cited, cites/year, cites/paper, authors/paper, h-index, g-index, hI-norm, and hI-annual, and these are presented in Table 5. The most significant objective is to evaluate the important journals and articles cited in the context of rice farming risk management and insurance. We collected several samples by grouping the keywords “paddy insurance”, “index insurance”, “weather index insurance”, “extreme value theory”, “generalized Pareto distribution”, “block maxima”, “peak over threshold”, “weather change, and “risk of crop failure”.
The results of this literature review were obtained and summarized several relevant methods. These methods were obtained from the results of a study entitled “Determination of Agricultural Insurance Premiums Based on Rainfall Index Using the Mixed Exponential Distribution Generating Method [13]”. Determination of the price of agricultural insurance premiums was based on the rainfall index using the Black-Scholes model [14]. The application of the historical fire analysis method in determining agricultural premiums was based on the climate index using the Black Schools method [5,10]. Insurance Design Index Model, Decision Science Research Network [39]. Impact of multiperyl crop insurance on Indonesian farmers and rice production and the Natural Disaster Model for Insurance Risk Management [37]. The results are summarized and presented in Figure 4.
Based on Figure 4, it is implied that the method used in determining insurance premiums is divided into parametric risk models and stochastic models. The parametric model involves the exponential distribution and the distribution of extreme values, while the stochastic model generally adopts the Black Scholes model in its solution. On this occasion, we will try to develop a model related to weather index-based insurance.
The following is a summary of the results of the insurance index that is used as a benchmark in determining claims. In essence, the index to determine compensation is the weather, plant pests and plant-disturbing organisms. The schematic is shown in Figure 5.
However, the most widely used is the weather, because weather data is very difficult to manipulate. Weather is certainly related to plant pests and plant-disturbing organisms. In Figure 5, the author describes an index scheme that is usually used as a benchmark in determining compensation claims for losses that have occurred. This index scheme is used as the basis for designing the insurance index model for rice farming. Therefore, based on Figure 4 and Figure 5, a research gap can be determined, providing an overview of the statistical methods/theories used and the index variables as thresholds in determining the decision on the value of claims that must be paid to farmers. Thus, a premium pricing model based on extreme value theory can be developed with POT or maxima blocks as the threshold.

5. Conclusions

In this paper, we presented a systematic literature review based on the mathematical model of rice farming insurance from four digital libraries, namely Publish or Perish, Science Direct, Dimensions, and Google Scholar. We showed how the use of bibliographical mapping techniques can reveal a general picture of existing themes and their changes over time. This description of the theme can be the basis for deciding on further studies. In addition, we performed a manual full-text selection.
The main results in this study were four main papers that will be used as a reference. The four topics are: Insurance Design Index, the Impact of Multiperil Crop Insurance on Farmers and Rice Production in Indonesia, Natural Catastrophe Models for Insurance Risk Management, and Agricultural Risk Pricing in Senegal. These results will be used as a theoretical basis in determining the mathematical model for determining multi-index-based rice agricultural insurance premiums.
The results obtained are based on gap research, and the index that is most often used is the weather, because weather data is very difficult to manipulate. Weather is certainly related to plant pests and plant-disturbing organisms. All of these factors will certainly affect the rice yields obtained. In Figure 5, the author describes an index scheme that is usually used as a benchmark in determining compensation claims for losses that have occurred. This index scheme is used as the basis for designing the insurance index model for rice farming. Therefore, Figure 4 and Figure 5 provide an overview of the statistical method/theory used and the show the index variable as a threshold in determining the decision on the value of claims that must be paid to farmers.
Therefore, there is a research gap that has not been covered and will be carried out on model studies for the risk of crop failure based on a multi-index, which will be used as the basis for the formulation and determination of the insurance premium price.

Author Contributions

Conceptualization, R., S. and S.S.; methodology, R.; software, R.; validation, R., S., S.S. and N.I.; formal analysis, S.; investigation, S.S.; resources, S.; data curation, R.; writing—original draft preparation, R.; writing—review and editing, S.; visualization, R. and N.I.; supervision, S.; project administration, R. and S.; funding acquisition, S. All authors have read and agreed to the published version of the manuscript.

Funding

This research was funded by Universitas Padjadjaran, via the Universitas Padjadjaran Doctoral Dissertation Research Grant (RDDU), with a contract number: 1427/UN6.3.1/LT/2020.

Institutional Review Board Statement

Ethical institutional review and approval were waived for this study due to neither institution nor government were involved. In this study, used simulation of the open-access data sample. This is also following the regulations of Law Number 14 of 2008 concerning the openness of public information (https://jdih.esdm.go.id/storage/document/UU%20No.%2014%20Thn%202008.pdf, accessed on 25 October 2021).

Data Availability Statement

Data is contained within the article.

Acknowledgments

The author would like to thank the Dean of the Faculty of Mathematics and Natural Sciences, Universitas Padjadjaran and the Directorate of Research and Community Service (DRPM), who have provided funding via the Universitas Padjadjaran.

Conflicts of Interest

The authors declare that they have no conflict of interest.

References

  1. Estiningtyas, W. Climate Index-Based Agricultural Insurance: Options for Empowerment and Protection of Farmers Against Climate Risk (Asuransi Pertanian Berbasis Indeks Iklim: Opsi Pemberdayaan dan Perlindungan Petani Terhadap Risiko Iklim). J. Sumberd. Lahan 2015, 9, 51–64. [Google Scholar]
  2. Stutley, C. Agricultural Insurance in Asia and the Pacific Region; United Nations Food and Agricultural Organization: Bangkok, Thailand, 2011. [Google Scholar]
  3. Aguiton, S.A. Fragile Transfers: Index Insurance and the Global Circuits of Climate Risks in Senegal. Nat. Cult. Berghahn J. 2019, 14, 282–298. [Google Scholar] [CrossRef]
  4. Zhang, J.; Zhang, Z.; Tao, F. Performance of temperature-related weather index for agricultural insurance of three main crops in China. Int. J. Disaster Risk Sci. 2017, 8, 78–90. [Google Scholar] [CrossRef] [Green Version]
  5. Ariyanti, D.; Riaman, R.; Irianingsih, I. Application of Historical Burn Analysis Method in Determining Agricultural Premium Based on Climate Index Using Black Scholes Method. JTAM (J. Teor. Dan Apl. Mat.) 2020, 4, 28–38. [Google Scholar] [CrossRef]
  6. Hazell, P.B. The Appropriate Role of Agricultural Insurance in Developing Countries. J. Int. Dev. 1992, 4, 567–581. [Google Scholar] [CrossRef]
  7. Diop, A.N. Agricultural Risk Pricing in Senegal. J. Math. Financ. 2019, 9, 182–201. [Google Scholar] [CrossRef] [Green Version]
  8. Mutaqin, A.K.; Kudus, A.; Karyana, Y. Metode Parametrik untuk Menghitung Premi Program Asuransi Usaha Tani Padi di Indonesia. Ethos J. Penelit. Dan Pengabdi. Masy. 2016, 4, 318–326. [Google Scholar] [CrossRef] [Green Version]
  9. Taib, C.M.I.C.; Benth, F.E. Pricing of temperature index insurance. Rev. Dev. Financ. 2012, 2, 22–31. [Google Scholar] [CrossRef] [Green Version]
  10. Filiapuspa, M.H.; Sari, S.F.; Mardiyati, S. Applying Black Scholes method for crop insurance pricing. AIP Conf. Proc. 2019, 2168, 020042. [Google Scholar]
  11. Hazell, P.; Hess, U. Beyond hype: Another look at index-based agricultural insurance. In Agriculture and Rural Development in a Globalizing World 2017; Routledge: London, UK, 2007; Chapter 11; pp. 211–226. [Google Scholar]
  12. Pribadia, D.M.; Sukonob, R. Robust model of the combination of expectations and conditional valueat-risk from paddy farming risk management based on climate variability. Int. J. Innov. Creat. Change 2019, 9, 1–15. [Google Scholar]
  13. Qosim, S.; Dharmawan, K.; Harini, L.P. Penentuan Harga Premi Asuransi Pertanian Berbasis Indeks Curah Hujan Dengan Menggunakan Metode Pembangkit Distribusi Eksponensial Campuran. E-J. Mat. 2018, 7, 141–147. [Google Scholar] [CrossRef] [Green Version]
  14. Erfiana, D.; Prabowo, A.; Tripena, A.; Riyadi, S. Penentuan Harga Premi Asuransi Pertanian Berbasis Indek Curah Hujan Dengan Model Black-Scholes. Prosiding 2020, 10, 95–107. [Google Scholar]
  15. Kath, J.; Mushtaq, S.; Henry, R.; Adeyinka, A.; Stone, R. Index insurance benefits agricultural producers exposed to excessive rainfall risk. Weather. Clim. Extrem. 2018, 22, 1–9. [Google Scholar] [CrossRef]
  16. Kath, J.; Mushtaq, S.; Henry, R.; Adeyinka, A.A.; Stone, R.; Marcussen, T.; Kouadio, L. Spatial variability in regional scale drought index insurance viability across Australia’s wheat growing regions. Clim. Risk Manag. 2019, 24, 13–29. [Google Scholar] [CrossRef]
  17. Janzen, S.; Magnan, N.; Mullally, C.; Garbero, A.; Hughes, K.; Oduol, J.; Palmer, B.; Shin, S. Experimental Games to Teach Farmers about Weather Index Insurance in Kenya. Int. Initiat. Impact Eval. (3ie) 2020. [Google Scholar] [CrossRef]
  18. Jensen, N.D.; Barrett, C.B.; Mude, A.G. Cash transfers and index insurance: A comparative impact analysis from northern Kenya. J. Dev. Econ. 2017, 29, 14–28. [Google Scholar] [CrossRef]
  19. Jensen, N.D.; Barrett, C.B.; Mude, A.G. Index insurance quality and basis risk: Evidence from northern Kenya. Am. J. Agric. Econ. 2016, 98, 1450–1469. [Google Scholar] [CrossRef] [Green Version]
  20. Jensen, N.; Barrett, C. Agricultural index insurance for development. Appl. Econ. Perspect. Policy 2017, 39, 199–219. [Google Scholar] [CrossRef]
  21. Yu, J.; Vandeveer, M.; Volesky, J.D.; Harmoney, K. Estimating the basis risk of rainfall index insurance for pasture, rangeland, and forage. J. Agric. Resour. Econ. 2019, 44, 179–193. [Google Scholar]
  22. Sibiko, K.W.; Veettil, P.C.; Qaim, M. Small farmers’ preferences for weather index insurance: Insights from Kenya. Agric. Food Secur. 2018, 7, 1–14. [Google Scholar] [CrossRef] [Green Version]
  23. Ellegaard, O.; Wallin, J.A. The bibliometric analysis of scholarly production: How great is the impact? Scientometrics 2015, 105, 1809–1831. [Google Scholar] [CrossRef] [PubMed] [Green Version]
  24. Noman, M.A.; Nasr, E.S.; Al-Shayea, A.; Kaid, H. Overview of predictive conditionbased maintenance research using bibliometric indicators. J. King Saud Univ.-Eng. Sci. 2019, 31, 355–367. [Google Scholar]
  25. Russell, J.M.; Rousseau, R. Bibliometrics and institutional evaluation. Encycl. Life Support Syst. (EOLSS). Part. 2010, 19, 42–64. [Google Scholar]
  26. De Bellis, N. Bibliometrics and Citation Analysis: From the Science Citation Index to Cybermetrics; Scarecrow Press, Inc.: Lanham, MD, USA; Washington, DC, USA, 2009; Volume 9. [Google Scholar]
  27. Pilkington, A. Bibexcel-Quick Start Guide to Bibliometrics and Citation Analysis; World Scientific Publishing: London, UK, 2018. [Google Scholar] [CrossRef]
  28. Piotrowski, C. Bibliometrics and citation analysis for the psychologist-manager: A review and select readings. Psychol.-Manag. J. 2013, 16, 53. [Google Scholar] [CrossRef]
  29. Julia, J.; Supriatna, E.; Isrokatun, I.; Aisyah, I.; Nuryani, R.; Aminat, O.A. Moral Education (2010–2019): A Bibliometric Study (Part 1). Univers. J. Educ. Res. 2020, 8, 2554–2568. [Google Scholar] [CrossRef]
  30. Julia, J.; Supriatna, E.; Isrokatun, I.; Aisyah, I.; Aminat, O.A.; Hakim, A. Moral Education (2010–2019): A Bibliometric Study (Part 2). Univers. J. Educ. Res. 2020, 8, 2954–2968. [Google Scholar] [CrossRef]
  31. Yao, F.; Wen, H.; Luan, J. CVaR Measurement and Operational Risk Management in Commercial Banks According to The Peak Value Method of Extreme Value Theory. Math. Comput. Model. J. 2013, 58, 15–27. [Google Scholar] [CrossRef]
  32. Putri, I.A.; Dharmawan, K.; Tastrawati, N.K. Perhitungan harga premi asuransi pertanian yang berbasis indeks curah hujan menggunakan metode black scholes. E-J. Mat. 2017, 6, 161–167. [Google Scholar] [CrossRef] [Green Version]
  33. Sari, Y.W. Penentuan Batas Maksimum Premi Asuransi Pertanian. J. Data Anal. 2018, 1, 64–69. [Google Scholar] [CrossRef]
  34. Riaman, R.; Sukono, S.; Supian, S.; Ismail, N. Analysing the decision making for agricultural risk assessment: An application of extreme value theory. Decis. Sci. Lett. 2021, 10, 351–360. [Google Scholar] [CrossRef]
  35. Riaman, R.; Sukono, S.; Supian, S.; Ismail, N. Paddy Harvest Failure Risk Analysis using Extreme Value Theory Based on Weather Index as Information Supply Chain for Agricultural Business. Int. J. Supply Chain. Manag. (IJSCM) 2020, 9, 636–646. [Google Scholar]
  36. Clarke, D.J. A theory of rational demand for index insurance. Am. Econ. J. Microecon. 2016, 8, 283–306. [Google Scholar] [CrossRef] [Green Version]
  37. Zhang, J.; Tan, K.S.; Weng, C. Index insurance design. ASTIN Bull. J. IAA 2019, 49, 491–523. [Google Scholar] [CrossRef]
  38. Guo, J.; Jin, J.; Tang, Y.; Wu, X. Design of Temperature Insurance Index and Risk Zonation for Single-Season Paddy in Response to High-Temperature and Low-Temperature Damage: A Case Study of Jiangsu Province. Int. J. Environ. Res. Public Health 2019, 16, 1187. [Google Scholar]
  39. Singh, P.; Agrawal, G. Efficacy of weather index insurance for mitigation of weather risks in agriculture. Int. J. Ethics Syst. 2019, 35, 584–616. [Google Scholar] [CrossRef]
  40. Jindrová, P.; Pacáková, V. Natural Catostrophe Models for Insurance Risk Management. WSEAS Trans. Bus. Econ. 2019, 16, 1–9. [Google Scholar]
  41. Rohanda, R.; Winoto, Y. Bibliometric Analysis of Collaboration Level, Author Productivity, and Profile of Information & Library Studies Journal Articles 2014–2018. PUSTABIBLIA (Analisis Bibliometrika Tingkat Kolaborasi, Produktivitas Penulis, Serta Profil Artikel Jurnal Kajian Informasi & Perpustakaan Tahun 2014-2018. PUSTABIBLIA). J. Libr. Inf. Sci. 2019, 3, 1–15. [Google Scholar]
  42. Erwina, W.; Kurniasih, N.; Setianti, Y. Citation Analysis of Fikom Lecturers’ Works on the GDL (Database Analisis Sitasi Karya Dosen Fikom pada Database GDL); Unpad Press: Bandung, Indonesia, 2010. [Google Scholar]
  43. Hoepner, A.G.; Kant, B.; Scholtens, B.; Yu, P.S. Environmental and ecological economics in the 21st century: An age adjusted citation analysis of the influential articles, journals, authors and institutions. Ecol. Econ. 2012, 77, 193–206. [Google Scholar] [CrossRef]
  44. Whorf, B.L. Language, Thought, and Reality: Selected Writings of Benjamin Lee Whorf; MIT Press: Cambridge, MA, USA, 2012; p. 20. [Google Scholar]
  45. Rahayu, S.; Saleh, A.R. Studi bibliometrik dan sebaran topik penelitian pada Jurnal Hayati terbitan 2012–2016. Pustakaloka 2017, 9, 201–218. [Google Scholar] [CrossRef]
  46. Lakitan, B.; Hadi, B.; Herlinda, S.; Siaga, E.; Widuri, L.I.; Kartika, K.; Lindiana, L.; Yunindyawati, Y.; Meihana, M. Recognizing farmers’ practices and constraints for intensifying rice production at Riparian Wetlands in Indonesia. NJAS-Wagening. J. Life Sci. 2018, 85, 10–20. [Google Scholar] [CrossRef]
  47. Fadhliani, Z.; Luckstead, J.; Wailes, E.J. The impacts of multiperil crop insurance on Indonesian rice farmers and production. Agric. Econ. 2019, 50, 15–26. [Google Scholar] [CrossRef]
  48. Bellman, L.; Ekholm, S.; Giritli Nygren, K.; Hemmingsson, O.; Jarnkvist, K.; Kvarnlöf, L.; Lundgren, M.; Olofsson, A. Climate Change, Insurance, and Households: A Literature Review. RCR (Risk Crisis Res. Cent.) Work. Pap. Ser. Mid Swed. Univ. 2016, 1, 1–46. [Google Scholar]
  49. Linh, T.N.; Long, H.T.; Chi, L.V.; Tam, L.T.; Lebailly, P. Access to rural credit markets in developing countries, the case of Vietnam: A literature review. Sustainability 2019, 11, 1468. [Google Scholar] [CrossRef] [Green Version]
  50. Dethier, J.J.; Effenberger, A. Agriculture and development: A brief review of the literature. Econ. Syst. 2012, 36, 175–205. [Google Scholar] [CrossRef] [Green Version]
  51. Ismail, N.; Husin, M.M.M.; Ishak, I.; Manaf, N.A. Insurance Awareness: A Literature Review. Int. J. Asian Soc. Sci. 2018, 8, 28–33. [Google Scholar] [CrossRef] [Green Version]
Figure 1. Visualization of terms in the title of paddy agricultural insurance.
Computation 10 00050 g001
Figure 2. Overlay visualization of the paddy agricultural insurance keyword network.
Computation 10 00050 g002
Figure 3. The density visualization map.
Computation 10 00050 g003
Figure 4. Summary of method results from literature study.
Computation 10 00050 g004
Figure 5. Index scheme used in paddy farm insurance.
Computation 10 00050 g005
Table 1. Keywords used in database searches and number of articles returned.
StageABCD
Keywords“paddy insurance” or “paddy insurance”“index insurance” or “weather index insurance” or ”mpci”“extreme value theory” or “generalized pareto distribution” or “block maxima” or “peak over threshold”A and C
Science Direct39515712527
Publish or Perish45022123150
Google Scholar185020519053
Dimensions196624122725
Total4461824773155
Table 2. Results of the recapitulation of the selection of articles each year.
Publication YearSelected ArticlesNumber of Citations
2020911
201923110
201824292
201721281
201618561
201514257
Total1091512
Average18252
Table 3. Display of Publish or Perish for Google Scholar index for each stage.
ABCD
Publication years:2015–2020Publication years2015–2020Publication years2015–2020Publication years2015–2020
Citation years:6Citation years:6Citation years:6Citation years:6
Papers:450Papers:231Papers:221Papers:50
Citations:3717Citations:2417Citations:1080Citations:768
Cites/year:619.50Cites/year:402.83Cites/year:180.00Cites/year:178.00
Cites/paper:8.26Cites/paper:10.46Cites/paper:4.89Cites/paper:141.36
Author/paper:2.84Author/paper:3.48Author/paper:2.28Author/paper:3.28
h-index:27h-index:25h-index:16h-index:36
g-index51g-index41g-index27g-index50
hI-norm:18hI-norm:13hI-norm:10hI-norm:25
hI-annual:3.00hI-annual:2.17hI-annual:1.67hI-annual:4.17
Papers with ACC ≥ 1,2,5,10,20:194,113,56,26,5Papers with ACC ≥ 1,2,5,10,20:128,94,49,18,5Papers with ACC ≥ 1,2,5,10,20:69,39,21,7,2Papers with ACC ≥ 1,2,5,10,20:50,50,45,40,27
Table 4. Summary of discussion from other literature review.
Category[39][47][37][7]
Review purposeOptimal index insurance design under the expected utility maximization frameworkThe optimal policy combination results from the highest levels of coverage and subsidies, offering the largest expected net insurance payouts and equal certaintyRisk management of insurance and reinsurance
companies
Determine the pure premium
Review domainThe optimal compensation function of agricultural insurance and index-based disaster insurance.Multiperil crop insurance policy for risk-averseStatistical unexpected and there have huge impact on the whole societyhealth risks, locusts (wild locusts), wild animals
Review scopeProve the existence and uniqueness of optimal contracts, and develop effective numerical procedures to calculate optimal solutionsMultiperil crop insurance policy for risk-averse Indonesian rice farmers located in Tuban and Gresik Regencies of the East Java Province.Statistical unexpected and there have huge impact on the whole societyThis segmentation will determine the correct premium
Research contextThis method is illustrated by a numerical example in protection against adverse crop yields using indexes.Numerically simulated to quantify the effects of different coverage levels and subsidy rates on input use, expected net insurance payments, and certainty equivalents.Not discussedThis segmentation will determine the correct premium
Research ObjectiveThe purpose of this paper is to provide an in-depth analysis of index indemnity insurance, or simply index insuranceAnalysis the effect of multi-hazard crop insurance policies for risk-averse Indonesian rice farmers located in Tuban and Gresik Regencies, East Java ProvinceThe aim of this article is to present two of the useful methods-block maxima method and peaks over threshold methodThe aim of the study is to determine the pure premium that must be paid by Senegalese farmers who are insured against conventional risk
VariableTemperature and precipitationcoverage levels and subsidy rates on input use, expected net insurance payments, and certainty equivalents.Historical data about insured losses of natural catastropheshealth risks, locusts (wild locusts), wild animals and ducks have higher claims than climatic events (rainfall deficit, floods)
MethodUtility functionComparative static results are mostly ambiguous and are left as empirical questionsRisk management of insurance and reinsurance
companies
to consider the type of risk to which each insured is most exposed and determine the corresponding premium.
Model DesignExponential utility and quadratic utility functionYield-Based MPCI Crop Insurance Policy in IndonesiaCatastrophic eventsgeneral linear model (GLM)
Result/Model Optimal index insurance significantly outperforms linear type index insurance contracts in terms of reducing underlying riskThe optimal policy combination results from the highest coverage level and subsidy, which offer the largest expected net insurance payments and certainty equivalentestimates future insured lossesbetter pricing, the insurance company
Table 5. Display of Publish or Perish for Google Scholar index based on four papers.
MetricScore
Publication years2015–2020
Citation years2 (2018–2019)
Papers4
Citations9
Cites/year4.50
Cites/paper2.25
Authors/paper2.75
h-index2
g-index2
hI-norm1
hI-annual0.33
Table 6. Results of article refinement.
NoAuthorsTitleYearPublish in
1[39]Index Insurance Design2019The Journal of the IAA, ASTIN Bulletin, 49(2)
2[47]The impacts of multiperil crop insurance on Indonesian rice farmers and production2019Journal of Agricultural Economics, 50(1), 15–26.
3[37]Natural Catastrophe Models for Insurance Risk Management2019WSEAS Transactions on Business and Economics, 16(1), 1-9.
4[7]Agricultural Risk Pricing in Senegal2019Journal of Mathematical Finance, 2019, 9, 182–201.
Publisher’s Note: MDPI stays neutral with regard to jurisdictional claims in published maps and institutional affiliations.

