Brief Report

Climate Change and Overuse: Water Resource Challenges during Economic Growth in Coquimbo, Chile

by
Roberto Pizarro
1,2,
Pablo A. Garcia-Chevesich
3,4,*,
John E. McCray
3,
Jonathan O. Sharp
3,
Rodrigo Valdés-Pineda
5,6,
Claudia Sangüesa
1,2,
Dayana Jaque-Becerra
7,
Pablo Álvarez
8,
Sebastián Norambuena
8,
Alfredo Ibáñez
2,
Carlos Vallejos
9 and
Romina Mendoza
1
1
Cátedra Unesco en Hidrología de Superficie, Universidad de Talca, Talca 3460000, Chile
2
Centro Nacional de Excelencia para la Industria de la Madera (CENAMAD), Pontificia Universidad Católica de Chile, Santiago 3580000, Chile
3
Department of Civil and Environmental Engineering, Colorado School of Mines, Golden, CO 80401, USA
4
Intergovernmental Hydrological Program, United Nations Educational, Scientific and Cultural Organization, Montevideo 11200, Uruguay
5
Piteau Associates, Water Management Group, Tucson, AZ 85716, USA
6
Department of Hydrology and Atmospheric Sciences, University of Arizona, Tucson, AZ 85721, USA
7
School of Forest Engineering, University of Talca, Talca 3460000, Chile
8
Laboratorio PROMMRA, Universidad de La Serena, La Serena 1700000, Chile
9
Independent Researcher, Talca 3460000, Chile
*
Author to whom correspondence should be addressed.
Sustainability 2022, 14(6), 3440; https://doi.org/10.3390/su14063440
Submission received: 23 December 2021 / Revised: 4 March 2022 / Accepted: 9 March 2022 / Published: 15 March 2022

Abstract

:
The arid Coquimbo region of Chile has experienced a significant economic growth in recent decades, fueled in large part by water-intensive activities such as mining and agriculture. Under this context, a monthly and annual trend analysis of precipitation, streamflow, and piezometric levels was carried out. Thus, 43 pluviometric stations, 11 fluviometric stations, and 11 wells were selected. These stations were evaluated for their temporal trends using the Mann–Kendall test. Results revealed a significant decrease in river flows, with negative and significant trends concentrated in the mean and maximum flows, both at annual and monthly levels. Likewise, positive trends were found in the depth to water table on wells, with significant trends in 81.8% of the monthly cases, and in 72.7% of the annual cases. While also decreasing over the same period, rainfall trends exhibit high variability and lacked significance. Although the amounts of precipitation have decreased, this does not seem to be the main factor responsible for the scarcity of water in the region, but rather an excessive consumption of this resource. This is endorsed by the increase in GDP (Gross Domestic Product), which is explained by activities that consume water (mining and agriculture). Similarly, an increase in the granting of underground water rights was verified, which speaks of the high demands for the resource. However, future modeling is advised to better understand the regional hydrology of the area and quantify the anthropic effects on water resources more precisely.

1. Introduction

Water is a critical natural resource for social, economic, and environmental development of Chile [1]. In the 1990–2017 period, Chile’s Gross Domestic Product (GDP) tripled, a growth fueled by industries reliant on water resources such as mining and agriculture [2]. Chile has a high degree of geographical variability in water supply [3]. From Santiago to the north, where arid and semi-arid zones are located, the availability is less than 1000 m3/inhabitant/year [4], which results in a situation of water stress [3,5] in territories dedicated mostly to mining, agriculture, and tourism [5]. Surface water rights in the Coquimbo Region were massively privatized and allocated between the 1980s and 2000s, in such a way that as of 2004 the basins were declared closed to access this type of right, after 95% of those rights were granted in that same year. Consequently, new demands from the private sector have been supplied with groundwater [6]. Resulting pressure on the aquifers with excessive concession of groundwater rights between latitudes 17°29′ S and 35° S [7] has led to conflicts among users [8]. The Region of Coquimbo is located within this territory.
Recent studies have concluded that climate change has affected this area due to a decrease in water supply [9,10,11]. This necessitates temporal understanding of regional variables such as rainfall, average and minimum river flows, maximum flows (which are the product of floods due to intense rains or thaws), and changes in water table (which expresses the pressure of groundwater use). We hypothesized that precipitation changes might affect water resources in the region, but the increase in the demand is most likely the main factor explaining the decrease in water supply, especially when considering the reduction in the volume of groundwater aquifers.

2. Materials and Methods

2.1. Study Domain

The Coquimbo Region is located between latitudes 29° S and 32° S (Figure 1) and has an area of 40,579 km2 (5.4% of the Chilean territory). The local climate is semi-arid (Figure 1) with a rainfall pattern defined by 2–3 wet months in the winter and a territorial gradient where rainfall increases from north to south and from the coast towards the Andes [12]. Annual rainfall ranges from 60 mm in the north of the region to 300 mm in the south [13].

2.2. Data Synthesis and Trend Analysis

The study considered the 1984–2018 period based on public information gathered from the General Water Directorate (DGA, the Government agency in charge of water resources management) stations, with 43 rain gauges, 10 river flow stations, and 11 piezometers, as shown in Figure 1. It is noteworthily to point out that the periodicity of the water table level records is variable and can be between 6 and 12 measurements per year. For this reason, only the months whose records were present in a given studied year were evaluated, effectively reducing the annual number of months analyzed.
Temporal (monthly and annual) trend analyses were carried out using the Mann–Kendall statistical test [14,15] (Equation (1)). This test verifies the existence of trends and whether they are statistically significant for a given confidence level (5% significance). Furthermore, it has the advantage of not requiring the data to come from a parametric distribution [14,15].
S = k = 1 n 1 j = k + 1 n s i g n x j x k
where S is the Mann–Kendall statistic; the sign function (xjxk) will have the value “1” if xjxk > 0; value “0” if xjxk = 0; and value “−1” if xjxk < 0. Similarly, xj and xk are consecutive values of the variable under study; n is the sample size; j and k represent two consecutive years; tp represents the frequency of ties in a group; and q is the number of groups with ties (p). Then, the variance VAR(S) is described in Equation (2).
V A R S = 1 18 n n 1 2 n + 5 p = 1 q t p t p 1 2 t p + 5
Finally, with both values, Z (the standardized test statistic) is calculated with one of the following expressions (Equation (3)), depending on the result from Equations (1) and (2) (see more details in Cabral and Lucena [16]):
Z = S 1 V A R S   ;   i f   S > 0 0   ;   i f   S = 0 S + 1 V A R S   ;   i f   S < 0
In addition to the above, the region’s economic evolution was evaluated (and graphically correlated to groundwater rights given in the same period) based on activities that normally demand large amounts of water.
On the other hand, the Coquimbo Region is made up of three large basins that group other smaller ones. These are Elqui, Limarí, and Choapa (Figure 1). In this context, it was possible to evaluate the consumption of water for productive purposes (annual agricultural crops) and the origin of the water used for irrigation. In addition, the volume stored in two aquifers inside the Elqui River basin was evaluated, derived from the fact that the minimum necessary information was available for these. These analyses were carried out through the use of the WEAP (Water Evaluation and Planning) [17,18] model, adjusted for the Elqui river basin within the framework of the FIA PYT 2017–0215 Project [19]. This model is composed of the integration of demand nodes and their interaction with surface and groundwater, with data from the MAGIC model (Integrated Generic Analytical Model of Basins)—Elqui, from a study called “Diagnostic Master Plan for the water resources management, Coquimbo Region” [20]. Likewise, the model allows us to estimate the volume of aquifers, through the interaction between the demand and its recharge from inefficiencies. The water demand is supplied by two sources: surface and groundwater rights.

3. Results

Monthly rainfall trends (Mann–Kendall test) were mainly negative (53.1%) over the 34-year study period, but with little statistical significance (0.8%). Annual rainfall exhibited similar downward trends (72.1%), but none of these were significant (Table 1). Therefore, rainfall does not show significant temporal changes (Table 1 and Figure 2).
Monthly flows, on the other hand, showed negative and significant trends (10.8%, 33.3%, and 29.2% for the minimum, average, and maximum flows, respectively (see Table 1)). Similarly, annual flows showed negative and significant trends (10.0%, 80.0%, and 50.0% for minimum, mean, and maximum values, respectively (see Table 1)). This is a concern for water resource sustainability because maximum flows are fed by floods (which are sporadic in semi-arid areas such as Coquimbo), and mean flows are fed mainly from waters previously stored in the basin as groundwater.
Groundwater tables in the study area also exhibited a temporal decrease in static levels. On a monthly basis, all trends showed a decrease in groundwater levels, and 81.8% of those were statistically significant, agreeing with Valois et al. [21], who found that 80% of the wells in the region show a significant decrease in their levels.
In addition to the above, the Coquimbo Region has seen a strong increase in GDP and water consumption, mostly from agriculture and mining industries (Figure 3, top).
Figure 4 shows the water sources used for irrigation of annual crops in the coastal part of the Elqui river basin, revealing a sustained increase in the use of groundwater for this purpose. Similarly, when evaluating the stored volume of two aquifers inside the Elqui river basin, a sustained decrease in its volume is appreciated (Figure 5).

4. Discussion

Based on the above, it can be seen that rainfall does not show significant changes in the last 34 years, according to the Mann–Kendall test and the Sen slopes, which agree with the conclusions by Souvignet et al. [22] and Favier et al. [23], who found that rainfall in recent decades has not presented clear trends for the Coquimbo Region. However, although the trends do not show a significant decrease, lower amounts of accumulated precipitation have been documented during the last decade due to the presence of a megadrought that lasted for more than 5 years [24]. Another factor to consider is presented in the interannual variability of rainfall, which fluctuates depending on the ENSO phases and can explain up to 32% of the variations in average rainfall for the region [25]. These variations are cyclical with durations between 3 and 5 years [26] and by oscillating between high and low periods can affect the detection of climatic trends; however, if the length of the data is at least 3 times the size of the cycle, trend detection should not be affected [27].
Groundwater demand for crop irrigation has increased steadily, reaching parity between the use of surface and groundwater resources as of 2010 (Figure 4). In addition, when verifying the volume stored in two aquifers of the Elqui basin, a sustained decrease in the accumulated volume was found, a decrease that has accelerated since 2010 (Figure 5). The above results coincide with what was found by Valois et al. [21], who identified a significant decrease in the piezometric levels of 80% of regional wells. Moreover, the authors found a 0.5-to-1 m per year decrease water table levels at the Culebrón aquifer, explained by the increase in water consumption for agricultural purposes.
It is noteworthily to mention that water table decreases coincide with the beginning of the megadrought in Chile [24]. Based on the foregoing, it is possible to point out that despite the presence of a sustained megadrought in the last decade, the amounts of precipitation in the area do not show a significant decrease, so precipitation is most likely not the main factor responsible for the decrease in the flows and the increase in the depth to water tables. Above all, considering that the reduction of water in the region occurs in conjunction with an increase in productive activities (mainly mining and agriculture), sectors that require thousands of cubic hectometers per year and that are expected to change by −2.5% and 71.2%, respectively, by the year 2040 [28].
Considering that the main economic activities of the region require water for their execution, it is verified that this natural resource acts as a limiting factor of production [29], and therefore, by reducing surface water sources in the case of agriculture to maintain and increase cultivated areas, underground water tables have been exploited and this would explain in part the increase in the depth to water tables. Notwithstanding the foregoing, Gu et al. [30] and Hemati et al. [31] point out that economic development and water consumption can be modeled as an inverted “U”, where economic growth increases together with water consumption, to later stabilize and decrease, depending on the optimization of production processes and the implementation of new technologies [30]. However, Duarte et al. [32] concluded that despite greater efficiency in the use of water, this model of growth and water consumption is not sustainable over time. The foregoing becomes relevant when considering that groundwater is slow to recover and, therefore, its exploitation must be done under a sustainable model.
Under a similar context, Valdés-Pineda et al. [33] studied the causes leading to the disappearance of the Aculeo lagoon (central Chile), finding that, although the effects of less precipitation on the amount of available water are manifested, this ecological disaster occurred mainly as a consequence of overconsumption of the resource, used mainly for agricultural purposes. A similar situation is described by Muñoz et al. [34] in the Petorca basin (Valparaíso Region), where the reduction of the Petorca river is not fully explained by climatic variability, but mostly water withdrawals for agricultural purposes, whose high evapotranspiration rates play an important role in the water scarcity of the basin. Similarly, Duran-Llacer et al. [35] analyzed groundwater withdrawals in the La Ligua and Petorca basins (Valparaíso Region), finding that the decrease in piezometric levels is mainly due to the use of groundwater to maintain and increase the area planted with avocado trees in the region (agricultural uses). Finally, Aitken et al. [3] analyzed the scarcity of water in Chile, concluding that the main consumer of water in the Antofagasta Region (north of Chile) is mining, in addition to being the main factor contributing to the region’s water scarcity. In the other regions of the country, it was found that agriculture is the main consumer of water and, therefore, an increase in irrigation efficiency would be beneficial in terms of water availability.
When considering the results altogether, it is possible to point out that the Coquimbo Region has been affected by the effects of climate change, reducing the amount of available surface water. However, agricultural and mining production in the area are activities that require tremendous amounts of water, and in the case of agriculture, its demand is projected to increase (as previously mentioned), a situation that is not sustainable with current water availability in the region (Figure 5). Similar conclusions were obtained by Alam et al. [36], who analyzed groundwater consumption in the central valley of California, finding that the decrease in piezometric levels can be explained by an increase in agricultural areas, a greater need for irrigation due to high temperatures, and the implementation of crops with higher water demands. In the case of the Coquimbo Region, temperatures have risen [19], together with an increase in the area occupied by fruit trees (e.g., lemon, cherry, and clementine trees, among others) [37] and a megadrought has been present in the last decade, a situation that has required increasing pressure on groundwater resources to meet agricultural needs and whose water demands exceed the natural recharge rate of the aquifers of the northern and central macrozones of the country [38].
Despite the above, one limitation of this study is not having enough information to model water consumption and economic development in the Coquimbo Region. However, the increase in water rights requested from DGA, together with the rise in GDP (Figure 3), seem to indicate that the study area has not yet reached the point of stabilization in water consumption, derived from the fact that both still show increasing trends. Additionally, only the modeled Elqui river basin is available, and for this reason, it was the only one used to evaluate the relationship between water consumption and its origin (surface or underground). However, it is expected that the behavior in the Choapa and Limarí basins (the other two large basins of the Coquimbo Region) will be similar to that of the Elqui River basin, derived from the fact that the three basins have similar climates and land uses, in terms of mining and agriculture.

5. Conclusions

The results achieved and the analysis carried out allow us to conclude that, although rainfall shows a decline in the studied period for the Coquimbo Region in Chile, these falls are not significant. It follows that the lower supply in mean and maximum flows could not be directly attributed to climatic factors, but to other variables. It was verified and concluded that the economic activities have grown strongly in the period studied and, since they are highly demanding of water, these are most likely the main causes of the decrease in water supply. This fact is corroborated by the increase in the use of groundwater and the depth between the surface and the piezometric level of the various analyzed wells. Moreover, human activities and overuse are rapidly depleting water resources (especially groundwater) in the region, and the problem is further complicated by a changing climate and decreasing precipitation. However, the overall trend is stronger for overconsumption compared to climate variability, affecting the long-term productivity and water resource sustainability of this area of the country.
Results show that the main cause of this concerning situation is excessive consumption, and there is an urgent need to know (model) how to adequately quantify water availability, as well as current uses, before authorizing new water withdrawals. This is also applicable to current productive activities that, apparently, might not have enough water in the future for them to function. Therefore, if this is not considered properly, the region could be facing a critical situation that will condition its productive future and, most importantly, its environmental future, which is the basis of all human sustainability.
Considering the above, future modeling is advised to better understand the regional hydrology of the area and quantify the anthropic effects on water resources more precisely.

Author Contributions

Conceptualization: R.P.; Methodology: R.P., R.V.-P. and P.A.G.-C.; Software: C.S., A.I. and D.J.-B.; Validation: P.Á. and S.N.; Formal analysis: C.S., C.V. and R.M.; Investigation: R.P., D.J.-B., P.Á., S.N., C.V. and R.M.; Resources: R.P.; Data curation: A.I., D.J.-B., P.Á. and S.N.; Writing—original draft preparation: R.P., P.A.G.-C., J.E.M. and J.O.S.; Visualization: R.P. All authors have read and agreed to the published version of the manuscript.

Funding

This research received no external funding.

Institutional Review Board Statement

Not applicable.

Informed Consent Statement

Not applicable.

Data Availability Statement

Most data used in this study can be found at DGA’s, DMC’s and IDEChile websites (www.dga.cl; www.dmc.cl and www.ide.cl, all accessed on 5 January 2020).

Acknowledgments

The authors acknowledge the support of ANID BASAL FB210015 CENAMAD and the Center for Sustainable Mining, a joint adventure between Colorado School of Mines and Universidad Nacional de San Agustín de Arequipa (UNSA), as well as the insights from Héctor Novoa from UNSA.

Conflicts of Interest

The authors declare no conflict of interest.

References

  1. Agudelo, R. El agua recurso estratégico del siglo XXI. Fac. Nac. Salud Pública 2005, 23, 92–102. [Google Scholar]
  2. Canales, A.; Canales, M. Población y territorio en el modelo económico chileno. El caso de la comarca del Aconcagua. Pap. Población 2016, 88, 9–46. [Google Scholar]
  3. Aitken, D.; Rivera, D.; Godoy, A.; Holzapfel, E. Water scarcity and the impact of the mining and agricultural sectors in Chile. Sustainability 2016, 8, 128. [Google Scholar] [CrossRef] [Green Version]
  4. Valdés-Pineda, R.; Pizarro, R.; García-Chevesich, P.; Valdés, J.; Olivares, C.; Vera, M.; Balocchi, F.; Pérez, F.; Vallejos, C.; Fuentes, R.; et al. Water governance in Chile: Availability, management and climate change. J. Hydrol. 2014, 519, 2538–2567. [Google Scholar] [CrossRef]
  5. Budds, J. Contested H2O: Science, policy and politics in water resources management in Chile. Geoforum 2009, 40, 418–430. [Google Scholar] [CrossRef]
  6. Arumí, R.; Oyarzún, L. Las aguas subterráneas en Chile. Boletín Geol. Min. 2006, 117, 34–45. [Google Scholar]
  7. Ministerio del Interior y Seguridad Pública. Política Nacional para los Recursos Hídricos. 2015. Available online: https://www.interior.gob.cl/media/2015/04/recursos_hidricos.pdf (accessed on 9 January 2021).
  8. Oyarzún, J.; Oyarzún, R. Sustainable development threars, inter-sector conflicts and environmental policy requirements in the arid, mining rich, northern Chile territory. Sustain. Dev. 2009, 19, 263–274. [Google Scholar] [CrossRef]
  9. Boisier, J.; Rondanelli, R.; Garreaud, R.; Muñoz, F. Anthropogenic and natural contributions to the southeast pacific precipitation decline and recent megadrought in central Chile. Geophys. Res. Lett. 2016, 43, 413–421. [Google Scholar] [CrossRef] [Green Version]
  10. Garreaud, R.; Alvarez-GArreton, C.; BArichivich, J.; Boisier, J.; Christie, D.; Galleguillos, M.; LeQuesne, C.; McPhee, J.; Zambrano-Bigiarini, M. The 2010–2015 mega drought in Central Chile: Impacts on regional hydroclimate and vegetation. Hydrol. Earth Syst. Sci. 2017, 21, 6307–6327. [Google Scholar] [CrossRef] [Green Version]
  11. González, M.; Gómez, S.; Lara, A.; Garreaud, R.; Díaz, I. The 2010–2015 megadrought and its influence on the fire regime in central and south-central Chile. Ecosphere 2018, 9, e02300. [Google Scholar] [CrossRef] [Green Version]
  12. Sarricolea, P.; Herrera, M.; Meseguer, O. Climatic regionalisation of continental Chile. J. Maps 2017, 13, 66–73. [Google Scholar] [CrossRef]
  13. Moncada, X.; Plaza, D.; Stoll, A.; Payacan, C.; Seelenfreund, D.; Martínez, E.; Bertin, A.; Squeo, F. Genetic diversity and structure of the vulnerable specie Prosopis chilensis (Molina) stuntz in the Coquimbo region, Chile. Gayana Bot. 2019, 76, 91–104. [Google Scholar] [CrossRef] [Green Version]
  14. Ahmad, I.; Tang, D.; Wang, T.; Wang, M.; Wagan, B. Precipitation Trends over Time Using Mann-Kendall and Spearman’s rho Tests in Swat River Basin, Pakistan. Adv. Meteorol. 2015, 2015, 431860. [Google Scholar] [CrossRef] [Green Version]
  15. Sangüesa, C.; Pizarro, R.; Ibañez, C.; Pino, J.; Rivera, D.; García-Chevesich, P.; Ingram, B. Spatial and Temporal Analysis of Rainfall Concentration Using the Gini Index and PCI. Water 2018, 10, 112. [Google Scholar] [CrossRef] [Green Version]
  16. Cabral, J.; Lucena, R. Analysis of precipitation using Mann-Kendall and Kruskal-Wallis non-parametric tests. Mercator-Rev. Geogr. UFC 2020, 19, 1–15. [Google Scholar]
  17. Abera-Abdi, D.; Ayenew, T. Evaluation of the WEAP model in simulating subbasins hydrology in the Central Rift Valley basin, Ethiopia. Ecol. Processes 2021, 10, 41. [Google Scholar] [CrossRef]
  18. Hervis-Granda, G.; Geler-Roffe, T.; Díaz-García, R.; Amestoy, I.; Cretas, E. WEAP model: Hydrological planning tool dor climate change adaptation. Rev. Ing. Agrícola 2018, 8, 40–47. [Google Scholar]
  19. Álvarez, P.; Norambuena, S. Manual de Operaciones para la Junta de Vigilancia del río Elqui y sus Afluentes. Laboratorio PROMMRA, Universidad de La Serena. Proyecto FIA PYT 2019, 2017, 0215. [Google Scholar]
  20. Gobierno Regional—Región de Coquimbo; CONIC Consultores e Ingeniería. Diagnóstico Plan Maestro para la Gestión de Recursos Hídricos, Región de Coquimbo. 2013. Available online: https://snia.mop.gob.cl/repositoriodga/handle/20.500.13000/4329 (accessed on 5 January 2020).
  21. Valois, R.; MacDonell, S.; Núñez, J.; Maureira, H. Groundwater level trends and recharge event characterization using historical observed data in semi-arid Chile. Hydrol. Sci. J. 2020, 65, 597–609. [Google Scholar] [CrossRef]
  22. Souvignet, M.; Oyarzún, R.; Verbist, K.; Gaese, H.; Heinrich, J. Hydro-meteorological trends in semi-arid north-central Chile (2–32° S): Water resources implications for fragile Andean region. Hydrol. Sci. J. 2012, 57, 479–495. [Google Scholar] [CrossRef] [Green Version]
  23. Favier, V.; Falvey, M.; Rabatel, A.; Praderio, E.; López, D. Interpreting discrepancies between discharge and precipitation in high-altitude area of Chile’s Norte Chico region (26–32° S). Water Resour. Res. 2009, 45, W02424. [Google Scholar] [CrossRef] [Green Version]
  24. Garreaud, R.; Boisier, J.; Rondanelli, R.; Montecinos, A.; Sepúlveda, H.; Veloso-Aguila, D. The Central Chile Mega Drought (2010–2018): A climate dynamics perspective. Int. J. Climatol. 2020, 40, 421–439. [Google Scholar] [CrossRef]
  25. Verbist, K.; Robertson, A.; Cornelis, W.; Gabriels, D. Seasonal predictability of daily rainfall characteristics in central northern Chile for dry-land management. J. Appl. Meteorol. Climatol. 2010, 49, 1938–1955. [Google Scholar] [CrossRef] [Green Version]
  26. Montecinos, S.; Gutiérrez, J.; López, F.; López, D. Climatic characteristics of the semi-arid Coquimbo region in Chile. J. Arid Environ. 2016, 126, 7–11. [Google Scholar] [CrossRef]
  27. Chen, Z.; Grasby, S. Impact of decadal and century-scale oscillations on hydroclimate trend analyses. J. Hydrol. 2009, 365, 122–133. [Google Scholar] [CrossRef]
  28. Ministerio de Obras Públicas (MOP). Estimacion de la Demanda Actual, Proyecciones Futuras y Caracterización de la Calidad de los Recursos Hídricos en Chile. 2017. Available online: https://dga.mop.gob.cl/Estudios/04%20Resumen%20Ejecutivo/.Resumen%20Ejecutivo.pdf (accessed on 5 January 2020).
  29. Meadows, D.; Meadows, D.; Randers, J.; Behrens, W. The Limits to Growth: A Report for the Club of Rome’s Project on the Predicament of Mankind; Universe Books: New York, NY, USA, 1972. [Google Scholar]
  30. Gu, A.; Zhang, Y.; Pan, B. Relationship between industrial water use and economic growth in China: Insights from an environmental Kuznets curve. Water 2017, 9, 556. [Google Scholar] [CrossRef] [Green Version]
  31. Hemati, A.; Mehrara, M.; Sayehmiri, A. New Vision on the Relationship between Income and Water Withdrawal in Industry Sector. Nat. Resour. 2011, 2, 191–196. [Google Scholar] [CrossRef] [Green Version]
  32. Duarte, R.; Pinilla, V.; Serrano, A. Looking backward to look forward: Water use and economic growth from a long-term perspective. Appl. Econ. 2014, 46, 212–224. [Google Scholar] [CrossRef] [Green Version]
  33. Valdés-Pineda, R.; Garcia-Chevesich, P.A.; Alaniz, A.J.; Venegas-Quiñones, H.L.; Valdés, J.B.; Pizarro, R. The Impact of a Lack of Government Strategies for Sustainable Water Management and Land Use Planning on the Hydrology of Water Bodies: Lessons Learned from the Disappearance of the Aculeo Lagoon in Central Chile. Sustainability 2022, 14, 413. [Google Scholar] [CrossRef]
  34. Muñoz, A.; Klock-Barría, K.; Álvarez-Garretón, C.; Aguilera-Betti, I.; González-Reyes, A.; Lastara, J.; Chávez, R.; Barría, P.; Christie, D.; Rojas-Badilla, M.; et al. Water crisis en Petroca Basin, Chile: The combined effects of a mega-drought and water management. Water 2020, 12, 648. [Google Scholar] [CrossRef] [Green Version]
  35. Duran-Llacer, I.; Munizaga, J.; Ruybal, c.; Aguayo, M.; Sáez-Carrillo, K.; Arriagada, L.; Rojas, O. Lessons to be learned: Groundwater depletion in Chile’s Ligua and Petorca watersheds through an interdisciplinary Approach. Water 2020, 12, 2446. [Google Scholar] [CrossRef]
  36. Alam, S.; Gebremichael, M.; Li, R.; Dozier, J.; Lettenmaier, D. Climate change on groundwater storage in the Central Valley, California. Clim. Chang. 2019, 157, 387–406. [Google Scholar] [CrossRef]
  37. Oficina de Estudios y Políticas Agrarias (Odepa). Estadísticas de Frutales, Superficie Plantada Nacional. Available online: https://www.odepa.gob.cl/estadisticas-del-sector/estadisticas-productivas (accessed on 5 January 2020).
  38. Donoso, G. Gestión de los recursos hídricos en la agrícultura de Chile y sus desafíos. Int. J. Agric. Nat. Resour. 2021, 48, 171–185. [Google Scholar]
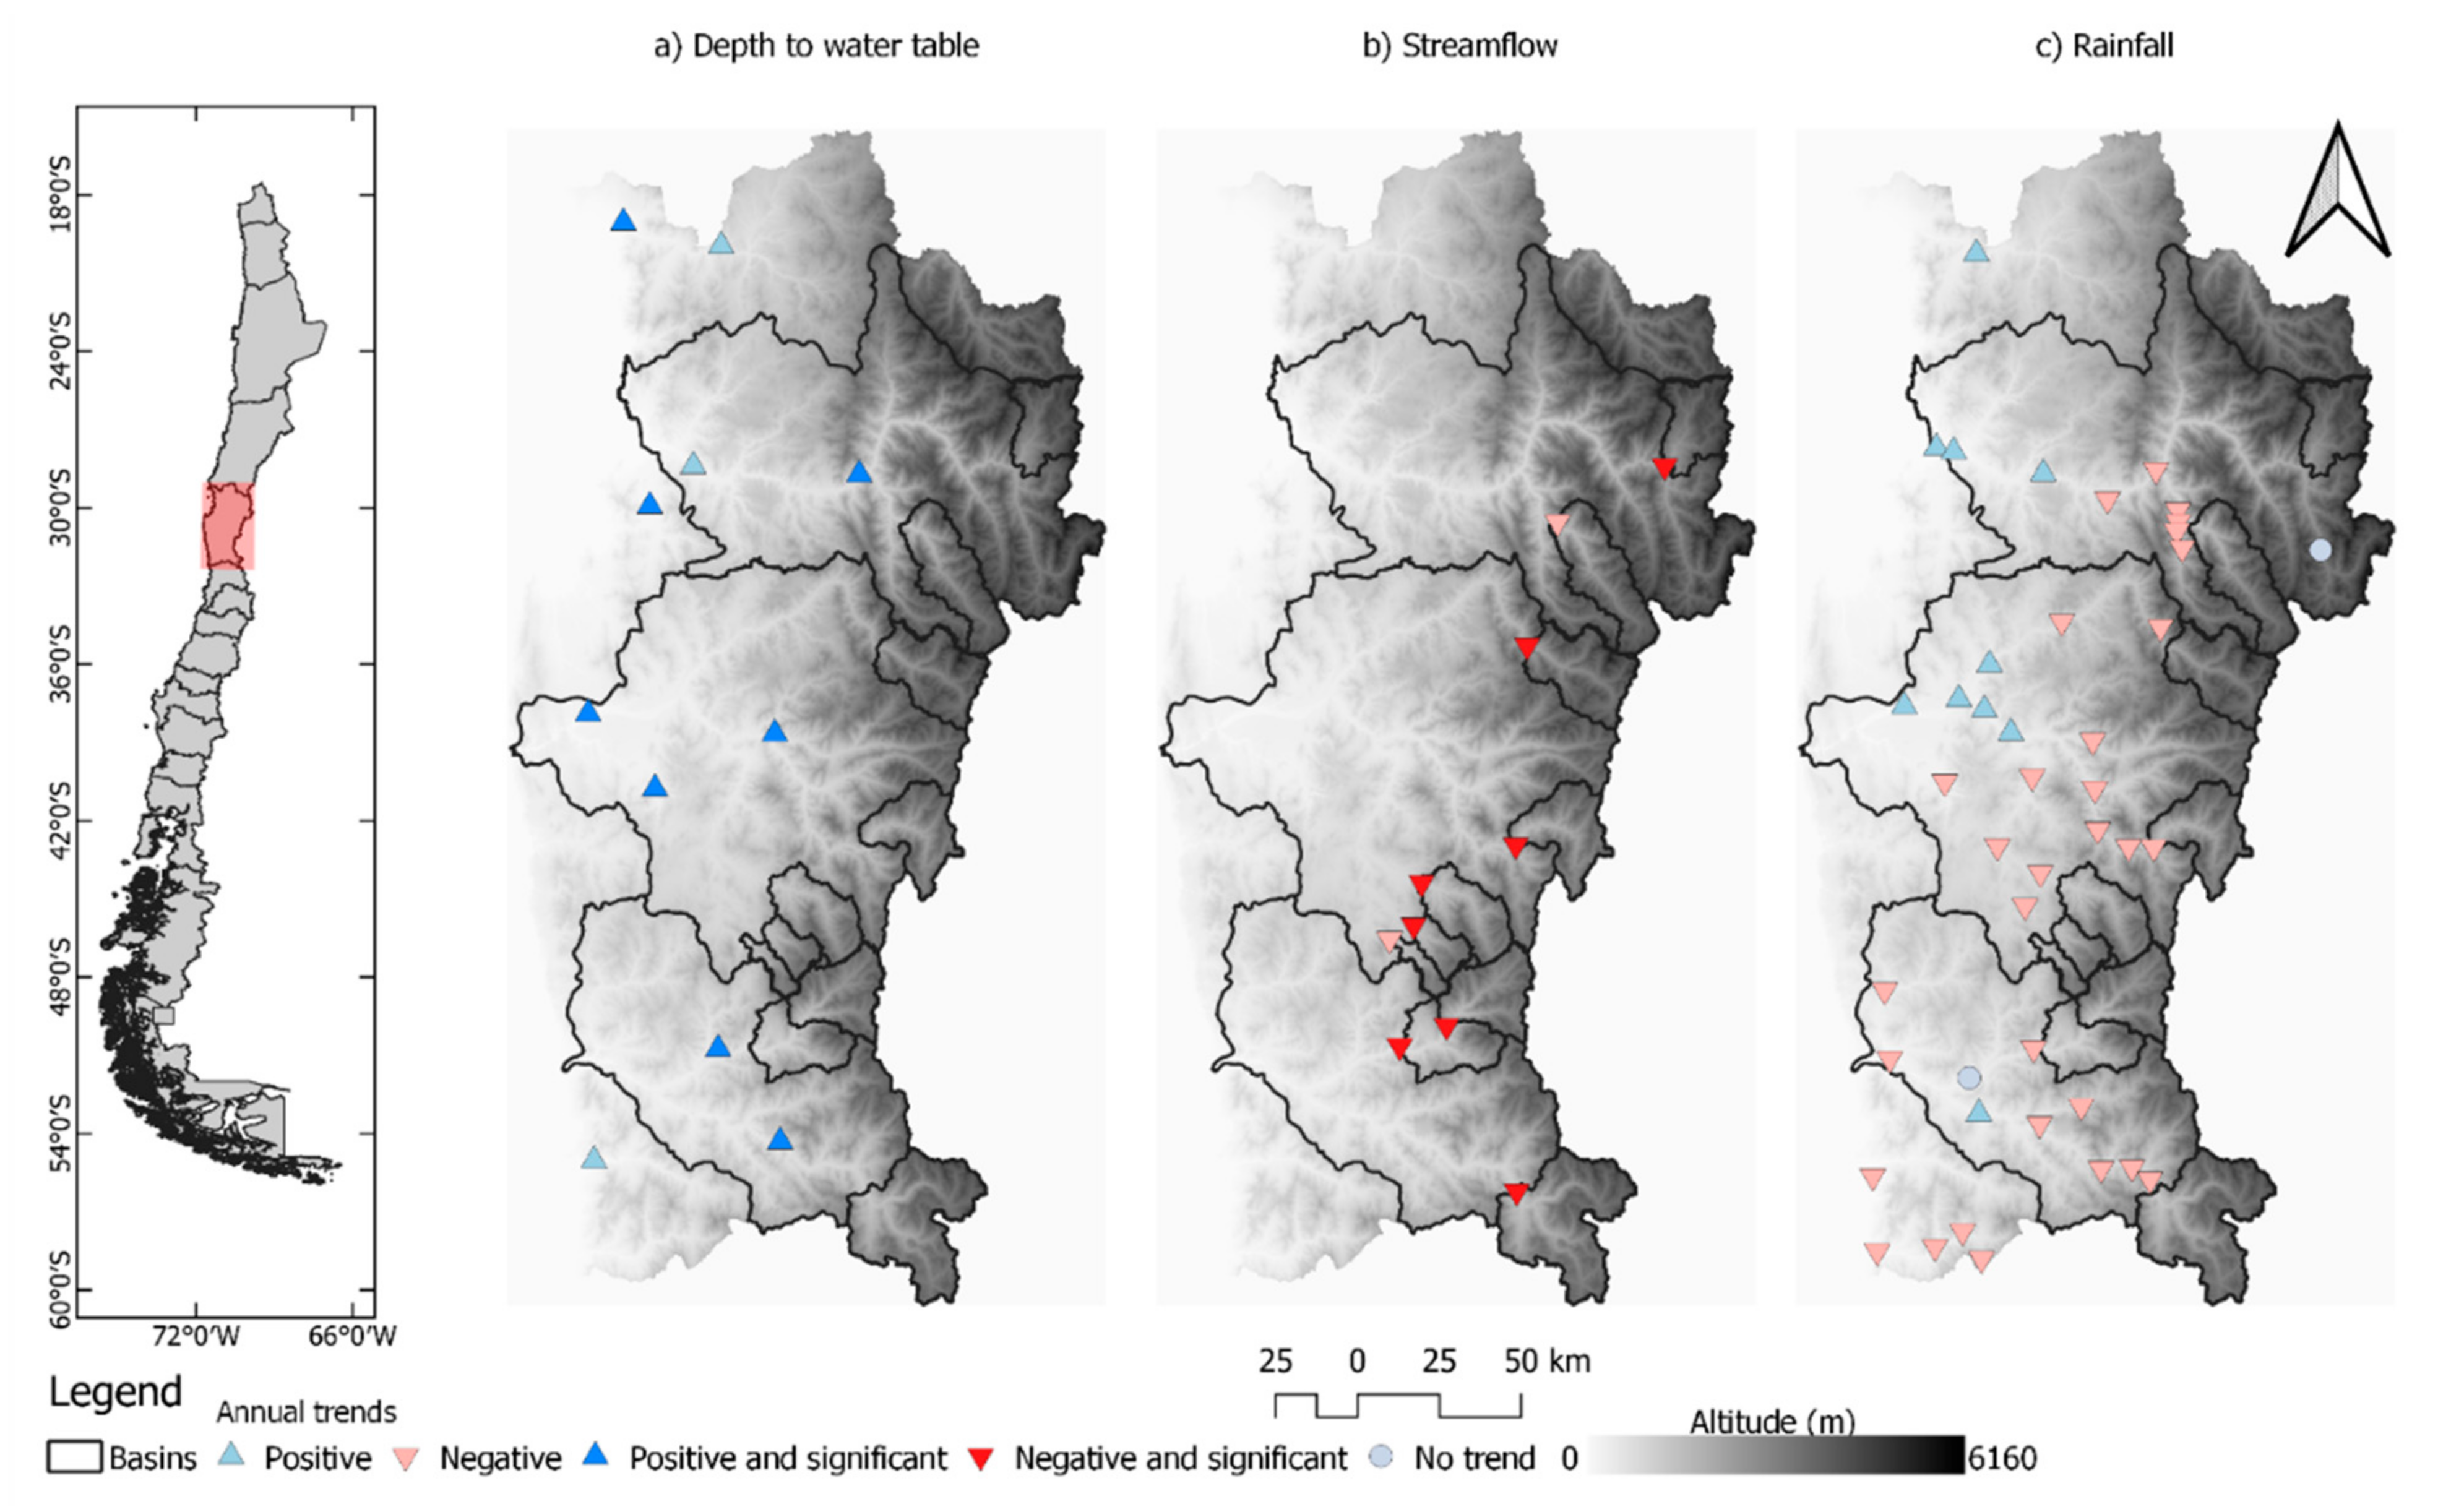
Figure 1. Location of the fluviometric, pluviometric, and piezometric stations, and climate classification of the Coquimbo Region in the Elqui, Limarí, and Choapa watersheds (layers available at: www.ide.cl and www.dga.cl. Accessed on 5 January 2020).
Sustainability 14 03440 g001
Figure 2. Annual trends on (a) distance to water tables; (b) average flow rate; and (c) accumulated rainfall (Source: own work).
Sustainability 14 03440 g002
Figure 3. (Top): Evolution of GDP and groundwater rights for the Coquimbo Region, Chile. Source: Water Rights Granted in the Coquimbo Region (DGA, 2021) and Central Bank of Chile. (Bottom): Regional mean precipitation, surface flows, and depth to water tables in the Coquimbo Region, and their respective trends (Sen Slopes).
Sustainability 14 03440 g003
Figure 4. Water supply for annual crops in the coastal zone of the Elqui river basin.
Sustainability 14 03440 g004
Figure 5. Temporal variation of the Culebrón and Elqui aquifers’s volume (Elqui basin).
Sustainability 14 03440 g005
Table 1. Monthly and annual trends in rainfall, flows, and depth to water table in the Coquimbo Region (1984–2018). Significant values for an α < 0.05.
VariableComponentNegativePositivePositive and SignificantNegative and SignificantNo Trends
RainfallMonthly274 (53.1%)193 (37.4%)4 (0.8%)4 (0.8%)41 (7.9%)
Annual31 (72.1%)10 (23.3%)0 (0%)0 (0%)2 (4.7%)
StreamflowMonthlyMin102 (85.0%)4 (3.3%)0 (0%)13 (10.8%)1 (0.8%)
Mean80 (66.6%)0 (0%)0 (0%)40 (33.3%)0 (0%)
Max85 (70.8%)0 (0%)0 (0%)35 (29.2%)0 (0%)
AnnualMin7 (70.0%)1 (10.0%)0 (0%)1 (10.0%)1 (10.0%)
Mean2 (20.0%)0 (0%)0 (0%)8 (80.0%)0 (0%)
Max5 (50.0%)0 (0%)0 (0%)5 (50.0%)0 (0%)
Depth to water TableMonthly0 (0%)12 (18.2%)54 (81.8%)0 (0%)0 (0%)
Annual0 (0%)3 (27.3%)8 (72.7%)0 (0%)0 (0%)
Publisher’s Note: MDPI stays neutral with regard to jurisdictional claims in published maps and institutional affiliations.

