
Using Rasch Analysis to Assess the Psychometric Properties of a Five-Item Version of the General Self-Efficacy Scale in Adolescents


Abstract
:1. Introduction
2. Materials and Methods
3. Result
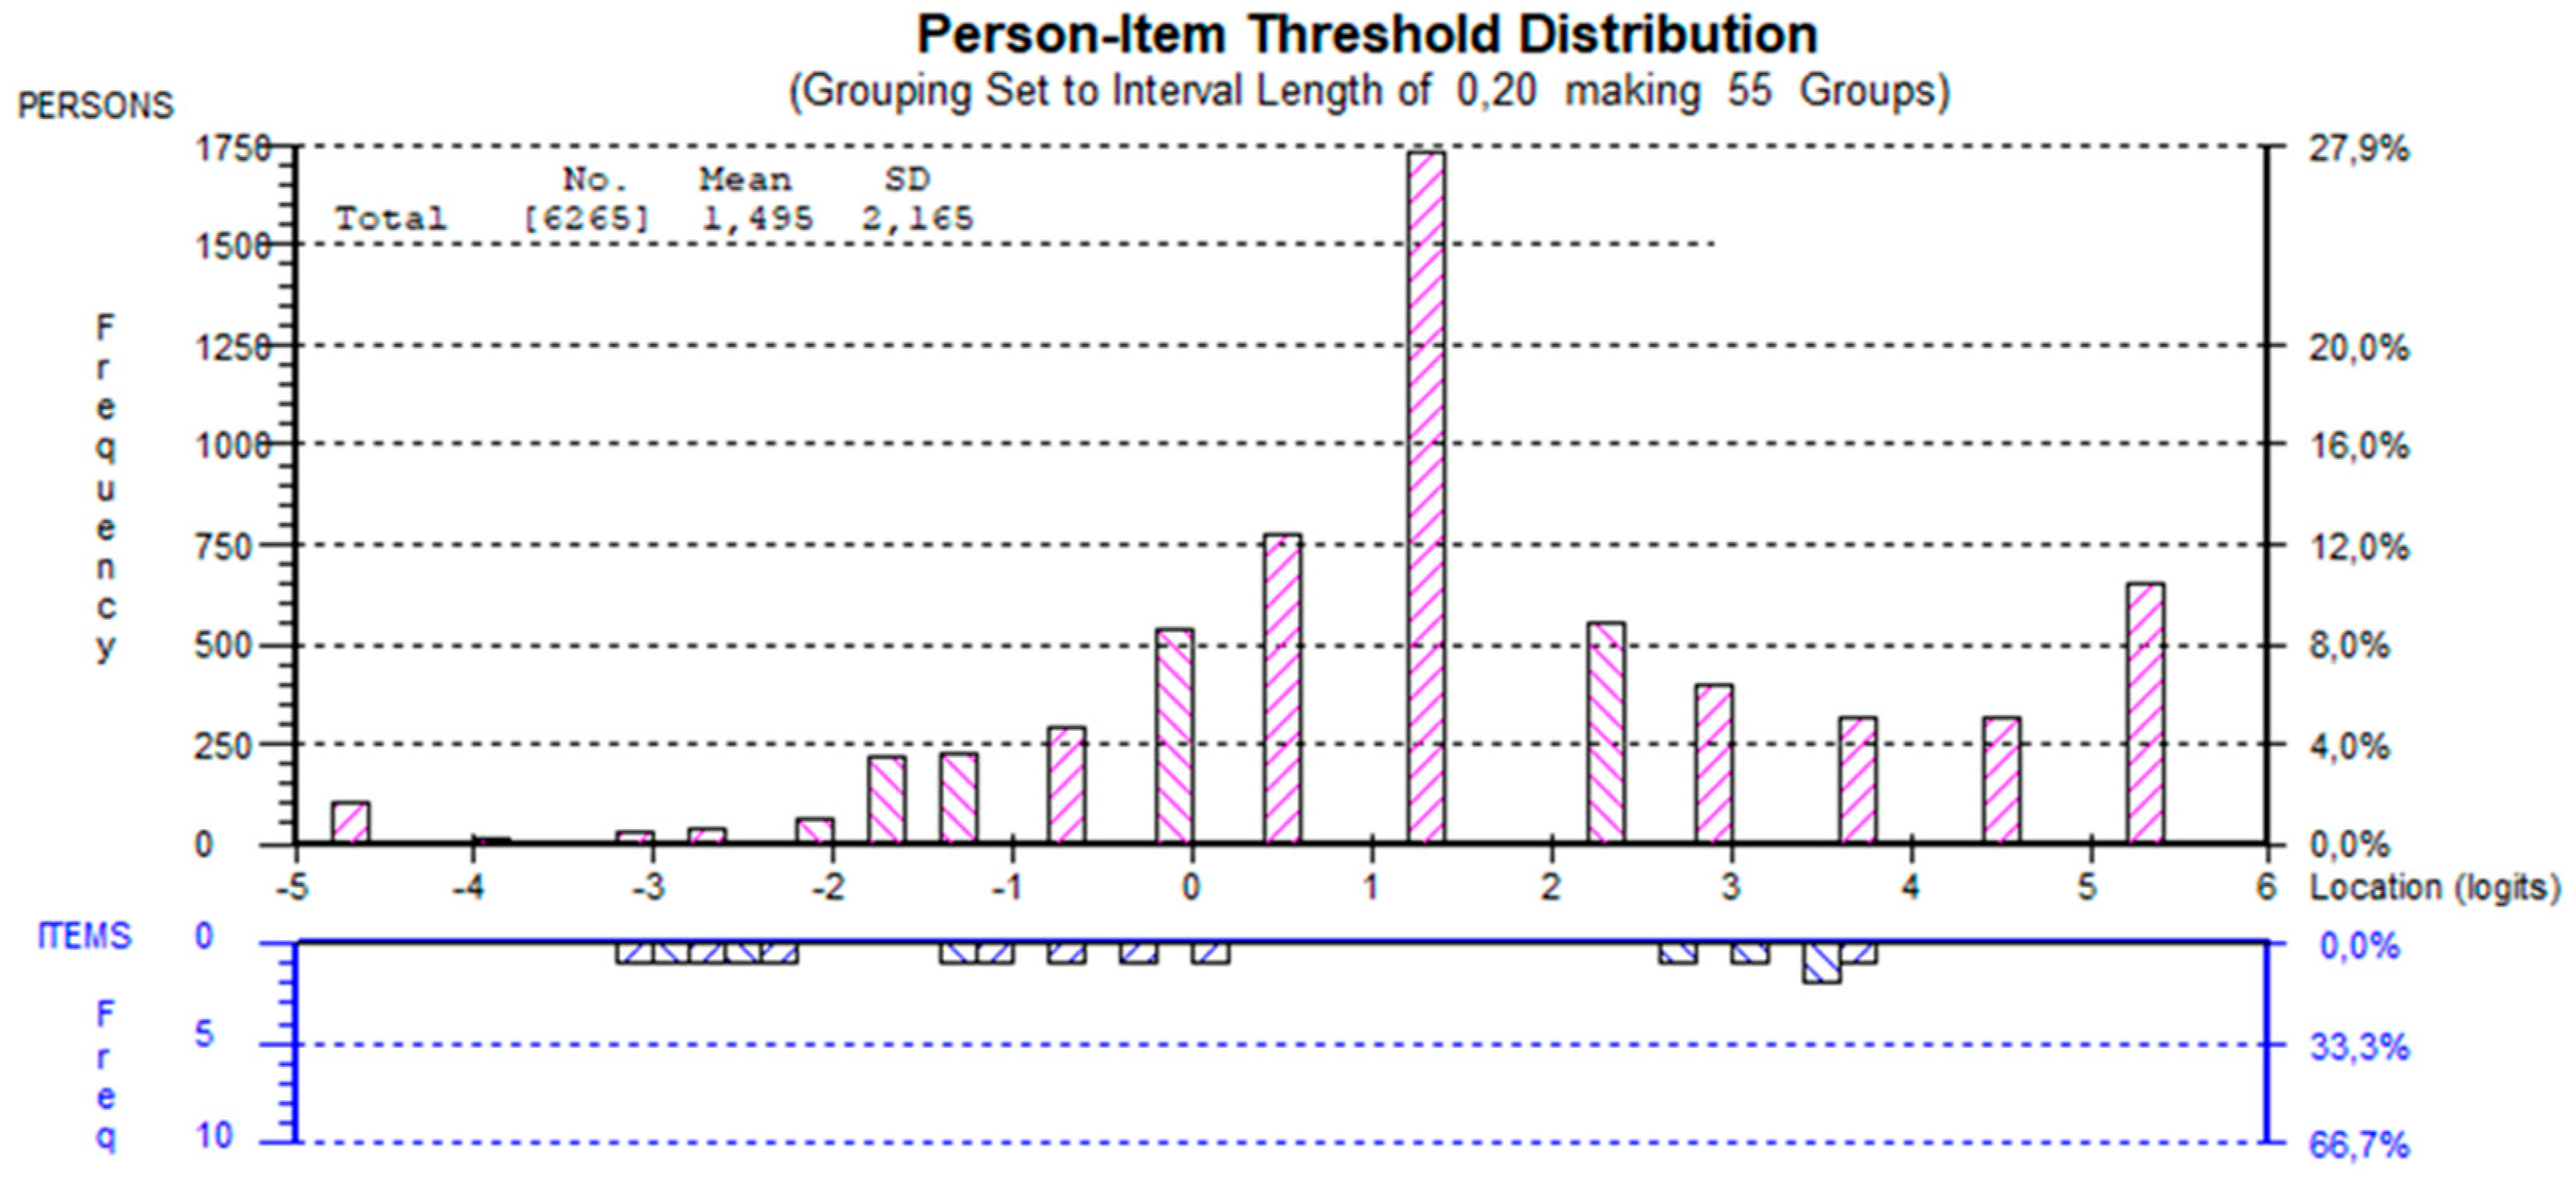
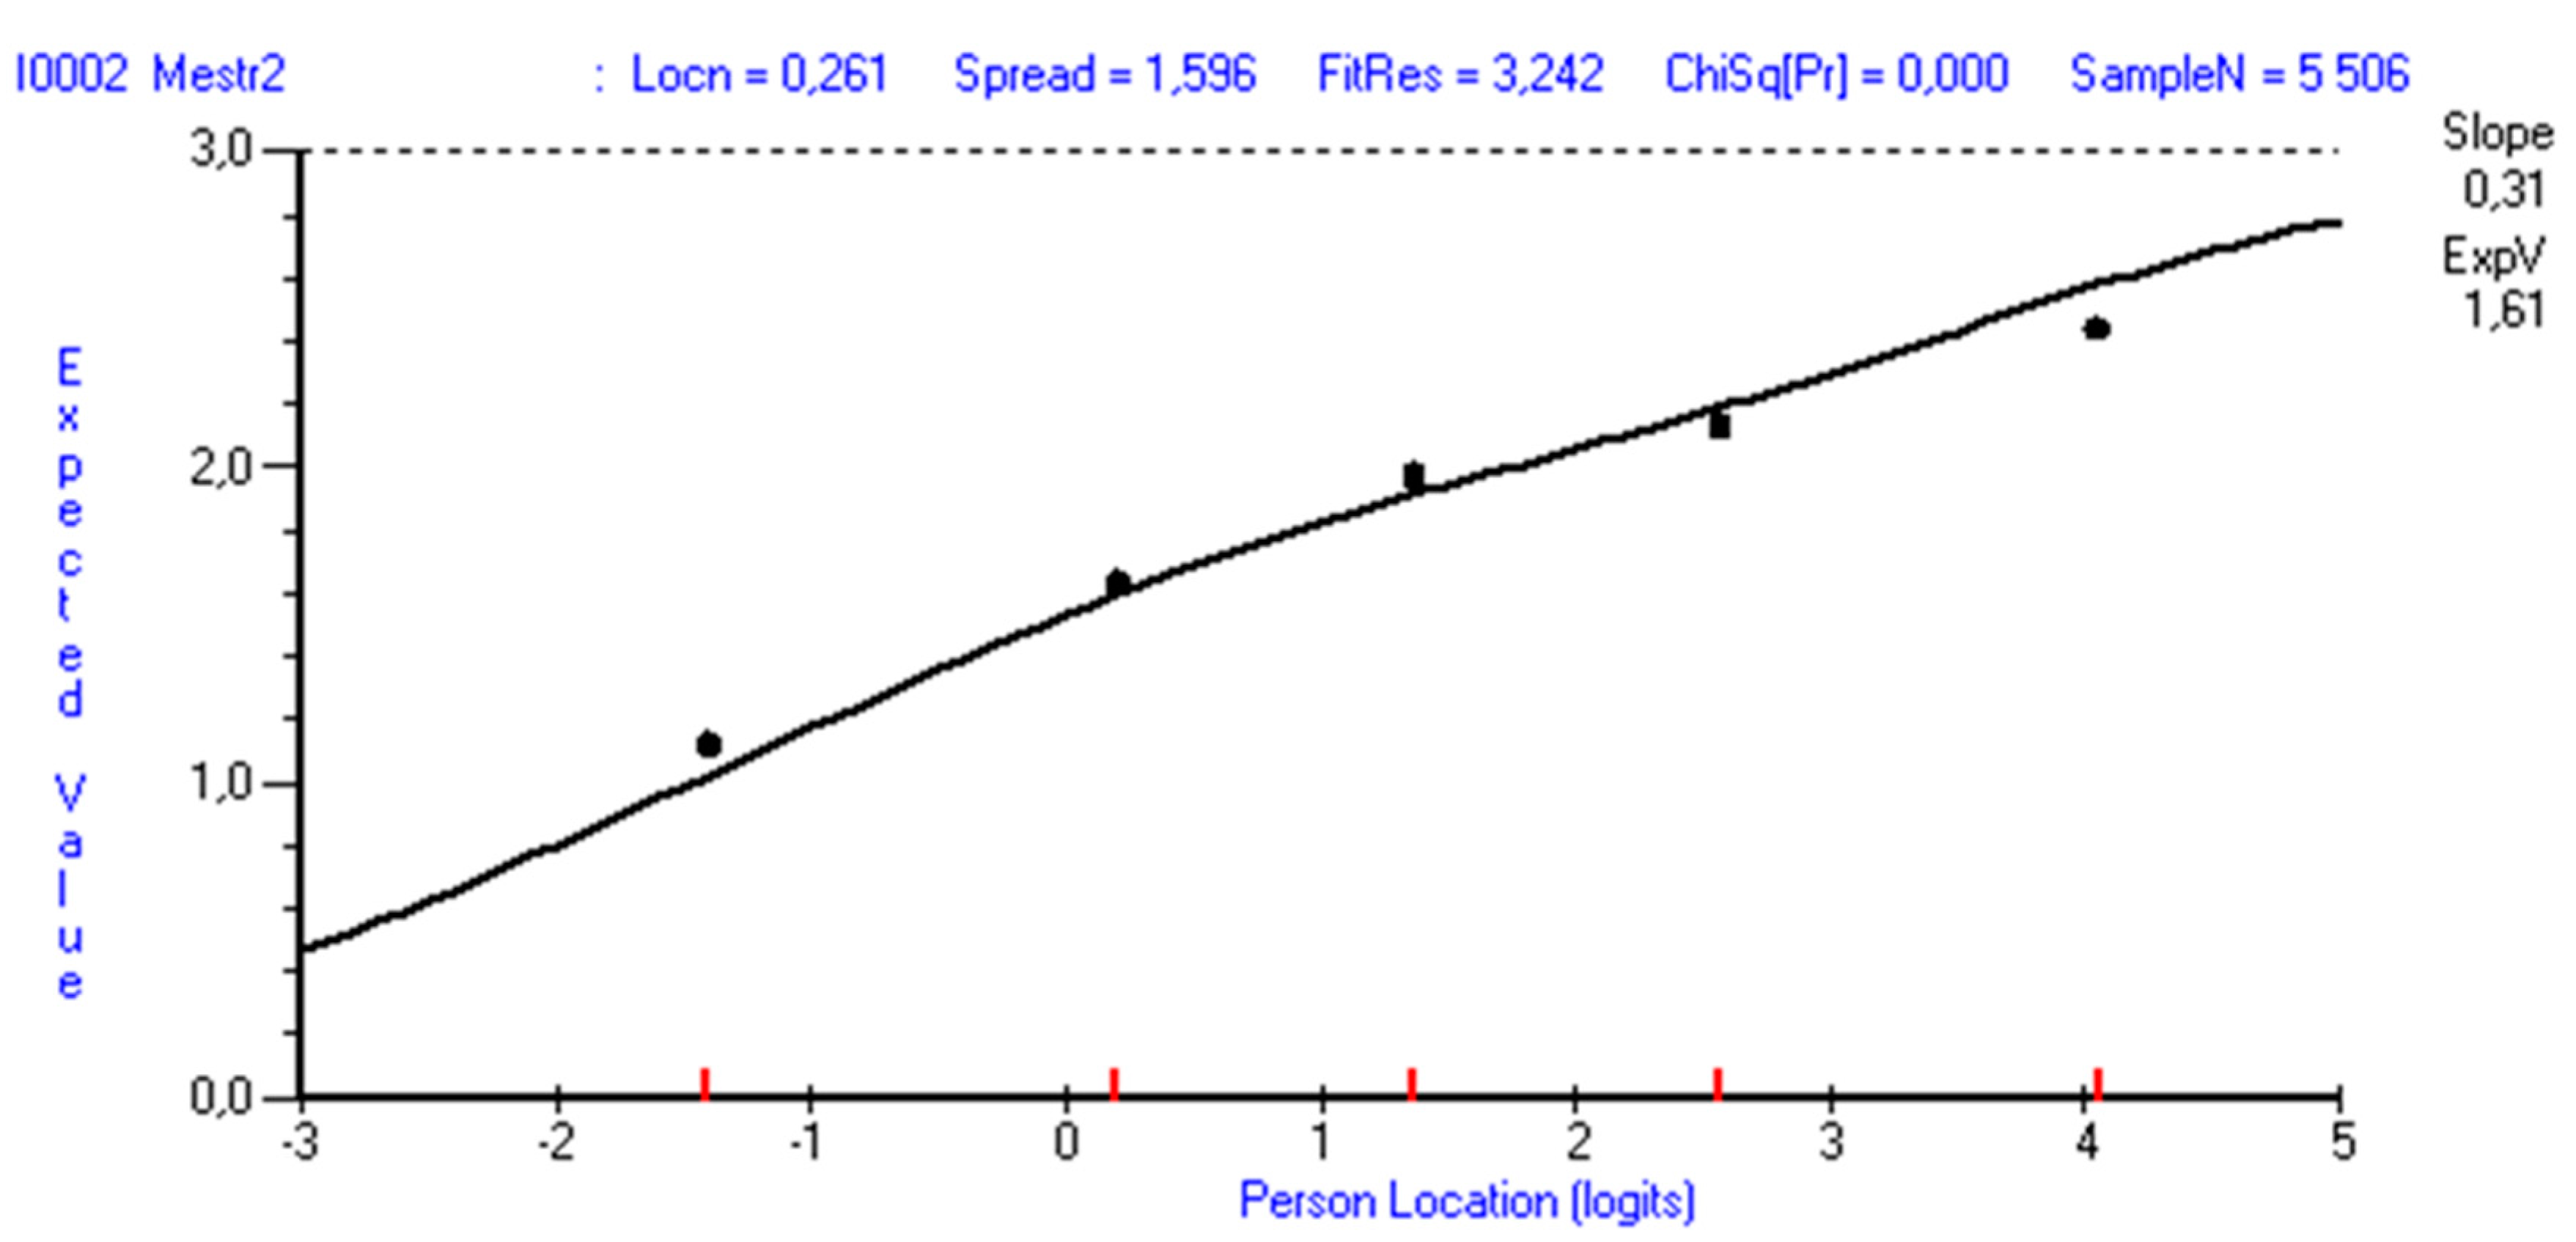
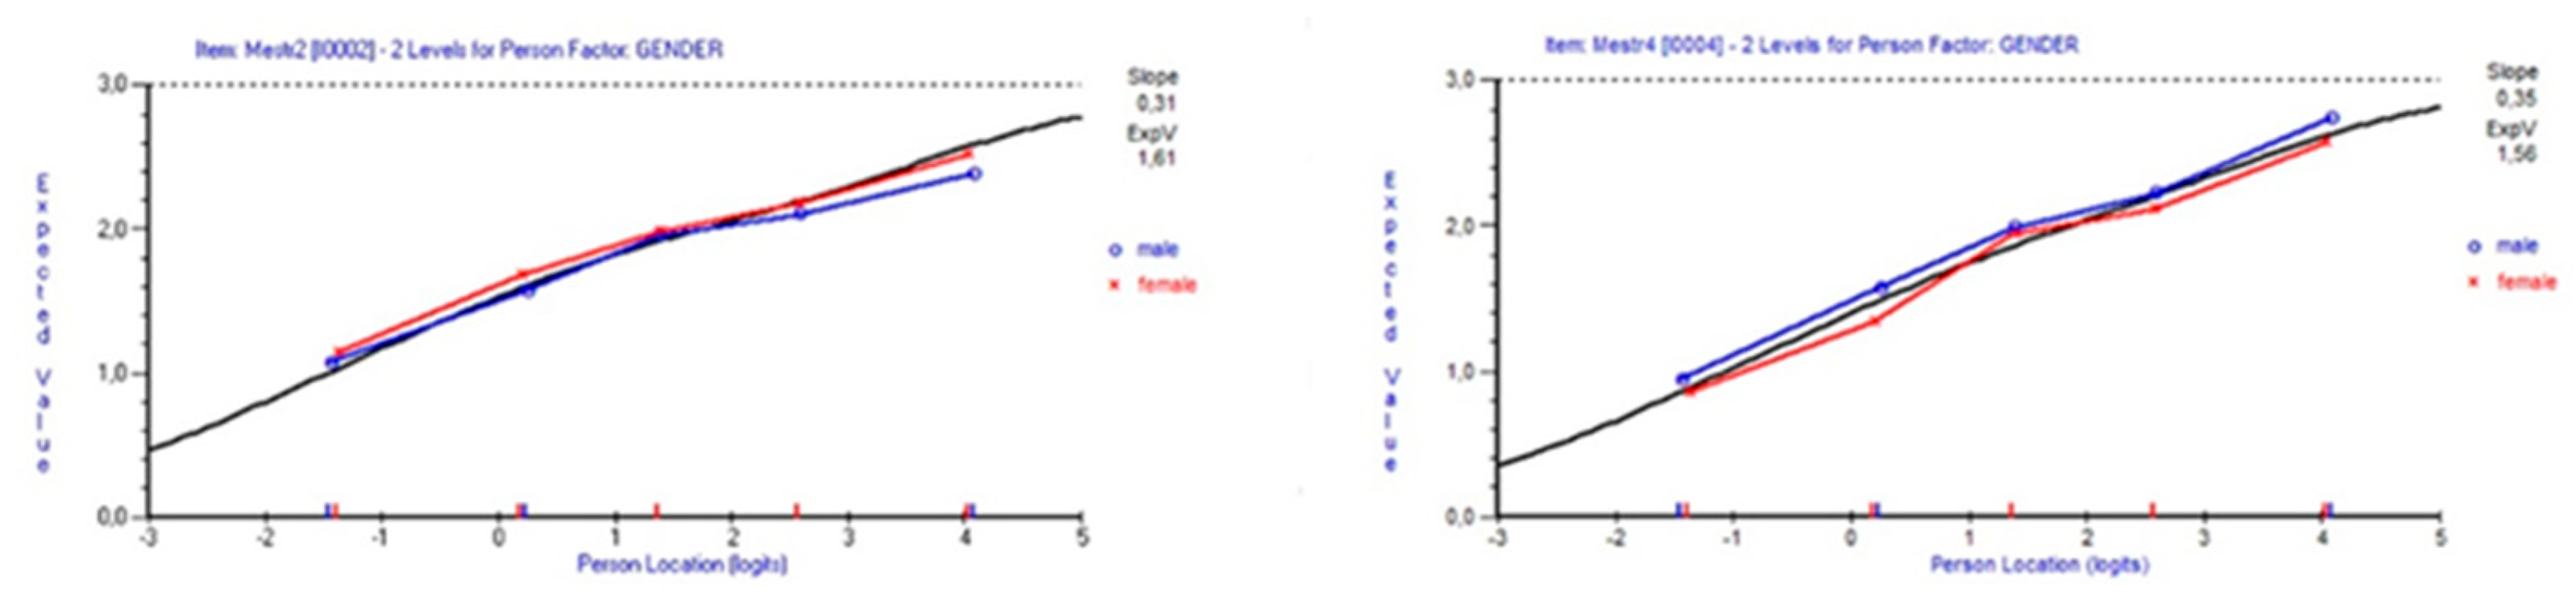
Rasch Analysis
4. Discussion
5. Conclusions
Author Contributions
Funding
Institutional Review Board Statement
Informed Consent Statement
Data Availability Statement
Acknowledgments
Conflicts of Interest
References
- Morton, M.H.; Montgomery, P. Youth empowerment programs for improving adolescents’ self-efficacy and self-esteem: A systematic review. Res. Soc. Work Pract. 2013, 23, 22–33. [Google Scholar] [CrossRef]
- Sawyer, S.M.; Afifi, R.A.; Bearinger, L.H.; Blakemore, S.-J.; Dick, B.; Ezeh, A.C.; Patton, G.C. Adolescence: A foundation for future health. Lancet 2012, 379, 1630–1640. [Google Scholar] [CrossRef]
- Antonovsky, A. Health, Stress, and Coping; Jossey-Bass: San Francisco, CA, USA, 1979. [Google Scholar]
- Bandura, A. Self-efficacy: Toward a unifying theory of behavioral change. Psychol. Rev. 1977, 84, 191. [Google Scholar] [CrossRef] [PubMed]
- Bandura, A. Adolescent development from an agentic perspective. In Self-Efficacy Beliefs of adolescents; Pajares, F., Urdan, T., Eds.; Information Age Publishing: Greenwich, CT, USA, 2006; Volume 5, pp. 1–43. [Google Scholar]
- Mikkelsen, H.T.; Haraldstad, K.; Helseth, S.; Skarstein, S.; Småstuen, M.C.; Rohde, G. Health-related quality of life is strongly associated with self-efficacy, self-esteem, loneliness, and stress in 14–15-year-old adolescents: A cross-sectional study. Health Qual. Life Outcomes 2020, 18, 352. [Google Scholar] [CrossRef]
- Jerusalem, M.; Hessling, J.K. Mental health promotion in schools by strengthening self-efficacy. Health Educ. 2009, 109, 329–341. [Google Scholar] [CrossRef]
- Feltz, D.L.; Magyar, T.M. Self-efficacy and adolescents in sport and physical activity. In Self-Efficacy Beliefs of Adolescents; Pajares, F., Urdan, T., Eds.; Information Age Publishing: Greenwich, CT, USA, 2006; Volume 4, pp. 161–179. [Google Scholar]
- Schwarzer, R.; Luszczynska, A. Self-efficacy, adolescents’ risk-taking behaviors, and health. In Self-Efficacy Beliefs of Adolescents; Pajares, F., Urdan, T., Eds.; Information Age Publishing: Greenwich, CT, USA, 2006; Volume 5, pp. 39–159. [Google Scholar]
- Moksnes, U.K.; Eilertsen, M.E.B.; Ringdal, R.; Bjørnsen, H.N.; Rannestad, T. Life satisfaction in association with self-efficacy and stressor experience in adolescents–self-efficacy as a potential moderator. Scand. J. Caring Sci. 2019, 33, 222–230. [Google Scholar] [CrossRef]
- Haraldstad, K.; Stea, T.H. Associations between pain, self-efficacy, sleep duration, and symptoms of depression in adolescents: A cross-sectional survey. BMC Public Health 2021, 21, 1617. [Google Scholar]
- Dennis, C.L.; Faux, S. Development and psychometric testing of the breastfeeding self-efficacy scale. Res. Nurs. Health 1999, 22, 399–409. [Google Scholar] [CrossRef]
- Bandura, A. Guide for constructing self-efficacy scales. In Self-Efficacy Beliefs of Adolescents; Pajares, F., Urdan, T., Eds.; Information Age Publishing: Greenwich, CT, USA, 2006; Volume 5, pp. 307–337. [Google Scholar]
- Sherer, M.; Maddux, J.E.; Mercandante, B.; Prentice-Dunn, S.; Jacobs, B.; Rogers, R.W. The self-efficacy scale: Construction and validation. Psychol. Rep. 1982, 51, 663–671. [Google Scholar] [CrossRef]
- Schwarzer, R.; Jerusalem, M. Generalized self efficacy scale. In Measures in Health Psychology: A User’s Portfolio. Causal and Control Beliefs of Adolecents; Weinman, J., Wright, S., Johnston, M., Eds.; Information Age Publishing: Greenwich, UK, 1995; pp. 139–159. [Google Scholar]
- Löve, J.; Moore, C.D.; Hensing, G. Validation of the Swedish translation of the general self-efficacy scale. Qual. Life Res. 2012, 21, 1249–1253. [Google Scholar] [CrossRef]
- Tambs, K.; Røysamb, E. Selection of questions to short-form versions of original psychometric instruments in MoBa. 2014, 24, 195–201. Nor. Epidemiol. 2014, 24, 195–201. [Google Scholar]
- Lazić, M.; Jovanović, V.; Gavrilov-Jerković, V. The general self-efficacy scale: New evidence of structural validity, measurement invariance, and predictive properties in relationship to subjective well-being in Serbian samples. Curr. Psychol. 2021, 40, 699–710. [Google Scholar] [CrossRef]
- Bonsaksen, T.; Kottorp, A.; Gay, C.; Fagermoen, M.S.; Lerdal, A. Rasch analysis of the General Self-Efficacy Scale in a sample of persons with morbid obesity. Health Qual. Life Outcomes 2013, 11, 1–11. [Google Scholar] [CrossRef] [PubMed] [Green Version]
- Lönnfjord, V.; Hagquist, C. The psychometric properties of the Swedish version of the general self-efficacy scale: A Rasch analysis based on adolescent data. Curr. Psychol. 2018, 37, 703–715. [Google Scholar] [CrossRef] [Green Version]
- NOVA. Ungdata. Available online: http://www.ungdata.no/English (accessed on 11 February 2019).
- Masters, G.N. A Rasch model for partial credit scoring. Psychometrika 1982, 47, 149–174. [Google Scholar] [CrossRef]
- Rasch, G. Probabilistic Models for Some Intelligence and Attainment Tests; Expanded Edition (1980) with Foreword and Afterword; MESA Press: Chicago, IL, USA; Danish Institute for Educational Research: Copenhagen, Denmark, 1960. [Google Scholar]
- Hagquist, C.; Bruce, M.; Gustavsson, J.P. Using the Rasch model in nursing research: An introduction and illustrative example. Int. J. Nurs. Stud. 2009, 46, 380–393. [Google Scholar] [CrossRef]
- Marais, I.; Andrich, D. Formalizing dimension and response violations of local independence. J. Appl. Meas. 2008, 9, 200–215. [Google Scholar]
- Hagell, P. Testing rating scale unidimensionality using the principal component analysis (PCA)/t-test protocol with the Rasch model: The primacy of theory over statistics. Open J. Stat. 2014, 4, 456–465. [Google Scholar] [CrossRef] [Green Version]
- Smith, E.V., Jr. Understanding Rasch measurement: Detecting and evaluating the impact of multidimensionality using item fit statistics and principal component analysis of residuals. J. Appl. Meas. 2002, 3, 205–231. [Google Scholar]
- Tennant, A.; Conaghan, P.G. The Rasch measurement model in rheumatology: What is it and why use it? When should it be applied, and what should one look for in a Rasch paper? Arthritis Care Res. 2007, 57, 1358–1362. [Google Scholar] [CrossRef]
- Andrich, D.; Marais, I. A Course in Rasch Measurement Theory. Measuring in the Educational, Social and Health Sciences; Springer: Singapore, 2019. [Google Scholar]
- Lantz, B. The large sample size fallacy. Scand. J. Caring Sci. 2013, 27, 487–492. [Google Scholar] [CrossRef] [PubMed]
- Bergh, D. Chi-Squared Test of Fit and Sample Size-A Comparison between a Random Sample Approach and a Chi-Square Value Adjustment Method. J. Appl. Meas. 2015, 16, 204–217. [Google Scholar]
- Hagquist, C.; Andrich, D. Is the Sense of Coherence-instrument applicable on adolescents? A latent trait analysis using Rasch-modelling. Personal. Individ. Differ. 2004, 36, 955–968. [Google Scholar] [CrossRef]
- Andrich, D.; Sheridan, B. RUMM2030Plus; Rumm Laboratory Pty Ltd.: Perth, Australia, 2019. [Google Scholar]
- Masters, G.N. Item discrimination: When more is worse. J. Educ. Meas. 1988, 25, 15–29. [Google Scholar] [CrossRef]
- Preston, C.C.; Colman, A.M. Optimal number of response categories in rating scales: Reliability, validity, discriminating power, and respondent preferences. Acta Psychol. Amst. 2000, 104, 1–15. [Google Scholar] [CrossRef] [Green Version]
- Polit, D.F.; Beck, C.T. Nursing Research: Generating and Assessing Evidence for Nursing Practice; Lippincott Williams & Wilkins: Philadelphia, PA, USA, 2008. [Google Scholar]


| Characteristic | n (%) |
|---|---|
| Gender | |
| Male | 3017 (48) |
| Female | 3201 (51) |
| Missing | 47 (1) |
| Education | |
| Lower secondary school | 2159 (35) |
| Grade 8 | 626 (29) |
| Grade 9 | 746 (35) |
| Grade 10 | 654 (30) |
| Missing | 133 (6) |
| Upper secondary school | 4106 (66) |
| Year 1 | 1649 (40) |
| Year 2 | 1404 (34) |
| Year 3 | 1047 (26) |
| Missing | 6 (0) |
| Total Sample | Lower Secondary School | Upper Secondary School | |||||||||||
|---|---|---|---|---|---|---|---|---|---|---|---|---|---|
| Item | Label | Loc. | Fit Resid. | χ2 | Prob. * | Loc. | Fit Resid. | χ2 | Prob. * | Loc. | Fit Resid. | χ2 | Prob. * |
| 1 | I always manage to solve difficult problems if I try hard enough. | −0.340 | 0.359 | 147.047 | <0.001 | −0.349 | −0.919 | 57.863 | <0.001 | −0.336 | 1.105 | 89.723 | <0.001 |
| 2 | If someone opposes me, I can find the means and ways to get what I want. | 0.261 | 3.242 | 115.717 | <0.001 | 0.291 | 3.594 | 46.927 | <0.001 | 0.240 | 1.230 | 92.762 | <0.001 |
| 3 | I am confident that I could deal efficiently with unexpected events. | −0.039 | −14.648 | 141.073 | <0.001 | −0.010 | −6.320 | 42.311 | <0.001 | −0.058 | −13.701 | 96.426 | <0.001 |
| 4 | I can remain calm when facing difficulties because I can rely on my coping abilities. | 0.464 | −7.792 | 85.278 | <0.001 | 0.398 | −2.930 | 20.711 | 0.001 | 0.506 | −7.568 | 67.049 | <0.001 |
| 5 | If I am in trouble, I can usually think of a solution. | −0.347 | −10.918 | 104.567 | <0.001 | −0.331 | −4.889 | 25.708 | <0.001 | −0.352 | −10.037 | 67.694 | <0.001 |
Publisher’s Note: MDPI stays neutral with regard to jurisdictional claims in published maps and institutional affiliations. |
© 2022 by the authors. Licensee MDPI, Basel, Switzerland. This article is an open access article distributed under the terms and conditions of the Creative Commons Attribution (CC BY) license (https://creativecommons.org/licenses/by/4.0/).
Share and Cite
Steigen, A.M.; Finbråten, H.S.; Kleppang, A.L. Using Rasch Analysis to Assess the Psychometric Properties of a Five-Item Version of the General Self-Efficacy Scale in Adolescents. Int. J. Environ. Res. Public Health 2022, 19, 3082. https://doi.org/10.3390/ijerph19053082
Steigen AM, Finbråten HS, Kleppang AL. Using Rasch Analysis to Assess the Psychometric Properties of a Five-Item Version of the General Self-Efficacy Scale in Adolescents. International Journal of Environmental Research and Public Health. 2022; 19(5):3082. https://doi.org/10.3390/ijerph19053082
Chicago/Turabian StyleSteigen, Anne Mari, Hanne Søberg Finbråten, and Annette Løvheim Kleppang. 2022. "Using Rasch Analysis to Assess the Psychometric Properties of a Five-Item Version of the General Self-Efficacy Scale in Adolescents" International Journal of Environmental Research and Public Health 19, no. 5: 3082. https://doi.org/10.3390/ijerph19053082
APA StyleSteigen, A. M., Finbråten, H. S., & Kleppang, A. L. (2022). Using Rasch Analysis to Assess the Psychometric Properties of a Five-Item Version of the General Self-Efficacy Scale in Adolescents. International Journal of Environmental Research and Public Health, 19(5), 3082. https://doi.org/10.3390/ijerph19053082