
Can the Economic Value Added Be Used as the Universal Financial Metric?


Abstract
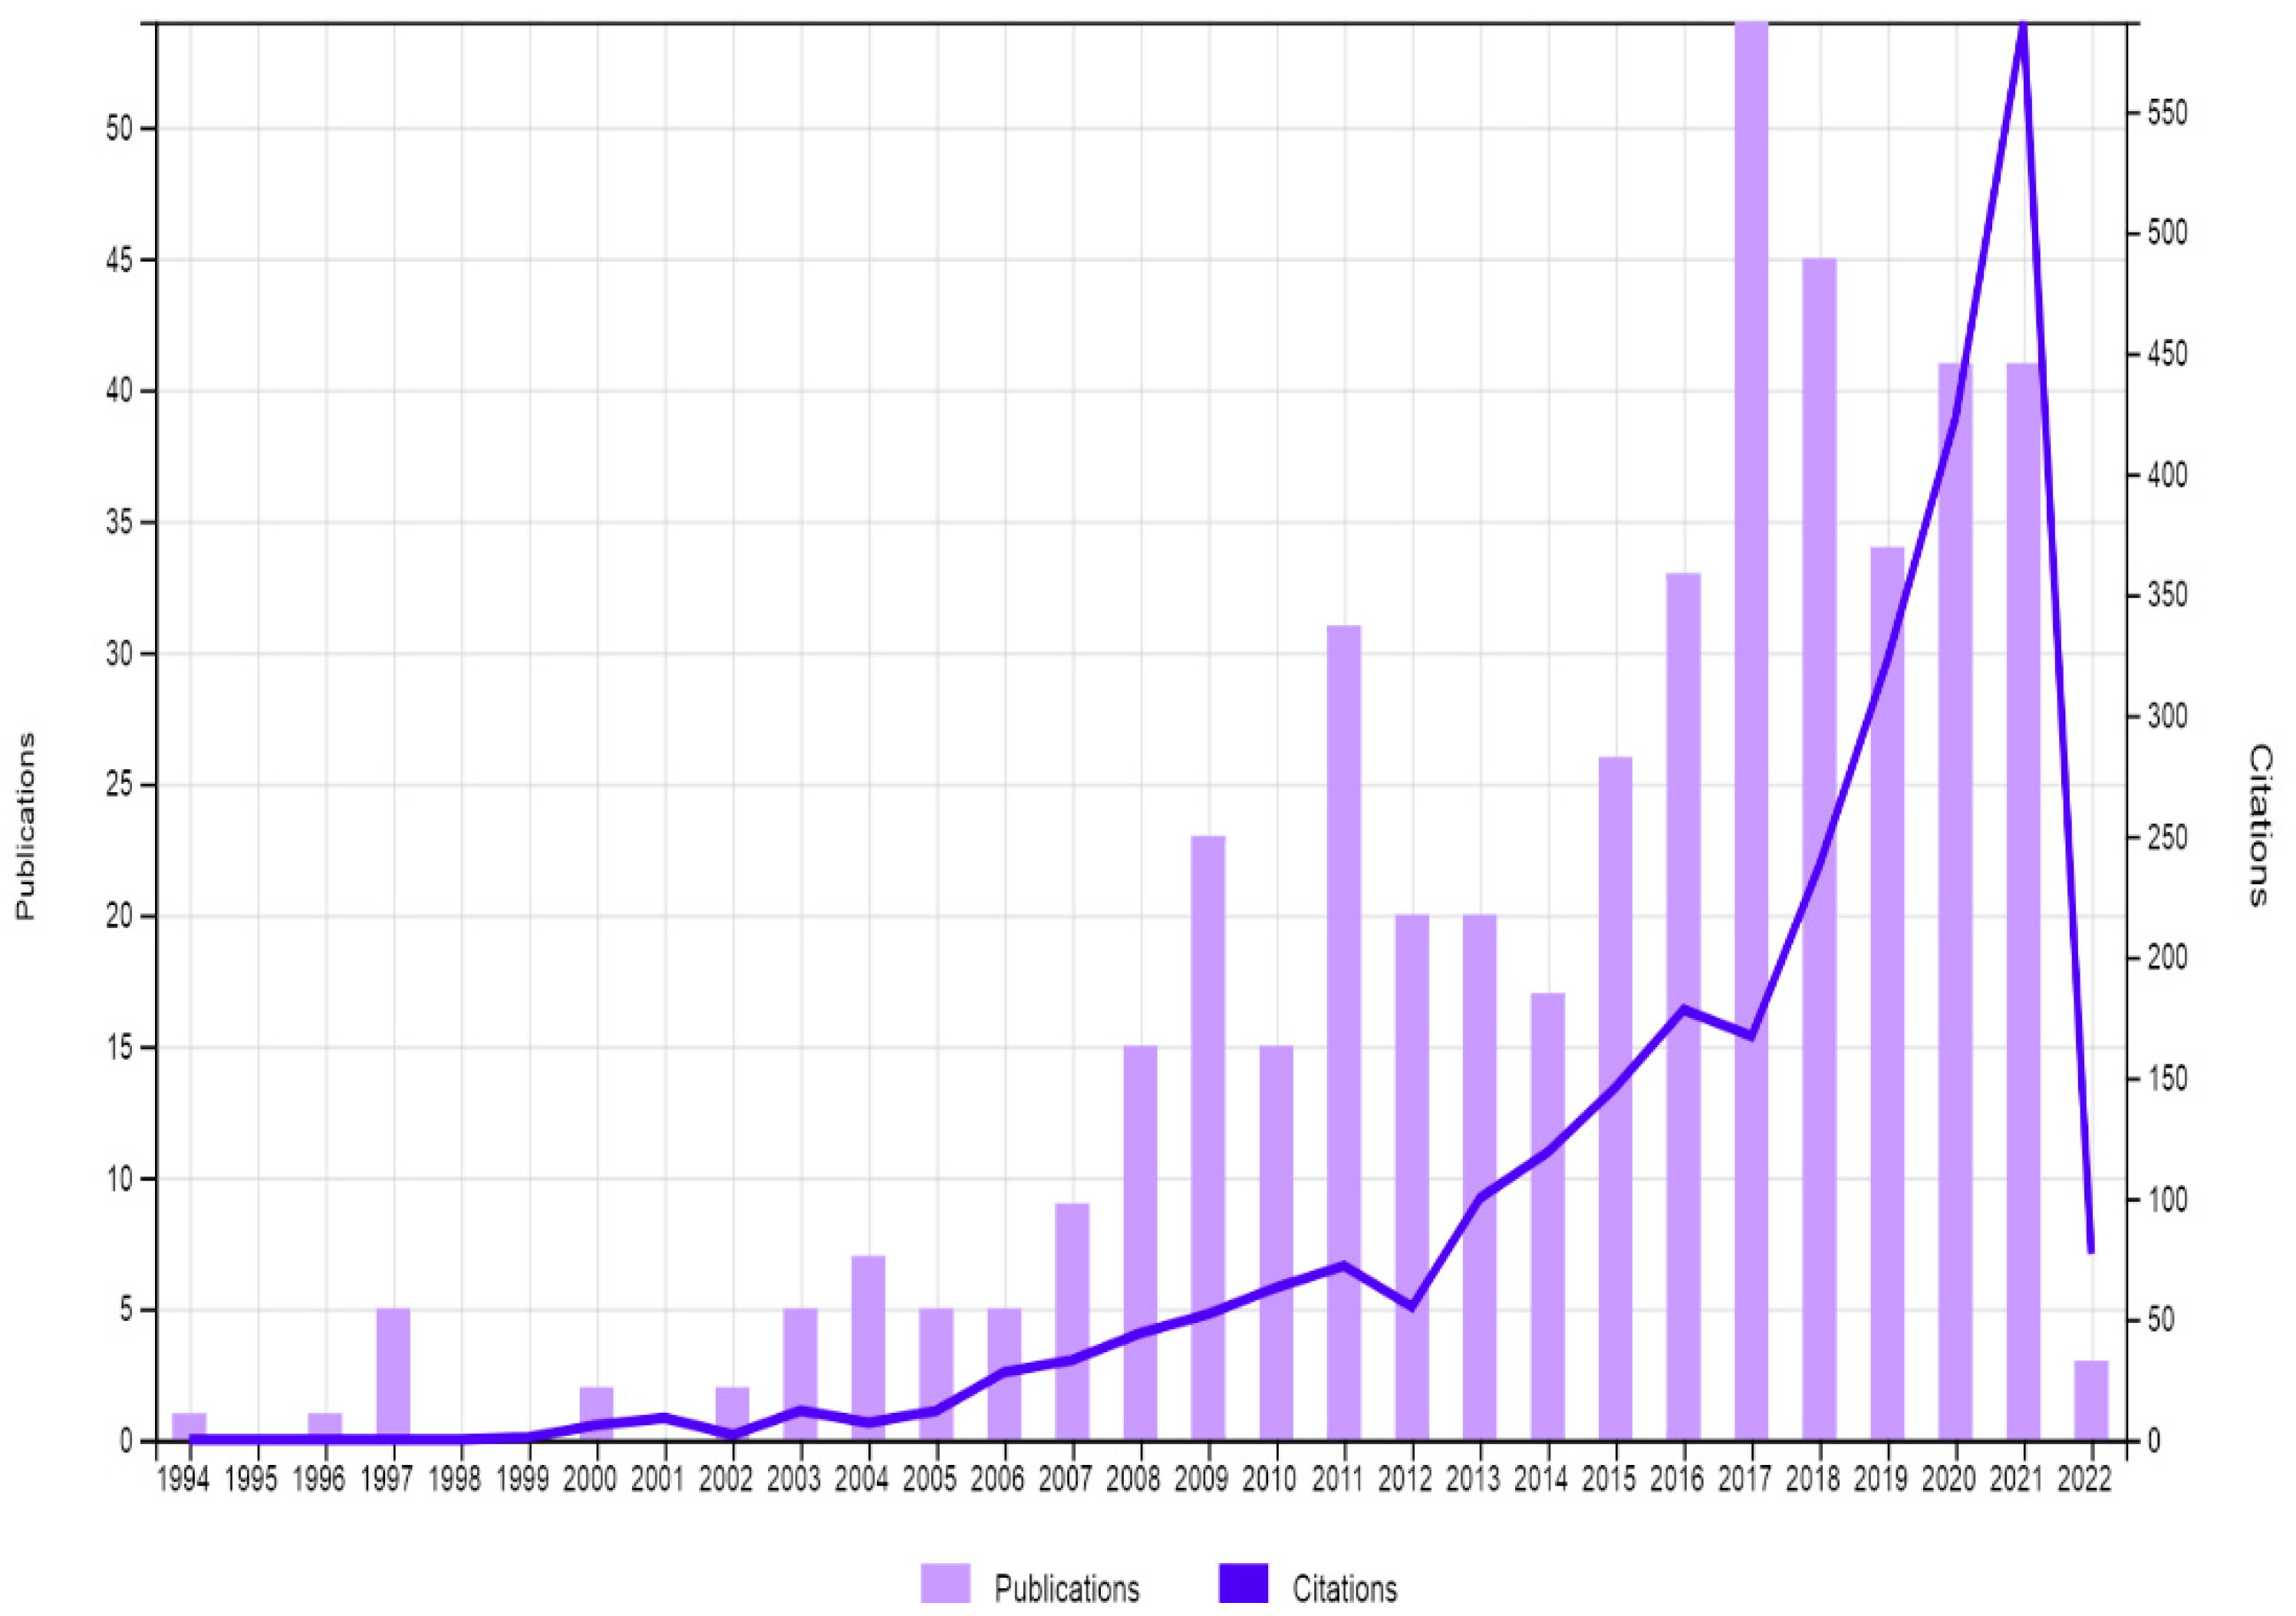
:1. Introduction
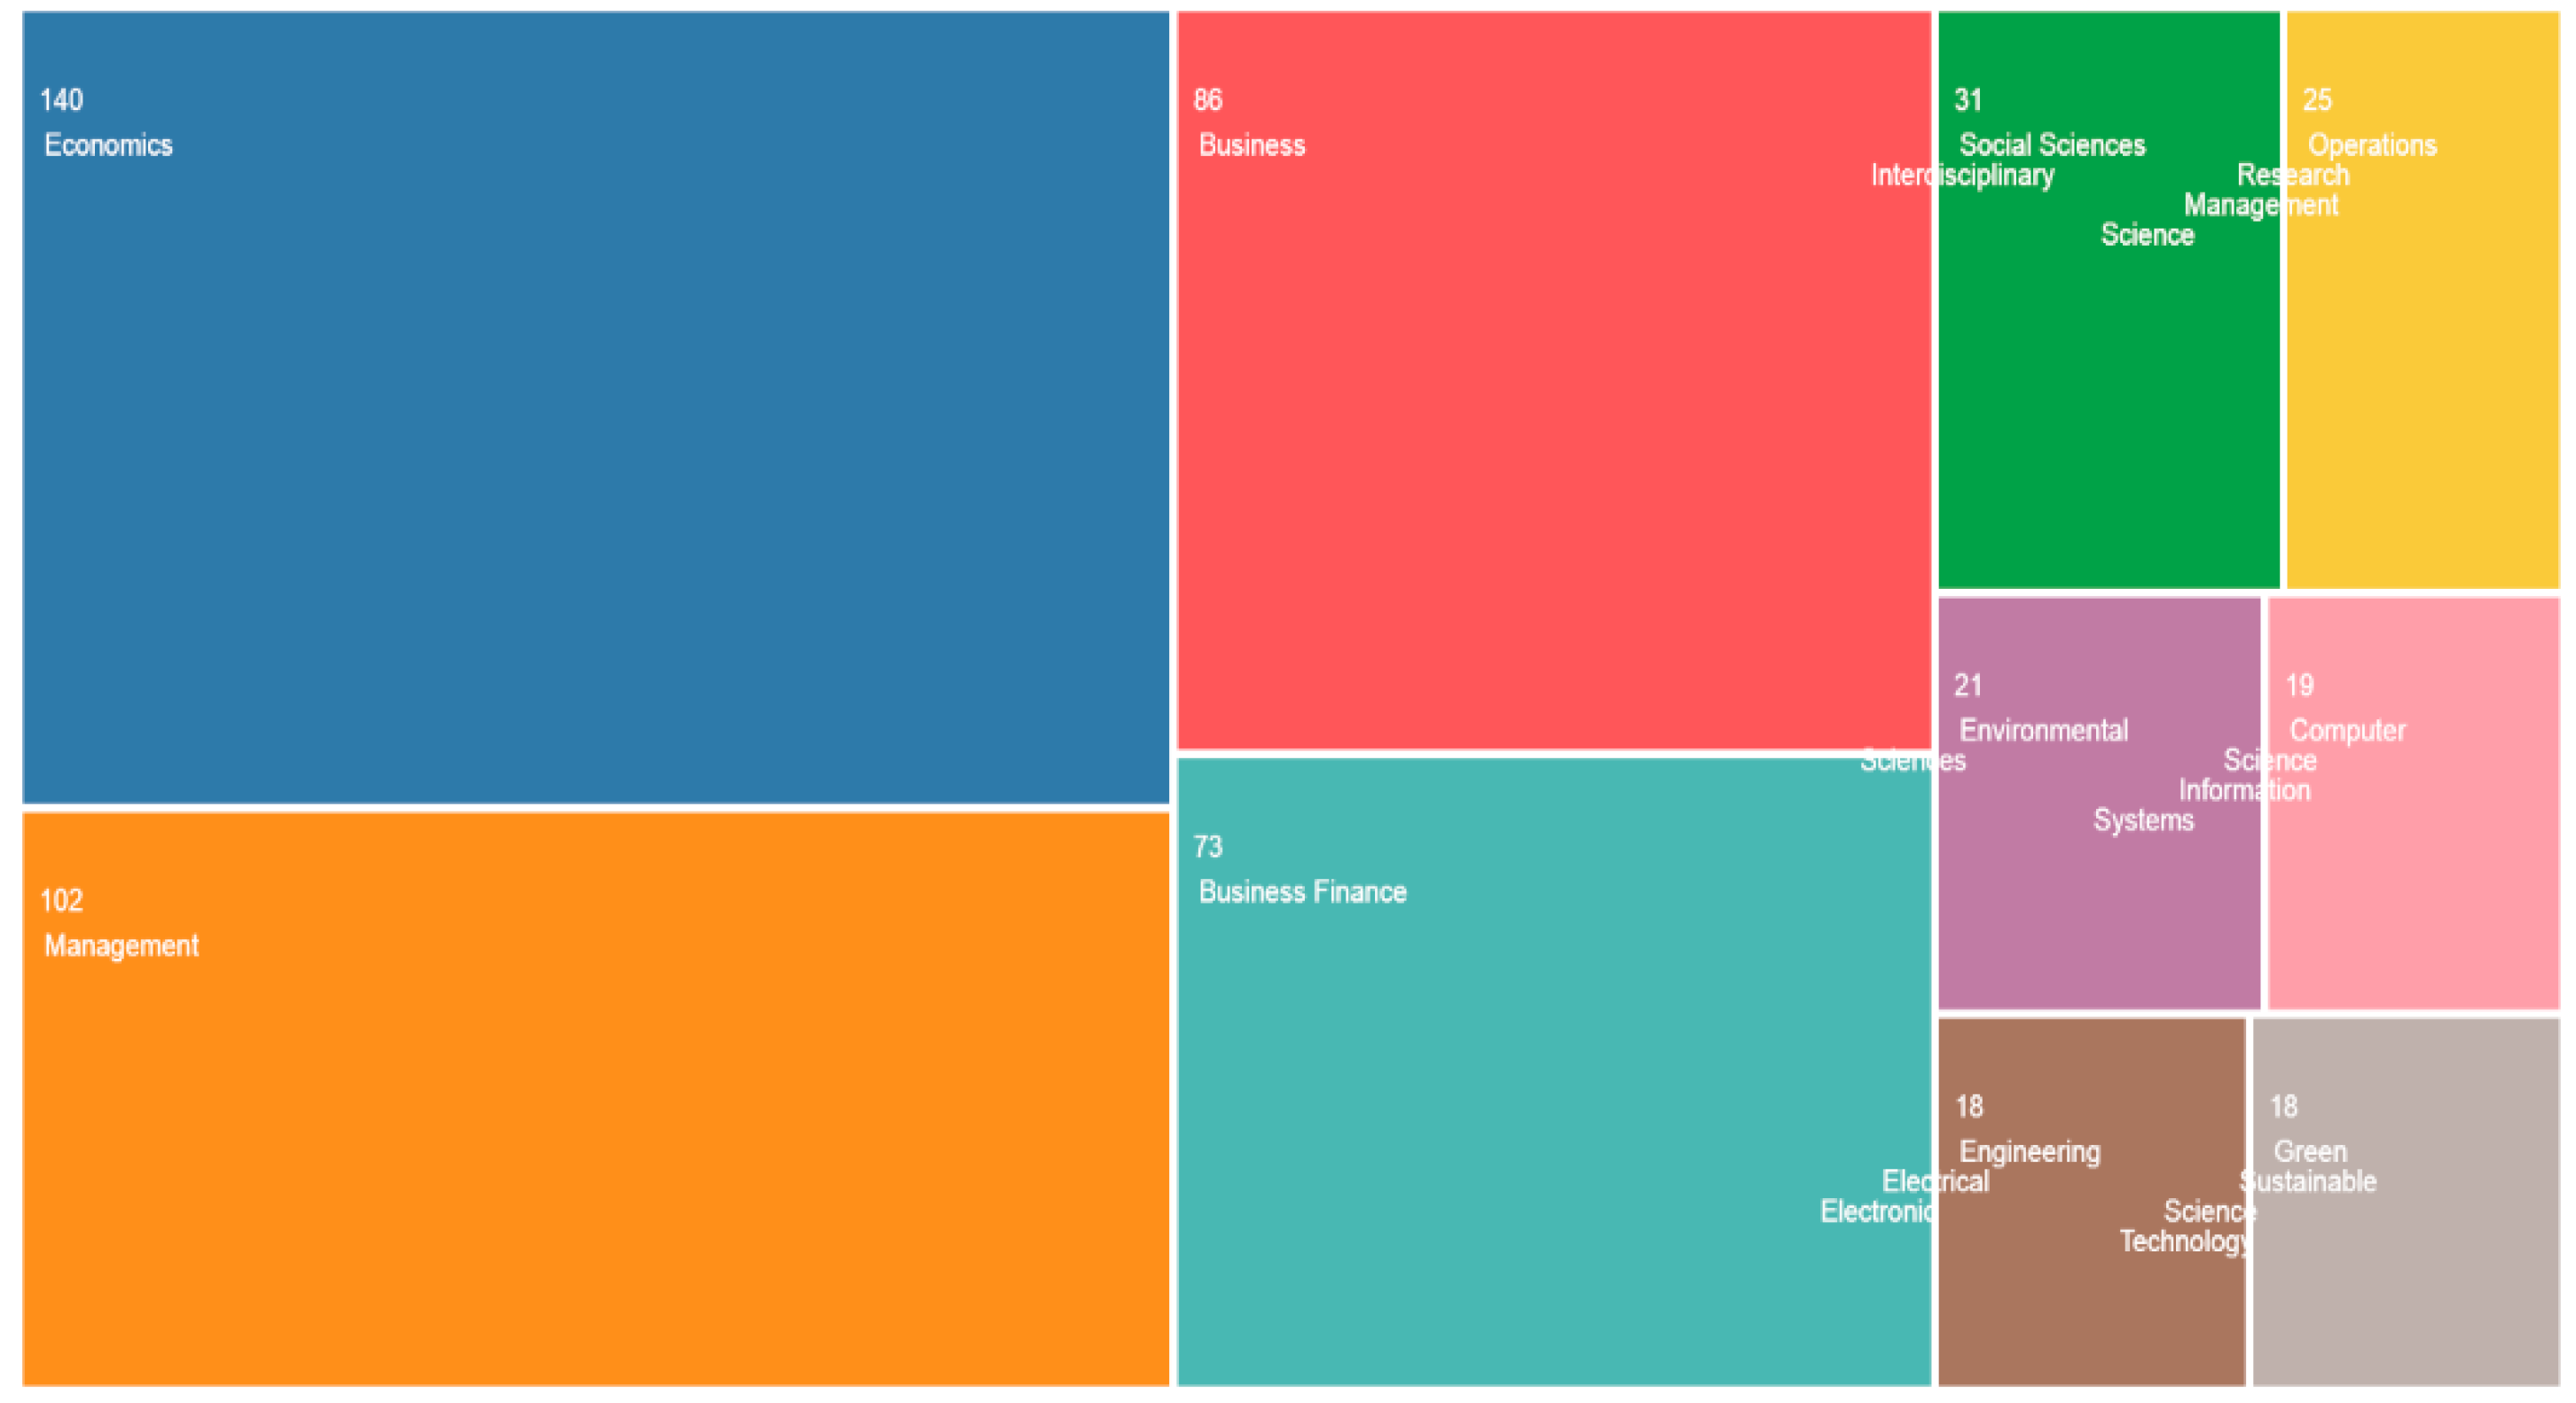
2. Literature Review
3. Materials and Methods
4. Results and Discussion
- -
- Managers who make their business decisions in the energy sector based on the EVA firmness algorithm are subject to a high risk of non-objective calculation;
- -
- In the case of business decisions, there is a high risk that a financially poor energy project will be chosen in the event of frequent and significant changes in interest rates;
- -
- Persistent medium- and long-term interest rate fluctuations expose energy investors to subjective assessments of investment projects;
- -
- There may be a negative interaction between discount rates and cash flow in the implementation of energy projects.
5. Conclusions
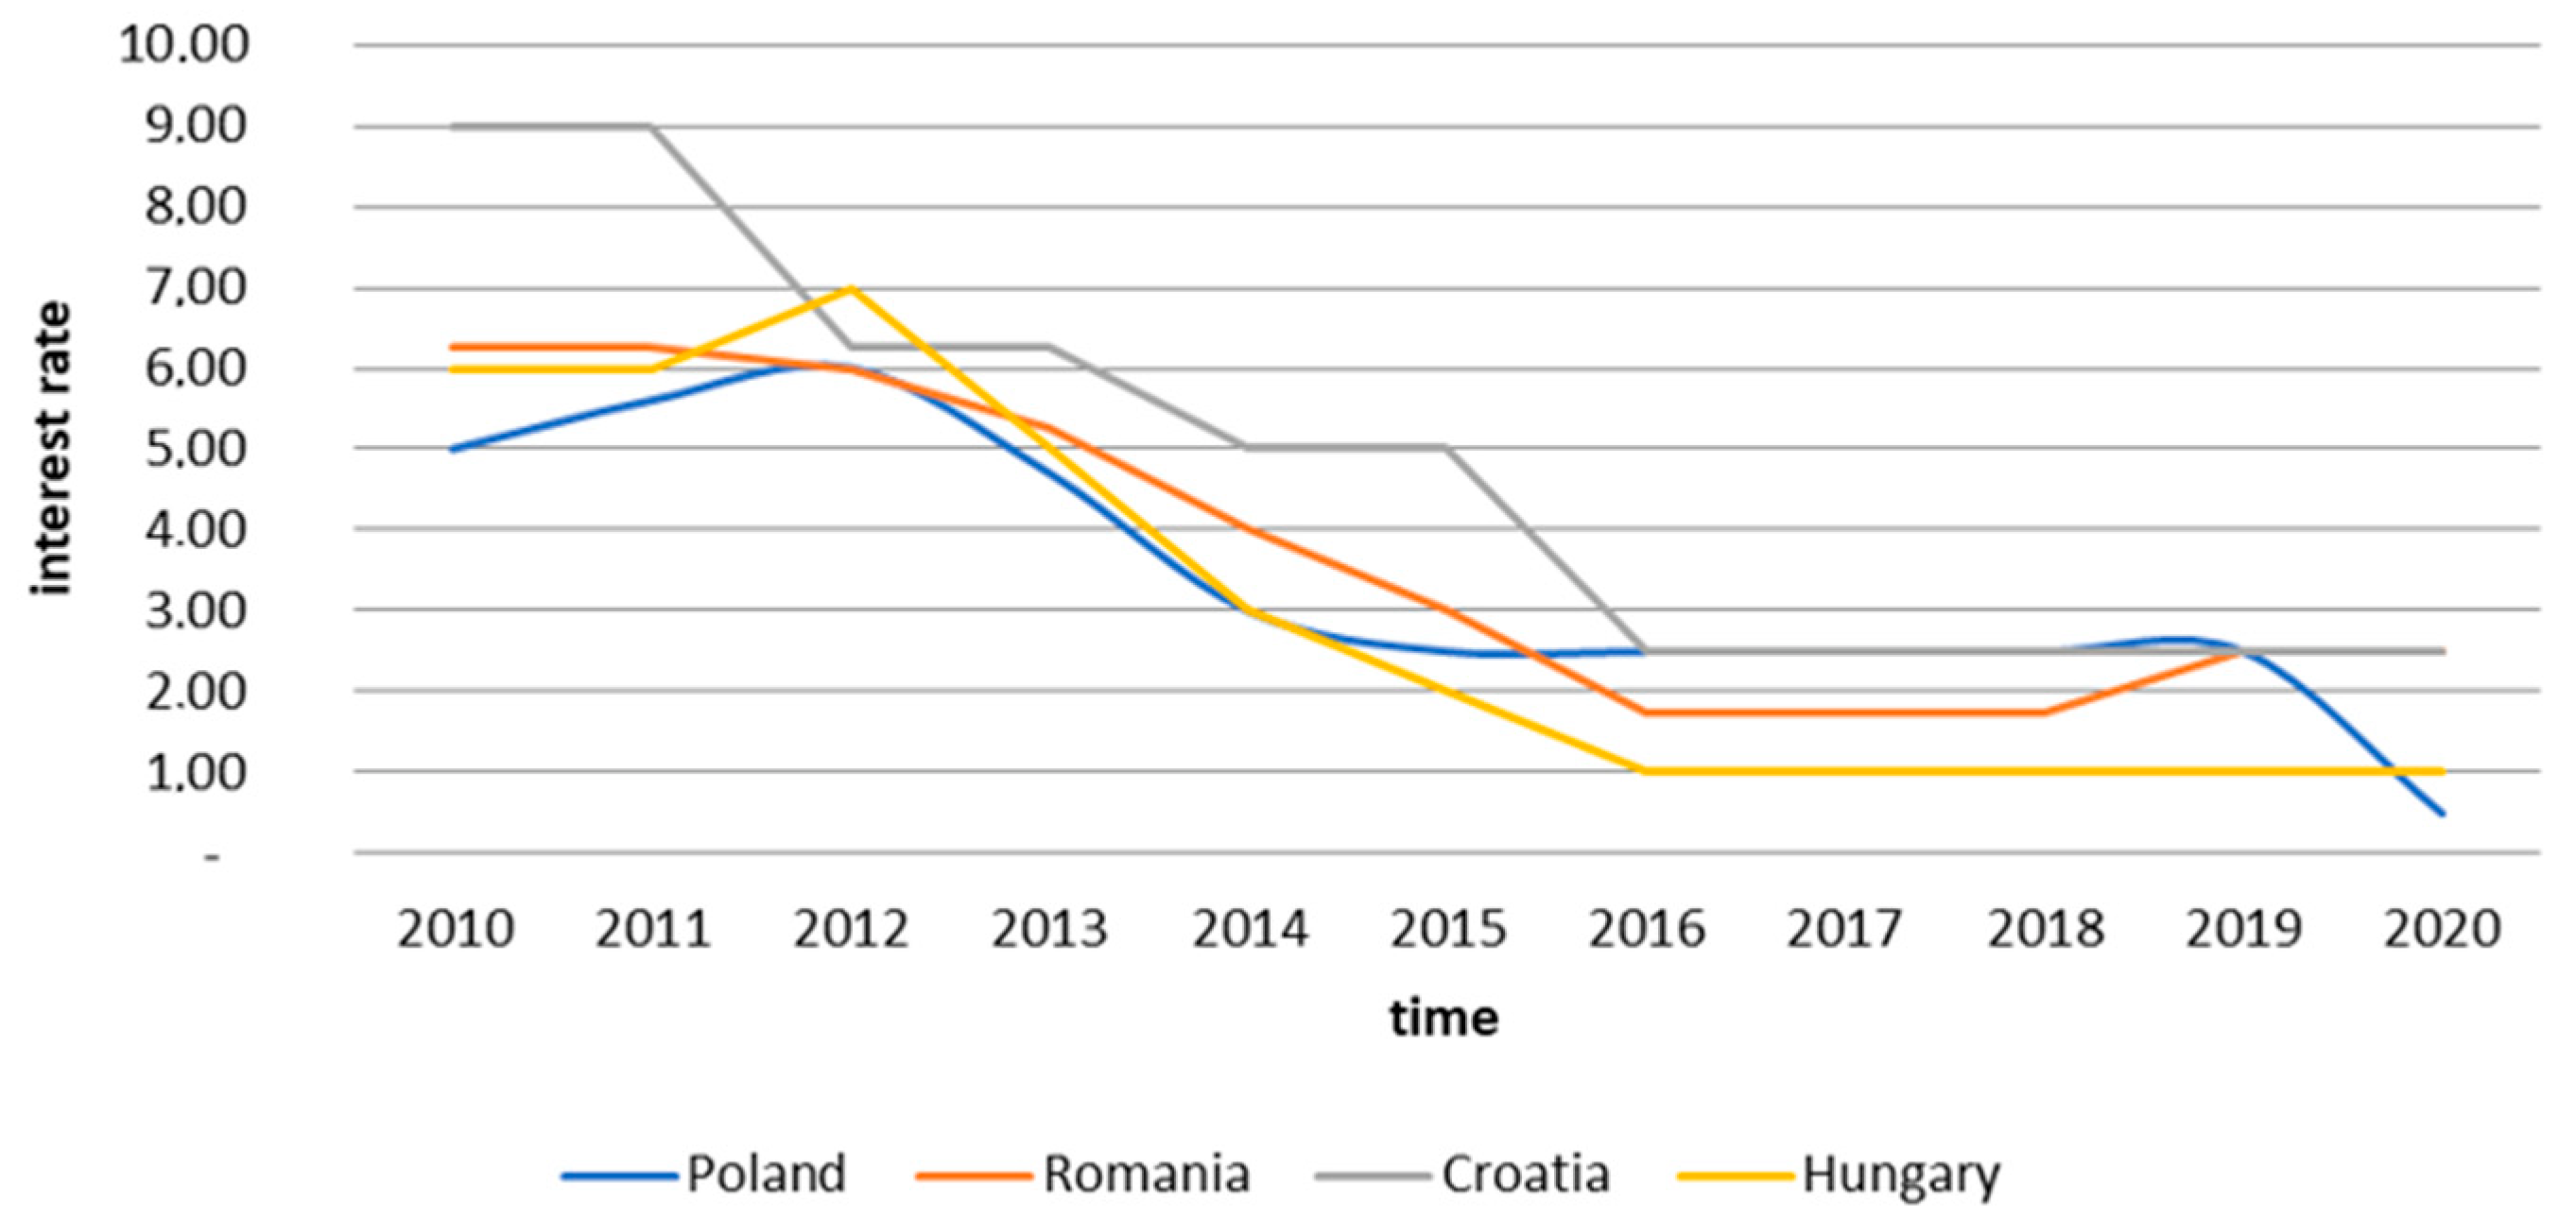
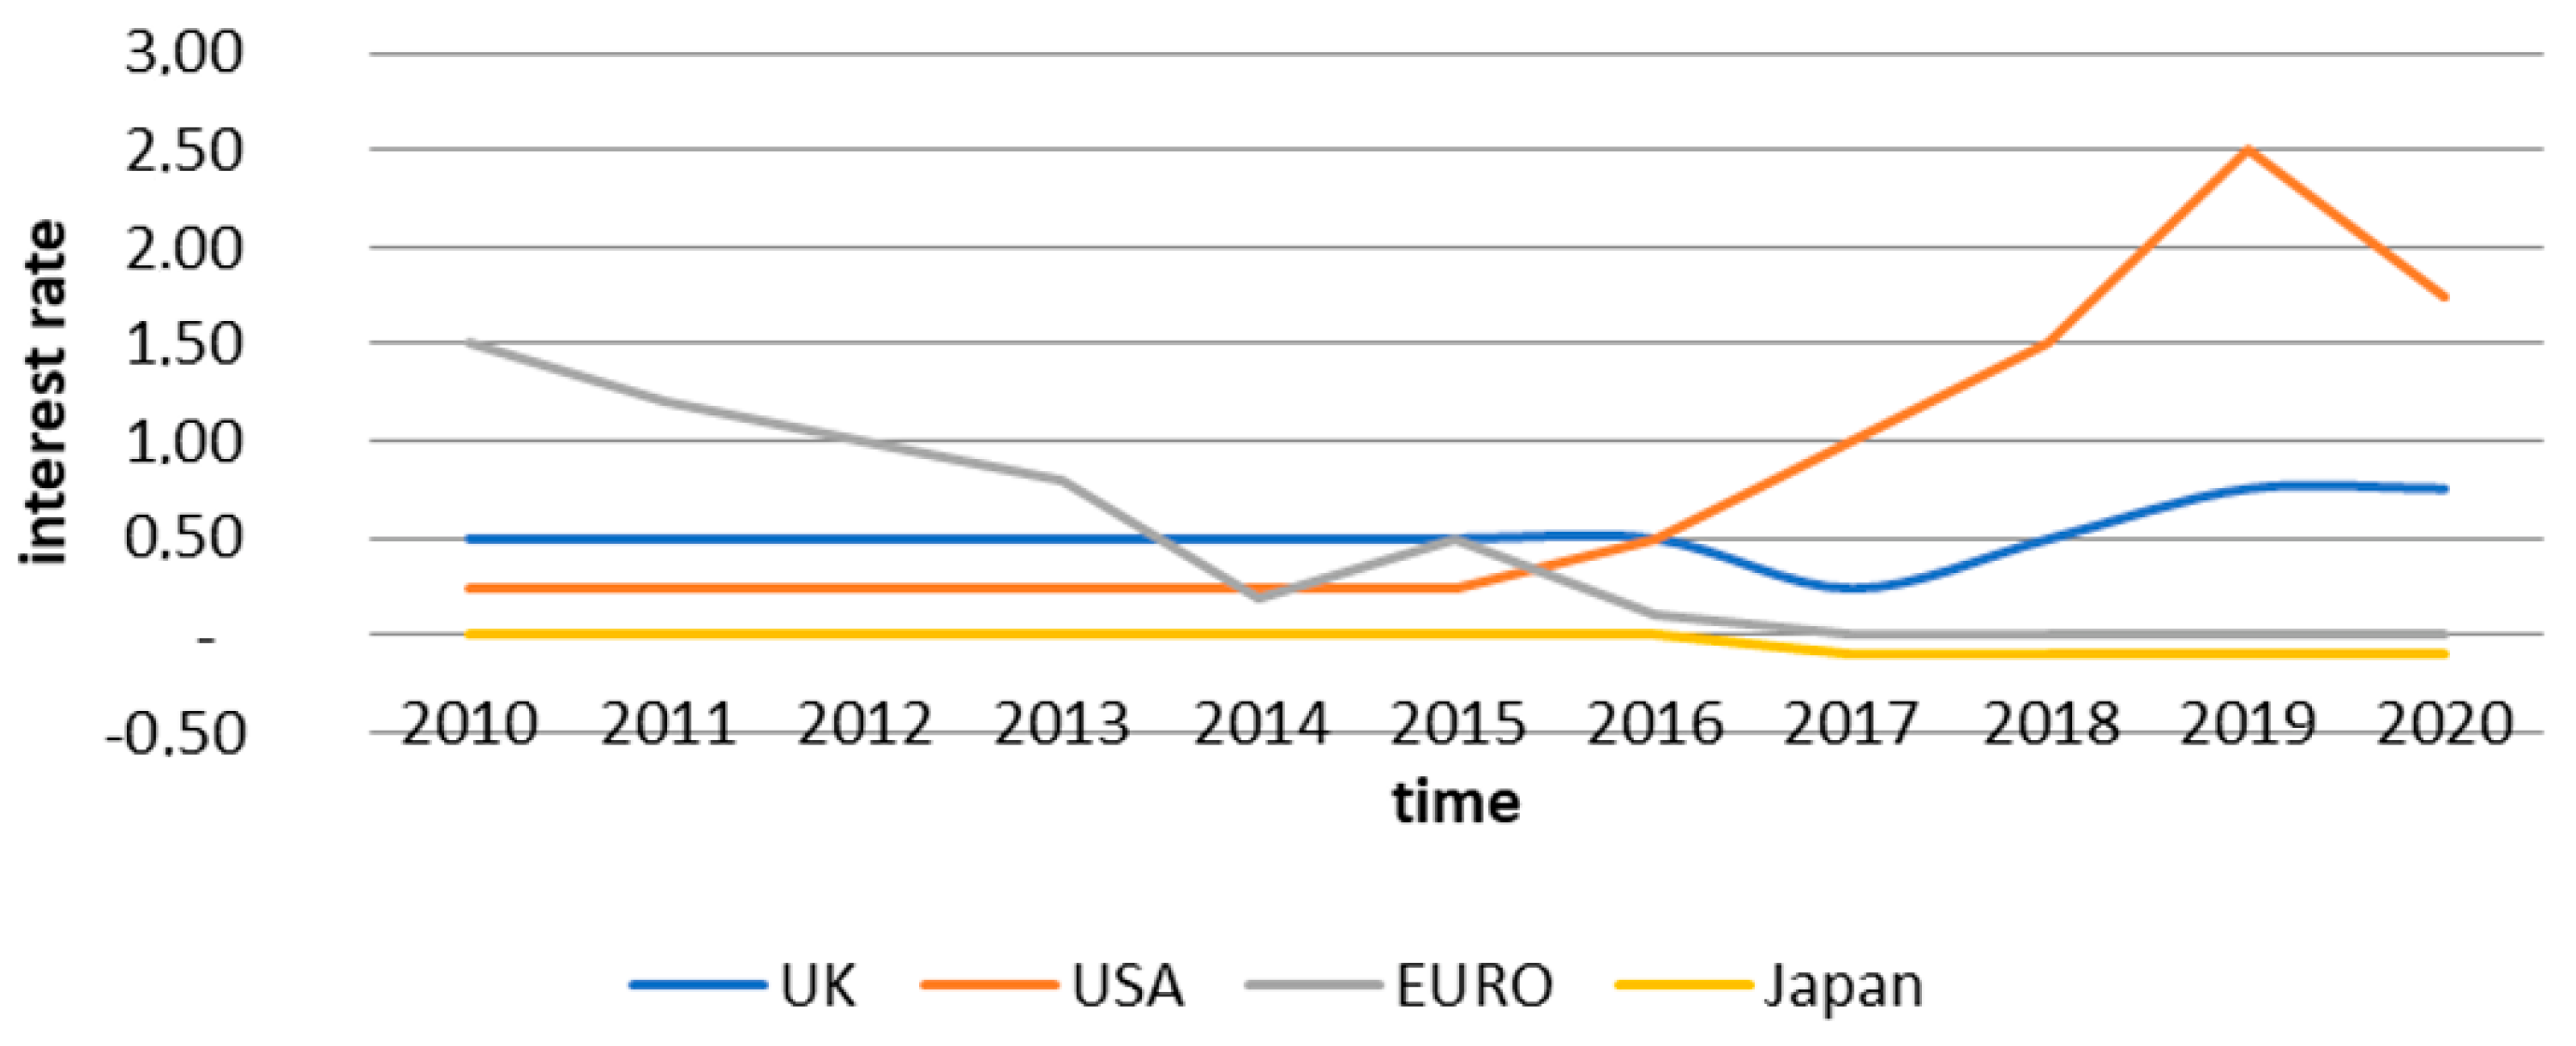
- The fluctuating monetary value over time influences investment decisions in the energy sector in both a stabilised and non-stabilised economy. However, in an unstable economy, this process is particularly important as the interest rate cannot be estimated over time.
- The variable monetary value over time has a significant impact on the investment account of energy projects. This is due to the time difference between the time of the decision to invest in the energy market and the achievement of the impact.
- With high and variable interest rates, even for short periods, the variable time value of money has a significant influence on the objectivity of the calculation of energy projects.
- In the context of enterprise projects in the energy market, the issue of the dynamic estimation of capital allocation effects should be discussed in more detail in the literature. The factors that determine the magnitude of the calculated investment effects of the energy market at the time of decision making are often difficult to predict. Thus, the issue of fluctuations in the conditions that determine the achievement of the objectives of the investment projects at the time of the business decisions is subject to significant risks.
- The expected outcome of business decisions in the energy market should be objective. If the decision data are unreliable (with too much uncertainty), it is a subjective statement that cannot be used as a basis for the decision.
- The traditional EVA algorithm is based on the concept of a flat profitability curve. In principle, this understanding of the problem can only be applied to stabilised economies.
- An immature financial market in volatile economies is no way to hedge the risk of a rise in the discount rate. Therefore, any mobilisation of public funds for the development of the energy market should serve to offset the negative effects of market or regulatory changes. This can be achieved, inter alia, by creating a system that guarantees the immutability of the basic rules of the game and reduces the risks for investors in the energy market.
Author Contributions
Funding
Institutional Review Board Statement
Informed Consent Statement
Data Availability Statement
Conflicts of Interest
References
- Copeland, T.; Koller, T.; Murrin, J. Valuation: Measuring and Managing the Value of Companies, 3rd ed.; Wiley & Sons: New York, NY, USA, 2000; pp. 1–492. [Google Scholar]
- Black, A.; Wright, P.; Davis, J. In Search of Shareholder Value: Managing the Drivers of Performance, 2nd ed.; Financial Times Management: London, UK, 2000; pp. 1–366. [Google Scholar]
- Haspeslagh, P.; Noda, T.; Boulos, F. Managing for value. It’s not just about the numbers. Harv. Bus. Rev. 2001, 79, 64–73. [Google Scholar] [PubMed]
- Young, S.D.; O’Byrne, S.F. EVA and Value-Based Management. A Practical Guide to Implementation; McGraw-Hill: New York, NY, USA, 2000; pp. 1–493. [Google Scholar]
- Andrei, J.V.; Panait, M.; Voica, C. Implication of the CSR and cultural model features in Romanian energy sector. Industrija 2014, 4, 115–131. [Google Scholar] [CrossRef] [Green Version]
- Khan, S.A.R.; Yu, Z.; Panait, M.; Janjua, L.R.; Shah, A. (Eds.) Global Corporate Social Responsibility Initiatives for Reluctant Businesses; IGI Global: Hershey, PA, USA, 2021; pp. 1–300. [Google Scholar]
- Pätäri, S.; Arminen, H.; Tuppura, A.; Jantunen, A. Competitive and responsible? The relationship between corporate social and financial performance in the energy sector. Renew. Sustain. Energy Rev. 2014, 37, 142–154. [Google Scholar] [CrossRef]
- Gigauri, I. Corporate Social Responsibility and COVID-19 Pandemic Crisis: Evidence From Georgia. Int. J. Sustain. Entrep. Corp. Soc. Responsib. (IJSECSR) 2021, 6, 30–47. [Google Scholar] [CrossRef]
- Vollero, A.; Siano, A.; Palazzo, M.; Elving, W. Corporate Communication and CSR; comparing Italian and Dutch energy companies on anti-greenwashing strategies. In Proceedings of the CSR Communication Conference 2011: The 1st International CSR Communication Conference, Amsterdam, The Netherlands, 26–28 October 2011. [Google Scholar]
- Palazzo, M.; Vollero, A.; Foroudi, P.; Siano, A. Evaluating constitutive dimensions of CSR e-communication: A comparison between ‘Business-To-Business’ and ‘Close-To-Market’ companies. J. Bus. Bus. Mark. 2019, 26, 341–355. [Google Scholar] [CrossRef]
- Pennings, J. The Relevance of the Structural-Contingency Model for Organizational Effectiveness. Adm. Sci. Q. 1975, 20, 393–410. [Google Scholar] [CrossRef]
- Gordon, L.; Miller, A.D. A contingency framework for the design of accounting information systems. Account. Organ. Soc. 1976, 1, 59–69. [Google Scholar] [CrossRef]
- Hayes, D.C. The contingency theory of managerial accounting. Account. Rev. 1997, 52, 22–39. [Google Scholar]
- Waterhouse, J.H.; Tiessen, P. A contingency framework for management accounting systems research. Account. Organ. Soc. 1978, 3, 65–76. [Google Scholar] [CrossRef]
- Druică, E.; Goschin, Z.; Ianole-Călin, R. Energy poverty and life satisfaction: Structural mechanisms and their implications. Energies 2019, 12, 3988. [Google Scholar] [CrossRef] [Green Version]
- Neacsa, A.; Panait, M.; Muresan, J.D.; Voica, M.C. Energy poverty in European Union: Assessment difficulties, effects on the quality of life, mitigation measures. some evidences from Romania. Sustainability 2020, 12, 4036. [Google Scholar] [CrossRef]
- Dobrowolski, Z. Energy and Local Safety: How the Administration Limits Energy Security. Energies 2021, 14, 4841. [Google Scholar] [CrossRef]
- Dobrowolski, Z. Internet of Things and Other E-Solutions in Supply Chain Management May Generate Threats in the Energy Sector—The Quest for Preventive Measures. Energies 2021, 14, 5381. [Google Scholar] [CrossRef]
- Milojević, M.; Urbański, M.; Terzić, I.; Prasolov, V. Impact of Non-Financial Factors on the Effectiveness of Audits in Energy Companies. Energies 2020, 13, 6212. [Google Scholar] [CrossRef]
- Zhao, C.; Guo, Y.; Yuan, J.; Wu, M.; Li, D.; Zhou, Y.; Kang, J. ESG and corporate financial performance: Empirical evidence from China’s listed power generation companies. Sustainability 2018, 10, 2607. [Google Scholar] [CrossRef] [Green Version]
- Jiang, Y.; Xue, X.; Xue, W. Proactive corporate environmental responsibility and financial performance: Evidence from Chinese energy enterprises. Sustainability 2018, 10, 964. [Google Scholar] [CrossRef] [Green Version]
- Kludacz-Alessandri, M.; Cygańska, M. Corporate Social Responsibility and Financial Performance among Energy Sector Companies. Energies 2021, 14, 6068. [Google Scholar] [CrossRef]
- Lee, S. Environmental responsibility, CEO power and financial performance in the energy sector. Rev. Manag. Sci. 2021, 15, 2407–2426. [Google Scholar] [CrossRef]
- Sharma, A.K.; Kumar, S. Economic value added (EVA)-literature review and relevant issues. Int. J. Econ. Financ. 2010, 2, 200–220. [Google Scholar] [CrossRef]
- Ittner, C.D.; Larcker, D.F. Assessing empirical research in managerial accounting: A value-based management perspective. J. Account. Econ. 2001, 32, 349–410. [Google Scholar] [CrossRef] [Green Version]
- Anthony, R.N. Planning and Control Systems: A Framework for Analysis; Division of Research, Graduate School of Business Administration; Harvard Business School: Boston, MA, USA, 1965; pp. 1–180. [Google Scholar]
- Pal, K.; Sura, J. Economic value added and traditional performance measures: A review of academic and empirical literature. Amity J. Bus. Strategy 2007, 1, 110–120. [Google Scholar]
- Worthington, A.C.; West, T. Economic Value-Added: A Review of the Theoretical and Empirical Literature. Asian Rev. Account. 2001, 9, 67–86. [Google Scholar] [CrossRef] [Green Version]
- Stewart, G.B. The Quest for Value; Harper Collins Publishers: New York, NY, USA, 1991; pp. 1–800. [Google Scholar]
- Subedi, M.; Farazmand, A. Economic Value Added (EVA) for Performance Evaluation of Public Organizations. Public Organ. Rev. 2020, 20, 613–630. [Google Scholar] [CrossRef]
- Du, F.; Erkens, D.H.; Young, S.M.; Tang, G. How adopting new performance measures affects subjective performance evaluations: Evidence from EVA adoption by Chinese State-Owned Enterprises. Account. Rev. 2018, 93, 161–185. [Google Scholar] [CrossRef]
- Al Shishany, A.; Al-Omush, A.; Guermat, C. The impact of economic value added (EVA) adoption on stock performance. Accounting 2020, 6, 687–704. [Google Scholar] [CrossRef]
- Jankalová, M.; Kurotová, J. Sustainability Assessment Using Economic Value Added. Sustainability 2020, 12, 318. [Google Scholar] [CrossRef] [Green Version]
- Agustina, N.; Sadalia, I.; Silalahi, A.S. Relationship of Economic Value Added (EVA) and Financial Performance of PT. LC Industry Indonesia Period 2013–2017. Int. J. Res. Rev. 2020, 7, 480–485. [Google Scholar]
- Horak, J.; Suler, P.; Kollmann, J.; Marecek, J. Credit Absorption Capacity of Businesses in the Construction Sector of the Czech Republic—Analysis Based on the Difference in Values of EVA Entity and EVA Equity. Sustainability 2020, 12, 9078. [Google Scholar] [CrossRef]
- Stewart, G.B. EVA: Fact and Fantasy. J. Appl. Corp. Financ. 1994, 7, 71–84. [Google Scholar] [CrossRef]
- Stern, J.; Stewart, G.B.; Chew, D. The EVA Financial Management System. J. Appl. Corp. Financ. 1991, 8, 32–46. [Google Scholar] [CrossRef]
- Machuga, S.M.; Pfeiffer, R.J.; Verma, K. Economic Value Added, Future Accounting Earnings, and Financial Analysts’ Earnings Per Share Forecasts. Rev. Quant. Financ. Account. 2002, 18, 59–73. [Google Scholar] [CrossRef]
- Lehn, K.; Makhija, A.K. EVA, accounting profits, and CEO turnover: An empirical examination 1985–1994. J. Appl. Corp. Financ. 1997, 10, 90–96. [Google Scholar] [CrossRef]
- Bao, B.H.; Bao, D.H. Usefulness of value Added and Abnormal Economic Earnings: An Empirical examination. J. Bus. Financ. Account. 1998, 25, 251–265. [Google Scholar] [CrossRef]
- Chen, S.; Dodd, J.L. Economic Value Added (EVA): An Empirical Examination of a New Corporate Performance Measure. J. Manag. Issues 1997, 9, 318–333. [Google Scholar]
- Biddle, G.C. Economic Value Added: Some Empirical Evidence. Manag. Financ. 1998, 24, 60–70. [Google Scholar] [CrossRef]
- Biddle, G.C.; Bowen, R.M.; Wallace, J.S. Does EVA beat Earnings? Evidence on Associations with Stock Returns and Firm Values. J. Account. Econ. 1997, 24, 301–336. [Google Scholar] [CrossRef] [Green Version]
- Biddle, G.C.; Bowen, R.M.; Wallace, J.S. Evidence on EVA. J. Appl. Corp. Financ. 1999, 12, 69–79. [Google Scholar] [CrossRef] [Green Version]
- Worthington, A.C.; West, T. Australian Evidence Concerning the Information Content of Economic Value-Added. Aust. J. Manag. 2004, 29, 201–224. [Google Scholar] [CrossRef]
- Omneya, A.K.; Salah Ashraf, S.; Eldin, B.B. Is Economic Value Added Momentum (EVA Momentum) a Better Performance Measurement Tool? Evidence from Egyptian Listed Firms. Am. J. Ind. Bus. Manag. 2021, 11, 297–319. [Google Scholar] [CrossRef]
- Choong, Y.V.; Muthaiyah, S. Economic Value Added (EVA) And Market Value Added (MVA) Towards Value Creation. Turk. J. Comput. Math. Educ. 2021, 12, 6046–6050. [Google Scholar]
- Muhammed, P.S.; Khorsheed, A.O. Using Residual Income (RI) End Economic Value Added (EVA) As Modern Performance Evaluation Tools for Operating Segments. A Practical Study in Abu Dhabi National Energy Company PJSC(TAQA). J. Crit. Rev. 2020, 7, 2386–2403. [Google Scholar]
- Tudose, M.B.; Rusu, V.D.; Avasilcai, S. Performance Management for Growth: A Framework Based on EVA. J. Risk Financ. Manag. 2021, 14, 102. [Google Scholar] [CrossRef]
- Ulfah, B.A.T.; Pratama, F.F. The Influence of Earning Per Share (EPS) and Economic Value Added (EVA) on Wealth of Stock Holders at State-Own Construction Service Company Which Listed on IDX in 2014–2018 Period. J. Akunt. Audit Dan Sist. Inf. Akunt. 2021, 5, 188–200. [Google Scholar]
- Kukurba, M.; Waszkiewicz, A.E.; Salwin, M.; Kraslawski, A. Co-Created Values in Crowdfunding for Sustainable Development of Enterprises. Sustainability 2021, 13, 8767. [Google Scholar] [CrossRef]
- Rumpoko, G.A.; Gandakusuma, I. Performance Analysis of Indonesian State-Owned Enterprises in The Construction Sector Using Economic Value Added. Int. J. Bus. Technol. Manag. 2021, 3, 166–175. [Google Scholar]
- Al-Zwaini, Z.J.; Mohammed, B.H. Evaluating The Performance Of The Economic Unit Using The EVA Index. Iraqi J. Econ. Sci. 2021, 19, 141–174. [Google Scholar]
- Kuhait, A.A.; Abed, F.A.A.; Habeeb, A.; Annon, S.N. Evaluating the performance of government tourism facilities using ABC and EVA techniques/Case Study. J. Contemp. Issues Bus. Gov. 2021, 27, 285–293. [Google Scholar]
- Irala, L.R. EVA: The right measure of managerial performance. J. Account. Financ. 2005, 19, 77–87. [Google Scholar]
- Ferguson, R.; Lestikow, D. Search for the Best Financial Performance Measure: Basics Are Better. Financ. Anal. J. 1998, 54, 81–85. [Google Scholar] [CrossRef]
- Finegan, P.T.; Stewart, S. & Co. Maximizing Shareholder value at the private company. J. Appl. Corp. Financ. 1991, 4, 35–40. [Google Scholar]
- Fernandez, P. EVA, economic profit and cash value added do not measure shareholder value creation. J. Appl. Financ. 2003, 9, 74–94. [Google Scholar]
- O’Byrne, S.F. EVA and Market Value. J. Appl. Corp. Financ. 1996, 9, 116–125. [Google Scholar] [CrossRef]
- Anastassis, C.; Kyriazis, D. The Validity of the Economic Value Added Approach: An Empirical Application. Eur. Financ. Manag. 2007, 13, 71–100. [Google Scholar]
- Available online: https://www-webofscience-com.am.e-nformation.ro (accessed on 18 February 2022).
- Biancone, P.P.; Brescia, V.; Lanzalonga, F.; Alam, G.M. Using bibliometric analysis to map innovative business models for vertical farm entrepreneurs. Br. Food J. 2022. [Google Scholar] [CrossRef]
- Paul, J.; Lim, W.M.; O’Cass, A.; Hao, A.W.; Bresciani, S. Scientific procedures and rationales for systematic literature reviews (SPAR-4-SLR). Int. J. Consum. Stud. 2021, 45, O1–O16. [Google Scholar] [CrossRef]
- Directive 2005/89/EC of the European Parliament and of the Council of 18 January 2006, on Measures to Ensure the Safety of Electricity Supply and Infrastructure Investments (Journal of EU L 33, 04/02/2006, p. 22, Repealed on 4 July 2019). Available online: https://eur-lex.europa.eu/legal-content/EN/ALL/?uri=celex%3A32005L0089 (accessed on 11 August 2021).
- Ustawa z Dnia 10 Kwietnia 1997 r. Prawo Energetyczne (Dz. U. z 2021 r., poz. 716 ze zm.) [Act of 10 April 10 1997 Energy Law (Journal of Laws of 2021, Item 716 with Amendments)]. Available online: https://isap.sejm.gov.pl/isap.nsf/download.xsp/WDU20210001093/O/D20211093.pdf (accessed on 11 August 2021).
- Kobayashi, T.; Okatani, S.; Mori Hamada & Matsumoto. Electricity Regulation in Japan: Overview. Thomson Reuters Canada. Practical Law. Law Stated as at 01-Sep-2020. Available online: https://ca.practicallaw.thomsonreuters.com/5-630-3729?transitionType=Default&contextData=(sc.Default) (accessed on 29 August 2021).
- Rozporządzenie Ministra Energii z Dnia 15 Grudnia 2016 r. w Sprawie Przeprowadzania Kontroli Przez Przedsiębiorstwa Energetyczne (Dz. U., poz. 2166) [Regulation of the Minister of Energy of 15 December 2016. on the Performance of Audits by Energy Enterprises (Journal of Laws, Item 2166)]. Available online: https://isap.sejm.gov.pl/isap.nsf/DocDetails.xsp?id=WDU20160002166 (accessed on 11 August 2021).
- Nordqvist, M.; Gartner, W.B. Literature, fiction, and the family business. Fam. Bus. Rev. 2020, 33, 122–129. [Google Scholar] [CrossRef]
- Thomae, H. The Nomothetic-Idiographic Issue: Some Roots and Recent Trends. Int. J. Group Tens. 1999, 28, 187–215. [Google Scholar] [CrossRef]
- NBP. 2021. Podstawowe Stopy Procentowe NBP w Latach 1998–2020. Available online: www.nbp.pl/home.aspx?f=/dzienne/stopy_archiwum.htm (accessed on 23 August 2021).
- Japan Interest Rate. 2021. Available online: www.tradingeconomics.com/japan/interest-rate (accessed on 12 March 2021).
- United Kingdom Interest Rate. 2021. Available online: www.tradingeconomics.com/united-kingdom/interest-rate (accessed on 4 March 2021).
- Romania Interest Rate. 2021. Available online: https://tradingeconomics.com/romania/interest-rate (accessed on 6 August 2021).
- Euro Area Interest Rate. 2021. Available online: www.tradingeconomics.com/euro-area/interest-rate (accessed on 11 August 2021).
- The United States Fed Funds Rate. 2021. Available online: www.https://tradingeconomics.com/united-states/interest-rate (accessed on 10 March 2021).
- Hungary Interest Rate. 2021. Available online: www.tradingeconomics.com/hungary/interest-rate (accessed on 3 July 2021).
- Croatia Overnight Credit Rate. 2021. Available online: www.tradingeconomics.com/croatia/interest-rate (accessed on 21 July 2021).
- Harris, M.; Raviv, A. The Theory of Capital Structure. J. Financ. 1991, 46, 297–355. [Google Scholar] [CrossRef]
- Myers, S.C. Outside Equity. J. Financ. 2000, 55, 1005–1037. [Google Scholar] [CrossRef]
- Rajan, R.G.; Zingales, L. What Do We Know about Capital Structure? Some Evidence from International Data. J. Financ. 1995, 50, 1421–1460. [Google Scholar] [CrossRef]
- Graham, J.R. How Big Are the Tax Benefits of Debt? J. Financ. 2000, 55, 1901–1941. [Google Scholar] [CrossRef]
- Friedman, M. A Friedman Doctrine: The Social Responsibility of Business Is to Increase Its Profit; The New York Times Magazine: New York, NY, USA, 1970; Available online: https://www.nytimes.com/1970/09/13/archives/a-friedman-doctrine-the-social-responsibility-of-business-is-to.html (accessed on 24 July 2021).
- Rappaport, A. Creating Shareholder Value: A Guide For Managers And Investors; Simon & Schuster: New York, NY, USA, 1998; pp. 1–224. [Google Scholar]
- Modigliani, F.; Miller, M.H. The Cost of Capital, Corporate Finance, and the Theory of Investment. Am. Econ. Rev. 1958, 48, 261–297. [Google Scholar]
- Scott, J.H., Jr. A Theory of Optimal Capital Structure. Bell J. Econ. 1976, 7, 33–54. [Google Scholar] [CrossRef]
- Titman, S.; Wessels, R. The Determinants of Capital Structure Choice. J. Financ. 1988, 43, 119. [Google Scholar] [CrossRef]
- Rayan, K. Financial Leverage and Firm Value; University of Pretoria: Pretoria, South Africa, 2008; Available online: https://repository.up.ac.za/bitstream/handle/2263/23237/dissertation.pdf?sequence=1 (accessed on 6 February 2021).
- Myers, S.C. Capital structure. J. Econ. Perspect. 2001, 15, 81–102. [Google Scholar] [CrossRef] [Green Version]
- Faulkender, M.; Petersen, M.A. Does the Source of Capital Affect Capital Structure? Rev. Financ. Stud. 2006, 19, 45–79. [Google Scholar] [CrossRef] [Green Version]
- Baker, M.; Wurgler, J. Market Timing and Capital Structure. J. Financ. 2020, 57, 1–32. [Google Scholar] [CrossRef]
- Campbell, C.T.; Galpin, N.; Johnson, S.A. Optimal inside debt compensation and the value of equity and debt. J. Financ. Econ. 2016, 119, 336–352. [Google Scholar] [CrossRef]
- Fülöp, M.T.; Szora Tamas, A.; Ivan, O.R.; Solovãstru, A.N. Regressive model regarding the necessary profit margin forecast for a new project in the constructions field. Econ. Comput. Econ. Cybern. Stud. Res. 2020, 2, 181–198. [Google Scholar]
- Drozdowski, G. Economic Calculus Qua an Instrument to Support Sustainable Development under Increasing Risk. J. Risk Financ. Manag. 2021, 14, 15. [Google Scholar] [CrossRef]
- Dobrowolski, Z.; Drozdowski, G. Does the Net Present Value as a Financial Metric Fit Investment in Green Energy Security? Energies 2022, 15, 353. [Google Scholar] [CrossRef]
- Dobrowolski, Z.; Sułkowski, Ł. Business Model Canvas and Energy Enterprises. Energies 2021, 14, 7198. [Google Scholar] [CrossRef]
- de Bem Machado, A.; Secinaro, S.; Calandra, D.; Lanzalonga, F. Knowledge management and digital transformation for Industry 4.0: A structured literature review. Knowl. Manag. Res. Pract. 2021, 1–19. [Google Scholar] [CrossRef]


Publisher’s Note: MDPI stays neutral with regard to jurisdictional claims in published maps and institutional affiliations. |
© 2022 by the authors. Licensee MDPI, Basel, Switzerland. This article is an open access article distributed under the terms and conditions of the Creative Commons Attribution (CC BY) license (https://creativecommons.org/licenses/by/4.0/).
Share and Cite
Dobrowolski, Z.; Drozdowski, G.; Panait, M.; Babczuk, A. Can the Economic Value Added Be Used as the Universal Financial Metric? Sustainability 2022, 14, 2967. https://doi.org/10.3390/su14052967
Dobrowolski Z, Drozdowski G, Panait M, Babczuk A. Can the Economic Value Added Be Used as the Universal Financial Metric? Sustainability. 2022; 14(5):2967. https://doi.org/10.3390/su14052967
Chicago/Turabian StyleDobrowolski, Zbysław, Grzegorz Drozdowski, Mirela Panait, and Arkadiusz Babczuk. 2022. "Can the Economic Value Added Be Used as the Universal Financial Metric?" Sustainability 14, no. 5: 2967. https://doi.org/10.3390/su14052967
APA StyleDobrowolski, Z., Drozdowski, G., Panait, M., & Babczuk, A. (2022). Can the Economic Value Added Be Used as the Universal Financial Metric? Sustainability, 14(5), 2967. https://doi.org/10.3390/su14052967