
Assessing Land Cover Transformation for Urban Environmental Sustainability through Satellite Sensing

 ,
,  ,
,  and
and 
Abstract
1. Introduction
2. Methods
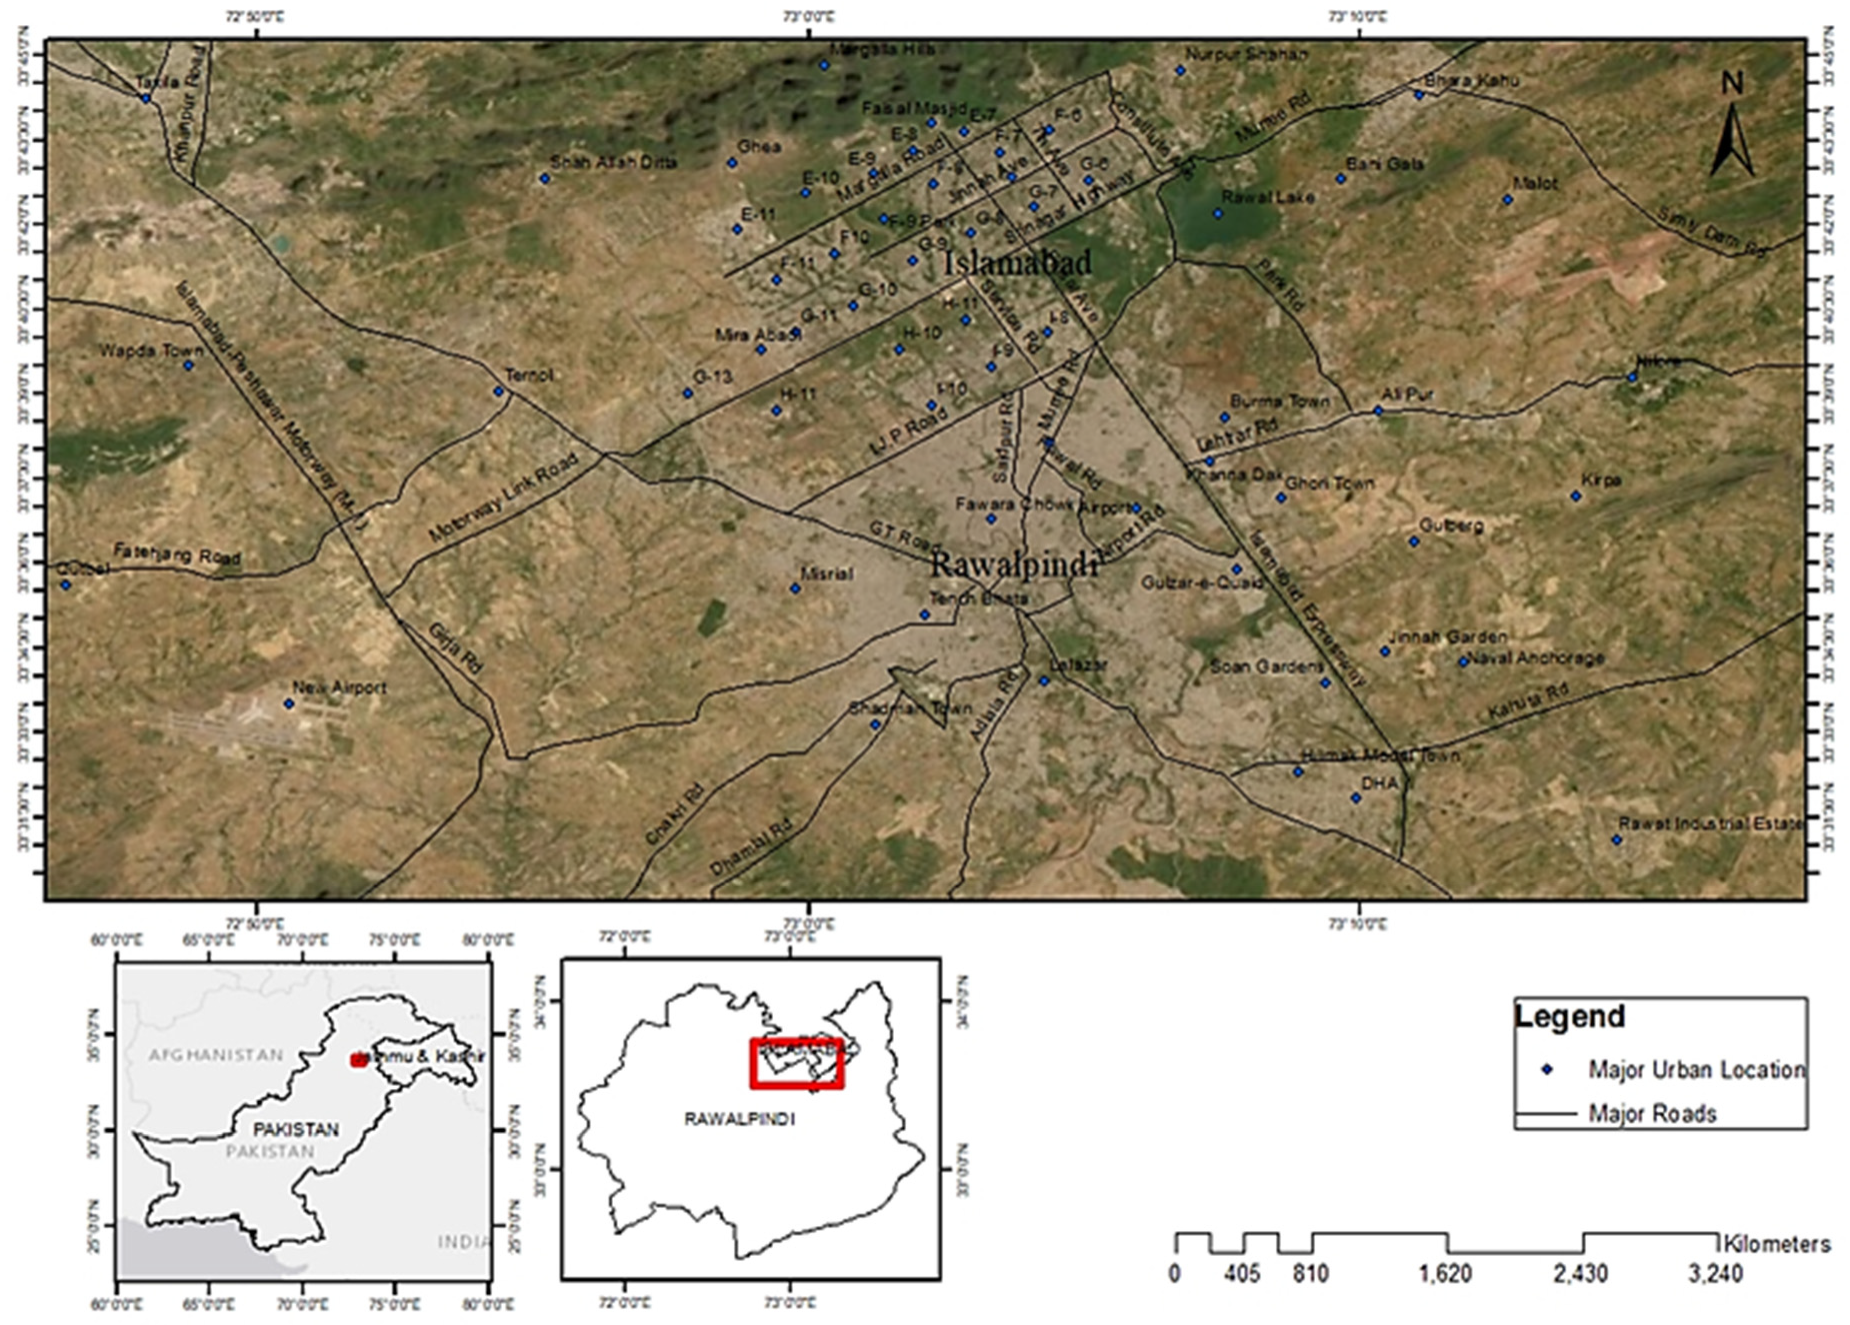
2.1. The Study Area
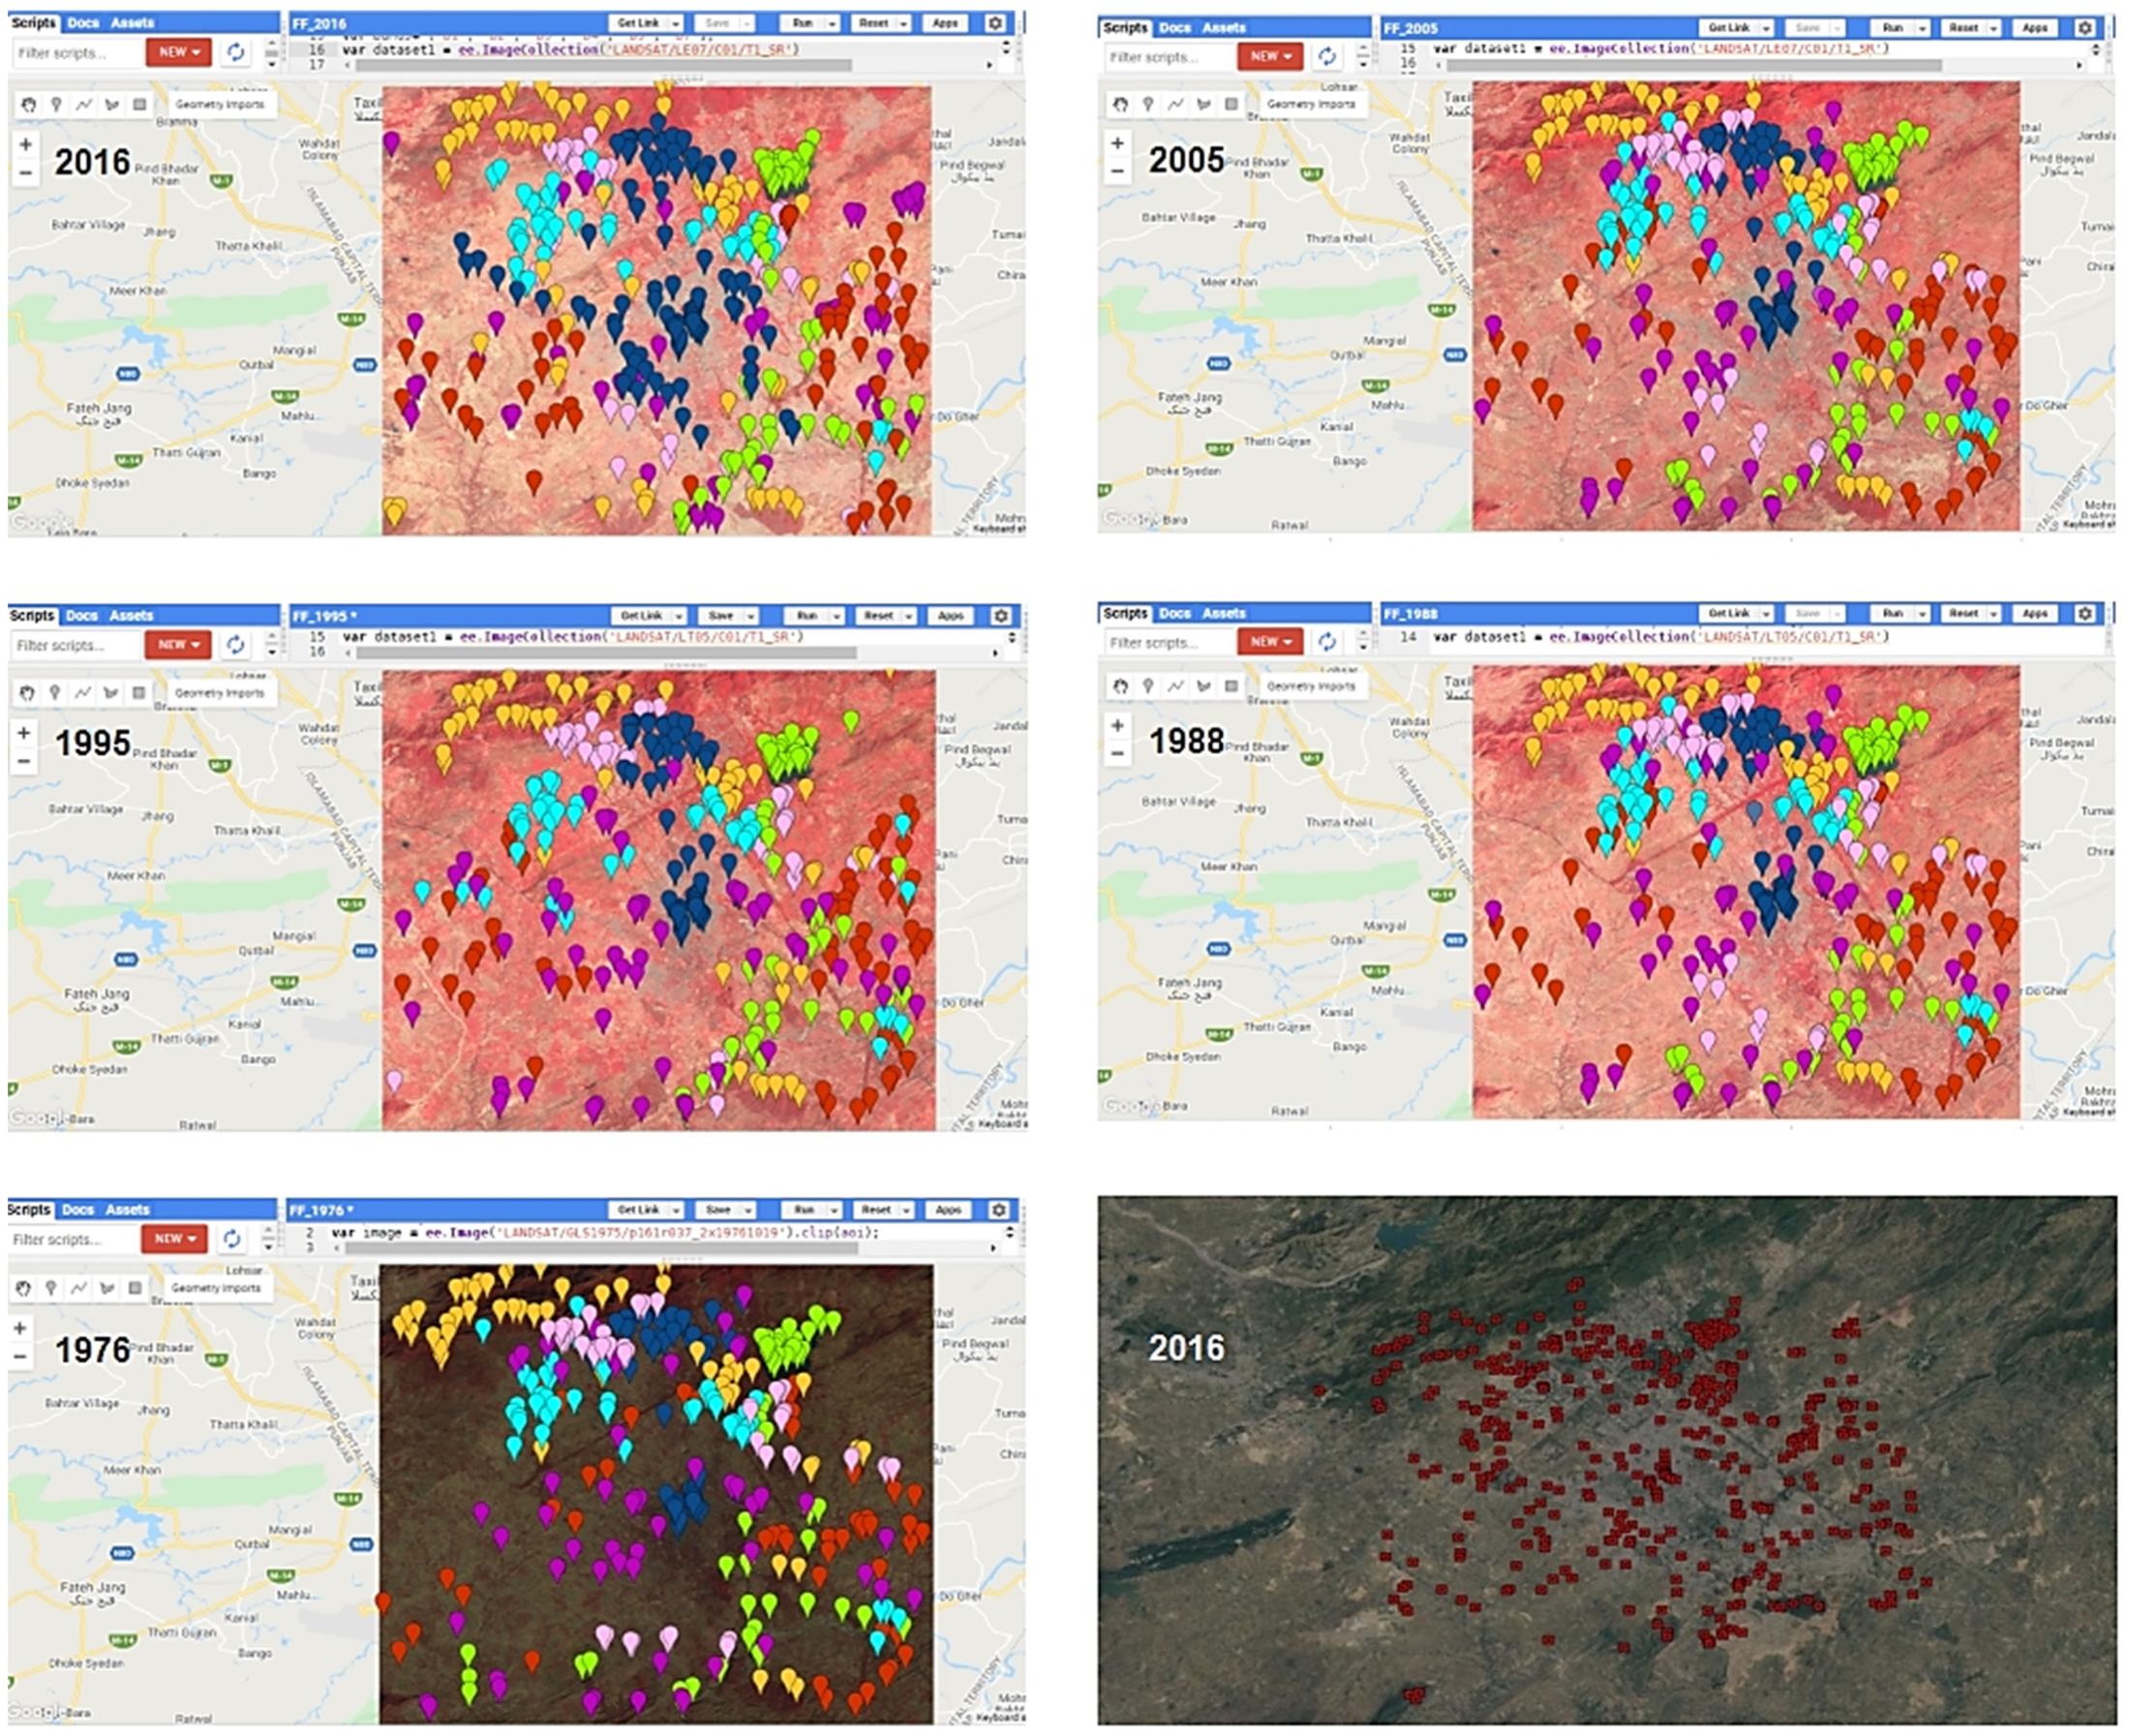
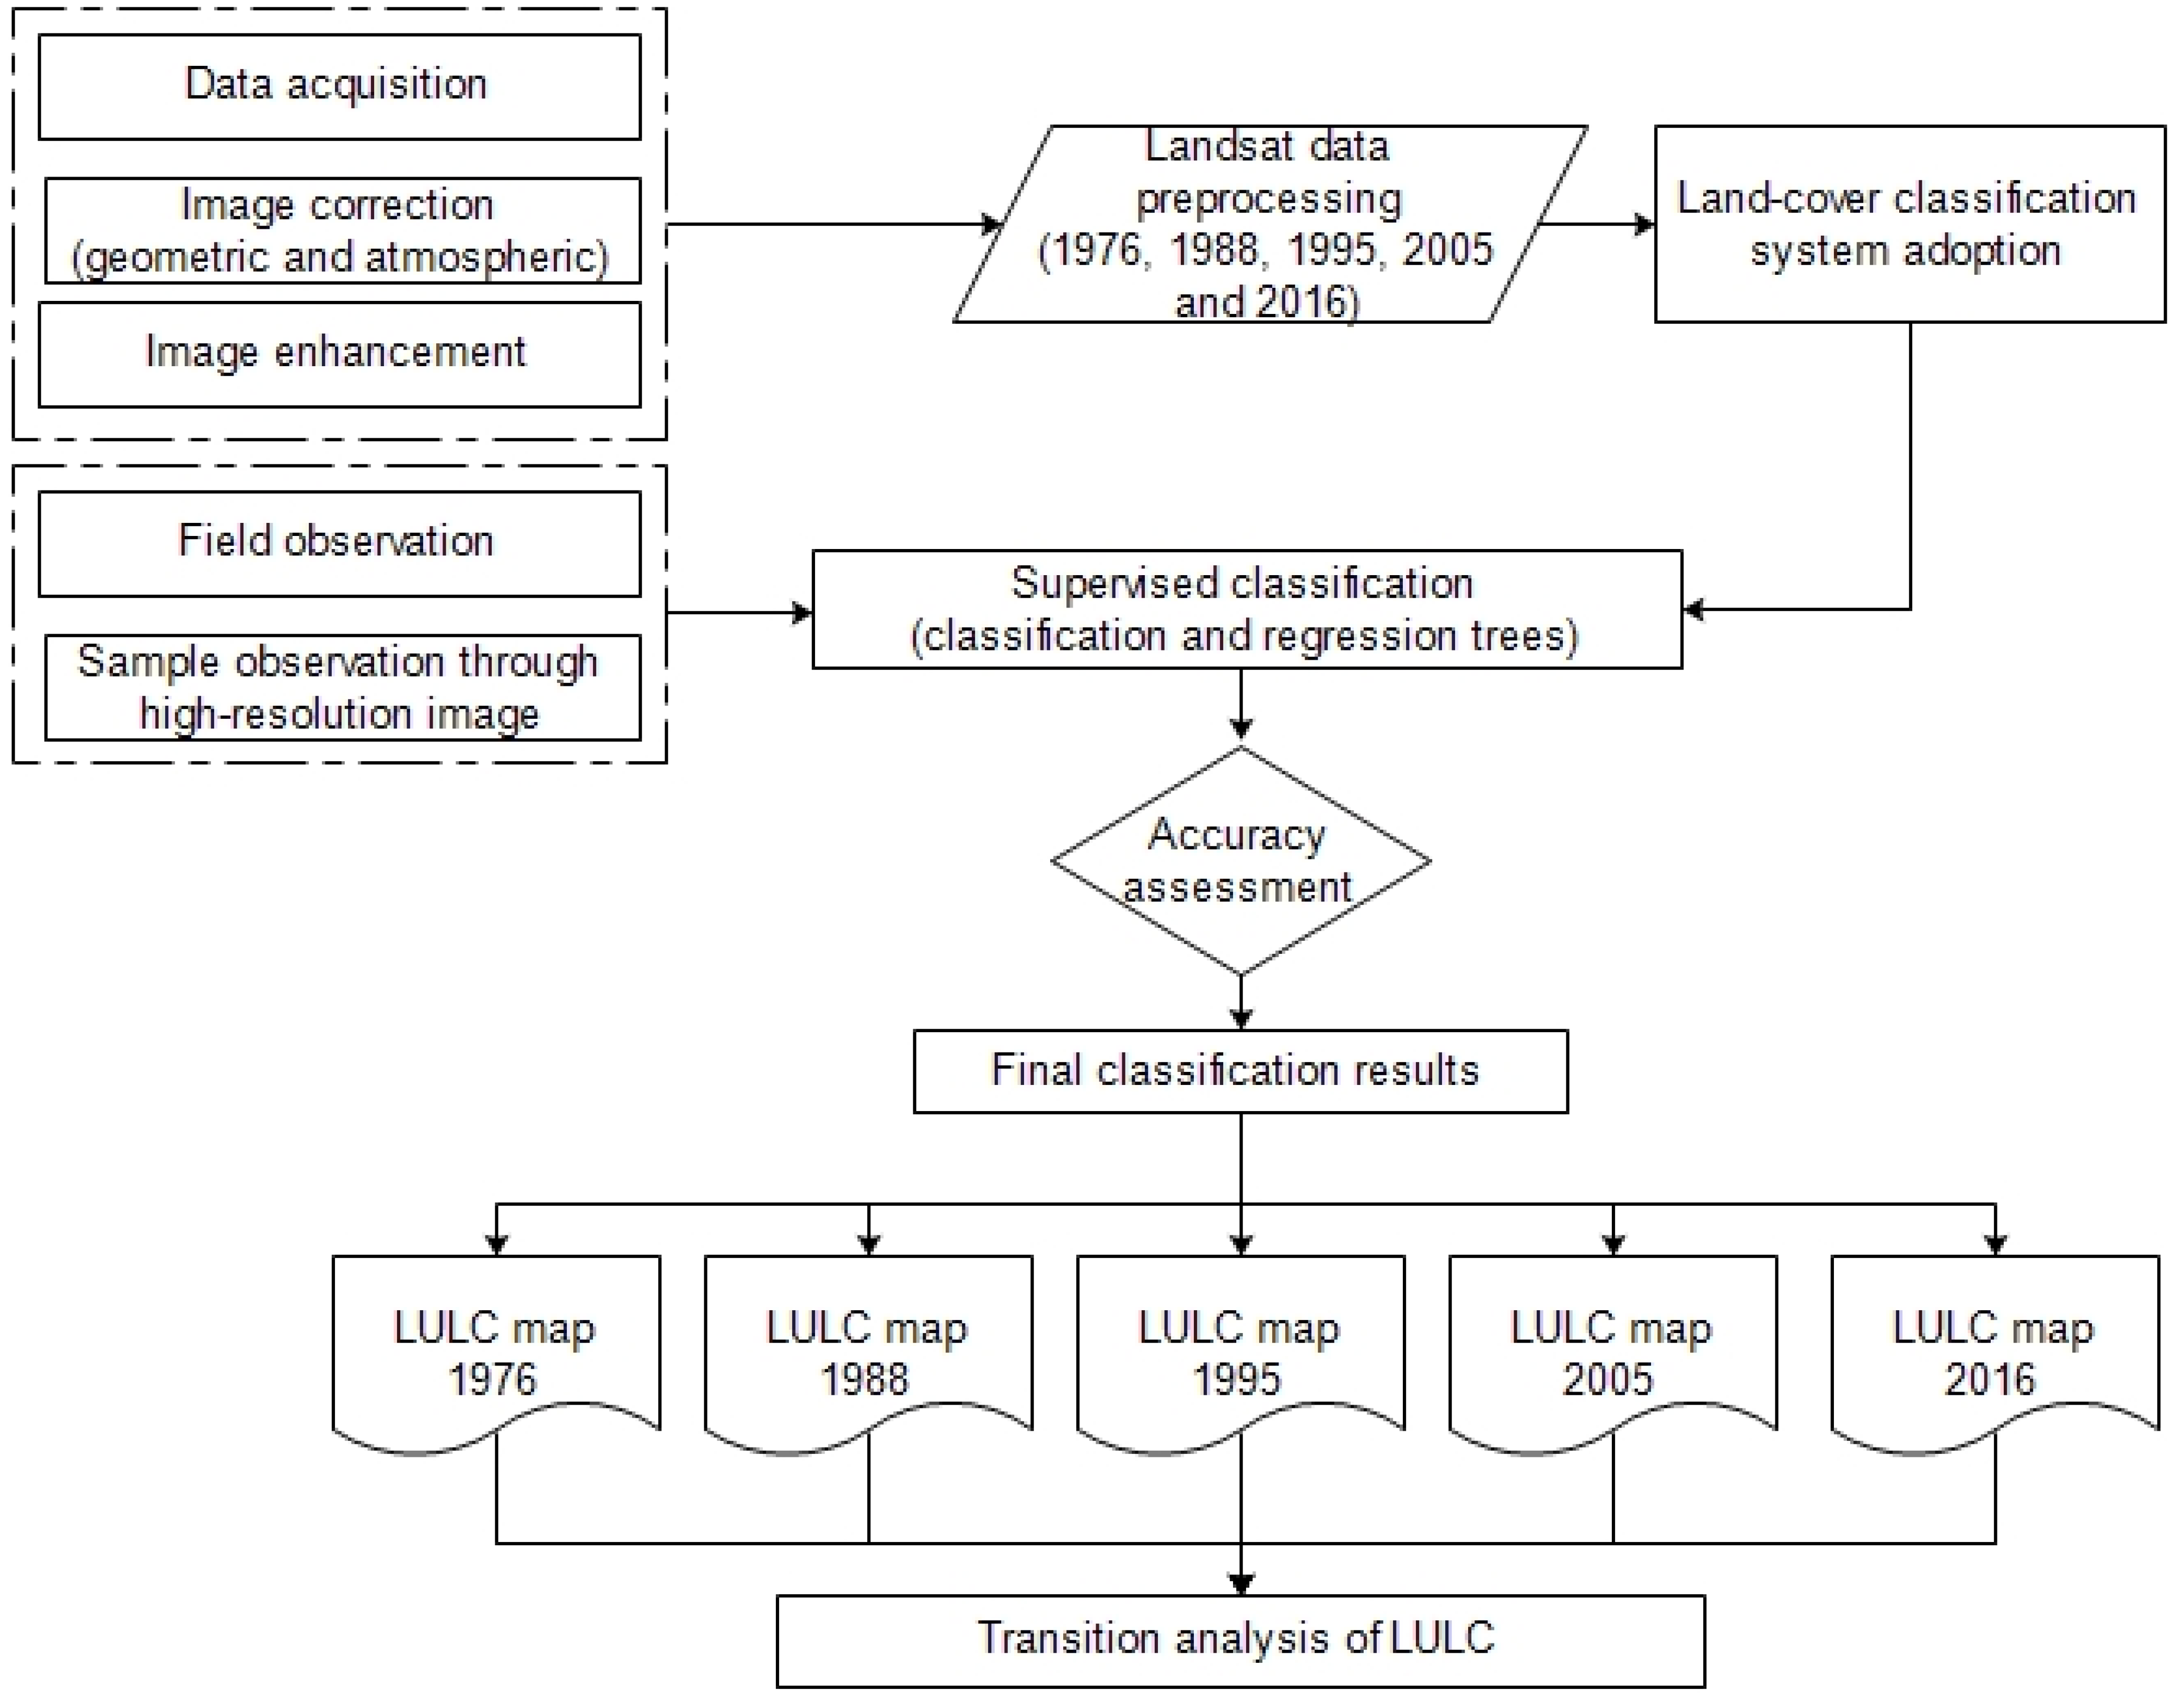
2.2. Data Acquisition and Assessment Approach
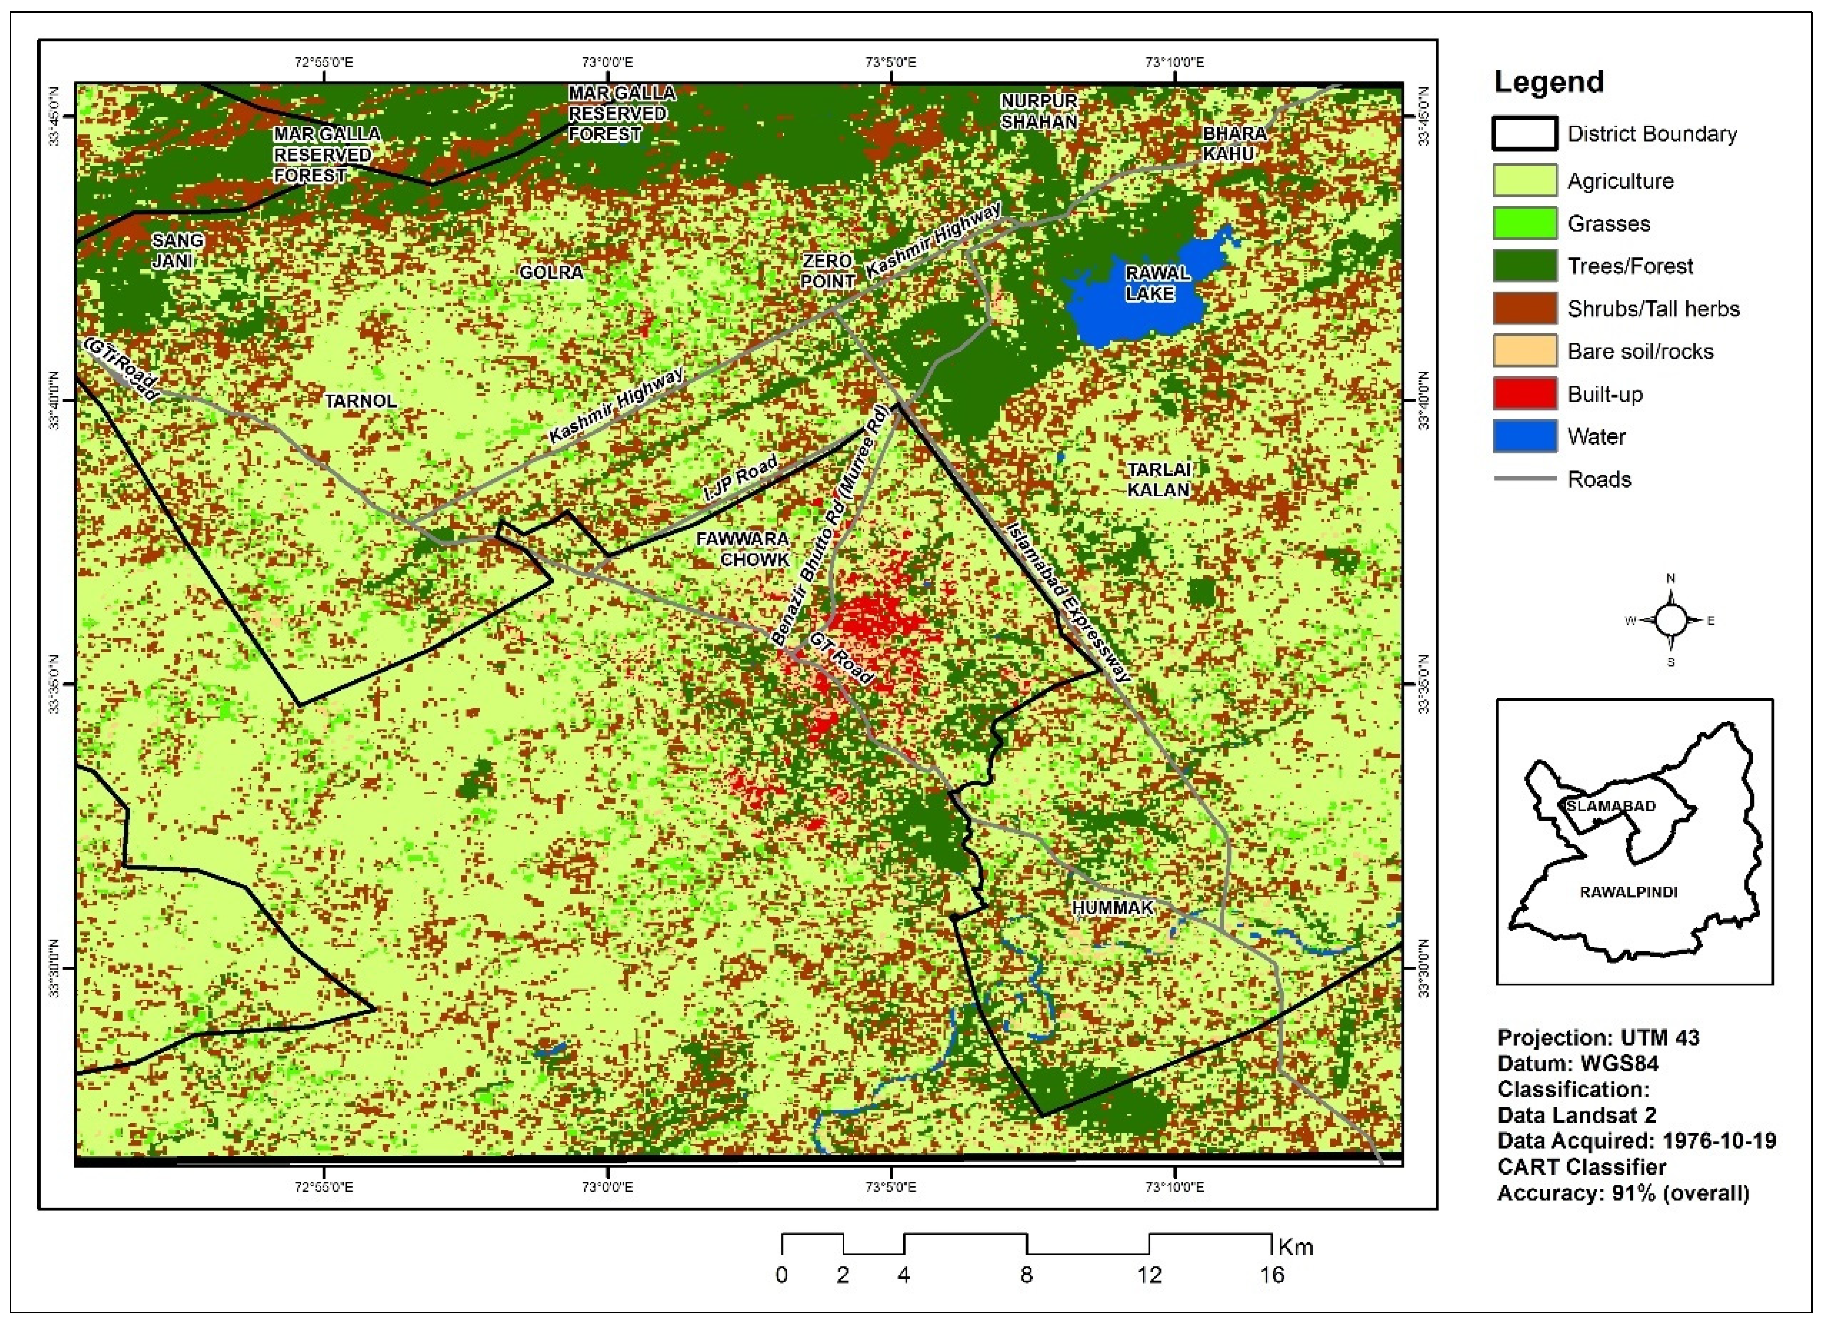
2.3. Extraction of LULC Classes
2.4. Transition Analysis of LULC
3. Results
3.1. Accuracy Assessments
3.2. Temporal Variations in the LULC
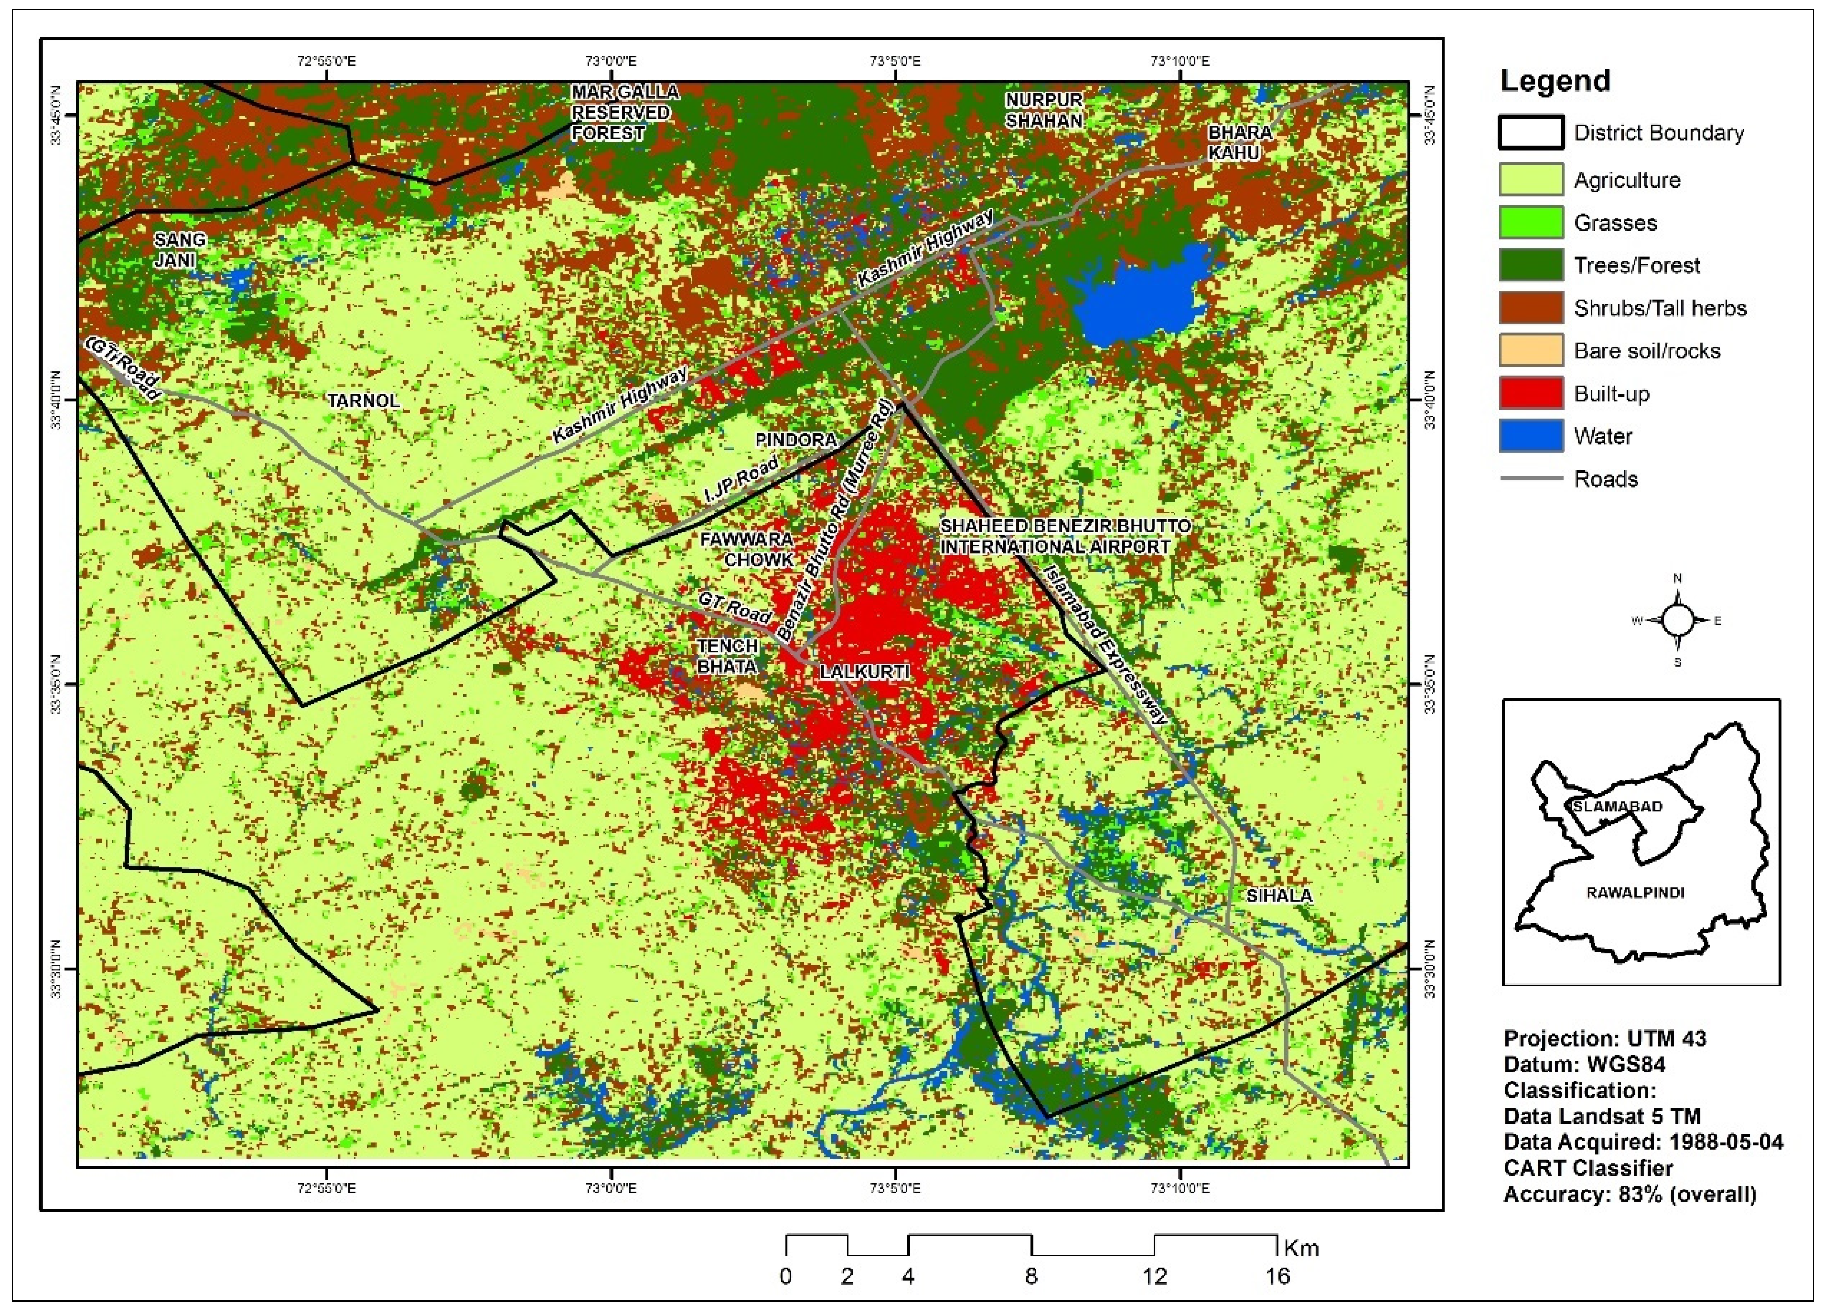
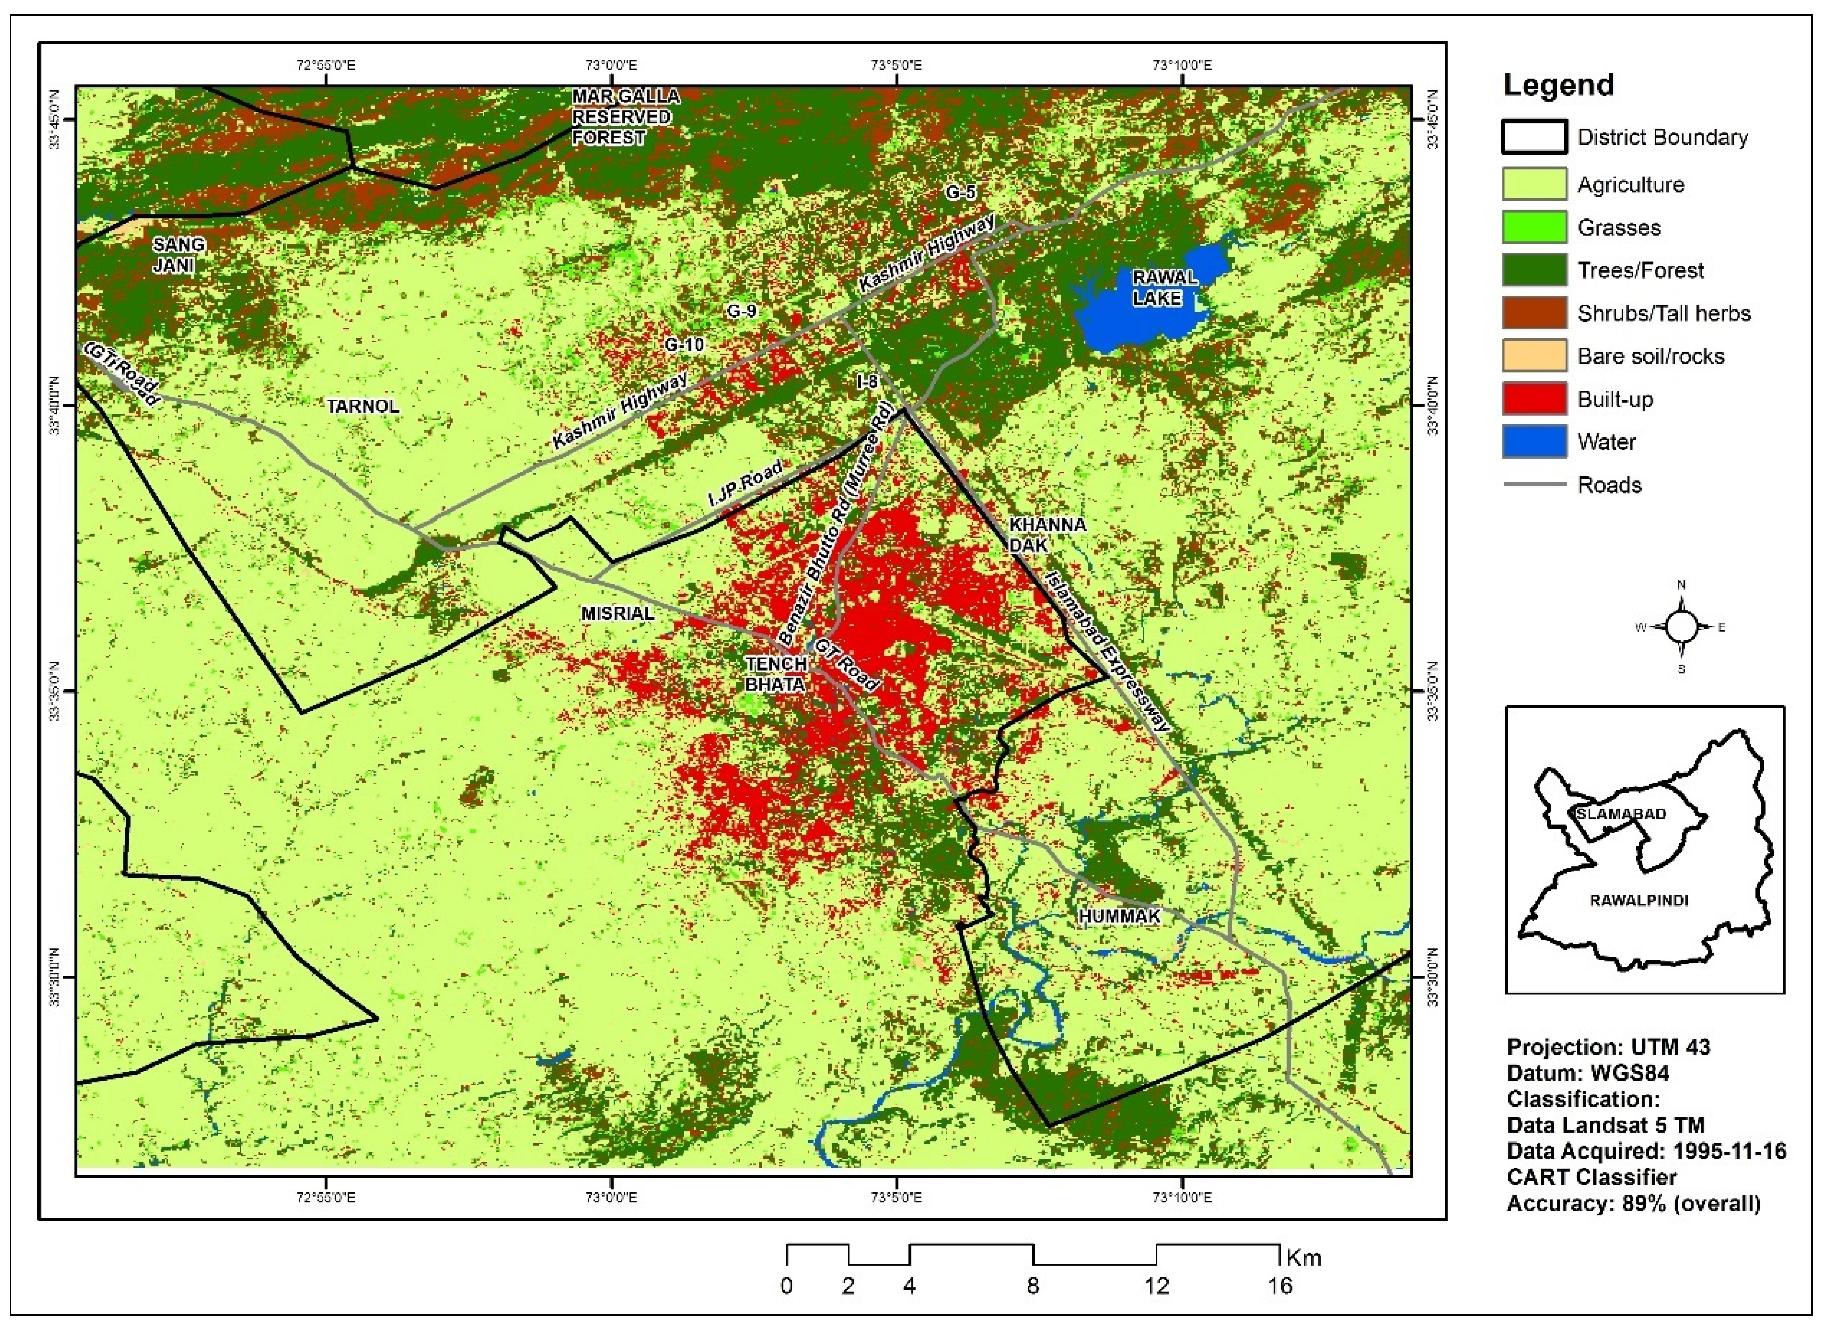
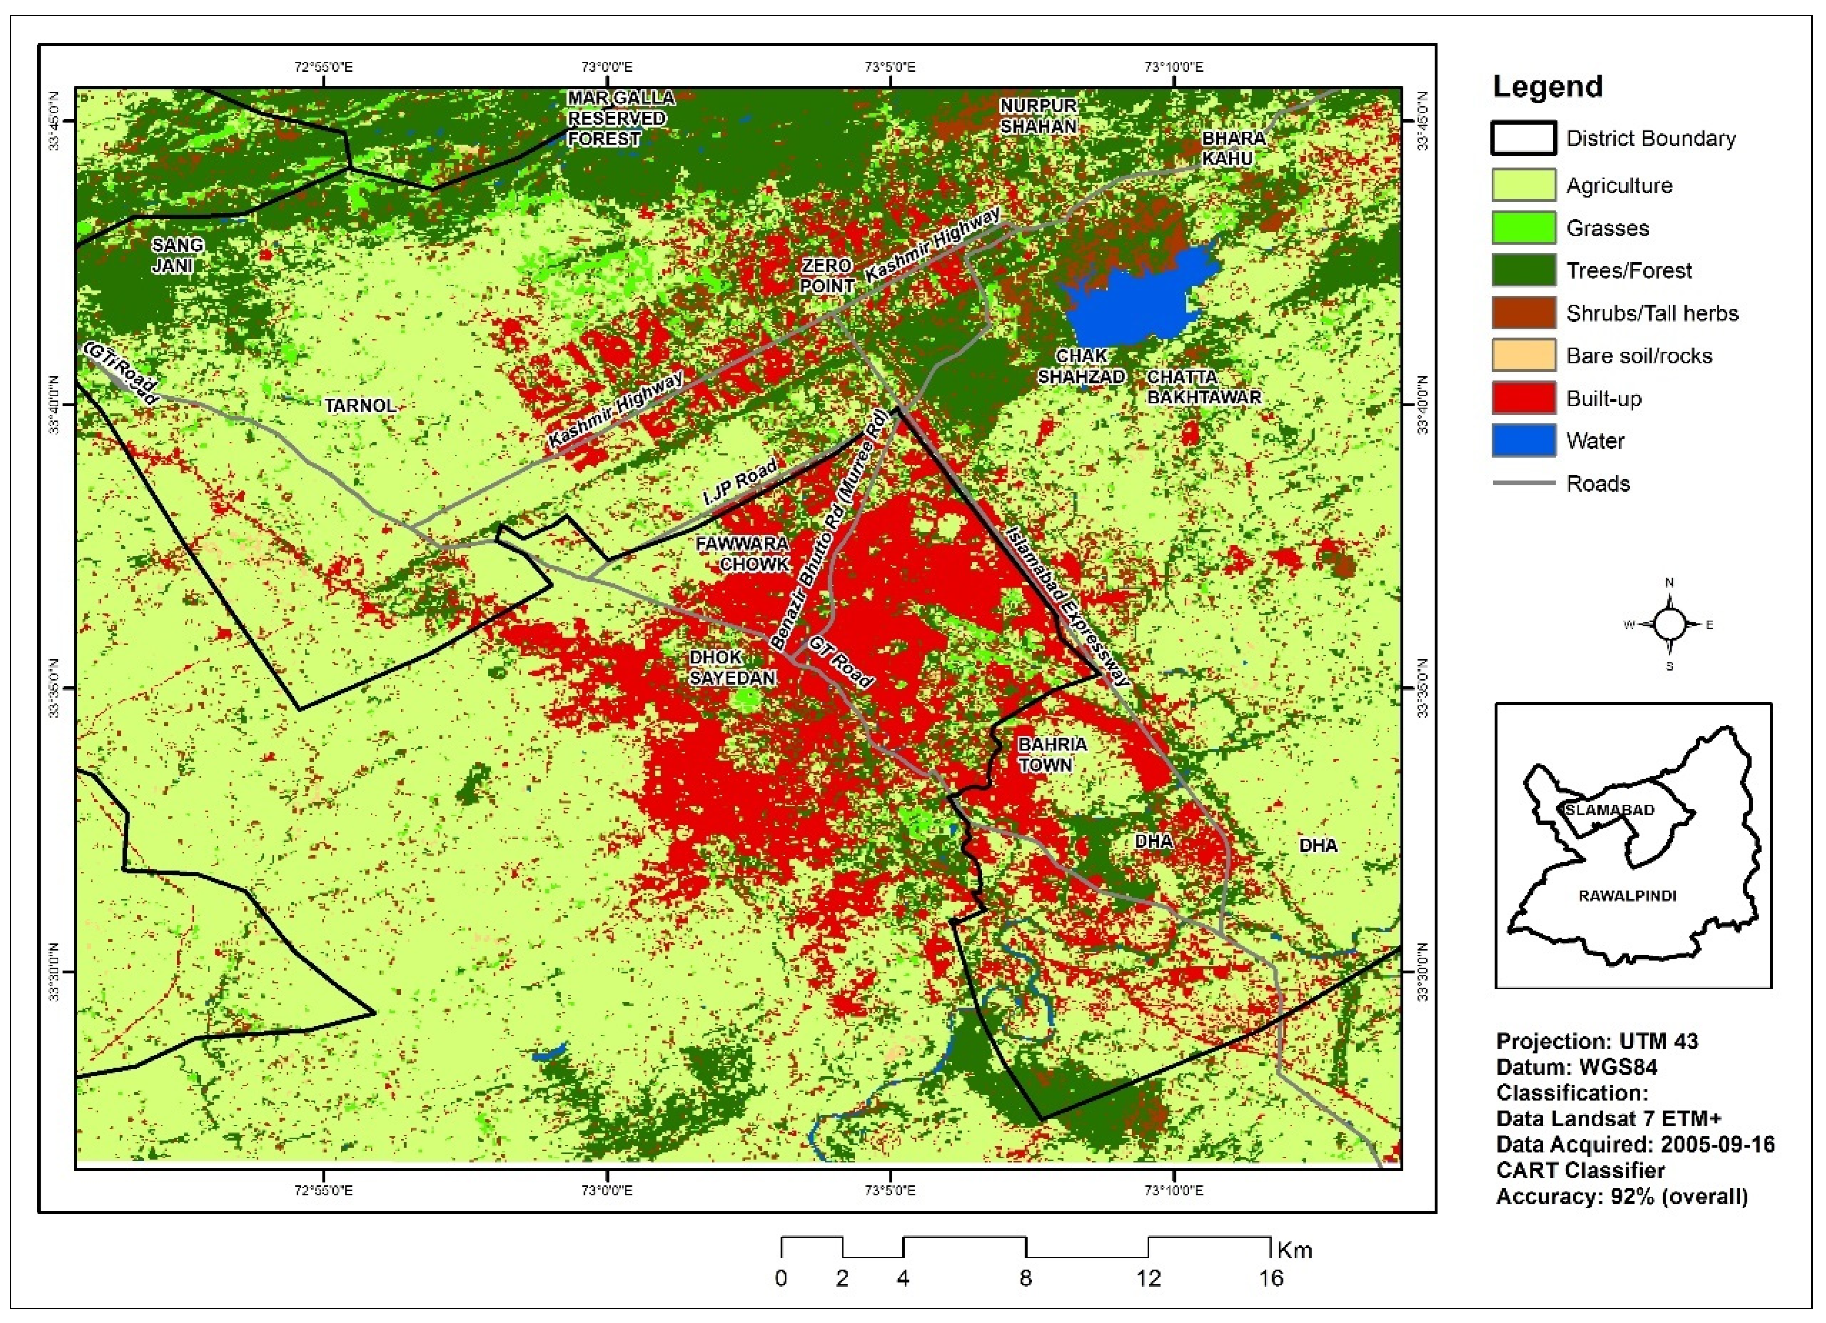
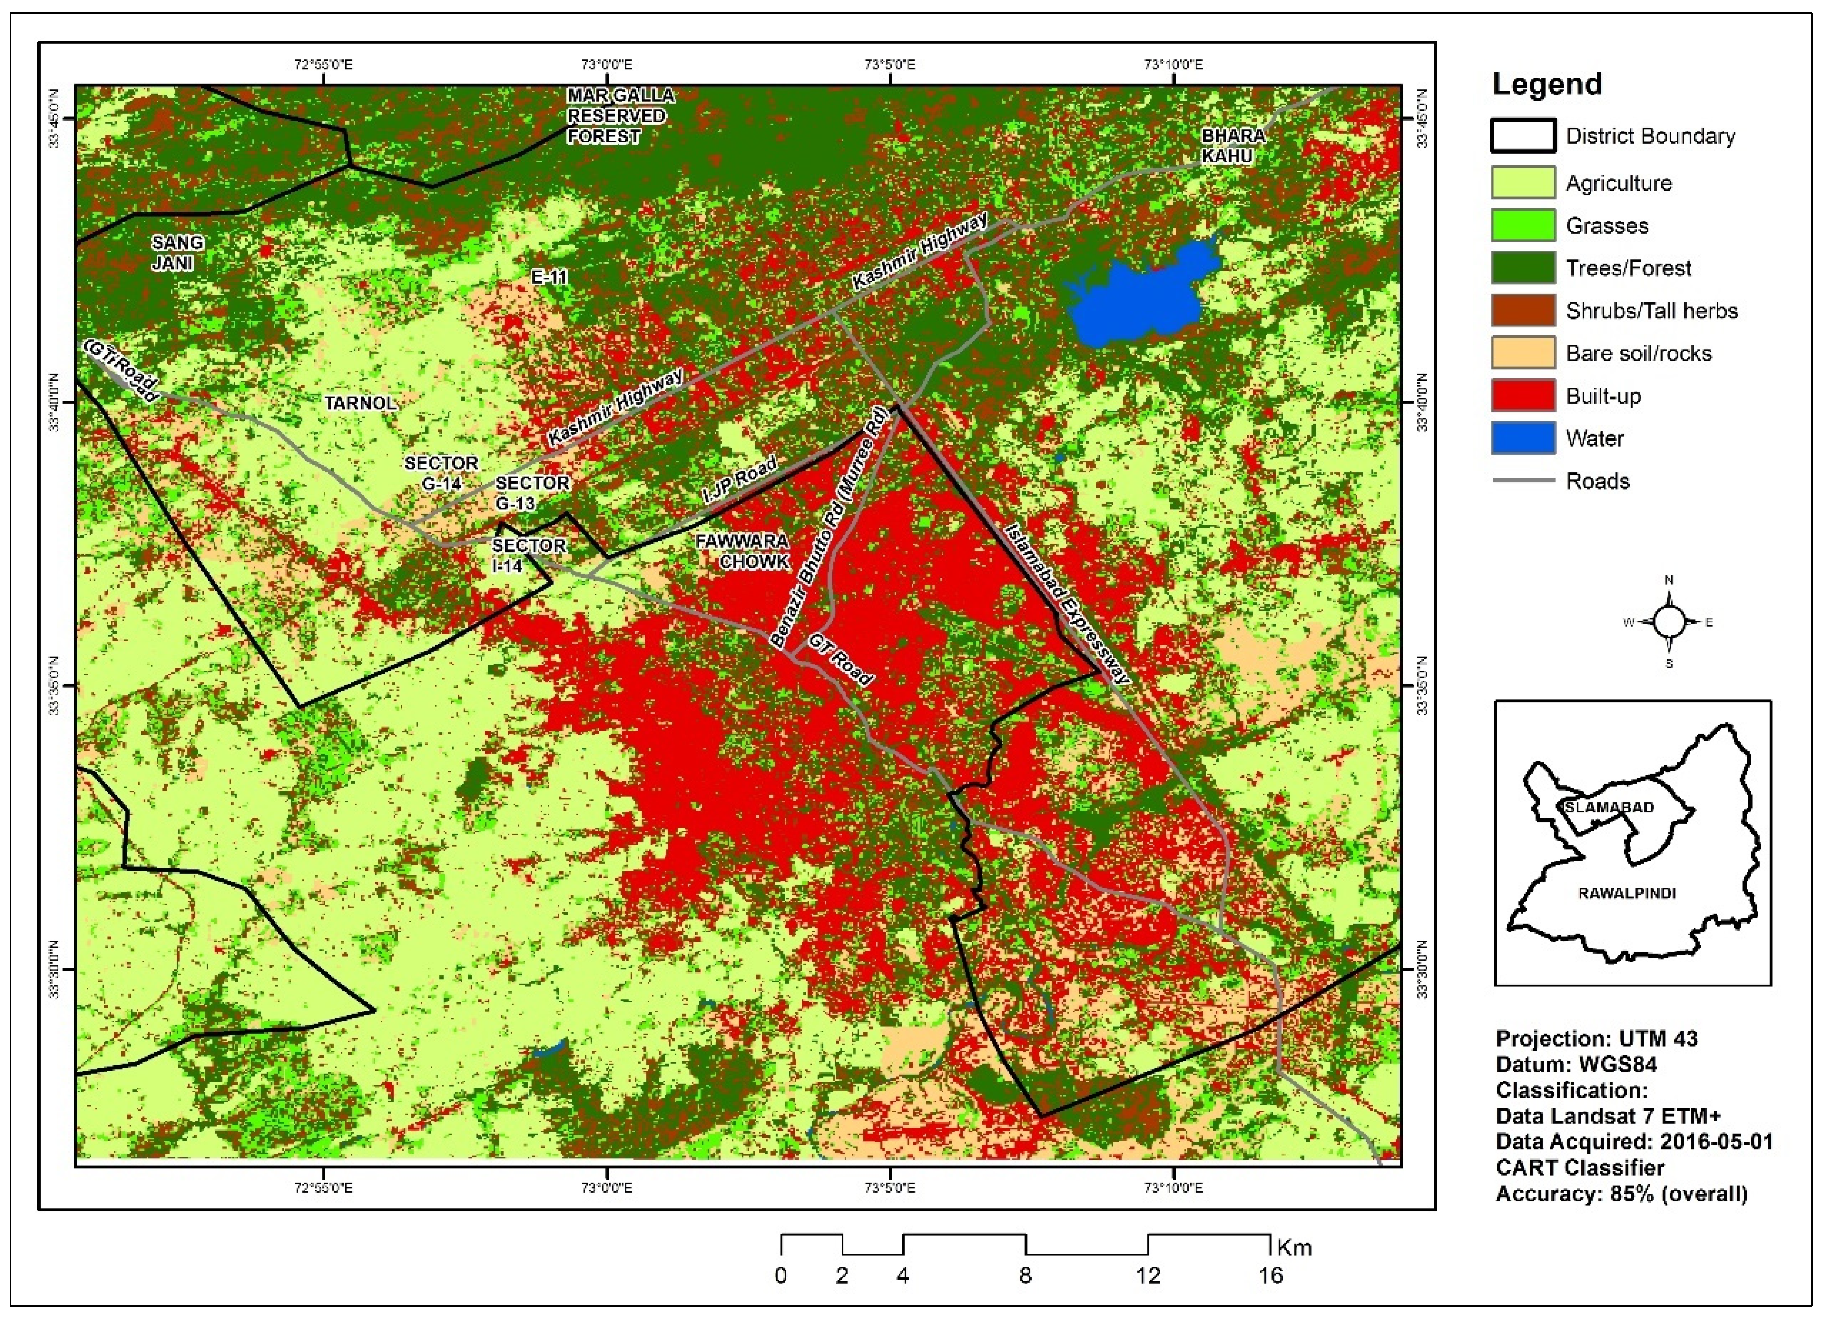
3.3. Spatial Inclinations in LULC Modifications
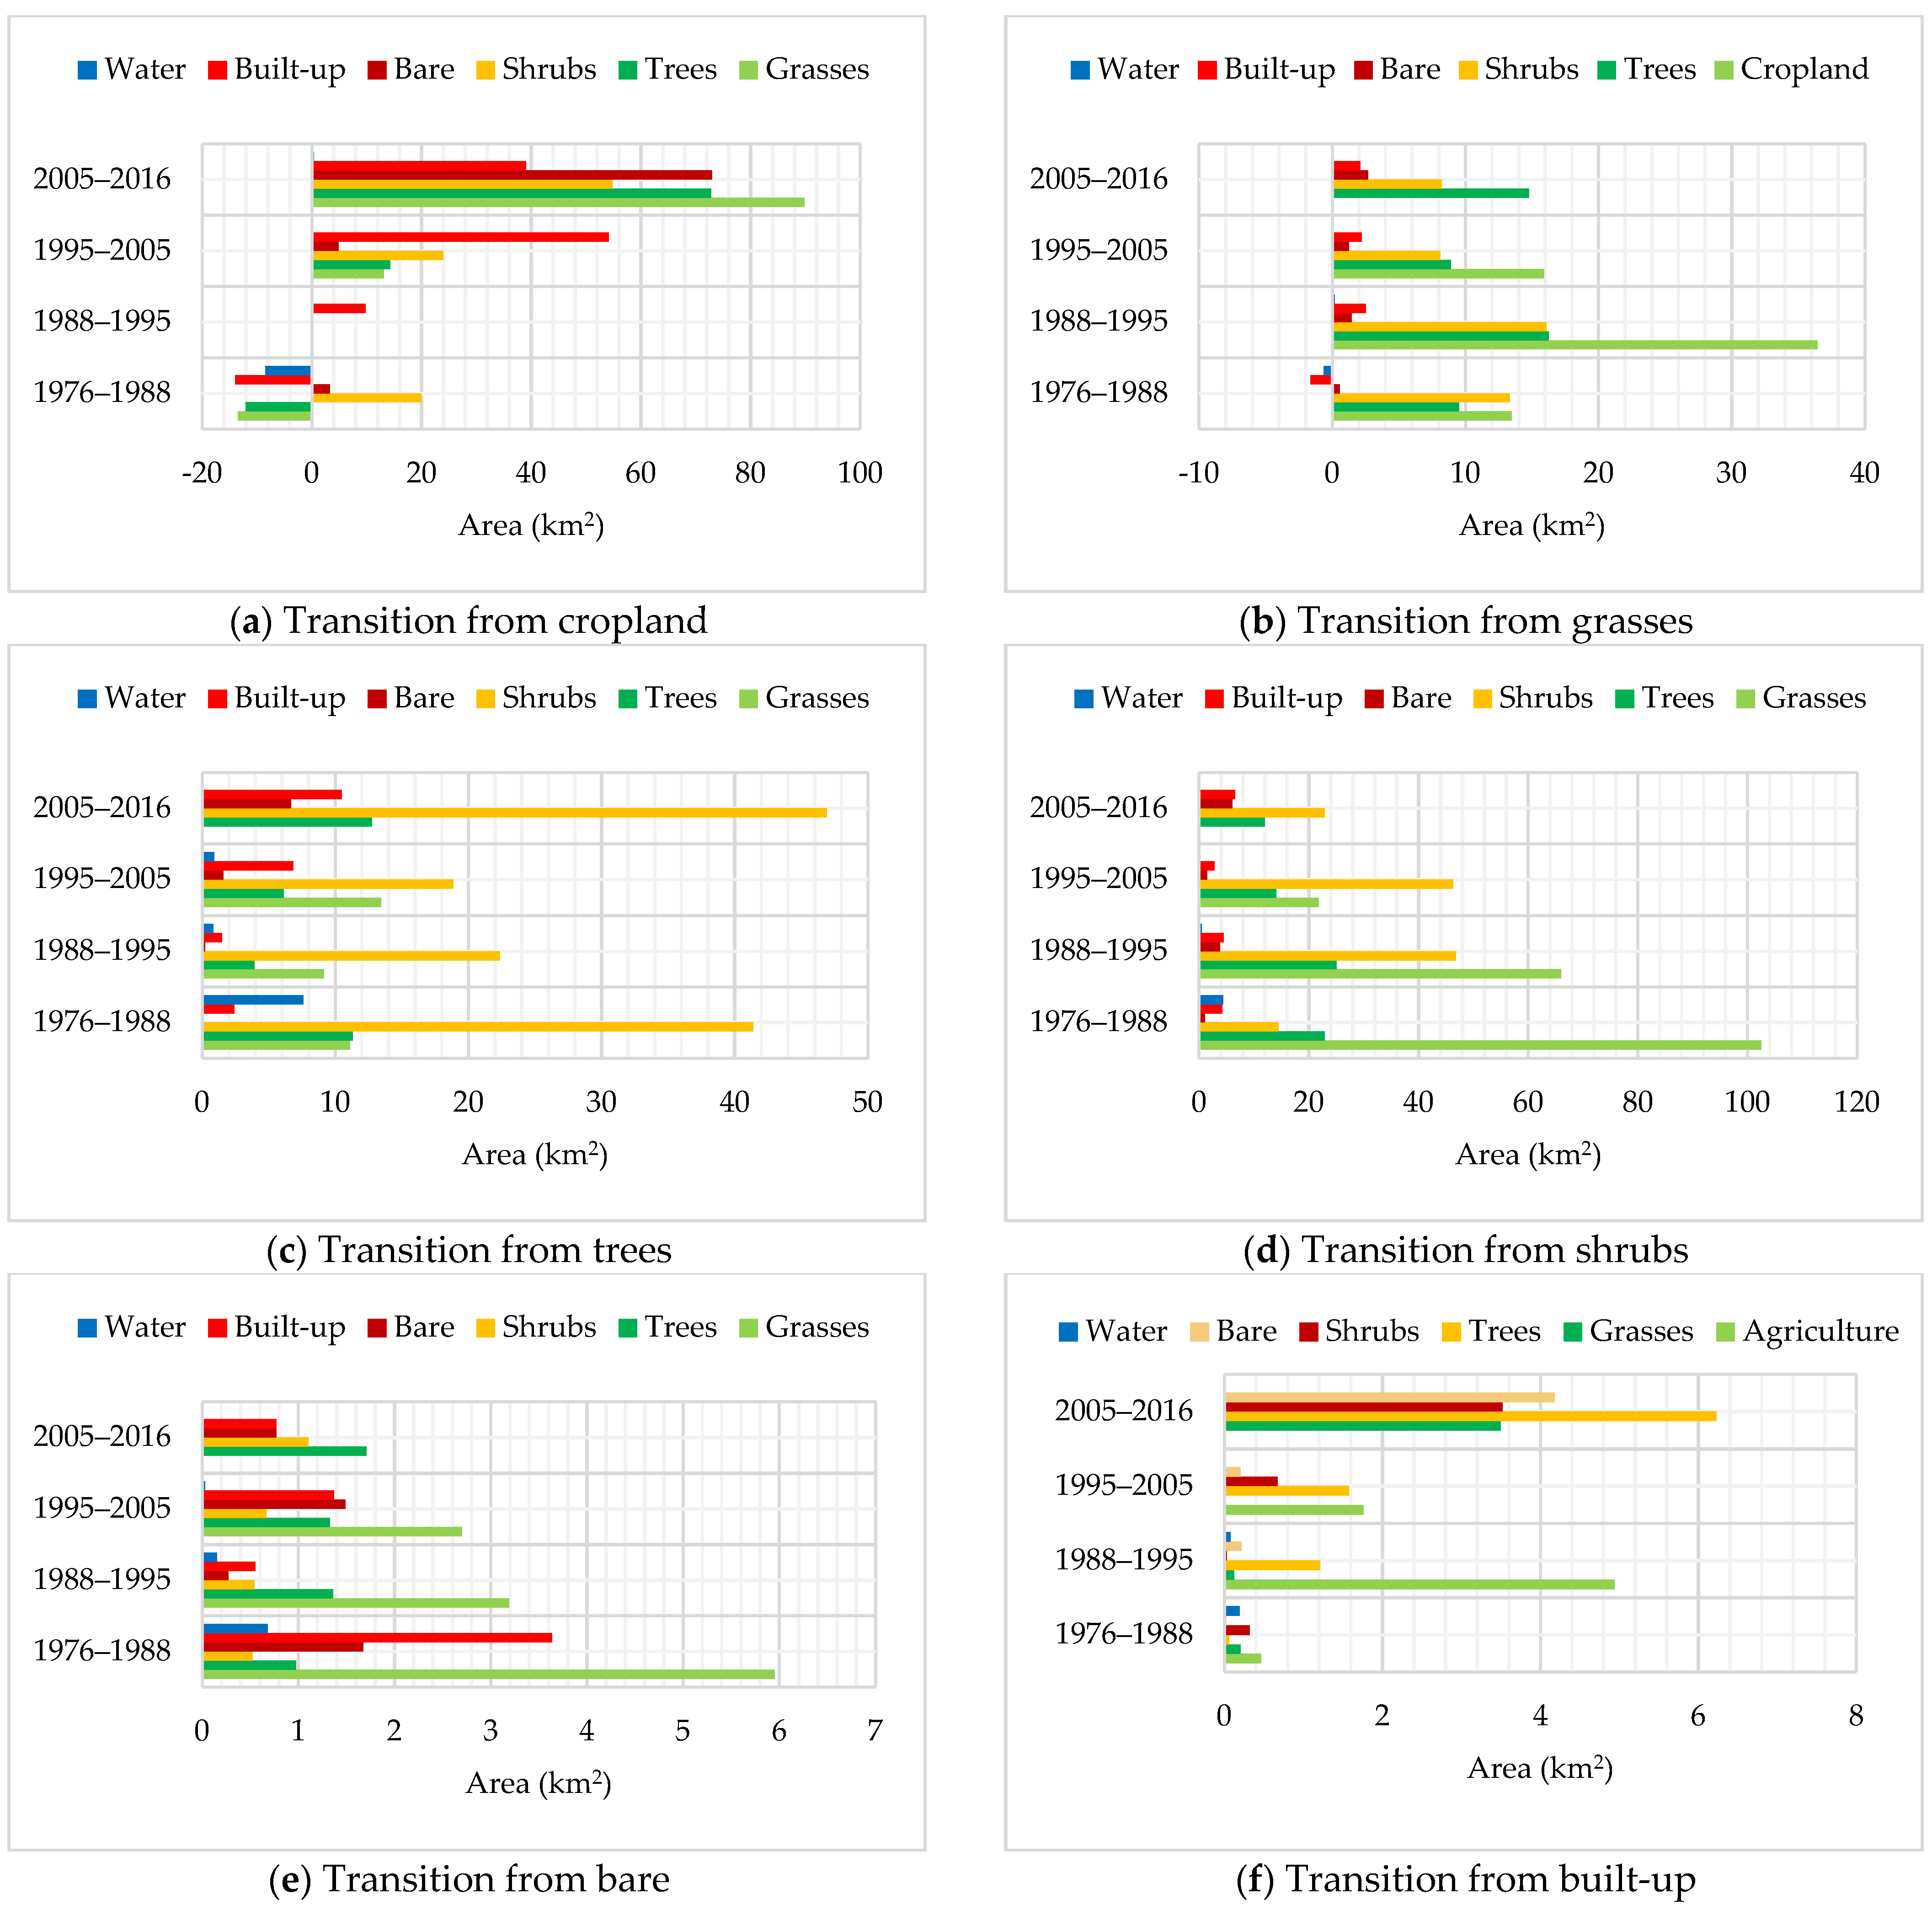
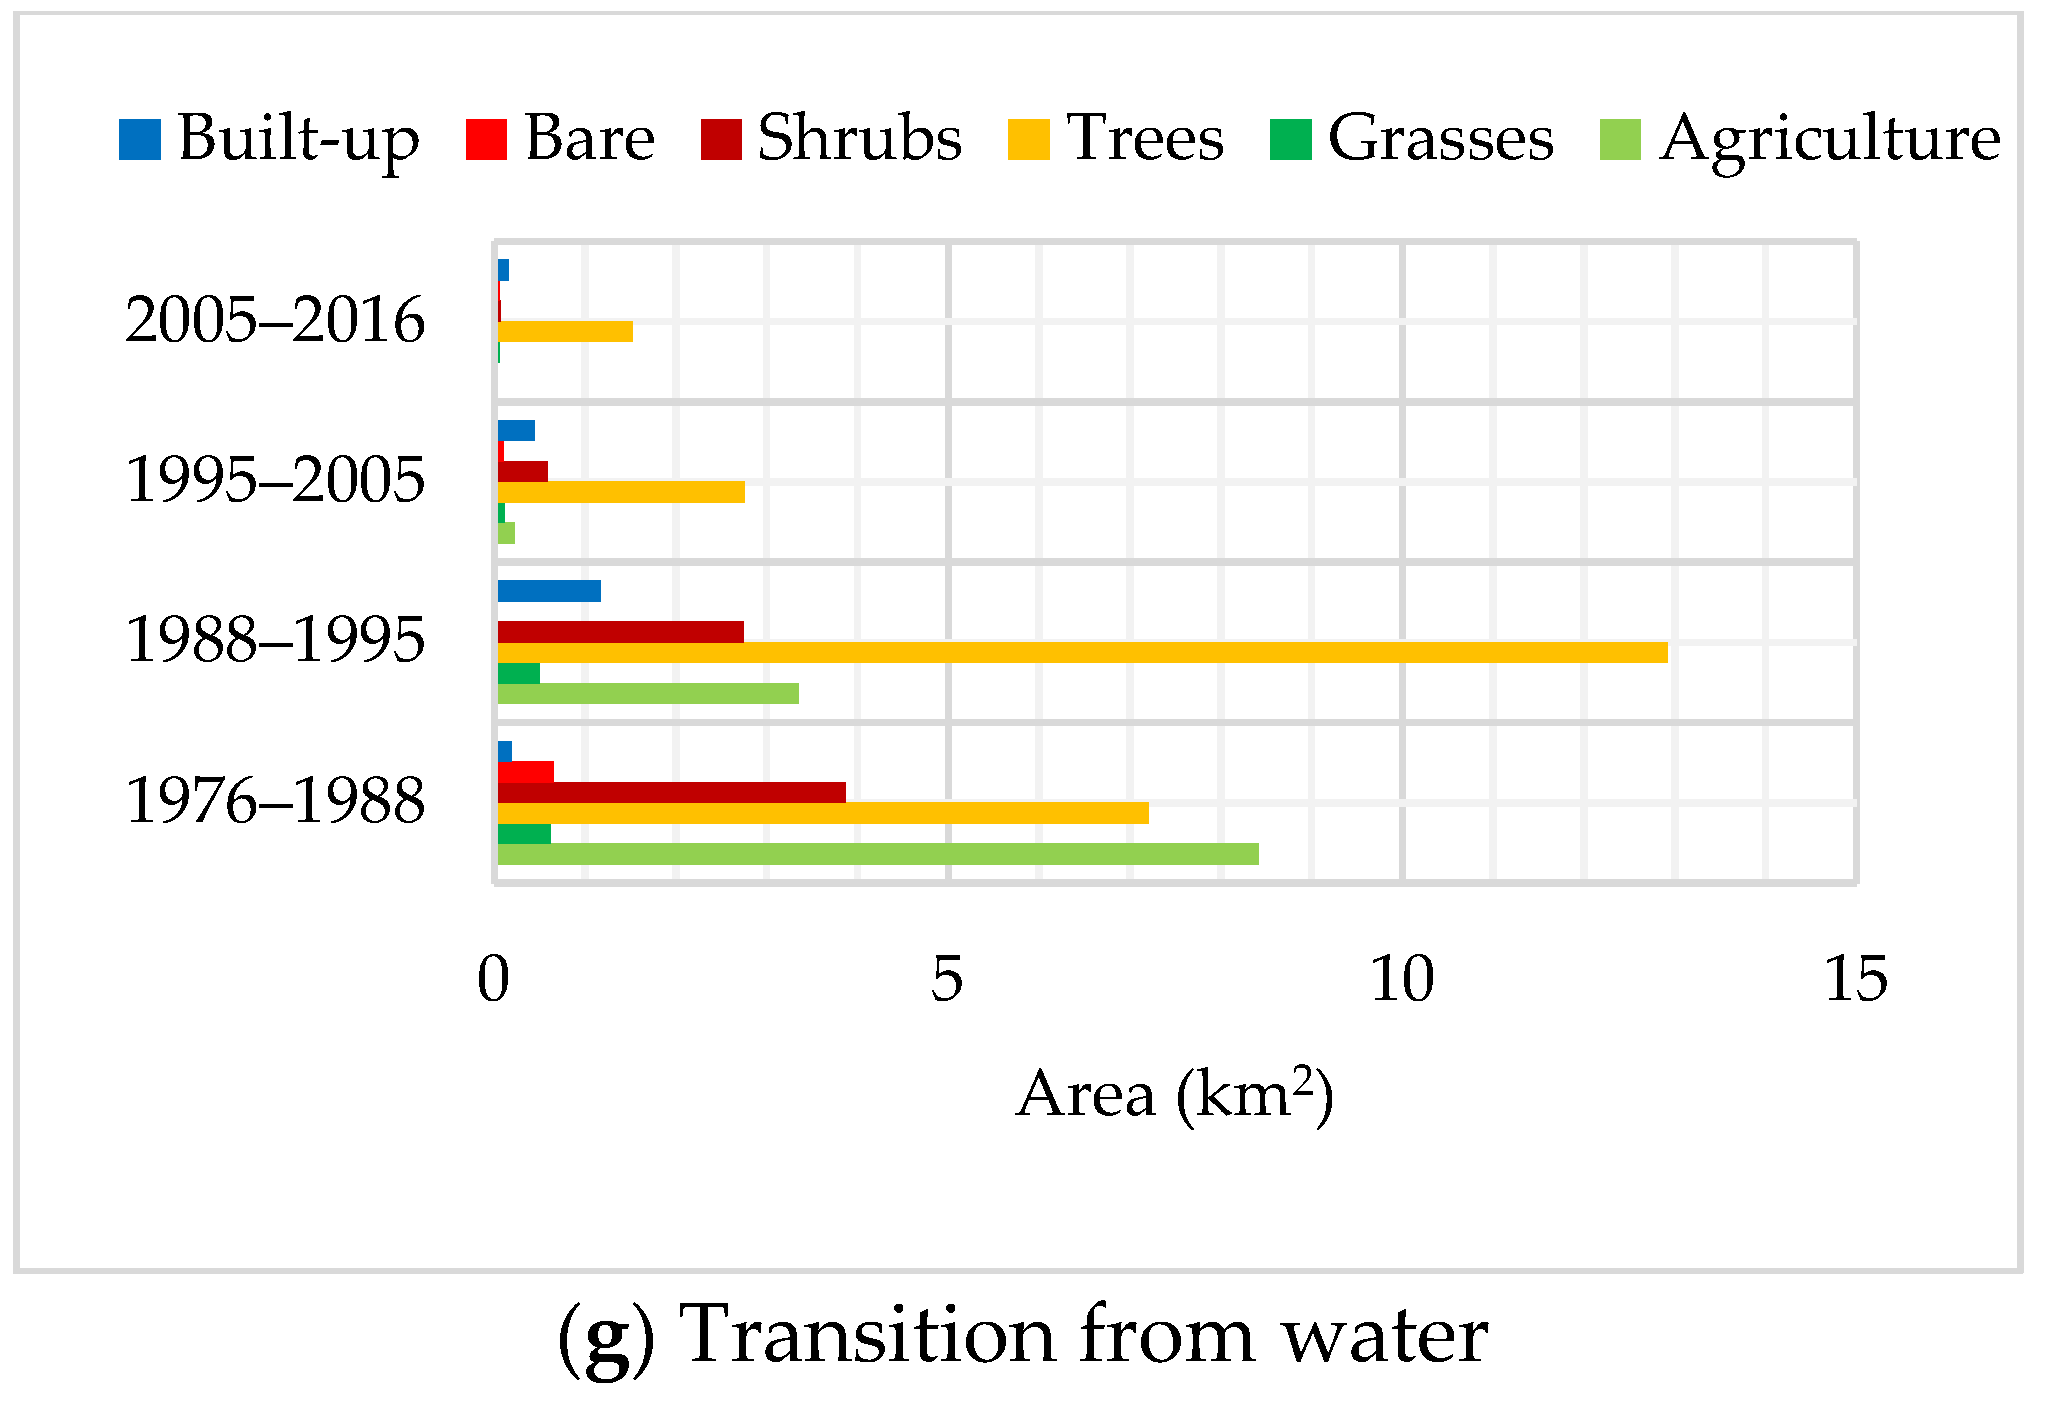
3.4. The Interclass Transitions
4. Discussion
5. Conclusions
Author Contributions
Funding
Institutional Review Board Statement
Informed Consent Statement
Data Availability Statement
Conflicts of Interest
Appendix A

Appendix B

| Characteristics and References of Satellite Images Used and Accuracies | |||||||||||||||
|---|---|---|---|---|---|---|---|---|---|---|---|---|---|---|---|
| 1972 | 1988 | 1995 | |||||||||||||
| Classified in Satellite Image as | Reference Totals | Total Classified | Number Correct | Producer Accuracy | User Accuracy | Reference Totals | Total Classified | Number Correct | Producer Accuracy | User Accuracy | Reference Totals | Total Classified | Number Correct | Producer Accuracy | User Accuracy |
| Cropland | 54 | 53 | 48 | 88.9 | 90.6 | 51 | 49 | 43 | 84.3 | 87.8 | 51 | 48 | 45 | 88.2 | 93.8 |
| Grasses | 55 | 50 | 50 | 90.9 | 100 | 54 | 51 | 44 | 81.5 | 86.3 | 55 | 53 | 49 | 89.1 | 92.5 |
| Tree/Forest | 52 | 54 | 49 | 94.2 | 90.7 | 50 | 50 | 43 | 86.0 | 86.0 | 52 | 51 | 45 | 86.5 | 88.2 |
| Shrubs/Tall herbs | 50 | 51 | 50 | 100 | 98 | 54 | 52 | 46 | 85.2 | 88.5 | 51 | 50 | 43 | 84.3 | 86.0 |
| Bare soil/rocks | 54 | 53 | 50 | 92.6 | 94.3 | 54 | 53 | 42 | 77.8 | 79.2 | 50 | 52 | 42 | 84.0 | 80.8 |
| Built-up | 54 | 55 | 49 | 90.7 | 89.1 | 51 | 54 | 43 | 84.3 | 79.6 | 52 | 55 | 49 | 94.2 | 89.1 |
| Water | 51 | 54 | 43 | 84.3 | 79.6 | 50 | 55 | 44 | 88.0 | 80.0 | 52 | 54 | 50 | 96.2 | 92.6 |
| Total | 370 | 370 | 339 | 364 | 364 | 305 | 363 | 363 | 323 | ||||||
| Overall Accuracy | 91.6% | 83.8% | 89% | ||||||||||||
| Overall Kappa Statistics | 0.8172 | 0.6963 | 0.7743 | ||||||||||||
| 2005 | 2016 | ||||||||||||||
| Classified in Satellite Image as | Reference Totals | Total Classified | Number Correct | Producer Accuracy | User Accuracy | Reference Totals | Total Classified | Number Correct | Producer Accuracy | User Accuracy | |||||
| Cropland | 54 | 52 | 48 | 88.9 | 92.3 | 50 | 50 | 42 | 84.0 | 84.0 | |||||
| Grasses | 53 | 55 | 51 | 96.2 | 92.7 | 51 | 51 | 43 | 84.3 | 84.3 | |||||
| Tree/Forest | 52 | 52 | 48 | 92.3 | 92.3 | 54 | 56 | 48 | 88.9 | 85.7 | |||||
| Shrubs/Tall herbs | 53 | 54 | 52 | 98.1 | 96.3 | 52 | 53 | 50 | 96.2 | 94.3 | |||||
| Bare soil/rocks | 55 | 54 | 49 | 89.1 | 90.7 | 55 | 53 | 42 | 76.4 | 79.2 | |||||
| Built-up | 53 | 52 | 46 | 86.8 | 88.5 | 53 | 50 | 44 | 83.0 | 88.0 | |||||
| Water | 51 | 52 | 48 | 94.1 | 92.3 | 52 | 54 | 44 | 84.6 | 81.5 | |||||
| Total | 371 | 371 | 342 | 367 | 367 | 313 | |||||||||
| Overall Accuracy | 92.2% | 85.3% | |||||||||||||
| Overall Kappa Statistics | 0.8933 | 0.7378 | |||||||||||||
References
- De Groot, R.S.; Wilson, M.A.; Boumans, R.M. A typology for the classification, description and valuation of ecosystem functions, goods and services. Ecol. Econ. 2002, 41, 393–408. [Google Scholar] [CrossRef]
- Rimal, B.; Zhang, L.; Stork, N.; Sloan, S.; Rijal, S. Urban Expansion Occurred at the Expense of Agricultural Lands in the Tarai Region of Nepal from 1989 to 2016. Sustainability 2018, 10, 1341. [Google Scholar] [CrossRef]
- Zaman-Ul-Haq, M.; Saqib, Z.; Kanwal, A.; Naseer, S.; Shafiq, M.; Akhtar, N.; Bokhari, S.A.; Irshad, A.; Hamam, H. The Trajectories, Trends, and Opportunities for Assessing Urban Ecosystem Services: A Systematic Review of Geospatial Methods. Sustainability 2022, 14, 1471. [Google Scholar] [CrossRef]
- Ali, L.; Wang, C.; Ullah, I.; Yousaf, A.; Khan, W.U.; Ullah, S.; Khan, R.; Alassery, F.; Hamam, H.; Shafiq, M. Design and Optimization of Microwave Sensor for the Non-Contact Measurement of Pure Dielectric Materials. Electronics 2021, 10, 3057. [Google Scholar] [CrossRef]
- Du, X.; Huang, Z. Ecological and environmental effects of land use change in rapid urbanization: The case of hangzhou, China. Ecol. Indic. 2017, 81, 243–251. [Google Scholar] [CrossRef]
- Metzger, M.J.; Rounsevell, M.; Acosta-Michlik, L.; Leemans, R.; Schröter, D. The vulnerability of ecosystem services to land use change. Agric. Ecosyst. Environ. 2006, 114, 69–85. [Google Scholar] [CrossRef]
- Larondelle, N.; Frantzeskaki, N.; Haase, D. Mapping transition potential with stakeholder- and policy-driven scenarios in Rotterdam City. Ecol. Indic. 2016, 70, 630–643. [Google Scholar] [CrossRef]
- Saarela, S.-R.; Rinne, J. Knowledge brokering and boundary work for ecosystem service indicators. An urban case study in Finland. Ecol. Indic. 2016, 61, 49–62. [Google Scholar] [CrossRef]
- Appiah, D.O.; Forkuo, E.K.; Bugri, J.T.; Apreku, T.O. Geospatial Analysis of Land Use and Land Cover Transitions from 1986–2014 in a Peri-Urban Ghana. Geosciences 2017, 7, 125. [Google Scholar] [CrossRef]
- Ahern, J.; Cilliers, S.; Niemelä, J. The concept of ecosystem services in adaptive urban planning and design: A framework for supporting innovation. Landsc. Urban. Plan. 2014, 125, 254–259. [Google Scholar] [CrossRef]
- Cohen, B. Urbanization in developing countries: Current trends, future projections, and key challenges for sustainability. Technol. Soc. 2006, 28, 63–80. [Google Scholar] [CrossRef]
- Vasenev, V.I.; Yaroslavtsev, A.; Vasenev, I.I.; Demina, S.A.; Dovltetyarova, E.A. Land-Use Change in New Moscow: First Outcomes after Five Years of Urbanization. Geogr. Environ. Sustain. 2019, 12, 24–34. [Google Scholar] [CrossRef]
- UNDP. “Human Development Reports”. The 2016 Global Multidimensional Poverty Index (MPI). 2018. Available online: https://hdr.undp.org/en/2020-MPI (accessed on 1 December 2021).
- Kugelman, M. Pakistan’s Runaway Urbanization: What Can Be Done? Wilson Center: Washington, DC, USA, 2014. [Google Scholar]
- Arif, G.; Hamid, S. Urbanization, city growth and quality of life in Pakistan. Eur. J. Soc. Sci. 2009, 10, 196–215. [Google Scholar]
- Farah, N.; Zafar, M.I.; Nawaz, N. Socio-Economic and Cultural Factors Affecting Migration Behavior in District Faisalabad, Pakistan. Pak. J. Life Soc. Sci. 2012, 10, 28–32. [Google Scholar]
- Safder, Q.; Babar, U. Assessment of Urbanization and Urban Sprawl Analysis through Remote Sensing and GIS: A Case Study of Faisalabad, Punjab Pakistan. Int. J. Acad. Res. Bus. Soc. Sci. 2019, 9, 16–36. [Google Scholar] [CrossRef]
- Lopes, N.V.M.; Farooq, S. Smart City Governance Model for Pakistan. Smart Governance for Cities: Perspectives and Experiences; Springer International Publishing: New York, NY, USA, 2020; pp. 17–28. [Google Scholar]
- Gilani, H.; Ahmad, S.; Qazi, W.A.; Abubakar, S.M.; Khalid, M. Monitoring of Urban Landscape Ecology Dynamics of Islamabad Capital Territory (ICT), Pakistan, Over Four Decades (1976–2016). Land 2020, 9, 123. [Google Scholar] [CrossRef]
- Shaheen, A.; Sheng, J.; Arshad, S.; Salam, S.; Hafeez, M. The Dynamic Linkage between Income, Energy Consumption, Urbanization and Carbon Emissions in Pakistan. Pol. J. Environ. Stud. 2019, 29, 267–276. [Google Scholar] [CrossRef]
- Nisar, A.; Akram, A.; Hussain, H. Determinants of internal migration in Pakistan. J. Commer. 2013, 5, 32. [Google Scholar]
- Zaman, H.M.; Saqib, Z.; Bokhari, A.S.; Akhtar, N.; Amir, S. The Dynamics Of Urbanizations And Concomitant Land Use Land Cover Transformations In Planned And Quasi-Planned Urban Settlements Of Pakistan. Geogr. Environ. Sustain. 2020, 13, 107–120. [Google Scholar] [CrossRef]
- Atif, S.; Saqib, Z.; Ali, A.; Zaman, M.; Akhtar, N.; Fatima, H.; Atif, M.; Farooqi, S. Identification of key-trends and evaluation of contemporary research regarding urban ecosystem services: A path towards socio-ecological sustainability of urban areas. Appl. Ecol. Environ. Res. 2018, 16, 3545–3581. [Google Scholar] [CrossRef]
- Atif, S.B.; Saqib, Z.; Ali, A.; Zaman, M.H. The impacts of socio-economic factors on the perception of residents about urban vegetation: A comparative study of planned versus semi-planned cities of Islamabad and Rawalpindi, Pakistan. Appl. Ecol. Environ. Res. 2018, 16, 4265–4287. [Google Scholar] [CrossRef]
- La Rosa, D.; Wiesmann, D. Land cover and impervious surface extraction using parametric and non-parametric algorithms from the open-source software R: An application to sustainable urban planning in Sicily. GIScience Remote Sens. 2013, 50, 231–250. [Google Scholar] [CrossRef]
- Khalil, R.Z. InSAR coherence-based land cover classification of Okara, Pakistan. Egypt. J. Remote Sens. Space Sci. 2017. [Google Scholar] [CrossRef]
- El-Kawy, O.A.; Rød, J.K.; Ismail, H.; Suliman, A. Land use and land cover change detection in the western Nile delta of Egypt using remote sensing data. Appl. Geogr. 2011, 31, 483–494. [Google Scholar] [CrossRef]
- Naqvi, H.R.; Siddiqui, L.; Devi, L.M.; Siddiqui, M.A. Landscape transformation analysis employing compound interest formula in the Nun Nadi Watershed, India. Egypt. J. Remote Sens. Space Sci. 2014, 17, 149–157. [Google Scholar] [CrossRef][Green Version]
- Shalaby, A.; Tateishi, R. Remote sensing and GIS for mapping and monitoring land cover and land-use changes in the Northwestern coastal zone of Egypt. Appl. Geogr. 2007, 27, 28–41. [Google Scholar] [CrossRef]
- Rawat, J.; Kumar, M. Monitoring land use/cover change using remote sensing and GIS techniques: A case study of Hawalbagh block, district Almora, Uttarakhand, India. Egypt. J. Remote Sens. Space Sci. 2015, 18, 77–84. [Google Scholar] [CrossRef]
- Hegazy, I.R.; Kaloop, M.R. Monitoring urban growth and land use change detection with GIS and remote sensing techniques in Daqahlia governorate Egypt. Int. J. Sustain. Built Environ. 2015, 4, 117–124. [Google Scholar] [CrossRef]
- Hassan, Z.; Shabbir, R.; Ahmad, S.S.; Malik, A.H.; Aziz, N.; Butt, A.; Erum, S. Dynamics of land use and land cover change (LULCC) using geospatial techniques: A case study of Islamabad Pakistan. SpringerPlus 2016, 5, 1–11. [Google Scholar] [CrossRef]
- Butt, A.; Shabbir, R.; Ahmad, S.S.; Aziz, N. Land use change mapping and analysis using Remote Sensing and GIS: A case study of Simly watershed, Islamabad, Pakistan. Egypt. J. Remote Sens. Space Sci. 2015, 18, 251–259. [Google Scholar] [CrossRef]
- Shah, A.; Ali, K.; Nizami, M. Four Decade Land Degradation in Capital City of Islamabad Pakistan during 2017–2019—A Comparative Assessment. Authorea 2020. [Google Scholar] [CrossRef]
- Climate-Data.org. Rawalpindi, Pakistan. Available online: https://en.climate-data.org/asia/pakistan/punjab/rawalpindi-1009/#climate-graph (accessed on 16 August 2018).
- Rasul, G.; Sixiong, Z.; Qingcun, Z. A diagnostic study of record heavy rain in twin cities Islāmābad-Rāwalpindi. Adv. Atmos. Sci. 2004, 21, 976–988. [Google Scholar] [CrossRef]
- Köppen, W.; Volken, E.; Brönnimann, S. The thermal zones of the earth according to the duration of hot, moderate and cold periods and to the impact of heat on the organic world (Translated from: Die Wärmezonen der Erde, nach der Dauer der heissen, gemässigten und kalten Zeit und nach der Wirkung der Wärme auf die organische Welt betrachtet, Meteorol Z 1884, 1, 215–226). Meteorol. Z. 2011, 20, 351–360. [Google Scholar]
- Hussain, S.; Xianfang, S.; Hussain, I.; Jianrong, L.; Mei, H.D.; Hu, Y.L.; Huang, W. Controlling Factors of the Stable Isotope Composition in the Precipitation of Islamabad, Pakistan. Adv. Meteorol. 2015, 2015, 817513. [Google Scholar] [CrossRef]
- Amir, S.; Saqib, Z.; Khan, M.I.; Khan, M.A.; Bokhari, S.A.; Zaman-ul-Haq, M.; Majid, A. Farmers’ perceptions and adaptation practices to climate change in rain-fed area: A case study from district Chakwal, Pakistan. Pak. J. Agric. Sci. 2020, 57, 465–475. [Google Scholar]
- Maria, S.I.; Imran, M. Planning of Islamabad and Rawalpindi: What Went Wrong. 2009. Available online: http://www.isocarp.net/Data/case_studies/720.pdf (accessed on 1 December 2021).
- Ruback, R.B.; Begum, H.A.; Tariq, N.; Kamal, A.; Pandey, J. Reactions to environmental stressors: Gender differences in the slums of Dhaka and Islamabad. J. Cross-Cult. Psychol. 2002, 33, 100–119. [Google Scholar] [CrossRef]
- Shetty, S. Analysis of Machine Learning Classifiers for LULC Classification on Google Earth Engine. Master’s Thesis, University of Twente, Enschede, The Netherlands, March 2019. [Google Scholar]
- Pimple, U.; Simonetti, D.; Sitthi, A.; Pungkul, S.; Leadprathom, K.; Skupek, H.; Som-Ard, J.; Gond, V.; Towprayoon, S. Google Earth Engine Based Three Decadal Landsat Imagery Analysis for Mapping of Mangrove Forests and Its Surroundings in the Trat Province of Thailand. J. Comput. Commun. 2018, 6, 247–264. [Google Scholar] [CrossRef]
- Pimple, U.; Sitthi, A.; Simonetti, D.; Pungkul, S.; Leadprathom, K.; Chidthaisong, A. Topographic Correction of Landsat TM-5 and Landsat OLI-8 Imagery to Improve the Performance of Forest Classification in the Mountainous Terrain of Northeast Thailand. Sustainability 2017, 9, 258. [Google Scholar] [CrossRef]
- Olofsson, P.; Foody, G.M.; Herold, M.; Stehman, S.V.; Woodcock, C.E.; Wulder, M.A. Good practices for estimating area and assessing accuracy of land change. Remote Sens. Environ. 2014, 148, 42–57. [Google Scholar] [CrossRef]
- Map Accuracy Assessment and Area Estimation. In A Practical Guide; FAO: Roma, Italy, 2016; 69p.
- Kolios, S.; Stylios, C.D. Identification of land cover/land use changes in the greater area of the Preveza peninsula in Greece using Landsat satellite data. Appl. Geogr. 2013, 40, 150–160. [Google Scholar] [CrossRef]
- Scaramuzza, P.L.; Bouchard, M.; Dwyer, J. Development of the Landsat Data Continuity Mission Cloud-Cover Assessment Algorithms. IEEE Trans. Geosci. Remote Sens. 2011, 50, 1140–1154. [Google Scholar] [CrossRef]
- Roy, D.P.; Wulder, M.A.; Loveland, T.R.; Woodcock, C.E.; Allen, R.G.; Anderson, M.C.; Helder, D.; Irons, J.R.; Johnson, D.M.; Kennedy, R.; et al. Landsat-8: Science and product vision for terrestrial global change research. Remote Sens. Environ. 2014, 145, 154–172. [Google Scholar] [CrossRef]
- Yao, F.; Wang, C.; Dong, D.; Luo, J.; Shen, Z.; Yang, K. High-Resolution Mapping of Urban Surface Water Using ZY-3 Multi-Spectral Imagery. Remote Sens. 2015, 7, 12336–12355. [Google Scholar] [CrossRef]
- Haas, J.; Ban, Y. Mapping and Monitoring Urban Ecosystem Services Using Multitemporal High-Resolution Satellite Data. IEEE J. Sel. Top. Appl. Earth Obs. Remote Sens. 2016, 10, 669–680. [Google Scholar] [CrossRef]
- Lawrence, R.L.; Wright, A. Rule-based classification systems using classification and regression tree (CART) analysis. Photogramm. Eng. Remote Sens. 2001, 67, 1137–1142. [Google Scholar]
- Foody, G.M.; Mathur, A. Toward intelligent training of supervised image classifications: Directing training data acquisition for SVM classification. Remote Sens. Environ. 2004, 93, 107–117. [Google Scholar] [CrossRef]
- Shao, Y.; Lunetta, R.S. Comparison of support vector machine, neural network, and CART algorithms for the land-cover classification using limited training data points. ISPRS J. Photogramm. Remote Sens. 2012, 70, 78–87. [Google Scholar] [CrossRef]
- Magidi, J.; Nhamo, L.; Mpandeli, S.; Mabhaudhi, T. Application of the Random Forest Classifier to Map Irrigated Areas Using Google Earth Engine. Remote Sens. 2021, 13, 876. [Google Scholar] [CrossRef]
- Ma, L.; Liu, Y.; Zhang, X.; Ye, Y.; Yin, G.; Johnson, B.A. Deep learning in remote sensing applications: A meta-analysis and review. ISPRS J. Photogramm. Remote Sens. 2019, 152, 166–177. [Google Scholar] [CrossRef]
- Shih, H.-C.; Stow, D.A.; Tsai, Y.H. Guidance on and comparison of machine learning classifiers for Landsat-based land cover and land use mapping. Int. J. Remote Sens. 2018, 40, 1248–1274. [Google Scholar] [CrossRef]
- Maxwell, A.E.; Warner, T.A.; Fang, F. Implementation of machine-learning classification in remote sensing: An applied review. Int. J. Remote Sens. 2018, 39, 2784–2817. [Google Scholar] [CrossRef]
- Camps-Valls, G.; Benediktsson, J.A.; Bruzzone, L.; Chanussot, J. Introduction to the Issue on Advances in Remote Sensing Image Processing. IEEE J. Sel. Top. Signal. Process. 2011, 5, 365–369. [Google Scholar] [CrossRef]
- Pontius Jr, R.G.; Peethambaram, S.; Castella, J.-C. Comparison of three maps at multiple resolutions: A case study of land change simulation in Cho Don District, Vietnam. Ann. Assoc. Am. Geogr. 2011, 101, 45–62. [Google Scholar] [CrossRef]
- Malaviya, S.; Munsi, M.; Oinam, G.; Joshi, P.K. Landscape approach for quantifying land use land cover change (1972–2006) and habitat diversity in a mining area in Central India (Bokaro, Jharkhand). Environ. Monit. Assess. 2009, 170, 215–229. [Google Scholar] [CrossRef] [PubMed]
- Gaglio, M.; Aschonitis, V.G.; Gissi, E.; Castaldelli, G.; Fano, E.A. Land use change effects on ecosystem services of river deltas and coastal wetlands: Case study in Volano–Mesola–Goro in Po river delta (Italy). Wetl. Ecol. Manag. 2016, 25, 67–86. [Google Scholar] [CrossRef]
- Owojori, A.; Xie, H. Landsat image-based LULC changes of San Antonio, Texas using advanced atmospheric correction and object-oriented image analysis approaches. In Proceedings of the 5th International Symposium on Remote Sensing of Urban Areas, Tempe, AZ, USA, 14–16 March 2005. [Google Scholar]
- Qasim, M.; Anees, M.; Ghani, M.; Malik, J.; Khalid, M.; Bashir, A. Environment degradation cause by urbanization in Pakistan (A Review Paper). Bull. Energy Economics. 2014, 2, 62–71. [Google Scholar]
- Sohail, M.T.; Mahfooz, Y.; Azam, K.; Yat, Y.; Genfu, L.; Fahad, S. Impacts of urbanization and land cover dynamics on underground water in Islamabad, Pakistan. Desalination Water Treat. 2019, 159, 402–411. [Google Scholar] [CrossRef]
- Liu, Y.; Din, S.U.; Jiang, Y. Urban growth sustainability of Islamabad, Pakistan, over the last 3 decades: A perspective based on object-based backdating change detection. GeoJournal 2020, 86, 2035–2055. [Google Scholar] [CrossRef]
- Ali, M.; Khan, S.J.; Aslam, I.; Khan, Z. Simulation of the impacts of land-use change on surface runoff of Lai Nullah Basin in Islamabad, Pakistan. Landsc. Urban. Plan. 2011, 102, 271–279. [Google Scholar] [CrossRef]
- Adeel, M. Methodology for identifying urban growth potential using land use and population data: A case study of Islamabad Zone IV. Procedia Environ. Sci. 2010, 2, 32–41. [Google Scholar] [CrossRef]
- Ali, S.M.; Malik, R.N. Vegetation communities of urban open spaces: Green belts and parks in Islamabad city. Pak. J. Bot 2010, 42, 1031–1039. [Google Scholar]
- Adeel, M. The role of Land Use Policy behind unauthorized spatial expansion in rural areas of Islamabad. In Proceedings of the 46th ISOCARP Congress, Nairobi, Kenya, 19–23 September 2010. [Google Scholar]
- Meyer, W.B. THE OTHER BURGESS MODEL. Urban. Geogr. 2000, 21, 261–270. [Google Scholar] [CrossRef]
- Buhaug, H.; Urdal, H. An urbanization bomb? Population growth and social disorder in cities. Glob. Environ. Chang. 2012, 23, 1–10. [Google Scholar] [CrossRef]
- Khan, A.A.; Arshad, S.; Mohsin, M. Population Growth and Its Impact on Urban Expansion: A Case Study of Bahawalpur, Pakistan. Univers. J. Geosci. 2014, 2, 229–241. [Google Scholar] [CrossRef]
- Sardar, S. Looming urban sprawl and its implications: An overview of South Asian urbanization. Reg. Stud. 2012, 33, 1–21. [Google Scholar]
- Mujeeb, A.; Zubair, A. Resilience, stress, anxiety and depression among internally displaced persons affected by armed conflict. Pak. J. Soc. Clin. Psychol 2012, 9, 20–26. [Google Scholar]
- Yaqub, M. Open Source Architecture: Redefining Residential Architecture in Islamabad. Architecture Thesis, Roger Williams University, Bristol, RI, USA, 2017. [Google Scholar]
- Malik, S.; Wahid, J. Rapid Urbanization: Problems and Challenges for Adequate Housing in Pakistan. J. Sociol. Soc. Work 2014, 2. [Google Scholar] [CrossRef]
- Hassan, J. Environmental Law of Pakistan. Glob. Envtl. L. Ann. 1996, 15. Available online: https://heinonline.org/HOL/LandingPage?handle=hein.journals/gloenvla4&div=5&id=&page= (accessed on 1 December 2021).


| Year | Satellite Sensor | Spatial Resolution | AQ Data | Worldwide Reference System (WAR) | Source |
|---|---|---|---|---|---|
| 1976 | Landsat 2 MSS | 60 m × 60 m | 1976-10-19 | WRS 1: 161/37 | USGS imagery access through the GEE platform |
| 1988 | Landsat 5 TM | 30 m × 30 m | 1988-05-04 | WRS 2: 150/37 | |
| 1995 | Landsat 5 TM | 30 m × 30 m | 1995-11-16 | WRS 2: 150/37 | |
| 2005 | Landsat 7 ETM+ | 30 m × 30 m | 2005-09-16 | WRS 2: 150/37 | |
| 2016 | Landsat 7 ETM+ | 30 m × 30 m | 2016-05-01 | WRS 2: 150/37 |
| Sr. No | Class (Level-1) | Description (Level 2) |
|---|---|---|
| 1 | Cropland | Mostly rain-fed cropping. |
| 2 | Grasses | Natural/manmade grass covers and herbaceous surfaces. |
| 3 | Tree/Forest | The street and park trees, the woodland in the urban and peri-urban fringes of study area. |
| 4 | Shrubs/Tall herbs | Vegetation cover dominated by shrubs/tall herbs. |
| 5 | Bare soil/rocks | Barren lands with extremely low vegetative coverage. |
| 6 | Built-up | The continuous and discontinuous built-up fabric. |
| 7 | Water | The water bodies and water courses in the study area. |
| LULC Class/Year | 1976 | 1988 | 1995 | 2005 | 2016 | |||||
|---|---|---|---|---|---|---|---|---|---|---|
| km2 | % | km2 | % | km2 | % | km2 | % | km2 | % | |
| Cropland | 600.31 | 55.22 | 579.33 | 53.29 | 694.98 | 63.93 | 629.54 | 57.91 | 355.16 | 32.67 |
| Grasses | 54.83 | 5.04 | 90.52 | 8.33 | 47.62 | 4.38 | 47.68 | 4.39 | 146.66 | 13.49 |
| Trees/Forest | 168.53 | 15.50 | 130.86 | 12.04 | 171.48 | 15.77 | 206.77 | 19.02 | 111.61 | 10.27 |
| Shrubs/Tall herbs | 228.81 | 21.05 | 212.57 | 19.55 | 105.04 | 9.66 | 74.53 | 6.86 | 96.45 | 8.87 |
| Bare soil/rocks | 18.02 | 1.66 | 8.66 | 0.80 | 8.39 | 0.77 | 11.12 | 1.02 | 102.43 | 9.42 |
| Built-up | 9.03 | 0.83 | 35.17 | 3.24 | 48.93 | 4.50 | 110.14 | 10.13 | 252.51 | 23.23 |
| Water | 7.63 | 0.70 | 30.05 | 2.76 | 10.72 | 0.99 | 7.38 | 0.68 | 22.35 | 2.06 |
| LULC Class/Year | 1976–2016 | 1976–2016 | 1976–2016 | |||
|---|---|---|---|---|---|---|
| Loss | Gain | Net Change | ||||
| ISB | RWP | ISB | RWP | ISB | RWP | |
| Cropland | −186.34 | −127.21 | 49.44 | 28.53 | −136.9 | −98.68 |
| Grasses | −21.85 | −15.47 | 81.89 | 42.41 | 60.04 | 26.94 |
| Trees/Forest | −67.94 | −40.97 | 44.42 | 17.77 | −23.52 | −23.2 |
| Shrubs/Tall herbs | −122.91 | −70.17 | 46.69 | 23.88 | −76.22 | −46.29 |
| Bare soil/rocks | −6.52 | −8.88 | 61.91 | 31.67 | 55.39 | 22.79 |
| Built-up | −0.14 | −0.11 | 113.84 | 112.78 | 113.7 | 112.67 |
| Water | −0.78 | −0.39 | 8.3 | 6.14 | 7.52 | 5.75 |
Publisher’s Note: MDPI stays neutral with regard to jurisdictional claims in published maps and institutional affiliations. |
© 2022 by the authors. Licensee MDPI, Basel, Switzerland. This article is an open access article distributed under the terms and conditions of the Creative Commons Attribution (CC BY) license (https://creativecommons.org/licenses/by/4.0/).
Share and Cite
Bokhari, S.A.; Saqib, Z.; Amir, S.; Naseer, S.; Shafiq, M.; Ali, A.; Zaman-ul-Haq, M.; Irshad, A.; Hamam, H. Assessing Land Cover Transformation for Urban Environmental Sustainability through Satellite Sensing. Sustainability 2022, 14, 2810. https://doi.org/10.3390/su14052810
Bokhari SA, Saqib Z, Amir S, Naseer S, Shafiq M, Ali A, Zaman-ul-Haq M, Irshad A, Hamam H. Assessing Land Cover Transformation for Urban Environmental Sustainability through Satellite Sensing. Sustainability. 2022; 14(5):2810. https://doi.org/10.3390/su14052810
Chicago/Turabian StyleBokhari, Syed Atif, Zafeer Saqib, Sarah Amir, Salman Naseer, Muhammad Shafiq, Amjad Ali, Muhammad Zaman-ul-Haq, Azeem Irshad, and Habib Hamam. 2022. "Assessing Land Cover Transformation for Urban Environmental Sustainability through Satellite Sensing" Sustainability 14, no. 5: 2810. https://doi.org/10.3390/su14052810
APA StyleBokhari, S. A., Saqib, Z., Amir, S., Naseer, S., Shafiq, M., Ali, A., Zaman-ul-Haq, M., Irshad, A., & Hamam, H. (2022). Assessing Land Cover Transformation for Urban Environmental Sustainability through Satellite Sensing. Sustainability, 14(5), 2810. https://doi.org/10.3390/su14052810