Article

Heavy Metal Distribution in Surface Water and Sediment of Megech River, a Tributary of Lake Tana, Ethiopia

1
Department of Water, Atmosphere and Environment, Institute of Hydrobiology and Aquatic Ecosystem Management, University of Natural Resources and Life Sciences, 1180 Vienna, Austria
2
Department of Biology, College of Natural and Computational Sciences, University of Gondar, Gondar 6200, Ethiopia
3
Wasser Cluster Lunz, Biologische-Station, 3293 Lunz am See, Austria
4
Department of Biology, College of Science, Bahir Dar University, Bahir Dar 6000, Ethiopia
*
Author to whom correspondence should be addressed.
Sustainability 2022, 14(5), 2791; https://doi.org/10.3390/su14052791
Submission received: 5 January 2022 / Revised: 14 February 2022 / Accepted: 16 February 2022 / Published: 27 February 2022

Abstract

:
Excess heavy metal concentrations caused by severe anthropogenic activities are among the major threats of aquatic pollution in developing countries like Ethiopia. So far, there is limited information regarding concentrations of selected toxic heavy metals in the freshwater bodies of northern Ethiopian highlands. Therefore, this study aimed to assess the current status and spatial distributions of heavy metals in water and sediment samples of the Megech River located in the North Gondar zone of the Amhara region from November 2018 to January 2019. Six different sampling sites (M1–M6) were identified based on the anthropogenic influence. A total of 30 water and 30 sediment samples were collected along the course of the river. Results revealed that concentrations of Cu (0.11 to 0.17 mg L−1), Zn (0.11 to 0.16 mg L−1) and Cr (0.03–0.05 mg L−1) in the water were within international guidelines for domestic use. In the sediment, maximum concentrations of heavy metals detected at site M2 were within the recommended sediment quality guideline for aquatic systems. Generally, higher concentrations of heavy metals were observed at sites with higher anthropogenic activity (M2). Therefore, continuous monitoring and seasonal studies with representative samples including benthic organisms and macrophytes are needed to quantify the impact on downstream sections.

1. Introduction

Contamination of aquatic systems with excess concentrations of heavy metals has received greater attention and has become a major ecological and public health issue across the globe [1,2,3,4,5]. The adverse effects of low-level exposure together with their nondegradable nature heighten the toxicity of heavy metals in aquatic environments, especially over long periods. The consequence is disturbances of the natural ecological balance and the devastation of flora and fauna [6,7]. As essential macronutrients, ingestion of certain trace metals such as Cu, Mn, Zn, Fe and Ni at a safe level are important for the normal physiological functioning of plant and animal life. However, their deficit or excess could cause several disorders [8,9]. In contrast, other heavy metals including Hg, Pb, Cd and Cr are detrimental to plant and animal health even when present in minute amounts [1,10,11,12].
Numerous sources of heavy metal pollution in aquatic systems include weathering of rocks, volcanic eruptions, point and nonpoint sources of pollutants such as leaching from urban and agricultural runoff, improper sewage and industrial effluent removal, and production and use of compounds containing metals are among the main causes [5,10,11,12]. Anthropogenic sources are believed to deliver enormous quantities of heavy metals into aquatic systems [4,8,13].
Open water systems such as rivers and lakes are more vulnerable to heavy metal contamination caused by anthropogenic activities [14]. In addition to water monitoring, monitoring of heavy metal pollution in aquatic sediment can easily provide detailed insight into the long-term state of pollution in the aquatic system and its influence within the catchment [1,4,5]. Factors including low solubility of metals in water, organic matter and mineral content of the sediment, as well as adsorption and association of metals with the sediment highly influence the availability of heavy metals in the water, making the sediment either a sink or a source [1,4]. For example, heavy metals that bind to clay and sand particles are more highly available than heavy metals bound to sulfides and iron. The availability of heavy metals in aquatic systems is also highly influenced by physico-chemical parameters such as pH and redox potential either through reshuffling of metals bound to carbonates or mobilizing from sediment to water or vice versa [15].
Ecological risk indices such as geo-accumulation index (Igeo), contamination factor (CF), pollution load index (PLI) and others are essential to distinguish the natural and anthropogenic sources of heavy metals and to determine the extent of the ecological risk by providing a robust and reliable result [16]. The ecological and health-related impacts of heavy metal pollution are alarming in developing countries including Ethiopia where aquatic ecosystems receive about 80% of untreated wastewater due to the absence or inefficiency of treatment plants [5,10,17]. Although Ethiopia is endowed with a huge amount of water bodies (12 river basins with a mean annual flow of 122 billion metric cubes and more than 36 lakes), making the country water tower of East Africa, currently the country is suffering from environmental and water pollution due to high organic matter input and excess heavy metal concentrations [18,19,20,21].
Numerous factors can affect heavy metal concentrations in Ethiopian water bodies. These include various anthropogenic activities such as land use, urbanization [22,23], human settlement and industrial activities with poor waste management practices [4,5], which are associated with rapid population growth [21,24,25,26]. These factors combined with environmental and hydrological variations [22,27] can threaten water quality as well as biodiversity due to their profound effect on excess heavy metal concentrations.
Numerous research findings are available on the assessment of heavy metals from water and sediments of Ethiopian rift valley lakes and their tributaries [1,4,5,17]. However, there is no detailed and systematic study on the quantification of heavy metals from surface water and sediments of the Megech River along its course. Although water quality monitoring using a conventional approach to qualitative analysis is essential in early detections of physico-chemical pollutant sources, not a full set of sophisticated equipment was available for this study [27]. Therefore, the purpose of this study was to determine the current status and longitudinal spatial variability in concentrations of heavy metals from surface water and sediment of the Megech River and to provide clear and firsthand information for researchers, policy makers and government officers in legislation and implementations of water quality monitoring programs.

2. Materials and Methods

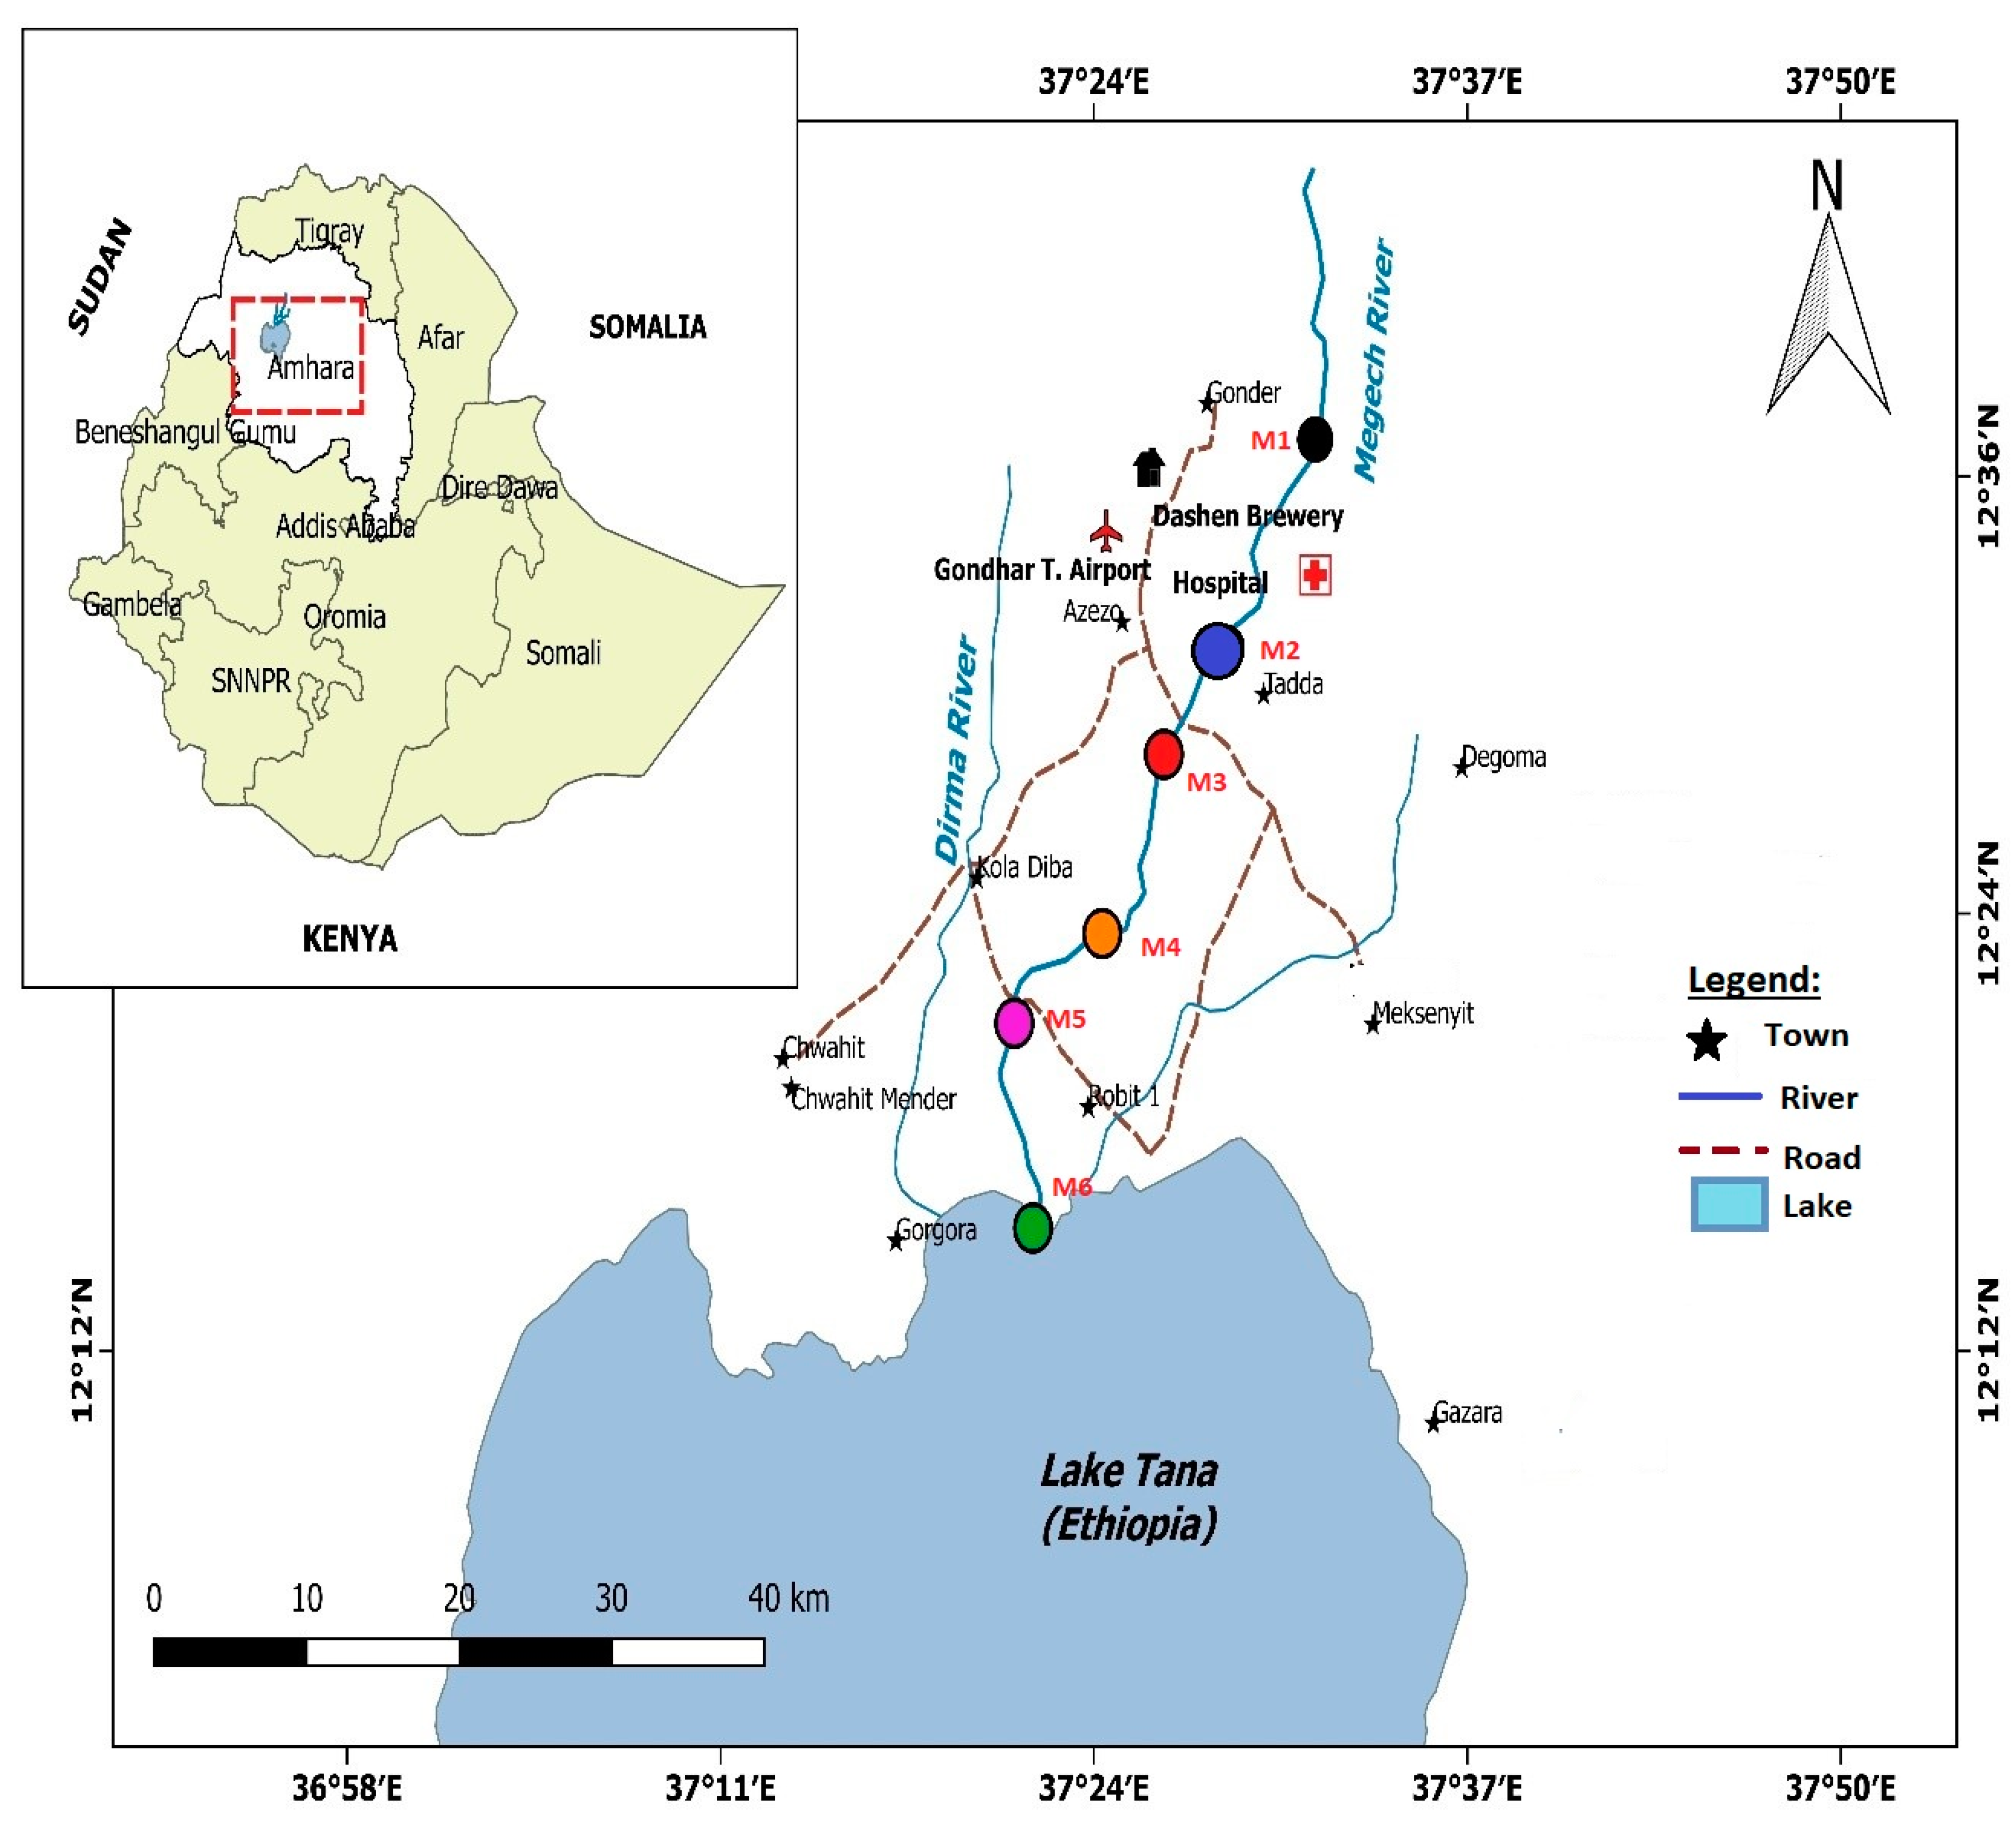
2.1. Description of the Study Area

Megech River is one of the major tributaries of Lake Tana, located in the Northern highlands of Ethiopia between 12°43′40″ N–37°23′53″ E and 12°14′ N−37°18′ E at an altitude range of 1848 to 2942 m above sea level (m.a.s.l.) (Figure 1). The river is about 80 to 90 km in length and the catchment covers about 513 km2 [22,28]. Annual rainfall of the area ranged between 896 mm to 1592 mm with monthly maximum and minimum temperature range of 21 to 27 °C and 10 to 13 °C, respectively. The area exhibits ‘tropical highland monsoon’ climatic condition with a single rainy season between June and September [23]. During the rainy season, the Megech River attains an average width of 10–15 m and average depth of 1.5–2.5 m while flowing through Dembya plain until it drains into Lake Tana [26,29,30]. Anthropogenic activities in and around the basin include intensive farming, pastoral activities, urban settlement (with poor and limited habits of wastewater collection and treatment), dam construction (which disrupts continuum of water flow) and water abstraction [23].

2.2. Sampling Site Selection

Water and surface sediment samples were collected from six different sampling sites along the course of the river (Figure 1). Sampling sites were identified based on their closeness to human interference (anthropogenic activity) and pollution potentials of the area. The first sampling site M1 was located upstream from Gondar city close to Angereb and can be seen as our reference site because it has the lowest anthropogenic influence. The second sampling site M2 was next to Gondar city after the city wastewater entered the river, and the third sampling site M3 was at Tseda town downstream from the irrigation dam construction works. The fourth and fifth sampling site M4 and M5 were at Sufankera and Robit area, respectively, where there is intensive agriculture of Dembya wereda. The last sampling site M6 was at Achera; littoral region of Lake Tana, dominated by the invasive weed, water hyacinth [30].

2.3. Sample Collection

A total of 30 water samples were collected 5 times every 10 days from 15 November 2018 to 7 January 2019. During sampling, replicate water samples were collected across the width of the river, 10–20 cm deep from the surface, 30 cm from left and right bank, at a distance of 50 cm interval on each sampling site. Replicate water samples were homogenized in a single container to have one composite sample per site. Composite water samples were filtered through 0.47 µm glass microfiber filter (GFF) using a 300 mL vacuum hand filter and collected in pre-cleaned (using 10% H2SO4, rinsed with HNO3 and distilled water) plastic bottles. The filtered water samples were kept in a cool box until transportation to Blue Nile research laboratory at Bahir Dar University for analysis. For sediment heavy metal analysis, a total of 30 fine sediment samples of approximately 500 g each were collected from six sampling sites with the use of a stainless-steel trowel. Five replicates were taken from the same sampling site at a distance of 1 m. Large impurities including plastics, big stones, plant materials, and others were separated [1]. All the collected sediment samples were immediately wrapped with plastic bags and stored in a cool box until reaching the laboratory.

2.3.1. Environmental Variables

Physico-chemical parameters of water such as temperature (Temp), pH, dissolved oxygen (DO), electrical conductivity (EC) and turbidity (Tur) were measured in situ using multi-meter probe (HQ40d, model 10115, Hach, Vienna, Austria) in triplicate prior to collecting water and sediment samples.

2.3.2. Sample Digestion and Analysis

For the digestion of water and sediment samples, optimization of the analytical standards [31] and literature materials [11,32] were used. During the optimization process, the volume of chemical mixture ratio, the clearness of the solution and time were all considered.

2.4. Heavy Metals from Water

Heavy metals from filtered water samples were analyzed following aqueous sample digestion procedures where 100 mL of well mixed sample was transferred to a 250 mL conical flask. The contents were digested by adding 3.0 mL HNO3 (70%) for 1 h at 120 °C; the content was then cooled for 5 min and additional 3 mL HNO3 was added. Digestion continued for 40 min at 180 °C. After 5 min of further cooling, 10 mL 1:1 HCl was added and digested for 20 min at 240 °C. After digestion was completed, the remaining digestate (approx 20 mL) was cooled. The end volume of the digestate was adjusted to 50 mL and filtered using 0.45 µm Whatman GFF prior to analysis [31,32]. Concentrations were analyzed using Graphite Furnace Atomic Absorption Spectrophotometer (GFAAS, model NOVA300) at Amhara design soil chemistry and water quality laboratory.

2.5. Heavy Metals from Sediment

Digestion of sediment samples was carried out by digesting 1 g of dried and sieved sediment in a 100 mL Erlenmeyer flask using 6.0 mL of HNO3 and 2 mL HClO4. The resulting mixture was heated for 105 min at 180 °C in a fuming hood. Contents were cooled for 5 min and 3 mL of H2O2 was added and heated for 10 min at 240 °C. The digestate produced was dissolved in 10 mL of 30% HNO3 and filtered through Whatman filter paper (pore size 0.45 µm GFF). Finally, heavy metals were analyzed after the end volume of the remaining digestate was adjusted to 50 mL [31,32]. The analysis was conducted using GFAAS (model NOVA300).

2.6. Sediment Pollution Indices

The extent of heavy metal pollution in the sediment samples of Megech River was calculated quantitatively using the geo-accumulation index, contamination factor and pollution load index [33,34,35,36].
Geo-accumulation index was calculated using the following formula [33].
Igeo = log 2 ( C n 1.5 B n ) .
where Igeo is geo-accumulation index; Cn is concentration of the element n in the sediment; Bn is geo-chemical background value which is obtained from reference sites and 1.5 is a constant used to include possible variations due to lithogenic effect. The geo-accumulation index consists of 7 grades; Igeo value of <0, practically unpolluted; >0–1, unpolluted to moderately polluted; >1–2, moderately polluted; >2–3, moderately to strongly polluted; >3–4 strongly polluted; >4–5 strongly polluted and >5 extremely polluted [33,34].
Contamination factor (CF) was determined using the ratio of concentrations of specific heavy metals in the sediment of the environment by the background value of that metal.
C F = [ C m ] [ C b ]
where Cm is concentration of the heavy metal and Cb is the background concentration. The contamination levels may be classified based on their intensities on a scale ranging from 1 to 6 (0 = none, 1 = none to medium, 2 = moderate, 3 = moderately to strong, 4 = strongly polluted, 5 = strong to very strong, 6 = very strong [35].
Pollution load index (PLI) for the entire sediment sampling sites of Megech River was determined using the following formula [36].
P L I = ( n C F 1 + C F 2 + + C F n )
where CF is contamination factor of each heavy metal and n is number of metals
PLI < 1 (Non-polluted); 1 ≤ PLI < 2 (Slight polluted); 2 ≤ PLI < 3 (Moderately polluted); PLI < 3 (Highly polluted).

2.7. Method Performance and Validation

Instrumental Working Conditions

To assure and control quality of data, instrumental working conditions were adjusted to the maximum sensitivity as described by the manufacturer (Table 1). Calibration curves were plotted using standard solutions (all chemicals are purchased from Sigma-Aldrich, Vienna, Austria). Blanks were prepared in each digestion procedure by adding the acids used into the sample to see the level of heavy metals in the acid. Method detection limits (MDL) were determined by treating optimized selected mixture chemicals of (HNO3/H2O2/HClO4) with distilled water (instead of sample), and similar methods were applied as the sample digestion [31]. Finally, method validation of the digestion procedure was determined through spiking experiment, and the percent of recovery was calculated after digesting both spiked and nonspiked samples following the same procedure.
Recovery ( % ) = ( Spiked   sample   Conc .   Unspiked   sample   conc . ) Known   conc . × 100

2.8. Data Analysis

Data recorded from both field and laboratory analysis was summarized using descriptive statistics. After the data was checked for normality using Shapiro–Wilk test, both parametric and nonparametric ANOVA was computed to compare the spatial variation in the concentrations of heavy metals. Principal component analysis (PCA) was performed to identify the most important variables to describe the spatial variation between variables measured at each site. Statistical analysis was done using SPSS (IBM. Version 21.0).

3. Results and Discussion

3.1. Optimization

During optimization, to complete the digestion of water samples, HNO3 (70%) and HCl (30%) in the ratio of 6:10 with a digestion time of 2.2 h at an average temp of 180 °C were optimal. HNO3 (70%), HClO4 (70%) and H2O2 (30%) in the ratio of 6:2:3 with a digestion time of 2.0 h at an average temp of 210 °C were found optimal for digestion of sediment samples. These optimal conditions were selected based on the amount of reagent volume used, minimum digestion time, simplicity and lowest temperature applied to obtain a clear digestate analyte [37].

Method Performance and Validation

In general, recovery for each heavy metal under investigation from spiking experiment ranged from 92.7 to 106.2% where a slightly higher MDL than the instrument was observed. Recovery of the spiking experiment and MDL were used to confirm the validity, precision, linearity and accuracy of the methods applied for heavy metal analysis from water and sediment samples [5]. Instrumental calibration was done using five series of working standards where all the working standards plotted for each metal showed strong coefficient of R2 = 0.999.

3.2. Physico-Chemical Parameters of Megech River

The overall assessment of physico-chemical water quality parameters (Table 2) showed significant spatial variations (p < 0.05). Change in physico-chemical parameters of water such as temp, DO, pH and EC had the potential to influence biogeochemical processes such as sorption, precipitation and solubility of metals in the water column [1,24,38]. The mean surface water temperature ranged from 16.9 to 24.9 °C with an increasing trend from M1 to M6 and was within the normal environmental temperature range of 21–27 °C in the area [29]. Similarly, the observed maximum surface water temperature in this study also falls within the range (25–35 °C) for natural inland water bodies in the tropics [39]. Significant spatial variations observed along the course of the river could be ascribed to canopy cover of vegetation, amount of sunlight, sampling time of the day, substrate composition and heat exchange with the inflow and atmosphere [40].
The observed pH values measured in the water samples were slightly alkaline, ranged from 8.3 to 8.7, and still fell within the acceptable limits of the following different guidelines for drinking (6.5–9.2), livestock watering and irrigation (6.5–9.0) of inland water bodies [41,42,43,44]. The slightly alkaline nature of Ethiopian inland water bodies had been reported by Kassa [45], Mengesha et al. [46] and Wondimu [24], who disclosed a pH of 8.92, 8.2 and 8.4 in littoral area of Lake Tana, Angereb reservoir and Megech River mouth, respectively. The slightly alkaline pH could be attributed to the highest carbonate and bicarbonate depositions in the region [41,42]. DO in the present study ranged between 7.5 and 9.9 mg L−1 and was higher than the WHO minimum acceptable limits for aquatic life and domestic use [43,47,48]. The highest DO value measured at site M1 might indicate relatively low anthropogenic influence and higher atmospheric diffusion. However, the slight decline in the downstream could be associated with the possible entry of oxygen-demanding wastewater from surface runoff and agricultural fields, which promote microbial decomposition [1,41,49].
The Kruskal–Wallis nonparametric ANOVA showed a significant spatial difference (p < 0.05) in EC along the river stretch. The maximum EC measured at site M2 (658.4 µS cm−1) is an indicator for high concentrations of metallic ions or dissolved solids derived from domestic and industrial effluent of Gondar and Azezo towns that enhance ionization of most chemical compounds [1,39,45]. It could possibly be associated with excavation and sand-mining activities, which allow soil particle to dissolve. Conversely, the minimum EC across Megech River was measured at M6, and it could be attributed to filtration and absorption of metal ions by water hyacinth and other aquatic macrophytes [50,51]. Maximum EC observed at site M2 was still within the WHO (2011) acceptable limit of 2500 µS cm−1 for natural inland waters. Turbidity, which is the measure of water clarity, ranged from 52.7 (M6) to 575.0 (M5) NTU along the course of Megech River. The observed higher turbidity at M5 can be attributed to surface runoff and poor farming practice which provoke surface soil erosion [24,45]. Similarly, direct untreated effluent discharge into the river and huge sand-mining activities together with surface runoff due to precipitation seriously influence turbidity of aquatic systems [39].

3.3. Dissolved Heavy Metals Concentrations in Megech River Water

The mean concentration of all dissolved heavy metals analyzed from water samples of the Megech River are presented in Table 3. There is no significant upstream–downstream trend in terms of heavy metal content in water samples of the Megech River, resulting in varying concentrations among sampling sites. The mean concentrations of heavy metals from water samples decreased in the order of Fe > Mn > Cu ≈ Zn > Pb >Cr > Cd. Among the seven heavy metals of concern, Fe and Mn, which may have originated from both natural and anthropogenic sources, were prevalent in all water samples ranging from 2.5 to 7.6 mg L−1 and 0.86 to 4.3 mg L−1, respectively, and were above the maximum permissible limit of standards for drinking water (Table 4). In Ethiopian context particularly in Megech River catchment, urbanization, unbalanced environmental protection together with rapid population growth resulted in limited availability of clean and sanitated potable water where the majority of the population depends on using untreated river water for domestic consumption [25]. Therefore, higher concentration of Fe and Mn in drinking water can bring bad taste and result in different health-related problems such as fatigue, joint pain, tremor, gait disorders, psychological problems and heart diseases [39,51]. Apart from the anthropogenic sources, higher Fe and Mn concentrations could be attributed to the soil geology of the area. Domestic wastewater contaminated with potassium permanganate used as a common household disinfectant might also increase Mn concentration [13].
Concentrations of most common metals in the Earth’s crust especially, Cu (0.11 to 0.17 mg L−1) and Zn (0.11 to 0.16 mg L−1) in the water, did not show significant spatial difference (p > 0.05) and remained below the maximum permissible limits of standards for drinking, irrigation and animal watering [41,42,43]. This is in contrast with previously stated severe anthropogenic activities along the course of the river and is probably associated with low solubility of metals together with the mineral nature of the sediment which leads to adsorption [52] and the absorption of metals by aquatic macrophytes and other riparian vegetation [4,53,54]. In natural waters, Cu and Zn appear during the dissolution of minerals due to redox condition. Cu and Zn are among the essential trace metals and have an important role in the proper functioning of body physiology. However, when consumed in excess, they cause gastrointestinal and cardiac toxicity [52].
The result of the present study disclosed that the presence of Cr and Cd at site M5 and M6, and of Pb at site M5, were not detected in the water sample (Table 4). These undetected amounts observed in the downstream section could be attributed to dilution effect by the high volume of water that masks the local concentration [14,54] and because of the meager solubility of metals due to the formation of complex compounds that bind with organic matter [1]. Although the downstream section receives a continuous input of domestic and industrial wastewater effluents, relatively lower concentrations of heavy metals possibly might be due to absorption by water hyacinth and other riparian aquatic macrophytes which have a tremendous role in wastewater purification [54]. On the other hand, there was no appreciable amount of Cd and Pb detected at any of the sampling sites, but concentrations remained above threshold concentrations for drinking water when detected (Table 4). Chronic exposure of humans to any concentrations of Cr, Cd and Pb leads to several health-related disorders. Higher concentrations of Cd and Pb in aquatic systems could be found adsorbed onto organic substances including humic and detritus materials. Therefore, organic rich untreated domestic and industrial wastewaters coming from the highly populated Megech river catchment could be main sources [52]. In addition, the observed high concentrations of Cd and Pb could be associated with leachates, discarded batteries from garages, car washings and sewages [11].
Generally, concentrations of heavy metals found in the present study are lower than reported values from other Ethiopian inland water bodies [1,4,5,36]. However, concentrations of Fe, Mn, Cd and Pb exceeded permissible limits of different standards [41,42,43] for domestic use. Hence, unless immediate management intervention and monitoring takes place, those metals that surpassed the guideline values could possibly cause health related problems in the vicinity. Because in the downstream section the water from Megech River is used for household consumption, animal watering and irrigation purposes, alarming toxicities associated with low IQ, kidney disorders, high cancer prevalence and teratogenic impacts might occur soon [8,13,52].

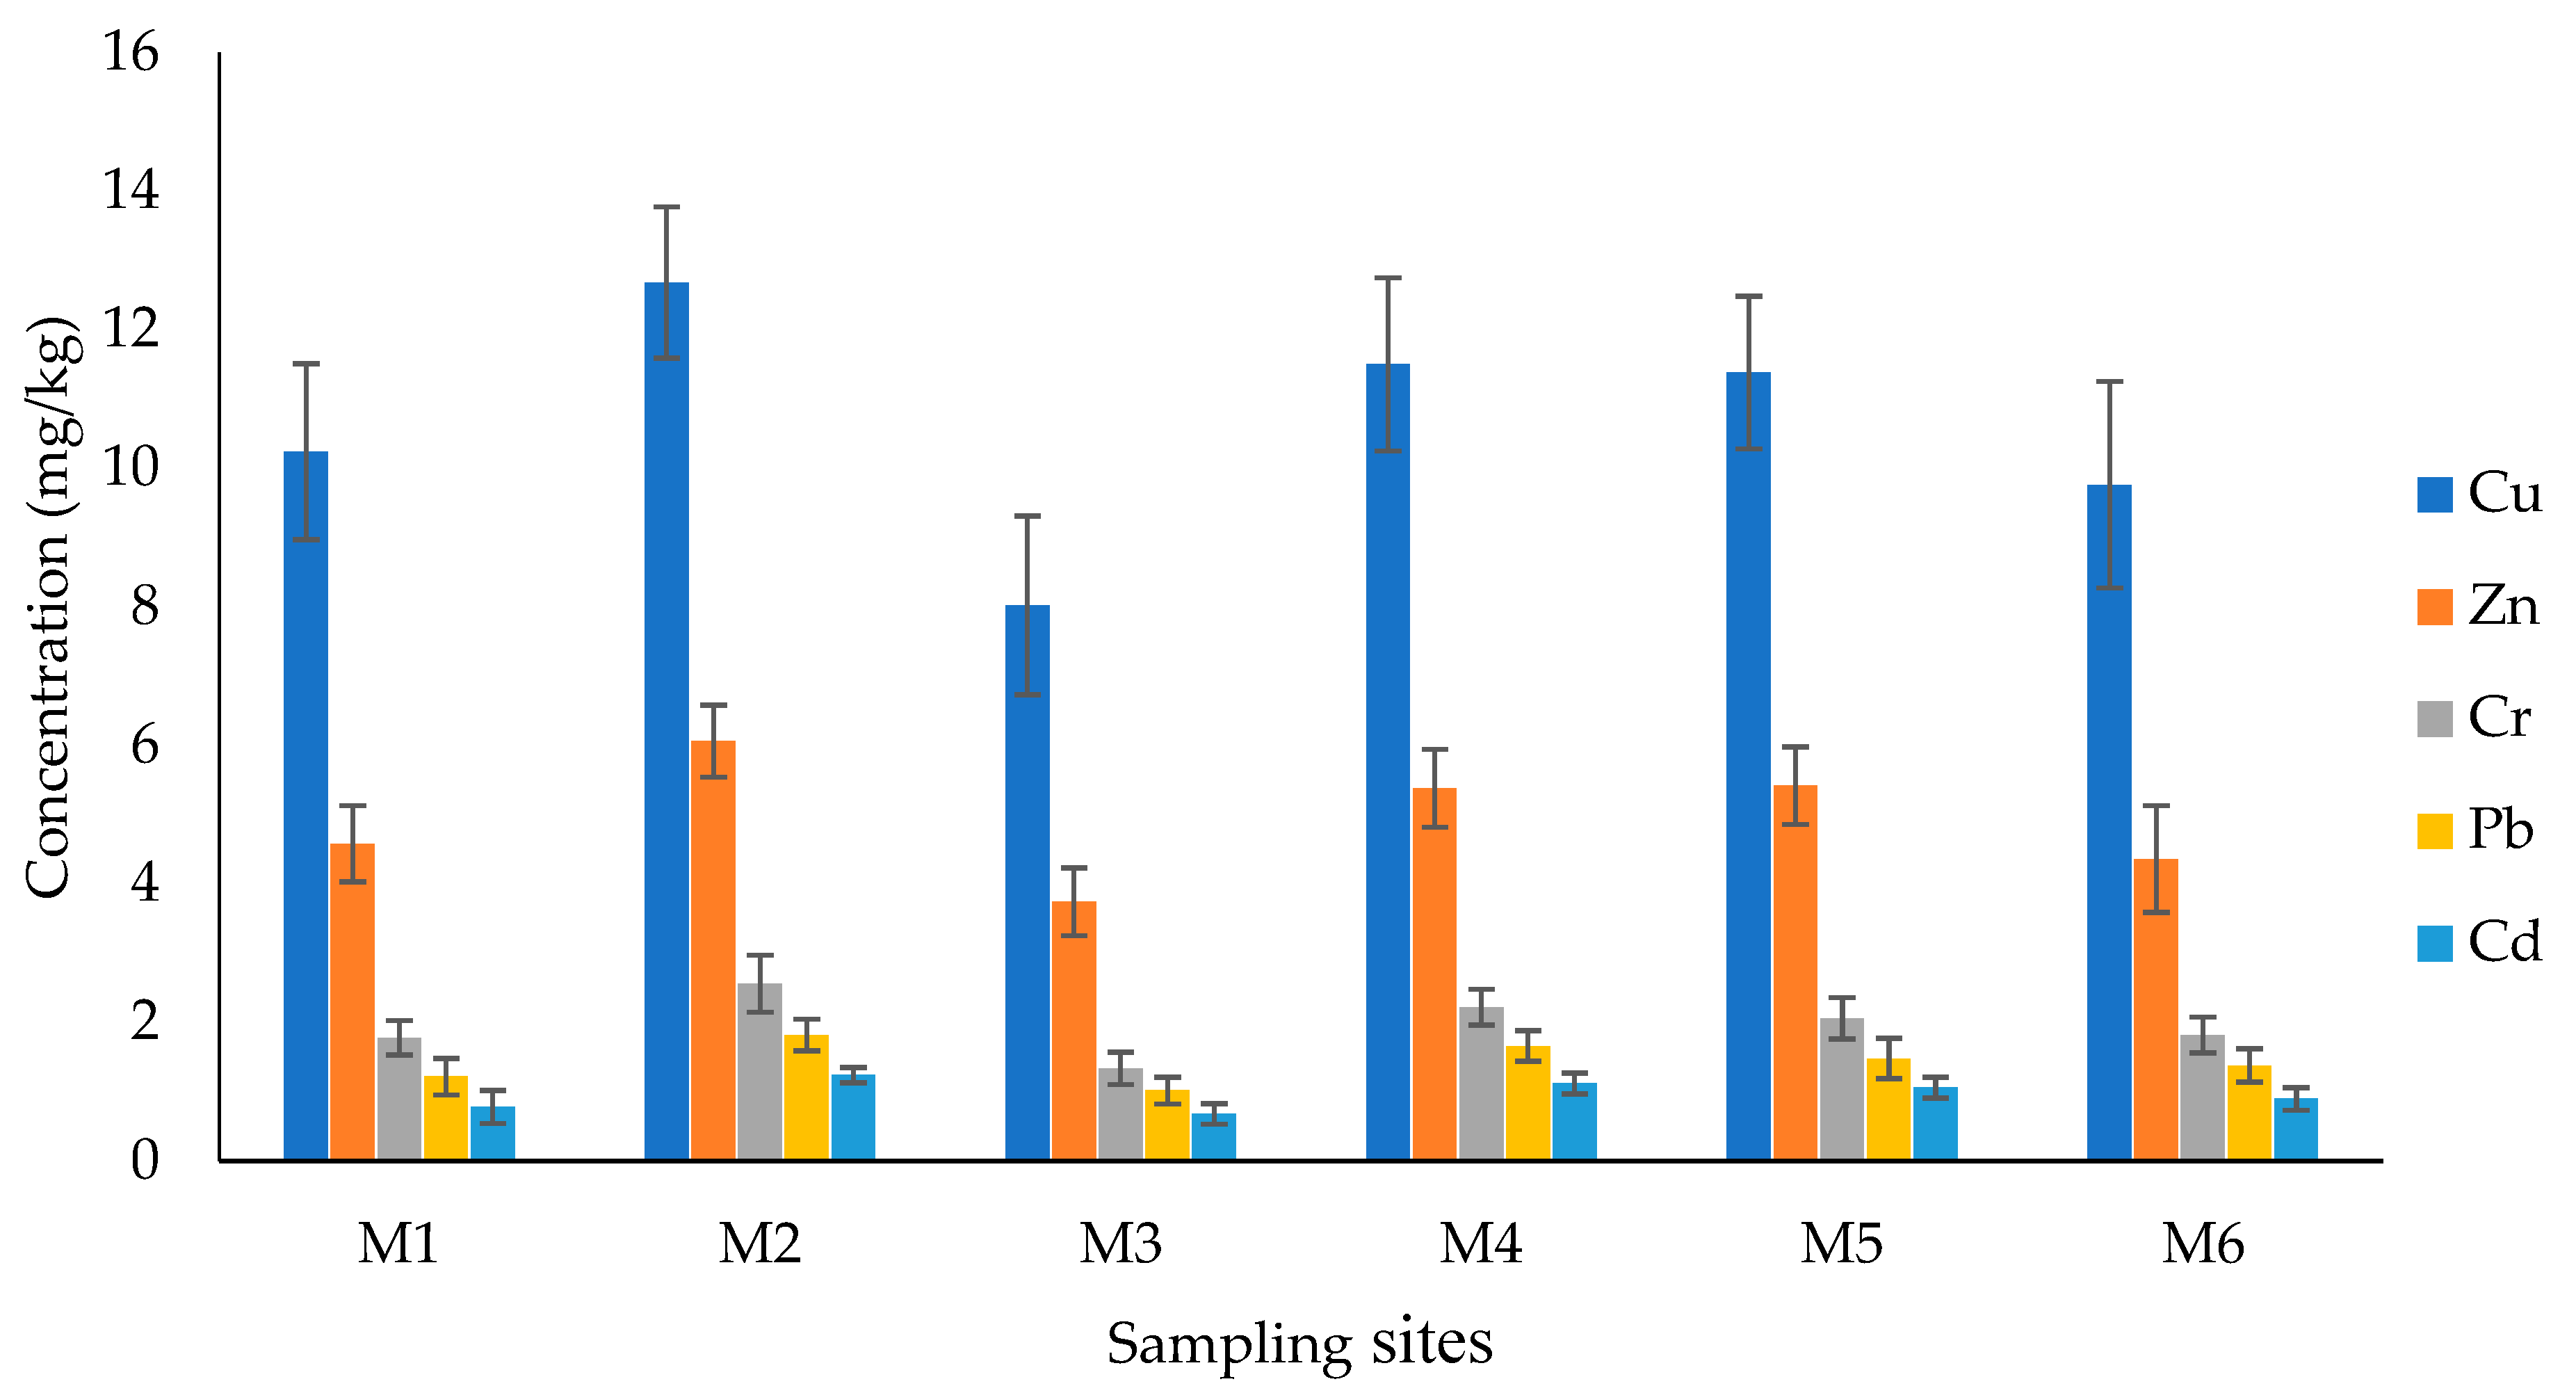
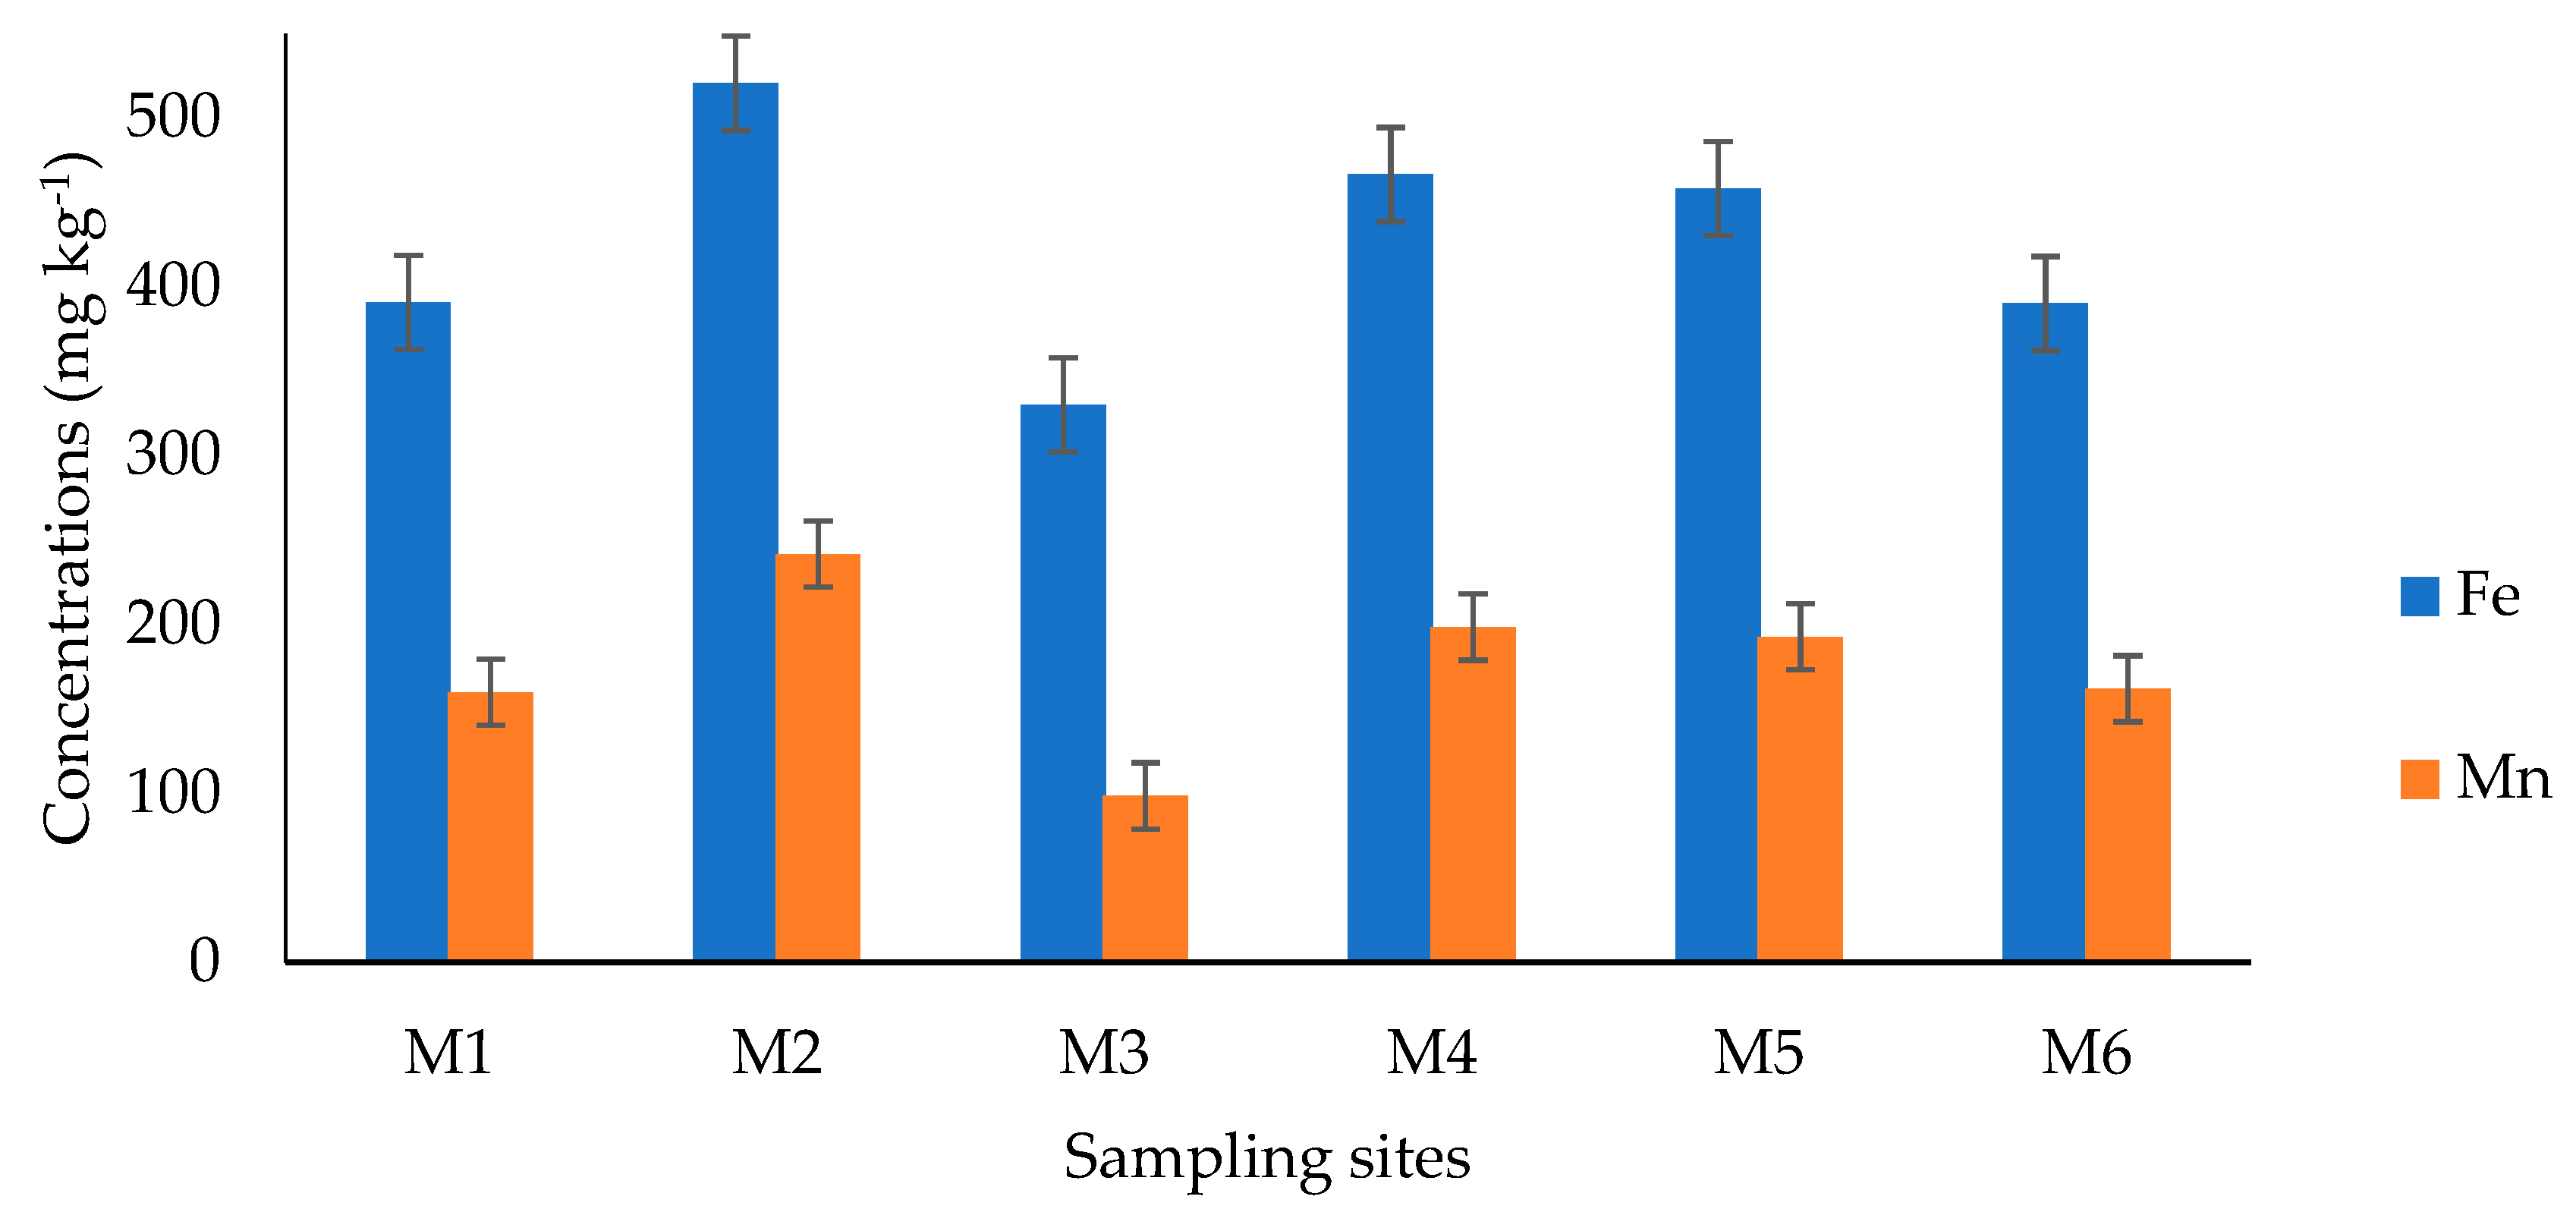
3.4. Heavy Metals Concentrations in the Surface Sediment of Megech River

Distributions of heavy metals in the sediment of Megech River were significantly higher (p < 0.01) than the heavy metals concentration in the surface water samples of the same site (Table 3). Concentrations ranged from 330.1 to 520.6 mg kg−1 for Fe, 98.6 to 241.8 mg kg−1 for Mn, 8.02 to 12.68 mg kg−1 for Cu, 3.74 to 6.06 mg kg−1 for Zn, 1.34 to 2.56 mg kg−1 for Cr, 0.68 to 1.24 mg kg−1 for Cd and 1.02 to 1.82 mg kg−1 for Pb. All the heavy metals analyzed from sediment samples followed the same decreasing order of abundance Fe > Mn > Cu > Zn > Cr > Pb > Cd from upstream to downstream in all sampling sites (Figure 2 and Figure 3).
The highest concentrations of all heavy metals, especially Fe and Mn (Figure 3), analyzed from sediment samples were measured at site M2. This could be ascribed to geological presence and intensive anthropogenic activity including excavation, metal work effluents, garages and open burning of municipal solid waste [4,55,56]. Additionally, other factors including grain size and organic matter content of the sediment also highly affect heavy metals concentrations [1,57]. For example, higher organic matter content and fine-grained sediment resulted in higher adsorption of heavy metals than organic poor and coarse-grained sediments. The statistically significant spatial differences (p < 0.05, Kruskal–Wallis test) in heavy metal concentrations between site M2 and M3 could be attributed to factors including hydrological conditions of the river, chemical characteristics of the element and distance of the metal source and to the site [55].
Concentrations of other toxic heavy metals such as Cu, Zn, Cr, Cd and Pb in the sediment of Megech River were generally higher than the water and did not show consistent upstream–downstream trend. This might be due to variation in availability of point and nonpoint sources of pollutants which is dependent on the association of sediment compounds and metals [1]. In aquatics systems, sediments act as a ready sink or source for heavy metals which can easily disclose the historical pollution trend of the system and the catchment [1,4,15]. In general, lower concentrations of heavy metals were noted in the present study compared to earlier reports from different inland water bodies of Ethiopia such as Lake Awassa, Awash and Akaki rivers [1,4,5]. These heavy metals might form complexes with other organic compounds, making them stable, or heavy metals might have been transported into the downstream section [55].
The mean geo-accumulation index for the extent of heavy metal contamination in the sediment samples suggests that Megech River is unpolluted (Igeo < 0) with Cu, Zn and Cr, whereas Mn and Pb are in the range of unpolluted to moderately polluted (0 < Igeo < 1). The index suggests that the river is moderately polluted with Fe and Cd (1 < Igeo < 2). Apart from being abundant in the earth’s crust, geo-accumulations of Fe and Mn in the sediment of Megech River are influenced by anthropogenic activities. Dumping of sewage sludge and domestic wastes were the major anthropogenic activities along the course of the river [36]. Contaminations of the sediment sample in Megech River was detected at none to medium (0–1) level for Cu, Zn and Cr; at moderate level (2) for Mn and Pb; and at moderate to strong contamination (3) for Fe and Cd. The Cf may be sequenced as Cd > Fe > Pb > Mn > Cu > Cr according to the lithologic background values. Contaminations of Cu, Zn, Fe and Mn ascribed with anthropogenic activities such as fertilizers and pesticides [16]. The overall PLI values from the sediment indicated slight heavy metal pollution (1 ≤ PLI < 2) at each sampling site along the course of the river with the highest value observed at M2.
In order to describe the current pollution status of the systems and their effects on organisms, concentrations of heavy metals from the Megech River were compared with sediment quality guidelines (SQG, mg kg−1) for freshwater systems and other previous reports from different Ethiopian inland water bodies (Table 5). The result indicated that heavy metal levels were lower than the threshold effect concentrations (TEC) and the probable effect concentrations (PEC) [1,4,14]. However, concentrations of heavy metals can easily become higher than the source through gradual accumulation or magnification [58]. In developing countries like Ethiopia where untreated industrial effluents are major sources of pollution to inland waters, continuous and strict measures should be implemented before the situation worsens and affects biota of the catchment.

3.5. Correlation Matrix

Pearson’s correlation coefficients were calculated to determine the inter-relationships among heavy metals in the water and sediment samples together with their possible source, pathway and distribution along the course of the river [3,5]. The correlation matrix of the heavy metals is presented in Table 6. In the water samples, a significant positive correlation was observed between Fe vs. Cr (r = 0.55), Fe vs. Cd (r = 0.52), Cd vs. Cr (r = 0.66); significant negative correlation was found in Fe vs. Cu (r = −0.62) and Fe vs. Mn (r = −0.60). Similarly, heavy metals from sediment samples indicated strong positive correlation between Fe vs. Mn (r = 0.94), Fe vs. Zn (r = 0.95), Cr vs. Mn (r = 0.95), Zn vs. Cu (r = 0.93), Pb vs. Cd (r = 0.92) at significance level of 0.01. This significantly positive correlation indicated that the elements have the same source of origin which could possibly be from municipal wastes, industrial effluents, agricultural inputs and geological sources [3,10,11,12].

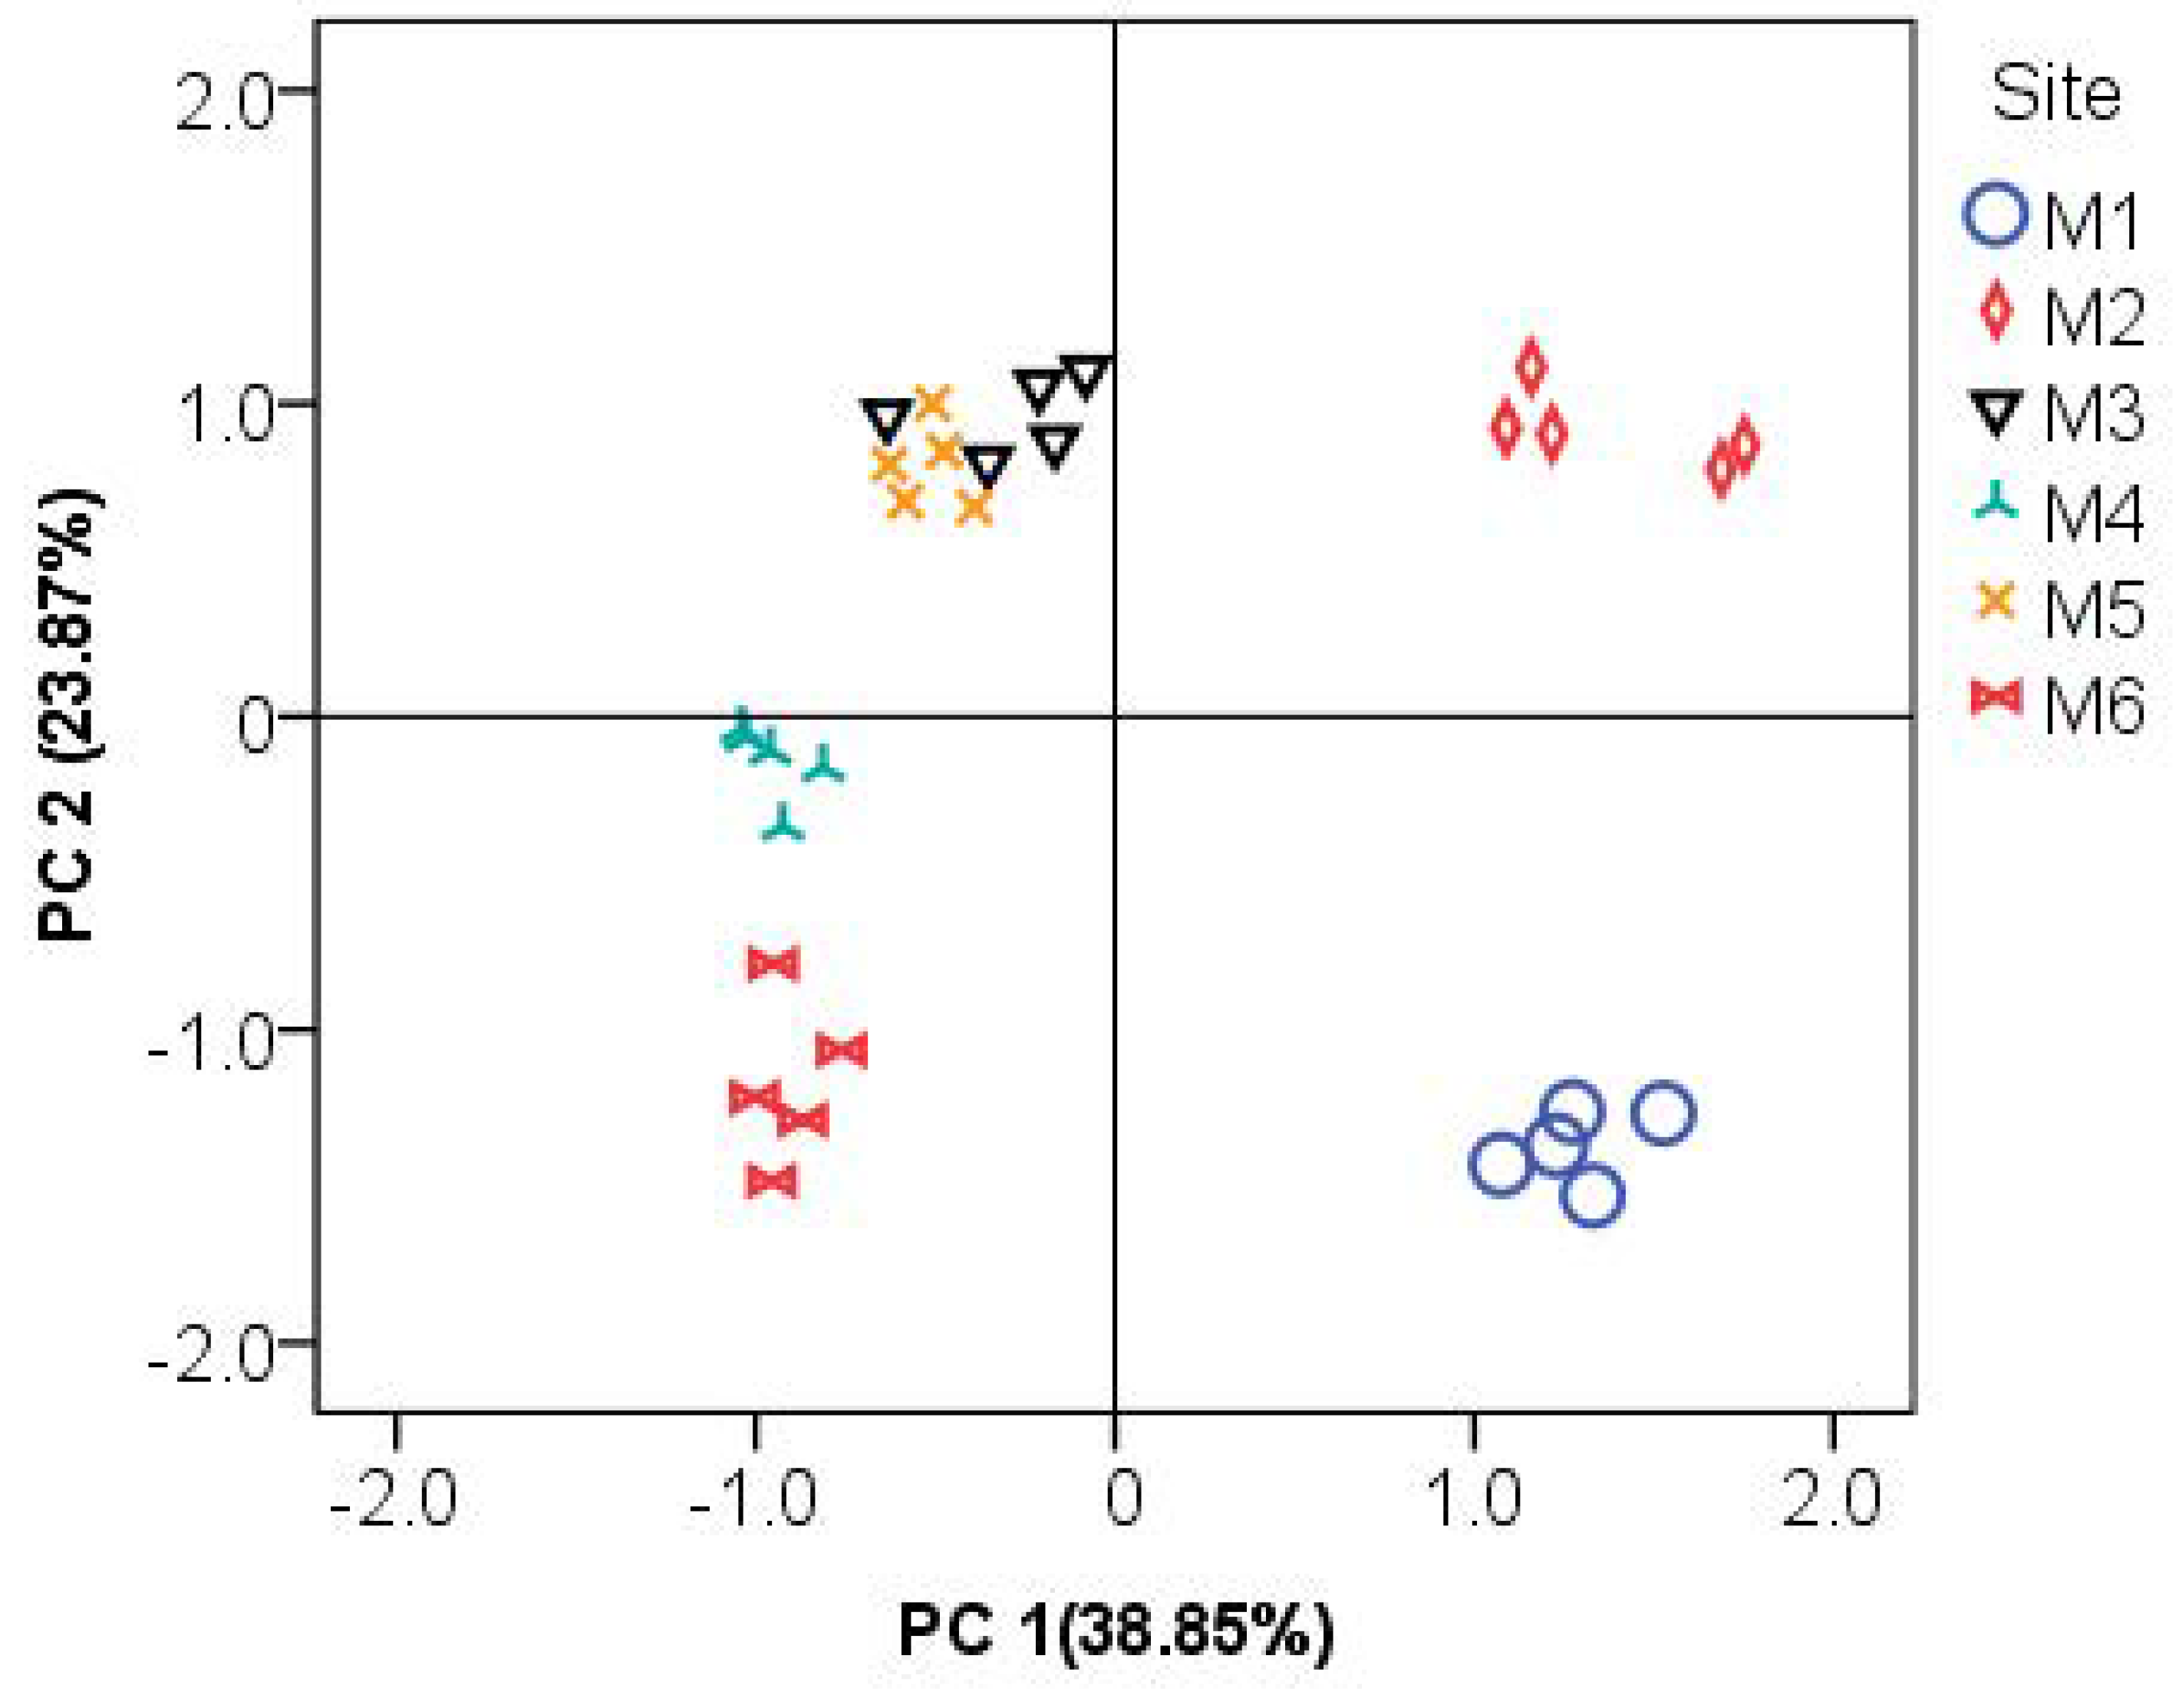
3.6. Principal Component Analysis

To reduce the number of observable variables and to infer the most probable source of heavy metal contamination which could either be anthropogenic or natural [13,54], a principal component analysis (PCA) was computed by combining all the physico-chemical parameters and heavy metals concentrations from both water and sediment samples. The output of PCA indicated that four principal components explained 85.45% of the total variance extracted at eigen values > 1. Total variation by each component includes PC1 = 38.85%, PC2 = 23.87%, PC3 = 12.69% and PC4 = 10.04%. Score plot of the combined PC indicated spatial heterogeneity of water and sediment samples (Figure 4), which could be highly influenced by several point and nonpoint sources such as geochemical composition of the drainage basin, land use and land cover of the surrounding and anthropogenic activities in the vicinity [59,60,61].
In the present study, loading values |>0.5| are considered as most important to the variation. PCA depicted spatial variability of sites owing to higher values of Mn-s (Mn in the sediment), Fe-s (Fe in the sediment) and Zn-s (Zn in the sediment) which had higher loading factors on the first axis. The second component PC2 was mainly explained by some environmental variables from the water (Mn-w, Tur and pH). Eigenvalues, proportions of variance, and loadings for the PC are given in Table 7.

4. Conclusions and Recommendations

External point and nonpoint sources of pollutants, together with anthropogenic activities in the watershed, severely impact the natural conditions of the river. Therefore, industrial and municipal effluents from Gondar and Azezo towns are assumed to be significant causes of pollution. Concentrations of many heavy metals assessed from surface water and sediment samples are below the maximum permissible limits for natural waters as well as below SQG. However, concentrations of Cd and Pb in the water are above the standard for drinking water. Hence, future ecological and health problems are expected. Generally, heavy metal concentrations recorded in the present study are lower than values reported from other Ethiopian water bodies. To mitigate the pollution problem, community-based awareness creation on the values of water bodies, integrated watershed management and continuous monitoring activities are essential to reduce the risk of pollution and its impact on organisms.

Author Contributions

Conceptualization: F.E. and T.H.; Data curation: F.E. and G.B.; Funding: T.H.; Supervision: T.H. and G.B.; Writing-original draft: F.E.; Writing-review and editing: T.H. and G.B. All authors have read and agreed to the published version of the manuscript.

Funding

The research was financially supported by the Austrian Development Cooperation via the project “AQUAHUB Education and research hub for the sustainable management of aquatic systems in Eastern Africa”, project number 0612-00/2018.

Data Availability Statement

The data presented in this study are openly available and accessible upon request via [email protected].

Acknowledgments

The first author acknowledges the NFP (Netherlands fellowship program) and ADC (the Austrian development cooperation).

Conflicts of Interest

The authors declare that they have no known competing financial interest or personal relationship that could have appeared to influence the work reported in this paper.

References

  1. Akele, M.L.; Kelderman, P.; Koning, C.W.; Irvine, K. Trace metal distributions in the sediments of the Little Akaki. River, Addis Ababa, Ethiopia. Environ. Monit. Assess. 2016, 188, 389. [Google Scholar] [CrossRef] [PubMed]
  2. Bennett, M.G.; Schofield, K.A.; Lee, Y.S.; Norton, S.B. Response of chlorophyll a to total nitrogen and total phosphorus concentrations in lotic ecosystems: A systematic review protocol. Environ. Evid. 2017, 6, 18. [Google Scholar] [CrossRef] [PubMed]
  3. Bhuyana, M.S.; Abu-Bakarb, M.; Akhtara, A.; Hossainc, M.B.; Alid, M.M.; Islam, M.S. Heavy metal contamination in surface water and sediment of the Meghna River, Bangladesh. Environ. Nano Technol. Monit. Manag. 2017, 8, 273–279. [Google Scholar] [CrossRef]
  4. Dirbaba, N.B.; Yan, X.; Wu, H.; Colebrooke, L.L.; Wang, J. Occurrences and ecotoxicological risk assessment of heavy metals in surface sediments from Awash River basin, Ethiopia. Water 2018, 10, 535. [Google Scholar] [CrossRef] [Green Version]
  5. Kassegne, A.B.; Esho, T.B.; Okonkwo, J.O.; Asfaw, S.L. Distribution and ecological risk assessment of trace metals in surface sediments from Akaki River catchment and Aba Samuel reservoir, central Ethiopia. Environ. Syst. Res. 2018, 7, 24. [Google Scholar] [CrossRef] [Green Version]
  6. Kerketta, P.; Baxla, S.L.; Gora, R.H.; Kumari, S.; Roushan, R.K. Analysis of physico-chemical properties and heavy metals in drinking water from different sources in and around Ranchi, Jharkhand, India. Vet. World 2013, 6, 370–375. [Google Scholar] [CrossRef]
  7. Pigłowski, M. Heavy metals in notifications of rapid alert system for food and feed. Int. J. Environ. Res. Public Health 2018, 15, 365. [Google Scholar] [CrossRef] [Green Version]
  8. Tchounwou, P.B.; Yedjou, C.G.; Patlolla, A.K.; Sutton, D.J. Heavy Metal Toxicity and the Environment. Mol. Clin. Environ. Toxicol. 2012, 101, 133–164. [Google Scholar] [CrossRef] [Green Version]
  9. Jan, A.T.; Azam, M.; Siddiqui, K.; Ali, A.; Choi, I.; Haq, Q.R. Heavy metals and human health: Mechanistic insight into toxicity and counter defence system of antioxidants. Int. J. Mol. Sci. 2015, 16, 29592–29630. [Google Scholar] [CrossRef] [Green Version]
  10. Saha, P.; Paul, B. Assessment of heavy metal pollution in water resources and their impacts: A Review. J. Basic Appl. Eng. Res. 2016, 3, 671–675. Available online: http://www.krishisanskriti.org/Publication.html (accessed on 27 July 2021).
  11. Gebreyohannes, F.; Gebrekidan, A. Health risk assessment of heavy metals via consumption of spinach vegetable grown in Elalla River. Bull. Chem. Soc. Ethiop. 2018, 32, 65–75. [Google Scholar] [CrossRef]
  12. Showqi, I.; Lone, F.A.; Naikoo, M. Preliminary assessment of heavy metals in water, sediment and macrophyte (Lemna minor) collected from Anchar Lake, Kashmir, India. Appl. Water Sci. 2018, 8, 80. [Google Scholar] [CrossRef] [Green Version]
  13. Njuguna, S.M.; Yan, X.; Gituru, R.W.; Wang, O.; Wang, J. Assessment of macrophyte, heavy metal, and nutrient concentrations in the water of the Nairobi River, Kenya. Environ. Monit. Assess. 2017, 189, 454. [Google Scholar] [CrossRef] [PubMed] [Green Version]
  14. Decena, S.C.P.; Arguelles, M.S.; Robel, L.L. Assessing heavy metal contamination in surface sediments in an urban river in the Philippines. Pol. J. Environ. Stud. 2018, 27, 1983–1995. [Google Scholar] [CrossRef]
  15. Kelderman, P.; Osman, A.A. Effect of redox potential on heavy metal binding forms in polluted canal sediments in Delft (The Netherlands). Water Res. 2007, 41, 4251–4261. [Google Scholar] [CrossRef] [PubMed]
  16. Fural, S.; Kükrer, S.; Cürebal, I. Geographical information systems based ecological risk analysis of metal accumulation in sediments of İkizcetepeler Dam Lake (Turkey). Ecol. Indic. 2020, 119, 106784. [Google Scholar] [CrossRef]
  17. Mekonnen, F.H. Liquid waste management: The case of Bahir Dar, Ethiopia. Ethiop. J. Health Dev. 2012, 26, 49–53. Available online: https://www.ajol.info/index.php/ejhd/article/view/83828 (accessed on 24 January 2019).
  18. Beyene, H.; Redaie, G. Assessment of Waste Stabilization Ponds for the Treatment of Hospital Wastewater: The Case of Hawassa University Referral Hospital. World Appl. Sci. J. 2011, 15, 142–150. Available online: https://www.idosi.org/wasj/wasj15(1)11/21.pdf (accessed on 24 January 2019).
  19. Engdaw, F.; Dadebo, E.; Naggapan, R. Morphometric Relationships and Feeding Habits of Nile Tilapia Oreochromis niloticus (L.) (Pisces: Cichlidae) from Lake Koka, Ethiopia. Int. J. Fish. Aqua. Sci. 2013, 2, 65–71. Available online: https://maxwellsci.com/print/ijfas/v2-65-71.pdf (accessed on 17 November 2021).
  20. FAO. Food and Agriculture Organization of the United Nations Rome and the International Water Management Institute on Behalf of the Water Land and Ecosystems Research Program. Colombo. 2017. Available online: http://www.fao.org/3/a-i7754e.pdf (accessed on 24 January 2019).
  21. Gebremedhin, S.; Getahun, A.; Anteneh, A.; Bruneel, S.; Goethals, P.A. Drivers-Pressure-State Impact Responses Framework to support the sustainability of fish and Fisheries in Lake Tana, Ethiopia. Sustainability 2018, 10, 2957. [Google Scholar] [CrossRef] [Green Version]
  22. Lanckriet, S.; Nyssen, J.; Adgo, E. Environmental change in lake catchments of Ethiopia. Land Degrad. Dev. 2017, 28, 1793–1794. [Google Scholar] [CrossRef]
  23. Alemu, M.L.; Geset, M.; Mosa, H.M.; Zemale, F.A.; Moges, M.A.; Giri, S.K.; Tillahun, S.A.; Melesse, A.M.; Ayana, E.K.; Steenhuis, T.S. Spatial and temporal trends of recent dissolved phosphorus concentrations in Lake Tana and its four main tributaries. Land Degrad. Dev. 2017, 28, 1742–1751. [Google Scholar] [CrossRef]
  24. Wondim, Y.K. Water quality status of Lake Tana, Ethiopia. Civil. Environ. Res. 2016, 8, 3–51. Available online: https://core.ac.uk/download/pdf/234678437.pdf (accessed on 17 December 2018).
  25. Goshu, G.; Aynalem, S. Problem overview of the Lake Tana basin. Soc. Ecol. Syst. Dyn. 2017, 9–23. [Google Scholar] [CrossRef]
  26. Aghoghovwia, O.A.; Miri, F.A.; Izah, S.C. Impacts of anthropogenic activities on heavy metal levels in surface water of Nun River around Gbarantoru and Tombia Towns, Bayelsa State, Nigeria. Ann. Ecol. Environ. Sci. 2018, 2, 1–8. Available online: http://www.sryahwapublications.com/annals-of-ecology-and-environmental-science/pdf/v2-i2/1.pdf (accessed on 5 January 2022).
  27. Paerl, H.W.; Gardner, W.S.; Havens, K.E.; Joyner, A.R.; McCarthy, M.J.; Newell, S.E.; Qin, B.; Scott, J.T. Mitigating Cyanobacterial harmful algal blooms in aquatic ecosystems impacted by climate change and anthropogenic nutrients. Harmful Algae 2016, 54, 213–222. [Google Scholar] [CrossRef] [Green Version]
  28. Sambito, M.; Freni, G. Strategies for Improving Optimal Positioning of Quality Sensors in Urban Drainage Systems for Non-Conservative Contaminants. Water 2021, 13, 934. [Google Scholar] [CrossRef]
  29. Abebe, E.; Kebede, A. Assessment of Climate Change Impacts on the Water Resources of Megech River Catchment, Abbay Basin, Ethiopia. Open J. Mod. Hydrol. 2017, 7, 141–152. [Google Scholar] [CrossRef] [Green Version]
  30. Anteneh, W.; Mengist, M.; Wondie, A.; Tewabe, D.; WeldeKidan, W.; Assefa, A.; Engida, W. Water Hyacinth Coverage Survey Report on Lake Tana; Technical Report Series 1; Bahir Dar University: Bahir Dar, Ethiopia, 2014; pp. 1–29. [Google Scholar]
  31. American Public Health Association (APHA); American Water Works Association; Water Pollution Control Federation. Standard Methods for the Examination of Water and Wastewater, 20th ed.; APHA: Washington, DC, USA, 1999. [Google Scholar]
  32. Asefa, W.; Beranu, T. Levels of Some Trace Metals in Fishes Tissues, Water and Sediment at Tendaho Water Reservoir, Afar Region, Ethiopia. J. Environ. Anal. Toxicol. 2015, 5, 1–6. [Google Scholar] [CrossRef] [Green Version]
  33. Müller, G. The Heavy Metal Pollution of the Sediments of Neckars and its Tributary: A Stocktaking. Chem. Ztg. 1981, 105, 157–164. [Google Scholar]
  34. Ladigbolu, L.A.; Balogun, K.J. Distribution of heavy metals in sediments of selected streams in Ibadan me tropolis, Nigeria. Int. J. Environ. Sci. 2011, 1, 1186–1191. [Google Scholar]
  35. Arti Yadav, A.; Yadav, P.K. Pollution Load Index (PLI) of Field Irrigated with Wastewater of Mawaiya Drain in Naini Suburbs of Allahabad District. Curr. World Environ. 2018, 13, 159–164. [Google Scholar] [CrossRef] [Green Version]
  36. Zahra, A.; Hashmi, M.Z.; Malik, R.N.; Ahmed, Z. Enrichment and geo-accumulation of heavy metals and risk assessment of sediments of the Kurang Nallah-Feeding tributary of the Rawal Lake Reservoir, Pakistan. Sci. Total Environ. 2014, 470, 925–933. [Google Scholar] [CrossRef] [PubMed]
  37. Akele, M.L.; Abebe, D.Z.; Alemu, A.K.; Assefa, A.G.; Madhusudhan, A.; de Oliveira, R.R. Analysis of trace metal concentrations in raw cow’s milk from three dairy farms in North Gondar, Ethiopia: Chemometric approach. Environ. Monit. Assess. 2017, 189, 499. [Google Scholar] [CrossRef] [PubMed]
  38. Li, H.; Shi, A.; Li, M.; Zhang, X. Effect of pH, Temperature, Dissolved Oxygen, and Flow Rate of Overlying Water on Heavy Metals Release from Storm Sewer Sediments. J. Chem. 2013, 2013, 434012. [Google Scholar] [CrossRef]
  39. Egun, N.K.; Ogiesoba-Eguakun, C.U. Physico-chemical and Water Quality Index analysis of the Okhuaihe River, Edo State, Nigeria. Afr. J. Aquat. Sci. 2018, 43, 345–351. [Google Scholar] [CrossRef]
  40. Oboh, I.P.; Agbala, C.S. Water quality assessment of the Siluko River, southern Nigeria. Afr. J. Aquat. Sci. 2017, 42, 279–286. [Google Scholar] [CrossRef]
  41. DWAF. South African Water Quality Guidelines. 1: Domestic Uses, 2nd ed.; Department of Water Affairs and Forestry: Pretoria, South Africa, 1996. Available online: https://www.iwanetwork.org/filemanager-uploads/WQ_Compendium/Database/Selected_guidelines/041.pdf (accessed on 15 February 2022).
  42. USEPA. The Incidence and Severity of Sediment Contamination in Surface Waters of the United States, 2nd ed.; National Sediment Quality Survey; USEPA: Washington, DC, USA, 2004; EPA823-R-04-007.
  43. WHO. Guidelines for Drinking Water Quality, 4th ed.; WHO: Geneva, Switzerland, 2011; Available online: https://apps.who.int/iris/bitstream/handle/10665/44584/9789241548151_eng.pdf (accessed on 13 March 2019).
  44. Fernández-Luqueño, F.; Valdez, F.L.; Melo, P.G.; Suárez, S.L.; Gonzále, E.N.A.; Martínez, A.I.; Guillermo, M.S.G.; Martínez, G.H.; Mendoza, R.H.; Garza, M.A.A.; et al. Heavy metal pollution in drinking water a global risk for human health: A review. Afr. J. Environ. Sci. Technol. 2013, 7, 567–584. [Google Scholar] [CrossRef]
  45. Kassa, Y. Macrophyte Ecology, Nutrient Dynamics and Water Quality of the Littoral Zone and Yitamot Wetland, Lake Tana, Ethiopia. Ph.D. Thesis, Addis Ababa University, Addis Ababa, Ethiopia, 2016; p. 157. [Google Scholar]
  46. Mengesha, A.; Mekuria, A.; Husen, A. Algal biomass and nutrient enrichment in the Angereb reservoir, Gondar, Ethiopia. Environ. Exp. Biol. 2013, 11, 91–98. Available online: http://eeb.lu.lv/EEB/201306/EEB_11_Mengesha.pdf (accessed on 15 February 2019).
  47. Walle, H.; Zewde, S.; Heldal, T. Building stone of central and southern Ethiopia: Deposits and resource potential. NGU Bull. 2000, 436, 175–182. Available online: https://www.ngu.no/FileArchive/102/Bulletin436_17.pdf (accessed on 21 March 2019).
  48. Rameshkumar, S.; Radhakrishnan, K.; Aanand, S.; Rajaram, R. Influence of physicochemical water quality on aquatic macrophyte diversity in seasonal wetlands. Appl. Water Sci. 2019, 9, 12. [Google Scholar] [CrossRef]
  49. Wondie, A.; Mengistou, S.; Vijverberg, J.; Dejen, E. Seasonal variation in primary production of a high-altitude tropical lake (Lake Tana, Ethiopia): Effects of nutrient availability and water transparency. Aquat. Ecol. 2007, 41, 207. [Google Scholar] [CrossRef]
  50. Ratan, A.; Verma, V.N. Photochemical studies of Eichornia crassipes (Water Hyacinth). Int. Lett. Chem. Phys. Astron. 2014, 11, 214–222. [Google Scholar]
  51. Admas, A.; Sahle, S.; Belete, E.; Agidie, A.; Alebachew, M. Controlling Water Hyacinth in Lake Tana Using Biological Method at Green House and Pond Level. Eur. Exp. Biol. 2017, 7, 1–5. [Google Scholar] [CrossRef]
  52. Ugonna, C.N.; Precious, O.O.; Nneka, I.O. A Review of the Health Implications of Heavy Metals in Food Chain in Nigeria. Sci. World J. 2020, 2020, 6594109. [Google Scholar] [CrossRef]
  53. Okunowo, W.O.; Ogunkanmi, L.A. Phytoremediation potential of some heavy metals by water hyacinth. Int. J. Biol. Chem. Sci. 2010, 4, 347–353. Available online: https://www.ajol.info/index.php/ijbcs/article/view/58121 (accessed on 21 February 2019). [CrossRef] [Green Version]
  54. Sun, H.; Alexander, J.; Gove, B.; Pezzi, E.; Chakowski, N.; Husch, J. Mineralogical and anthropogenic controls of stream water chemistry in salted watersheds. Appl. Geochem. 2014, 48, 141–154. [Google Scholar] [CrossRef]
  55. Tessema, K.; Lemma, B.; Fetahi, T.; Kebede, E. Accumulation of heavy metals in the physical and biological systems of Lake Koka, Ethiopia: Implications for potential health risks. Lakes Reserv. 2020, 25, 314–325. [Google Scholar] [CrossRef]
  56. Hou, D.; He, J.; Lü, C.; Sun, Y.; Zhang, F.; Otgonbayar, K. Effects of environmental factors on nutrients release at sediment-water interface and assessment of trophic status for a typical shallow Lake, Northwest China. Sci. World J. 2013, 2013, 630654. [Google Scholar] [CrossRef]
  57. Huang, Z.; Liu, C.; Zhao, X.; Dong, J.; Zheng, B. Risk assessment of heavy metals in the surface sediment at the drinking water source of the Xiangjiang River in South China. Environ. Sci. Eur. 2020, 32, 23. [Google Scholar] [CrossRef]
  58. Zhang, J.; Zhu, L.; Li, F.; Liu, C.; Qiu, Z.; Xiao, M.; Cai, Y. Comparison of toxic metal distribution characteristics and health risk between cultured and wild fish captured from Honghu city, China. Int. J. Environ. Res. Public Health 2018, 15, 334. [Google Scholar] [CrossRef] [PubMed] [Green Version]
  59. Dsikowitzky, L.; Mengesha, M.; Dadebo, E.; Carvalho, C.E.V.; Sindern, S. Assessment of heavy metals in water samples and tissues of edible fish species from Awassa and Koka Rift Valley Lakes, Ethiopia. Environ. Monit. Assess. 2012, 185, 3117–3131. [Google Scholar] [CrossRef] [PubMed]
  60. Rodrigues-Filho, J.L.; Abe, D.S.; Gatti-Junior, P.; Medeiros, G.R.; Degani, R.M.; Blanco, F.P.; Faria, C.R.L.; Campanelli, L.; Soares, F.S.; Sidagis-Galli, C.V.; et al. Spatial patterns of water quality in Xingu River Basin (Amazonia) prior to the Belo Monte dam impoundment. Braz. J. Biol. 2015, 75, S34–S46. [Google Scholar] [CrossRef] [Green Version]
  61. Ogundiran, M.A.; Fawole, O.O. Toxic Effects of Water Pollution on Two Bio-indicators of Aquatic Resources of Asa River, Nigeria. J. Fish. Sci. 2018, 12, 20–27. [Google Scholar] [CrossRef]
Figure 1. Map of Megech River showing the six sampling sites (M1–M6).
Sustainability 14 02791 g001
Figure 2. Mean ± Standard deviations of trace metals in the sediment samples (mg kg−1; n = 5) collected at the six sampling sites of Megech River (Cu—copper, Zn—zink, Cr—chromium, Pb—lead and Cd—cadmium).
Sustainability 14 02791 g002
Figure 3. Mean ± Standard deviations of trace metals in the sediment samples (mg kg−1; n = 5) collected at the six sampling sites of Megech River (Fe—iron, Mn—manganese).
Sustainability 14 02791 g003
Figure 4. Score plot of PCA for all parameters measured from water samples of Megech River.
Sustainability 14 02791 g004
Table 1. Instrumental working conditions of the GFAAS.
ElementWave LengthTemperature (°C) Ramp Drying and Payrolysis Slit Width% of RecoveryMDL
WaterSediment
Fe248.31500/12 s0.794.4798.10.02
Mn279.51600/10 s0.797.14104.20.018
Cu324.8900/8 s0.795.85103.40.024
Zn213.81000/5 s0.7105.1793.760.024
Cr357.91100/12 s0.792.70106.20.018
Cd228.8700/22 s0.797.19101.40.018
Table 2. Physico-chemical water quality parameters of Megech River at different sampling sites (Mean ± SD; n = 5; Temp = temperature, DO = dissolved oxygen, EC = electrical conductivity, Tur = turbidity).
SiteTemp (°C)pHDO (mg L−1)EC (µS/cm)Tur (NTU)
M116.9 ± 0.36 *8.4 ± 0.019.9 ± 0.12 *421.8 ± 2.28 * 89.2 ± 4.33 *
M219.4 ± 0.728.4 ± 0.017.8 ± 0.41658.4 ± 8.65 * 223.2 ± 8.98
M322.6 ± 0.188.7 ± 0.028.3 ± 0.04431.6 ± 1.95419.9 ± 3.77 *
M423.1 ± 0.15 *8.6 ± 0.027.9 ± 0.16438.6 ± 1.14416.0 ± 14.4
M521.9 ± 0.428.5 ± 0.017.7 ± 0.07462.4 ± 0.55 *575.0 ± 10.22 *
M624.9 ± 0.29 *8.3 ± 0.077.5 ± 0.47 *148.7 ± 0.35 * 52.7 ± 4.90 *
* p < 0.05.
Table 3. Concentrations of heavy metals from water (mg L−1) and sediments (mg kg−1) of Megech River and littoral area of Lake Tana (Mean ± SD; n = 5 for water and sediment; Fe = iron; Mn = manganese; Cu = copper; Zn = zinc; Cr = chromium; Cd = cadmium; Pb = lead).
Site FeMnCuZn CrCdPb
Water
M14.4 ± 0.101.8 ± 0.020.15 ± 0.010.16 ± 0.030.03 ± 0.01ND0.04 ± 0.01
M27.6 ± 0.054.3 ± 0.020.11 ± 0.020.15 ± 0.030.05 ± 0.010.04 ± 0.010.04 ± 0.01
M34.1 ± 0.023.4 ± 0.010.13 ± 0.030.13 ± 0.010.04 ± 0.010.04 ± 0.010.04 ± 0.01
M42.5 ± 0.033.7 ± 0.010.17 ± 0.010.13 ± 0.02NDND0.03 ± 0.01
M54.4 ± 0.032.3 ± 0.010.12 ± 0.020.11 ± 0.00.05 ± 0.020.03 ± 0.01ND
M64.5 ± 0.060.86 ± 0.020.13 ± 0.030.11 ± 0.02NDND0.06 ± 0.02
Sediment
M1390.8 ± 5.03160.0 ± 2.5810.24 ± 1.274.58 ± 0.551.78 ± 0.250.78 ± 0.241.22 ± 0.26
M2520.6 ± 3.92241.8 ± 2.8612.68 ± 1.096.06 ± 0.522.56 ± 0.411.24 ± 0.111.82 ± 0.23 *
M3330.1 ± 4.4498.6 ± 2.958.02 ± 1.293.74 ± 0.491.34 ± 0.230.68 ± 0.151.02 ± 0.19 *
M4466.6 ± 6.07198.6 ± 3.5211.50 ± 1.255.38 ± 0.562.22 ± 0.261.12 ± 0.151.66 ± 0.22
M5458.2 ± 4.78192.8 ± 3.2211.38 ± 1.105.42 ± 0.562.06 ± 0.301.06 ± 0.151.48 ± 0.29
M6390.1 ± 5.94162.0 ± 3.079.76 ± 1.494.36 ± 0.771.82 ± 0.260.90 ± 0.161.38 ± 0.24
p < 0.05; ND = Not detected.
Table 4. Range (Mean) of concentrations (mg L−1) of heavy metals in water samples of Megech River and international standard values (SA—South African standards, ECE-European commission for environment, WHO-world health organization, USEPA-United States environmental protection agency).
Drinking WaterIrrigationLivestock
MetalCurrent StudyWHOUSEPA ECESA.SA.SA.
Cu0.11–1.17 (0.14)21.321.00.25
Zn0.11–0.16 (0.13)35531.020
Cr0.03–0.05 (0.03)0.050.10.050.05NA1.0
Cd0.03–0.04 (0.02)0.0030.0050.0050.0050.010.01
Pb0.03–0.06 (0.04)0.010.0150.010.010.20.1
Fe 2.5–7.6 (4.58)0.30.30.2NANANA
Mn0.86–4.3 (2.73)0.40.050.050.050.050.05
DWAF, 1996; ECE, 1998; USEPA, 2011; WHO, 2011. N.A. = Not available; Value below all standards; Value above all standards..
Table 5. Mean concentrations of heavy metals from sediment samples of Megech River with SQG and other literature values from Ethiopian water bodies (mg/kg) ND = Not detected.
Reference CuZnCrCdPb
SQGTEC32120430.9936
PEC1504601105130
Present studyMin8.023.741.340.681.02
Max12.686.062.561.241.82
Mean10.604.921.960.961.43
Other studies
(2015–2018)
L.Akaki [1]59.06228.5370.96ND238.17
G. Akaki [5]4.221.824.52.6137.7
Aba Yohannes [5]4510252.6136.8
Elalla [11]40.03387.547.216.251.58
Awash [4]79.43382.73120.582.6013.53
Tendaho [30]10.3521.892.521.035.78
L. Awassa [53]8.6993.808.270.2115.7
Table 6. Correlation matrix of trace metals from water and sediment samples (n = 5).
FeMnCuZnCrCdPb
Sediment
Fe1
Mn0.94 **1
Cu0.91 **0.96 **1
Zn0.95 **0.94 **0.93 **1
Cr0.89 **0.95 **0.87 **0.92 **1
Cd0.92 **0.89 **0.866 **0.92 **0.87 **1
Pb0.89 **0.91 **0.866 **0.869 **0.87 **0.92 *1
Water
Fe1
Mn −0.60 **1
Cu−0.62 **0.281
Zn0.44 *−0.35−0.031
Cr0.55 **−0.13−0.350.121
Cd0.51 **0.12−0.370.140.66 **1
Pb0.08−0.44 *0.110.05−0.48 **−0.321
** p = 0.01; * p = 0.05.
Table 7. Contribution (loadings) of variables to the Principal component (only selected variables are shown).
VariablePC1PC2
Eigenvalue7.383.73
Variance38.8523.87
Cumulative variance38.8562.72
pH−0.210.82
DO0.11−0.79
EC0.610.31
Tur0.080.97
Fe-s0.950.06
Mn-s0.96−0.07
Pb-s0.890.02
Pb-w−0.27−0.67
Mn-w−0.230.91
Cr-s0.92−0.04
Fe-w0.56−0.38
Bold = parameters with high loadings.
Publisher’s Note: MDPI stays neutral with regard to jurisdictional claims in published maps and institutional affiliations.

