
Illuminating Host-Parasite Interaction at the Cellular and Subcellular Levels with Infrared Microspectroscopy

 , , , , and
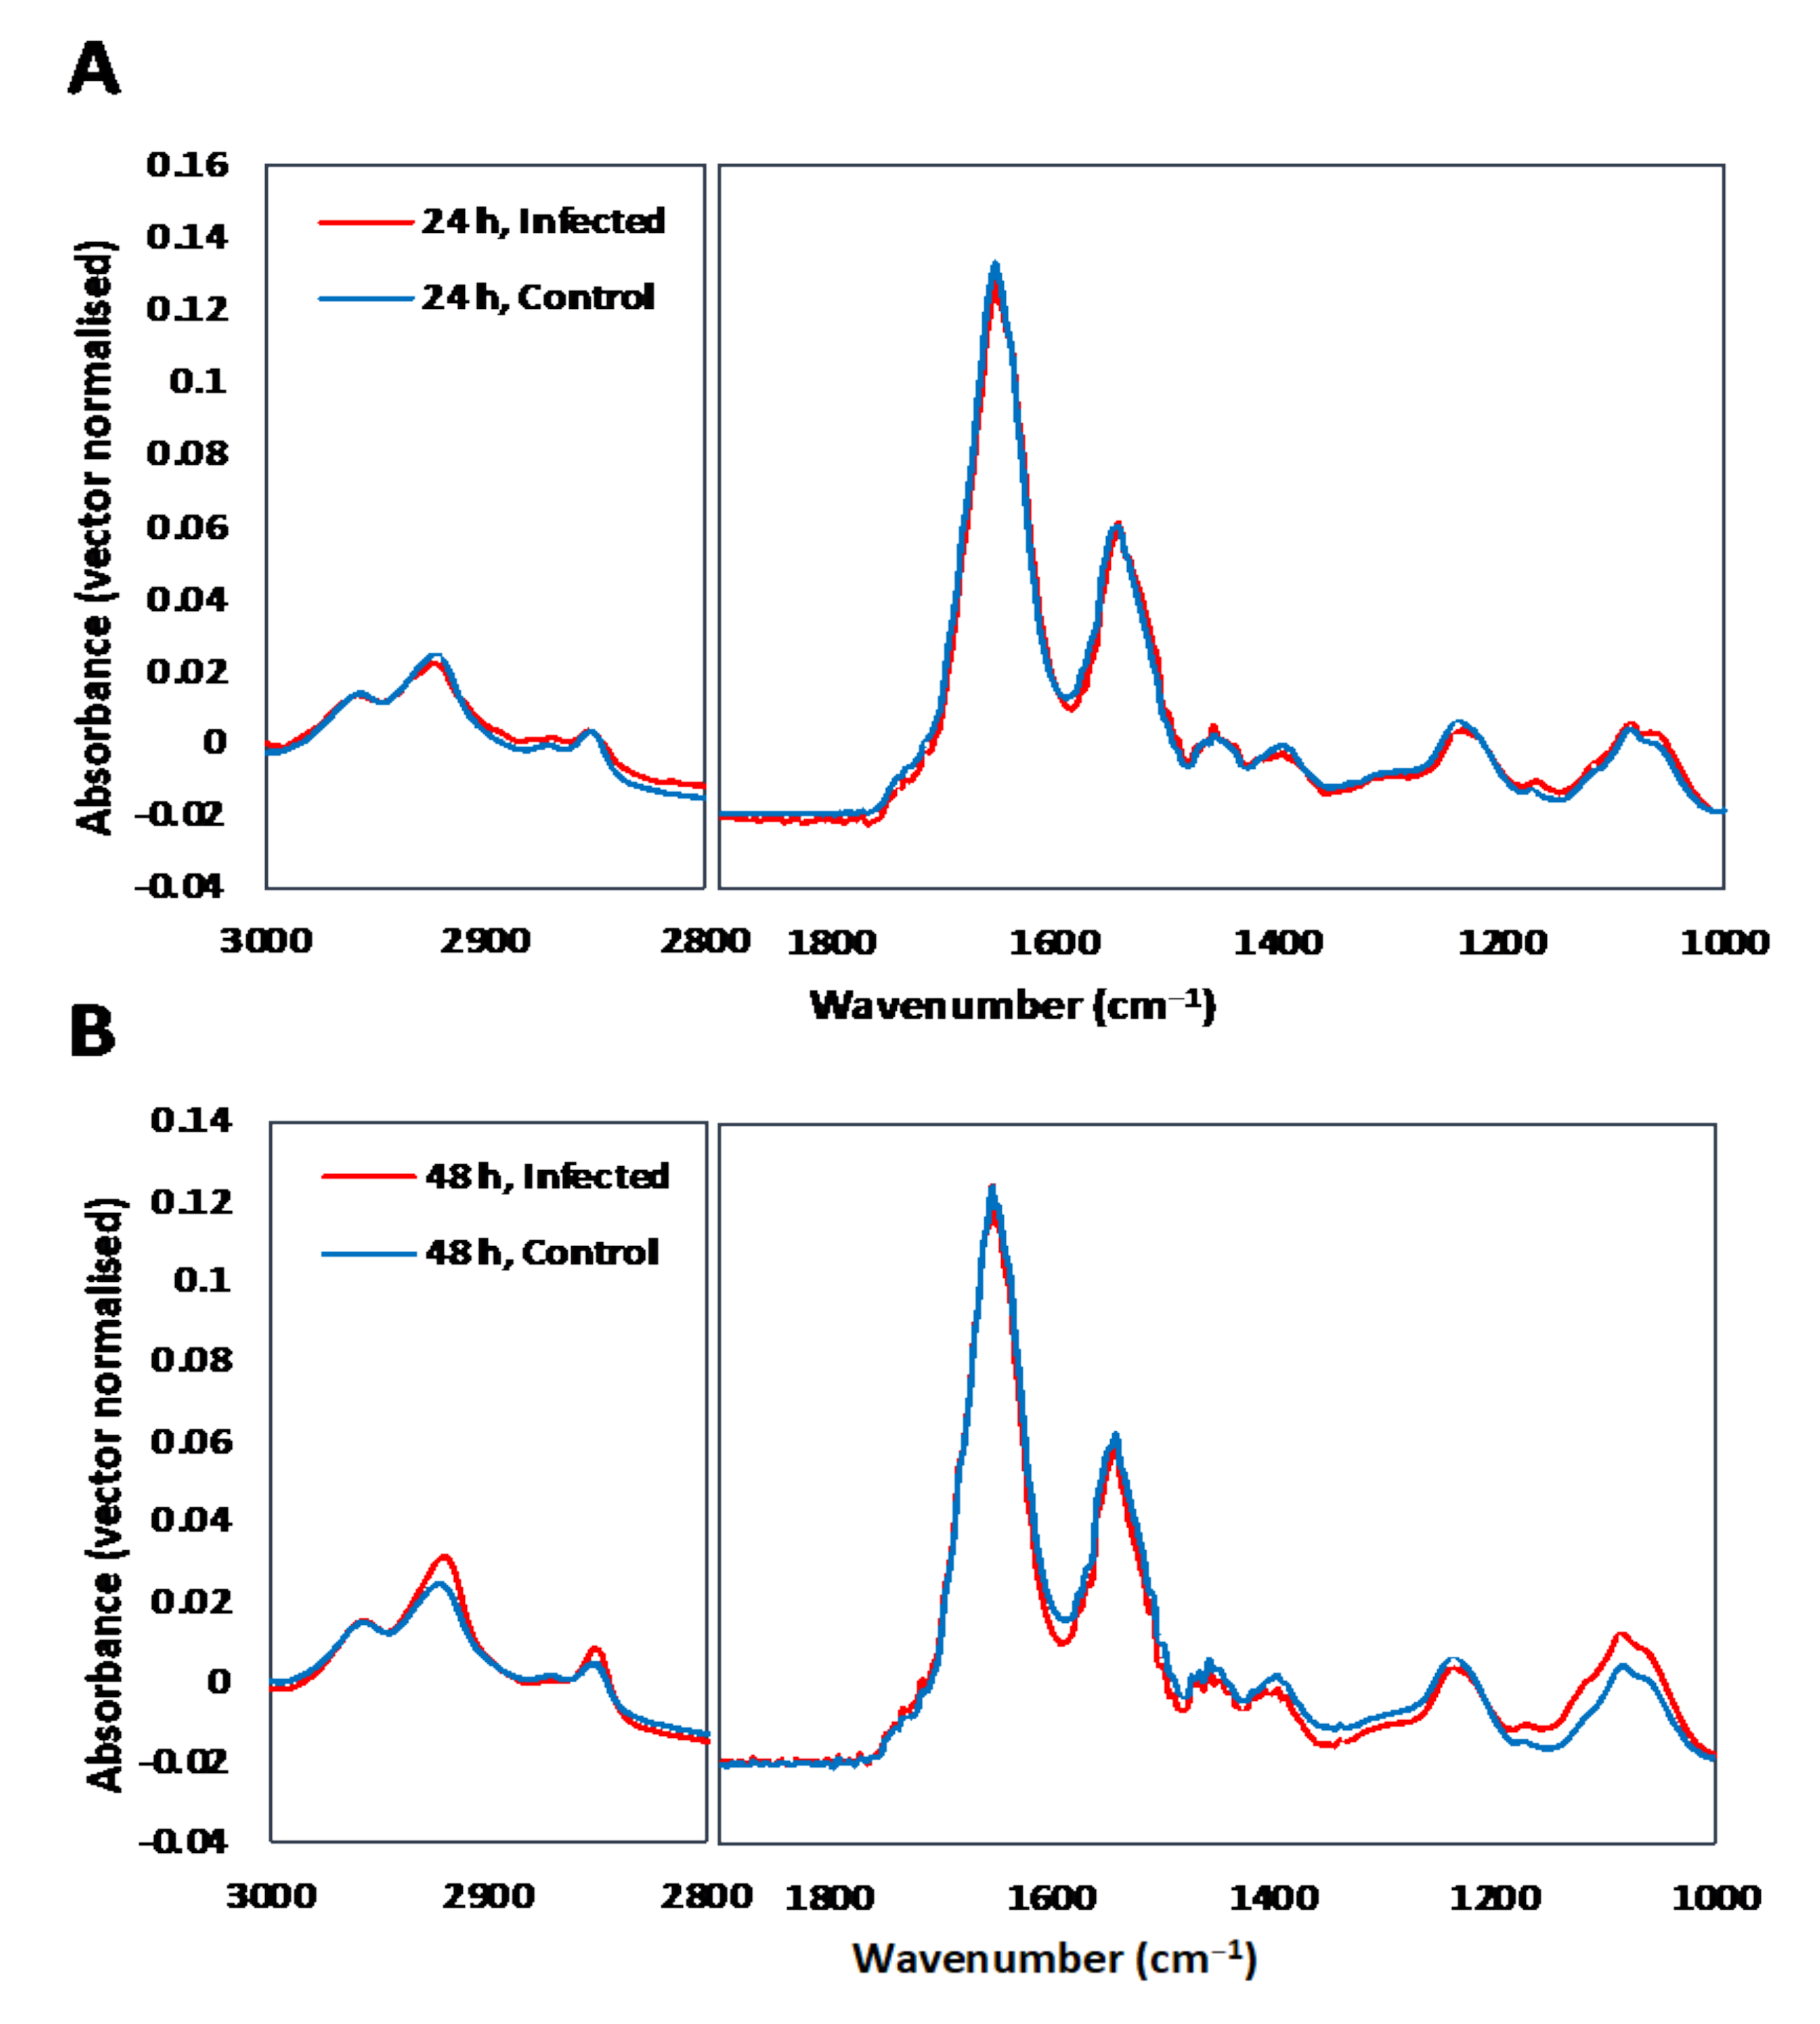
Abstract
1. Introduction
2. Materials and Methods
2.1. Cell Lines and Culture Conditions
2.2. Parasite Culture and Purification
2.3. FTIR Micro Spectroscopy Analysis
2.4. Synchrotron-Based FTIR Micro Spectroscopy
2.5. Spectral Data Processing
2.6. Transcriptomic Analysis
3. Results
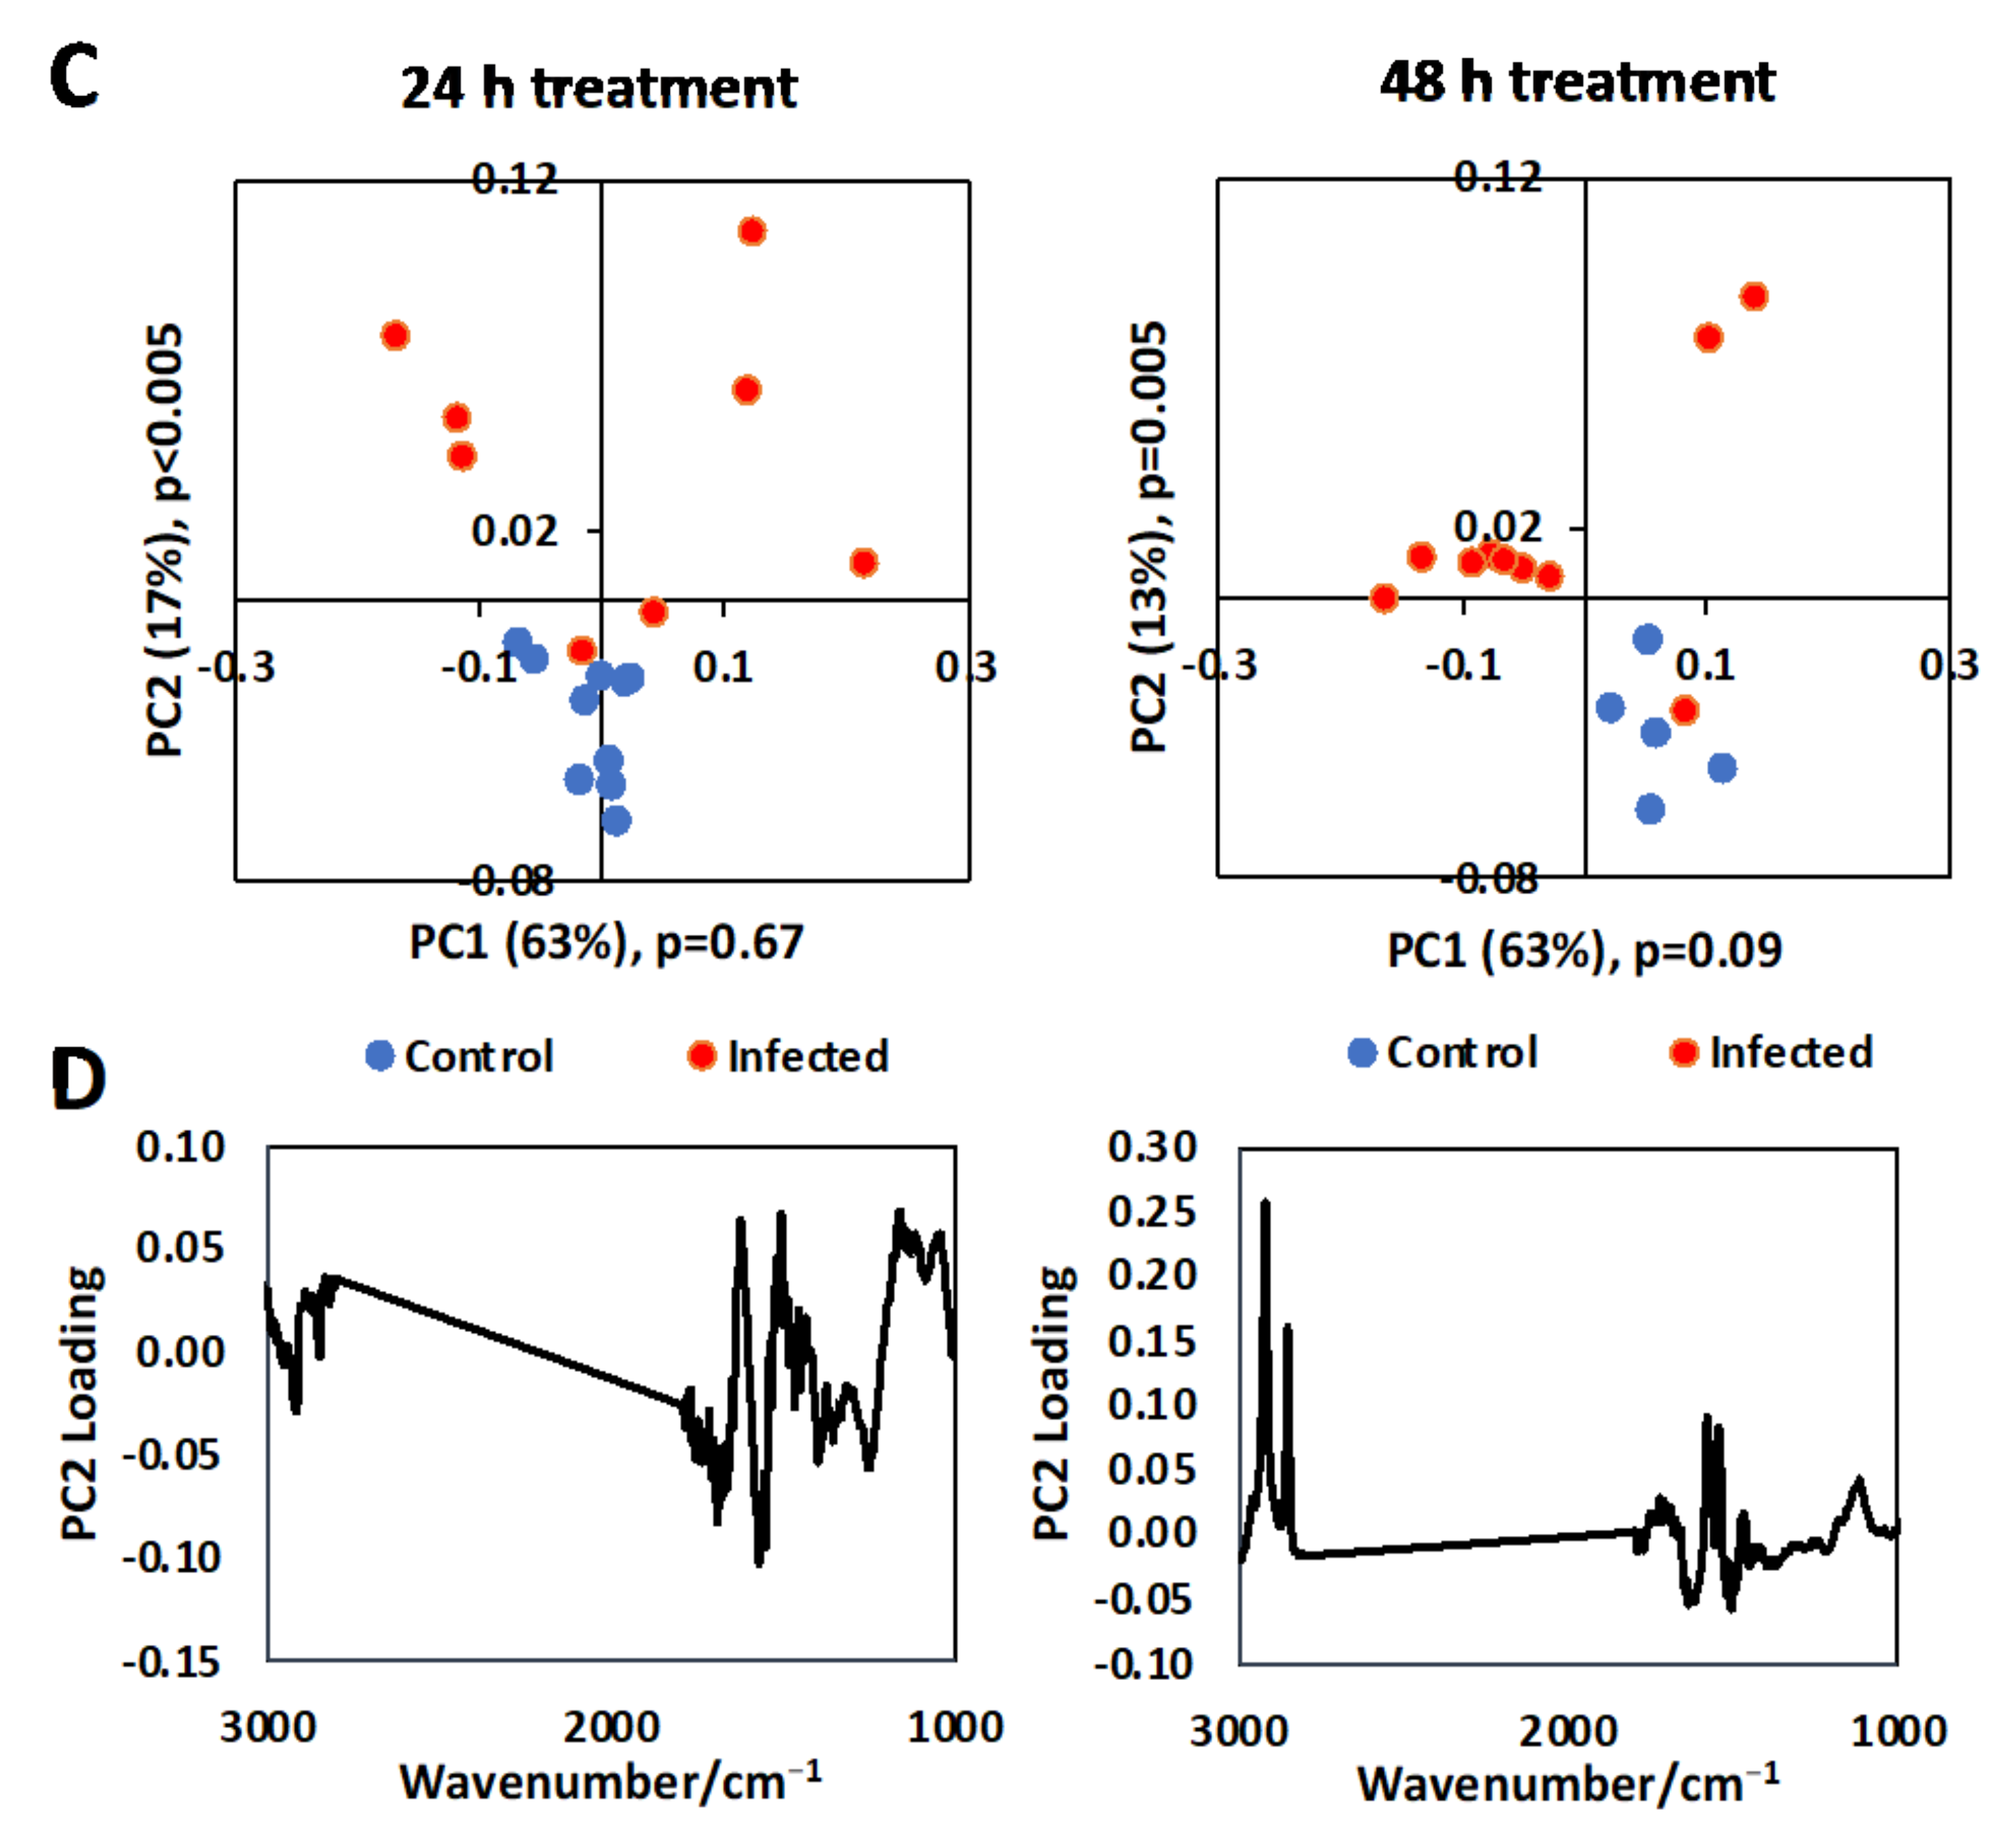
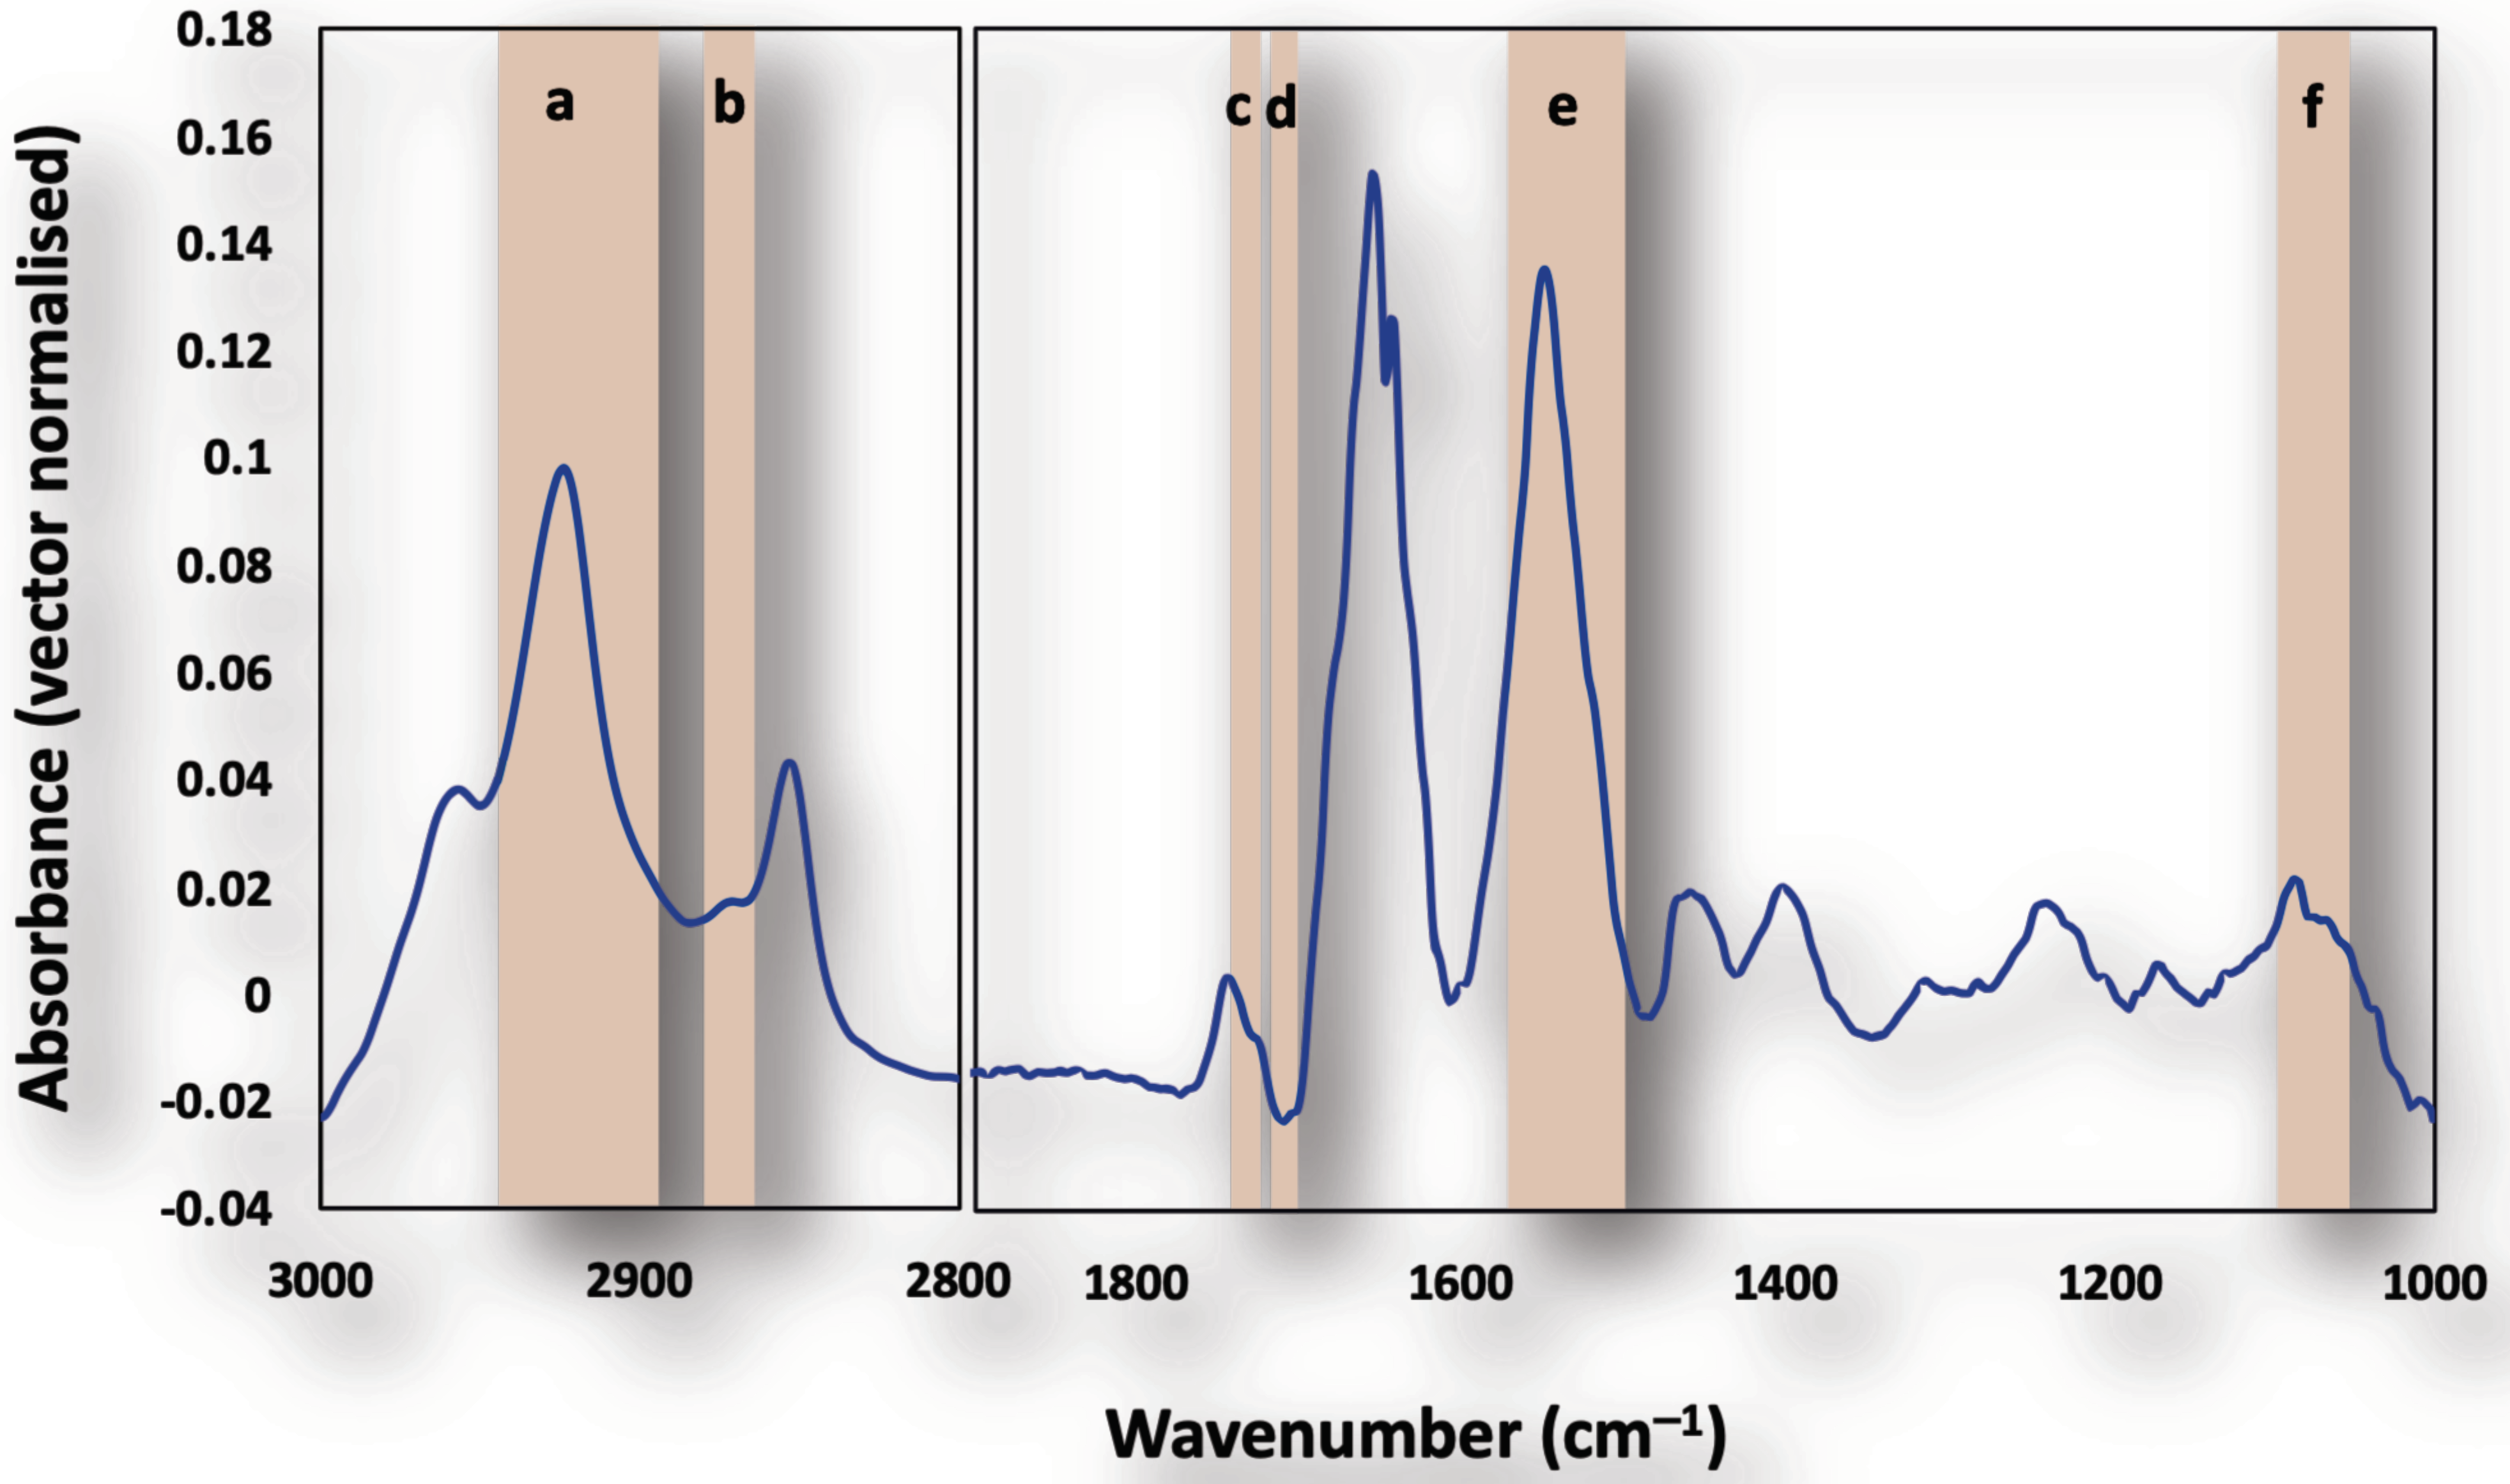
3.1. Single Cell Analysis Using Conventional FTIR Microspectroscopy
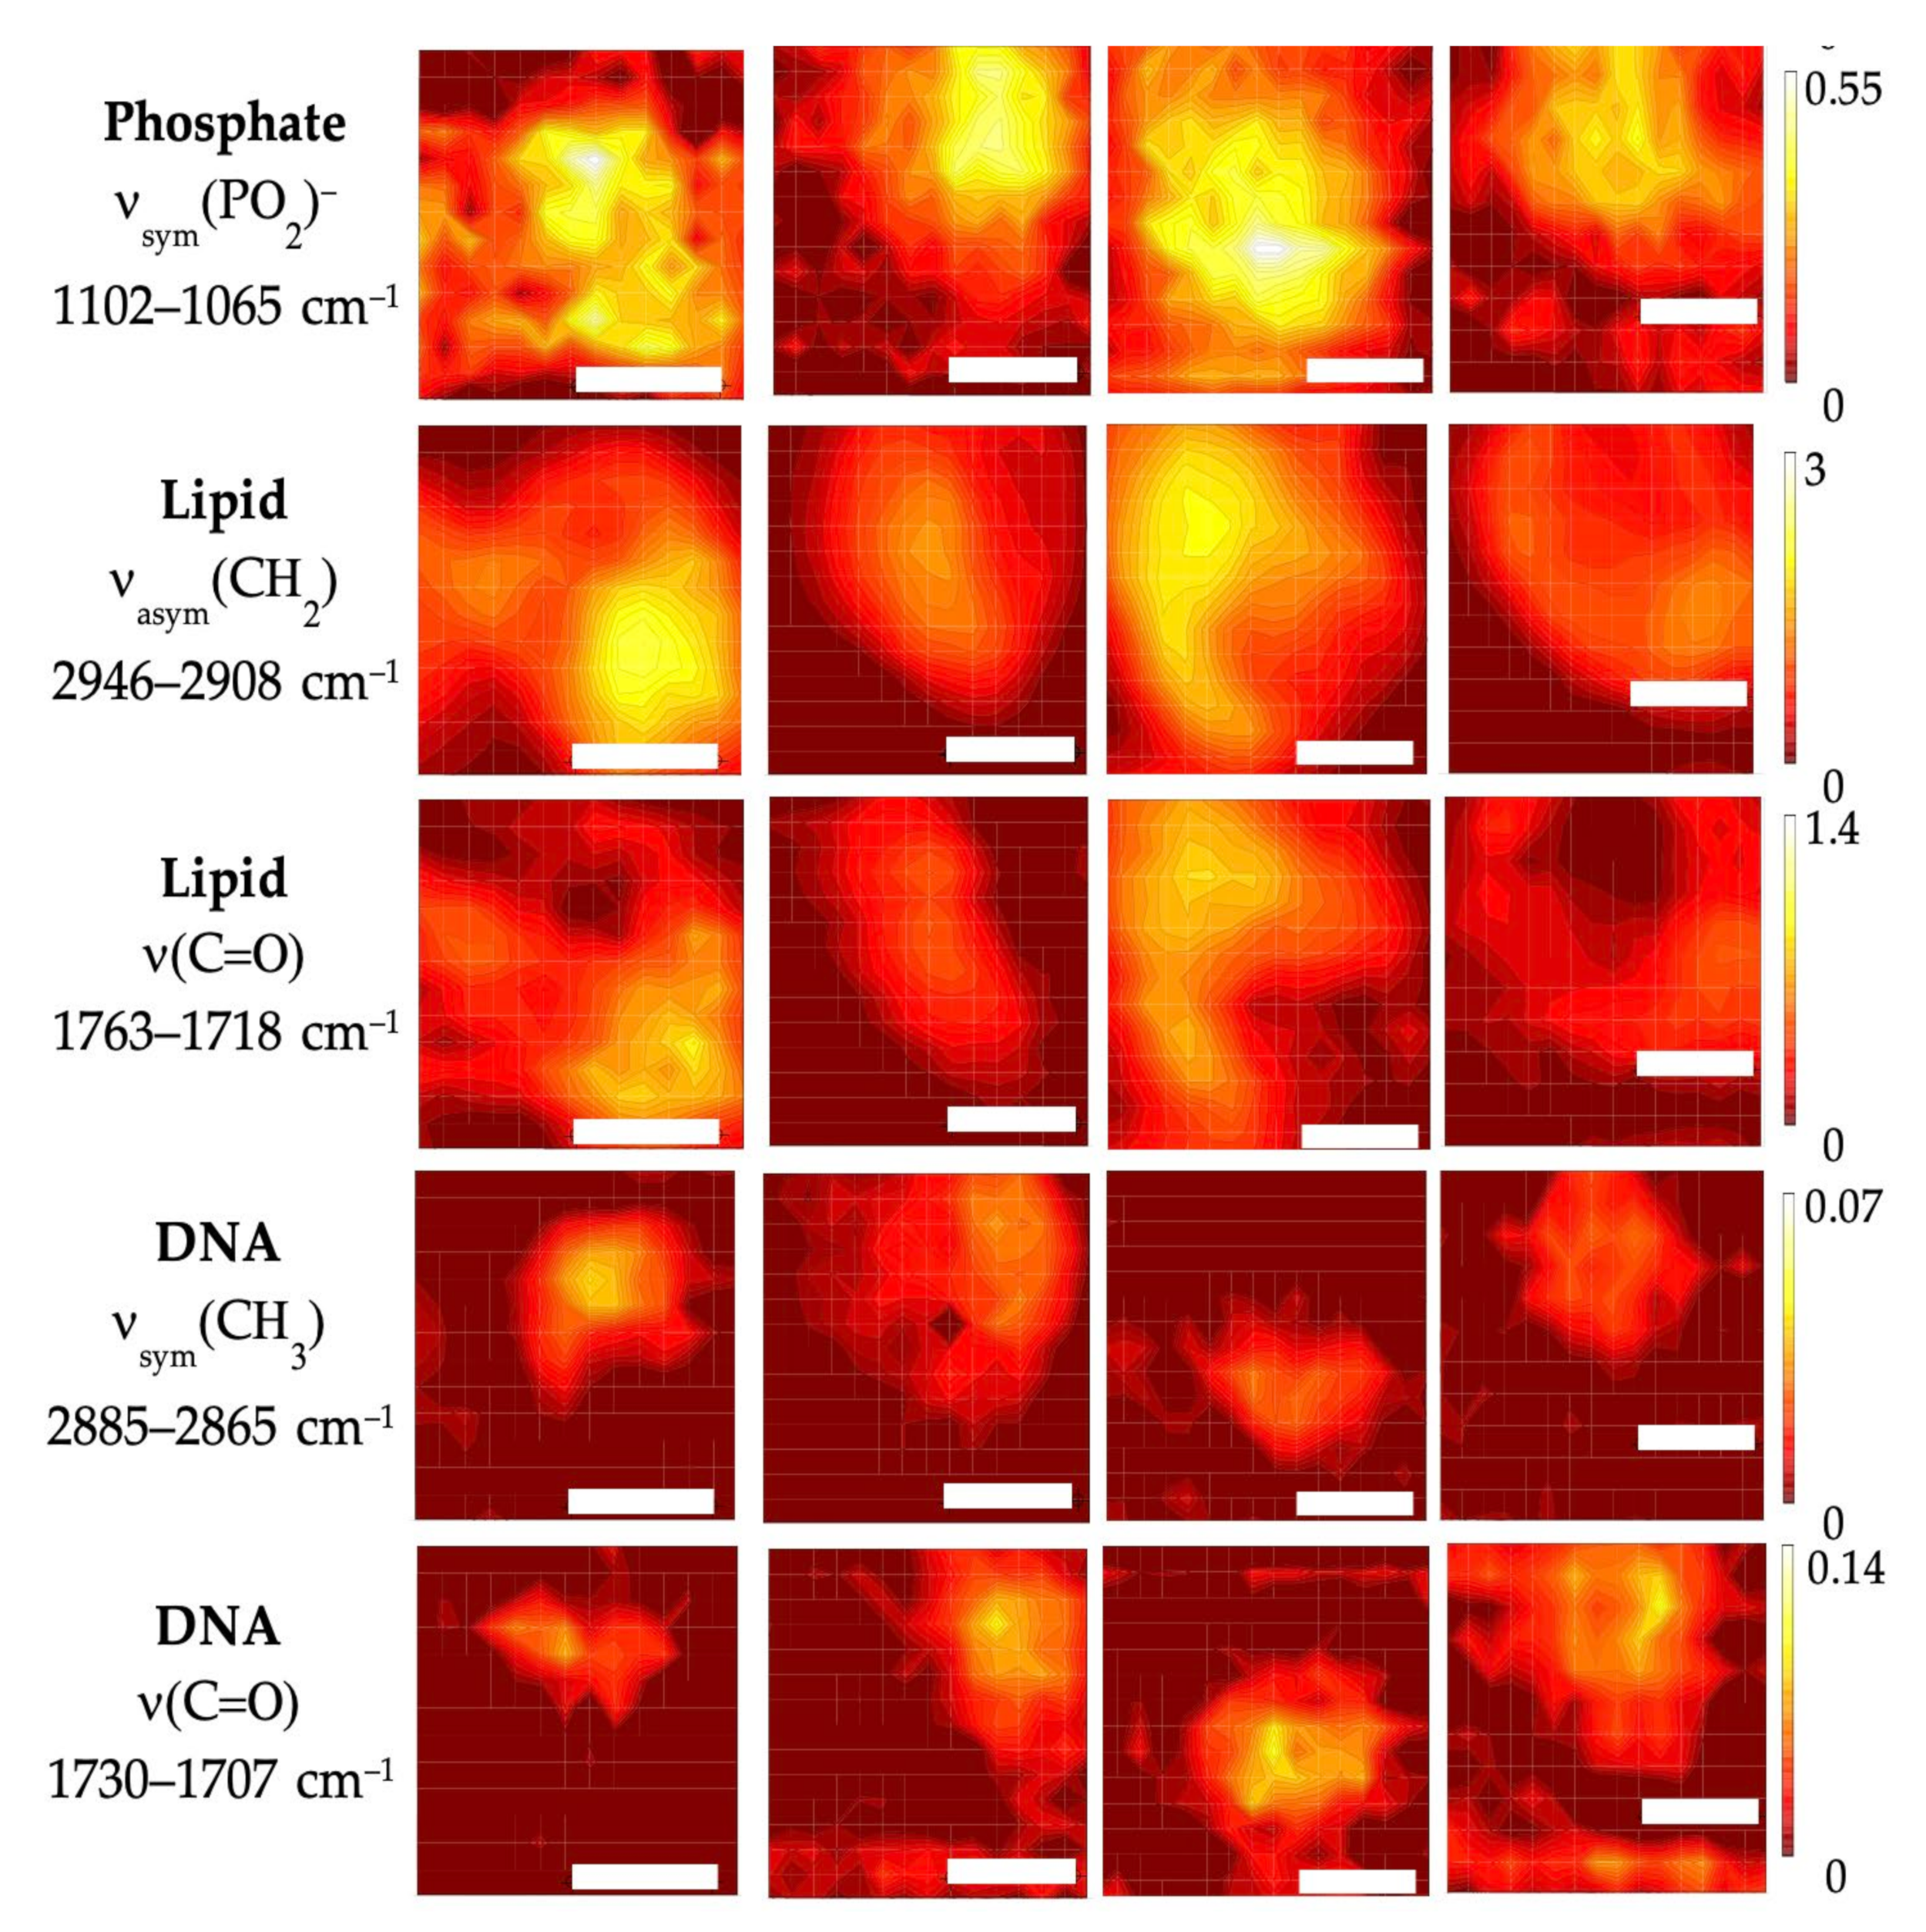
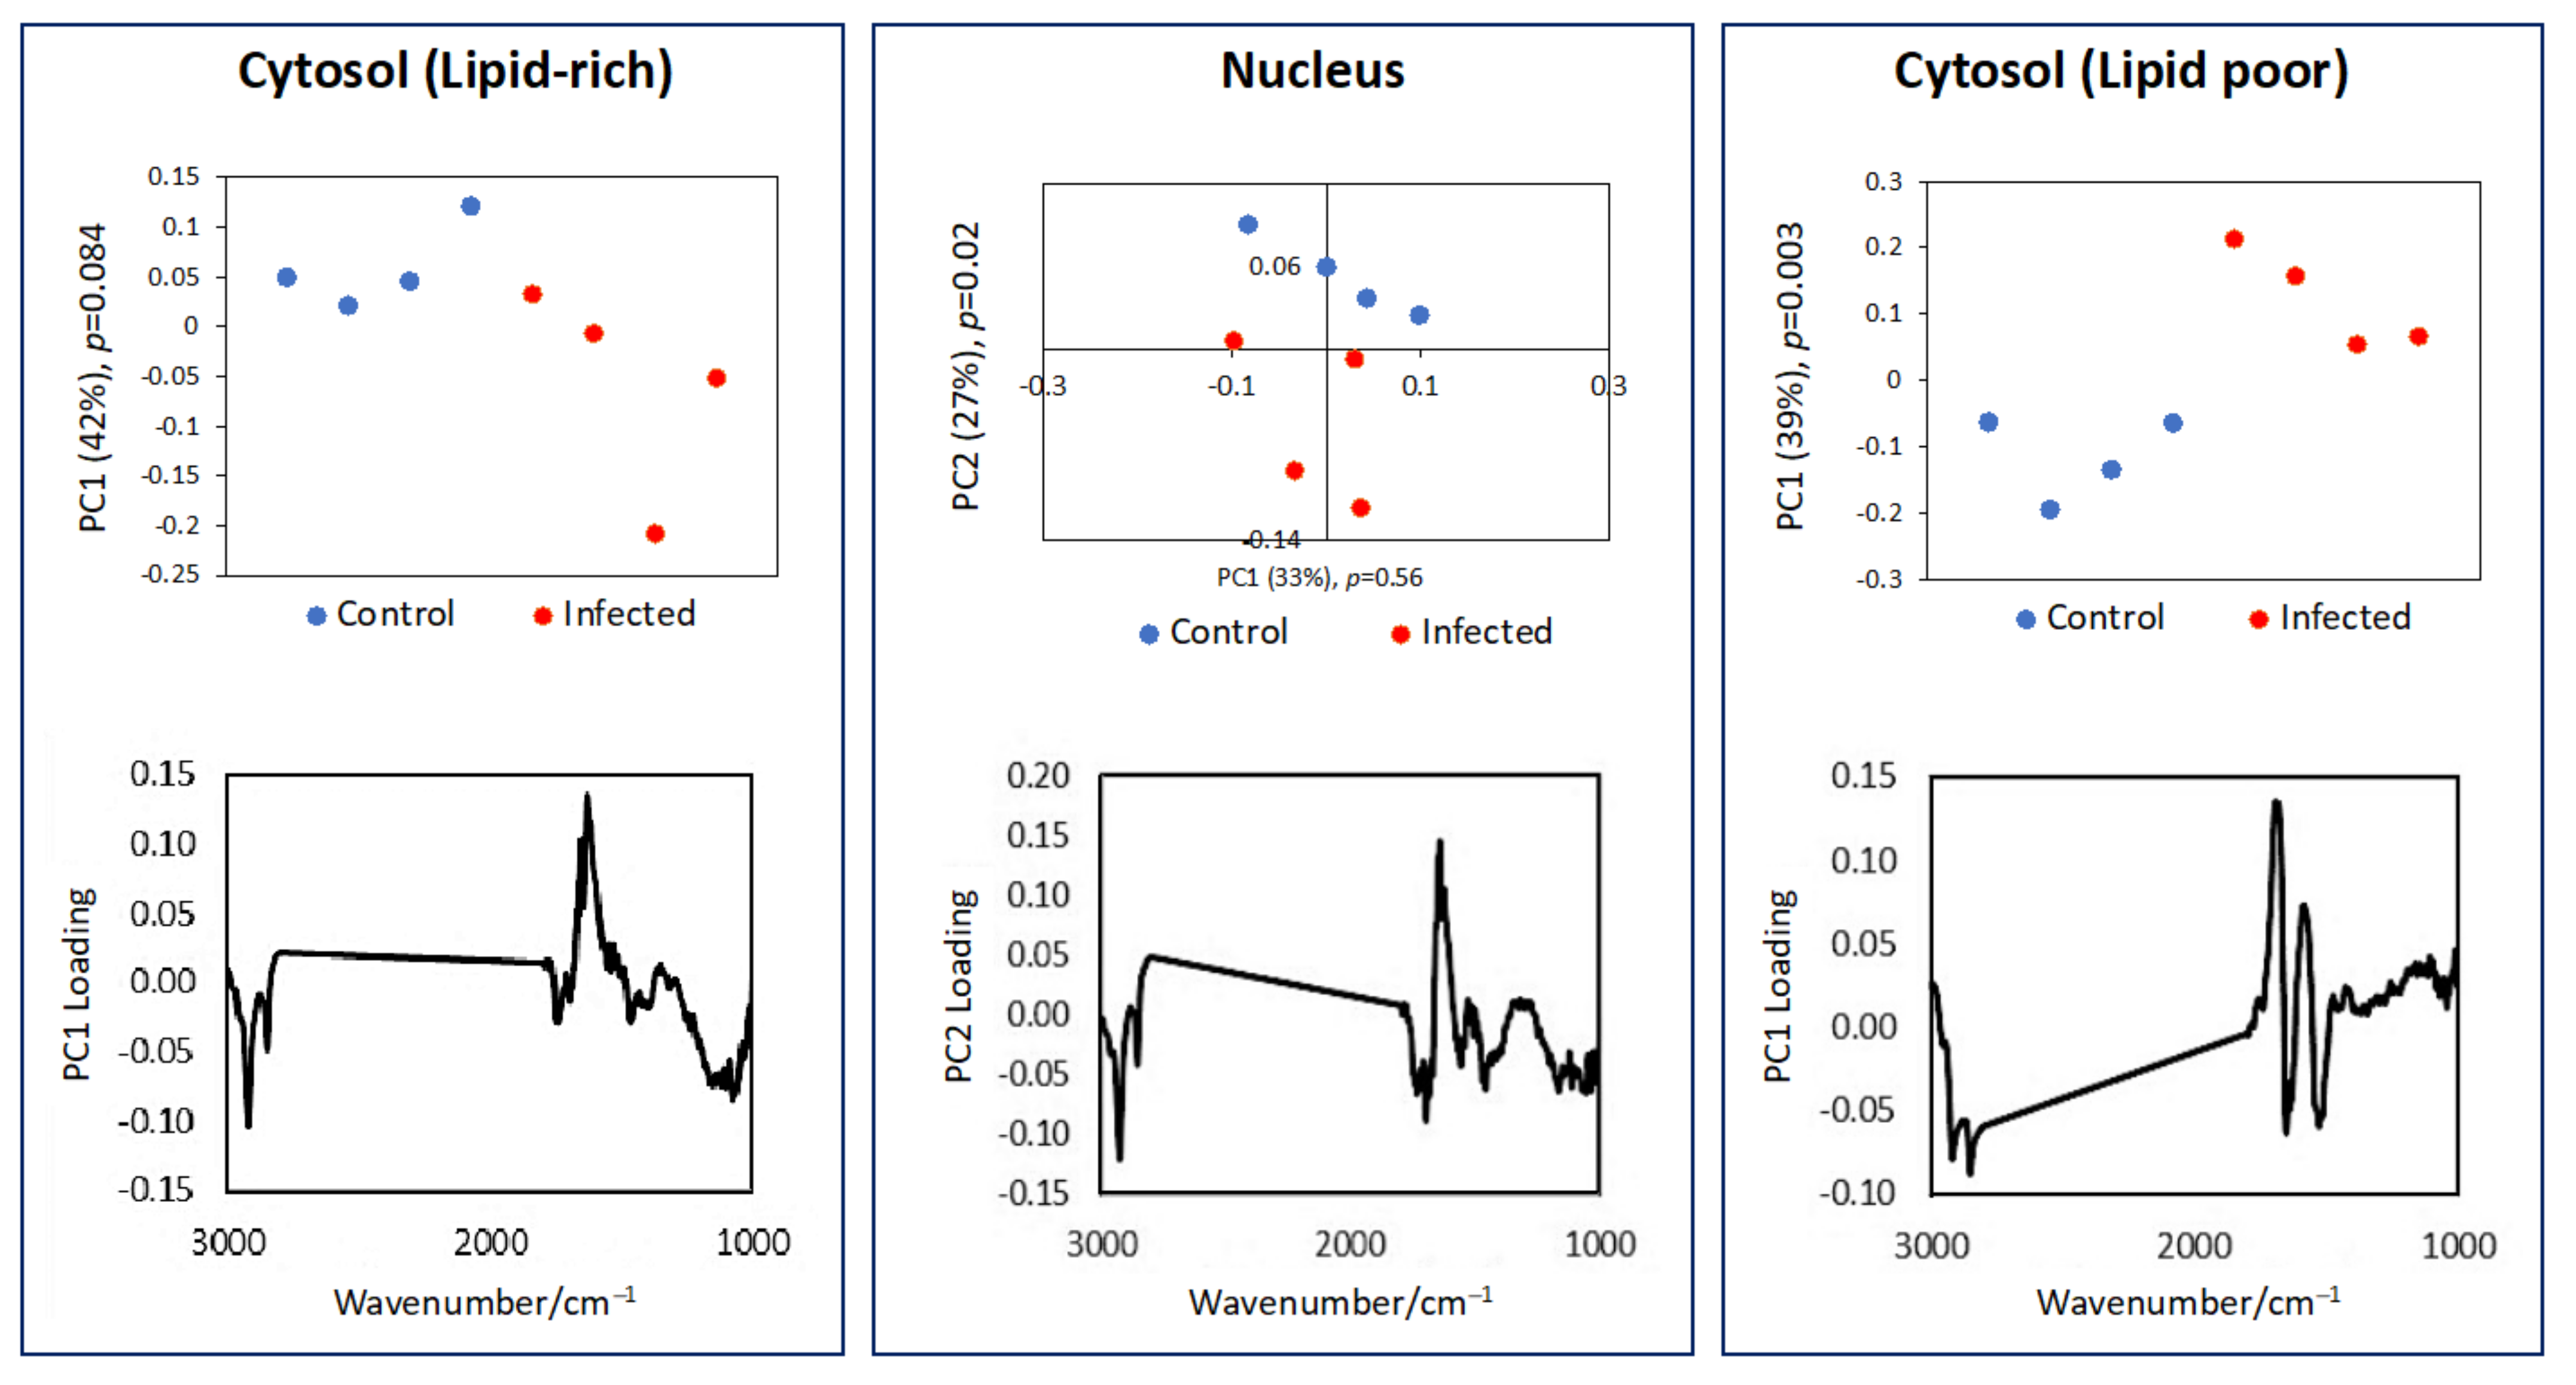
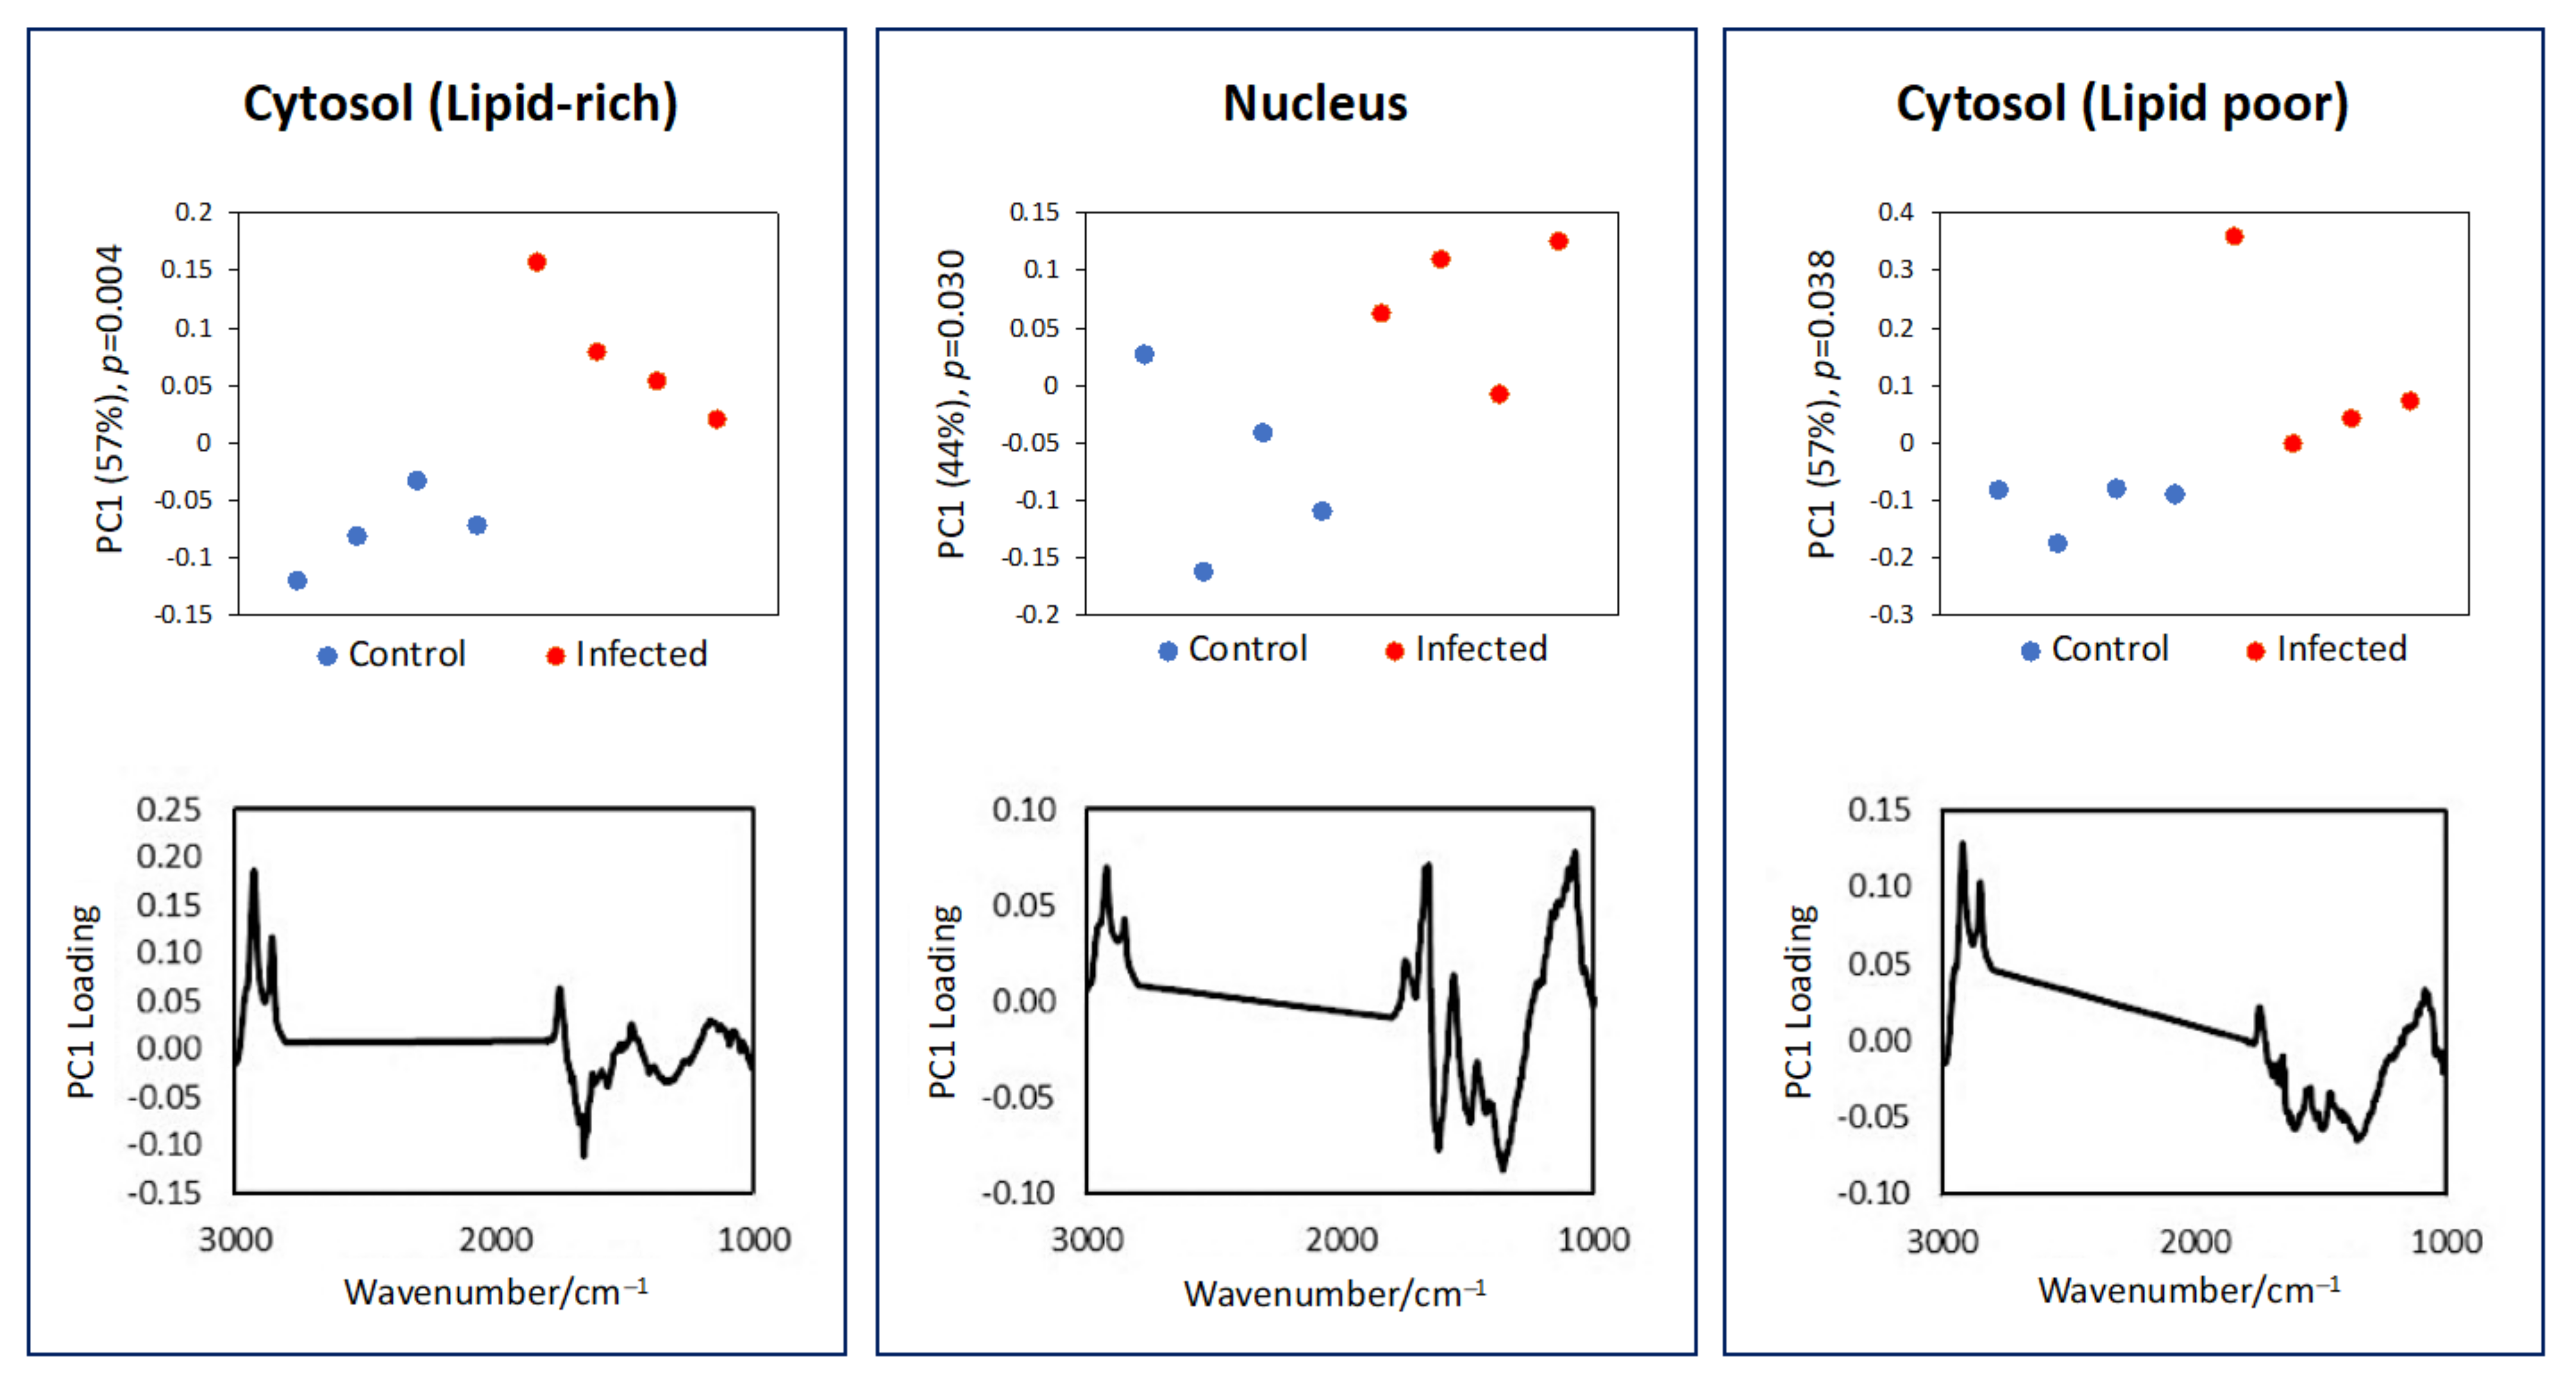
3.2. Subcellular Mapping Using Synchrotron MicroFTIR and ZnS Hemispheres
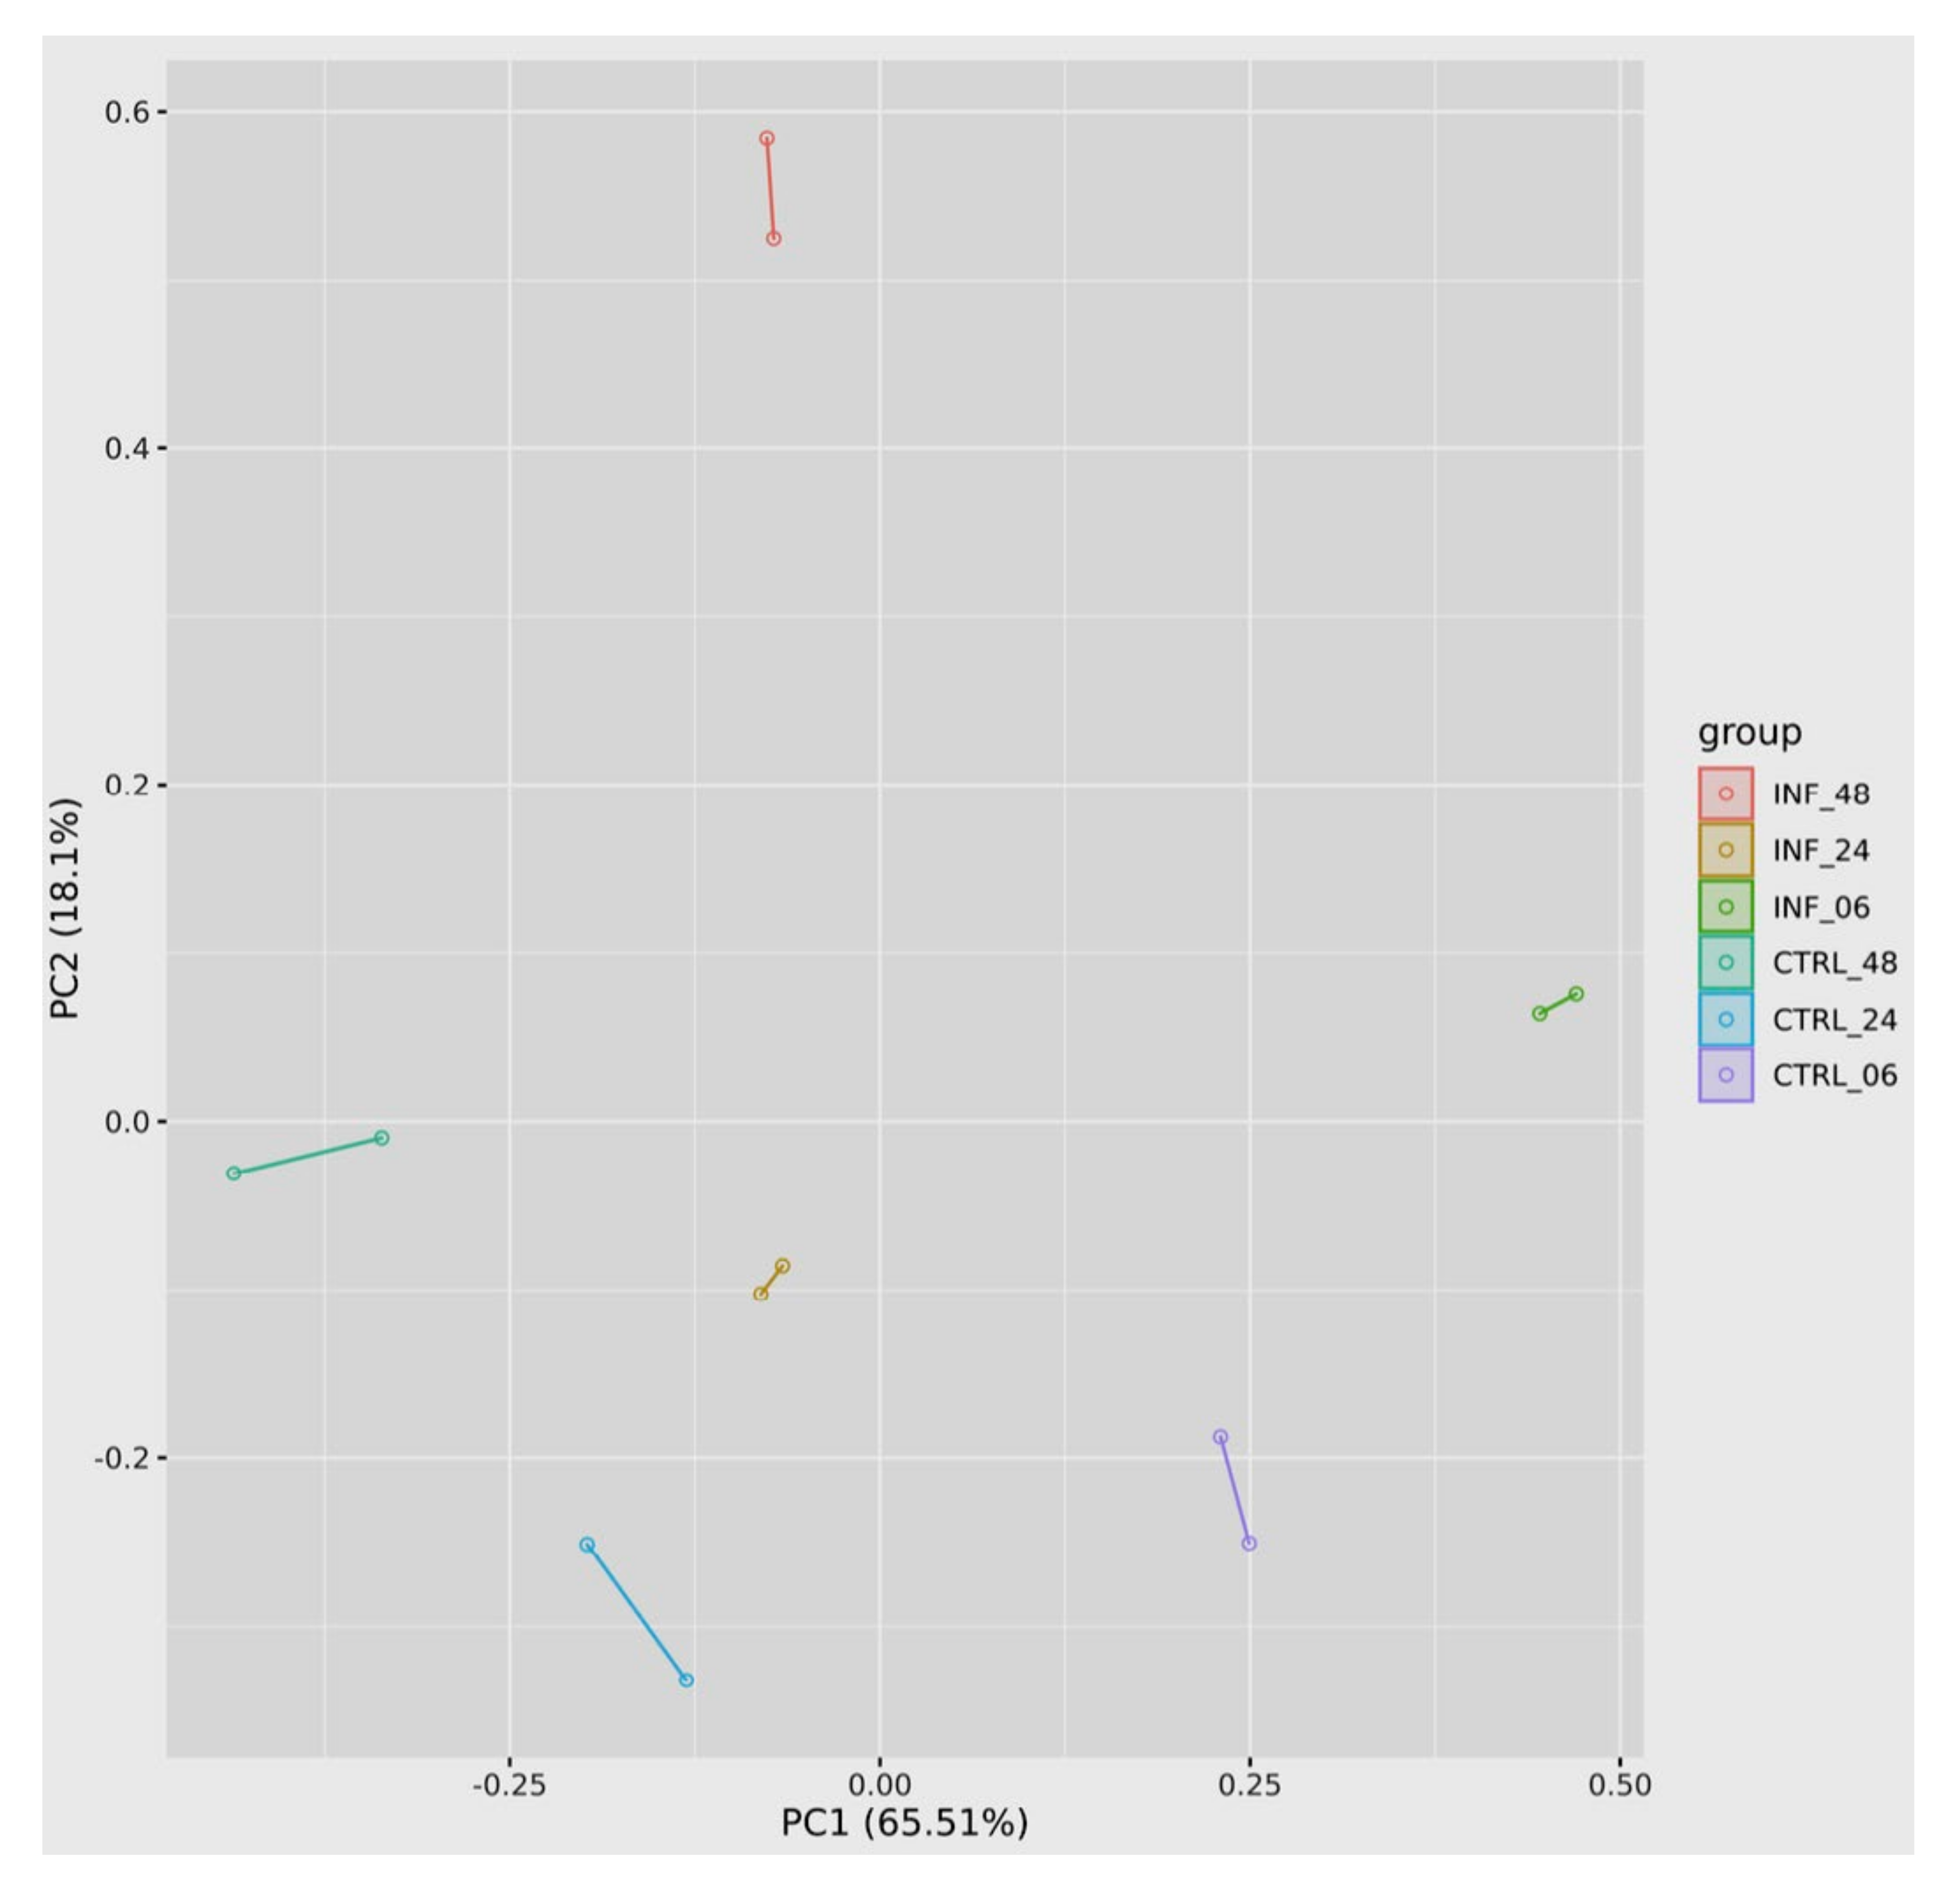
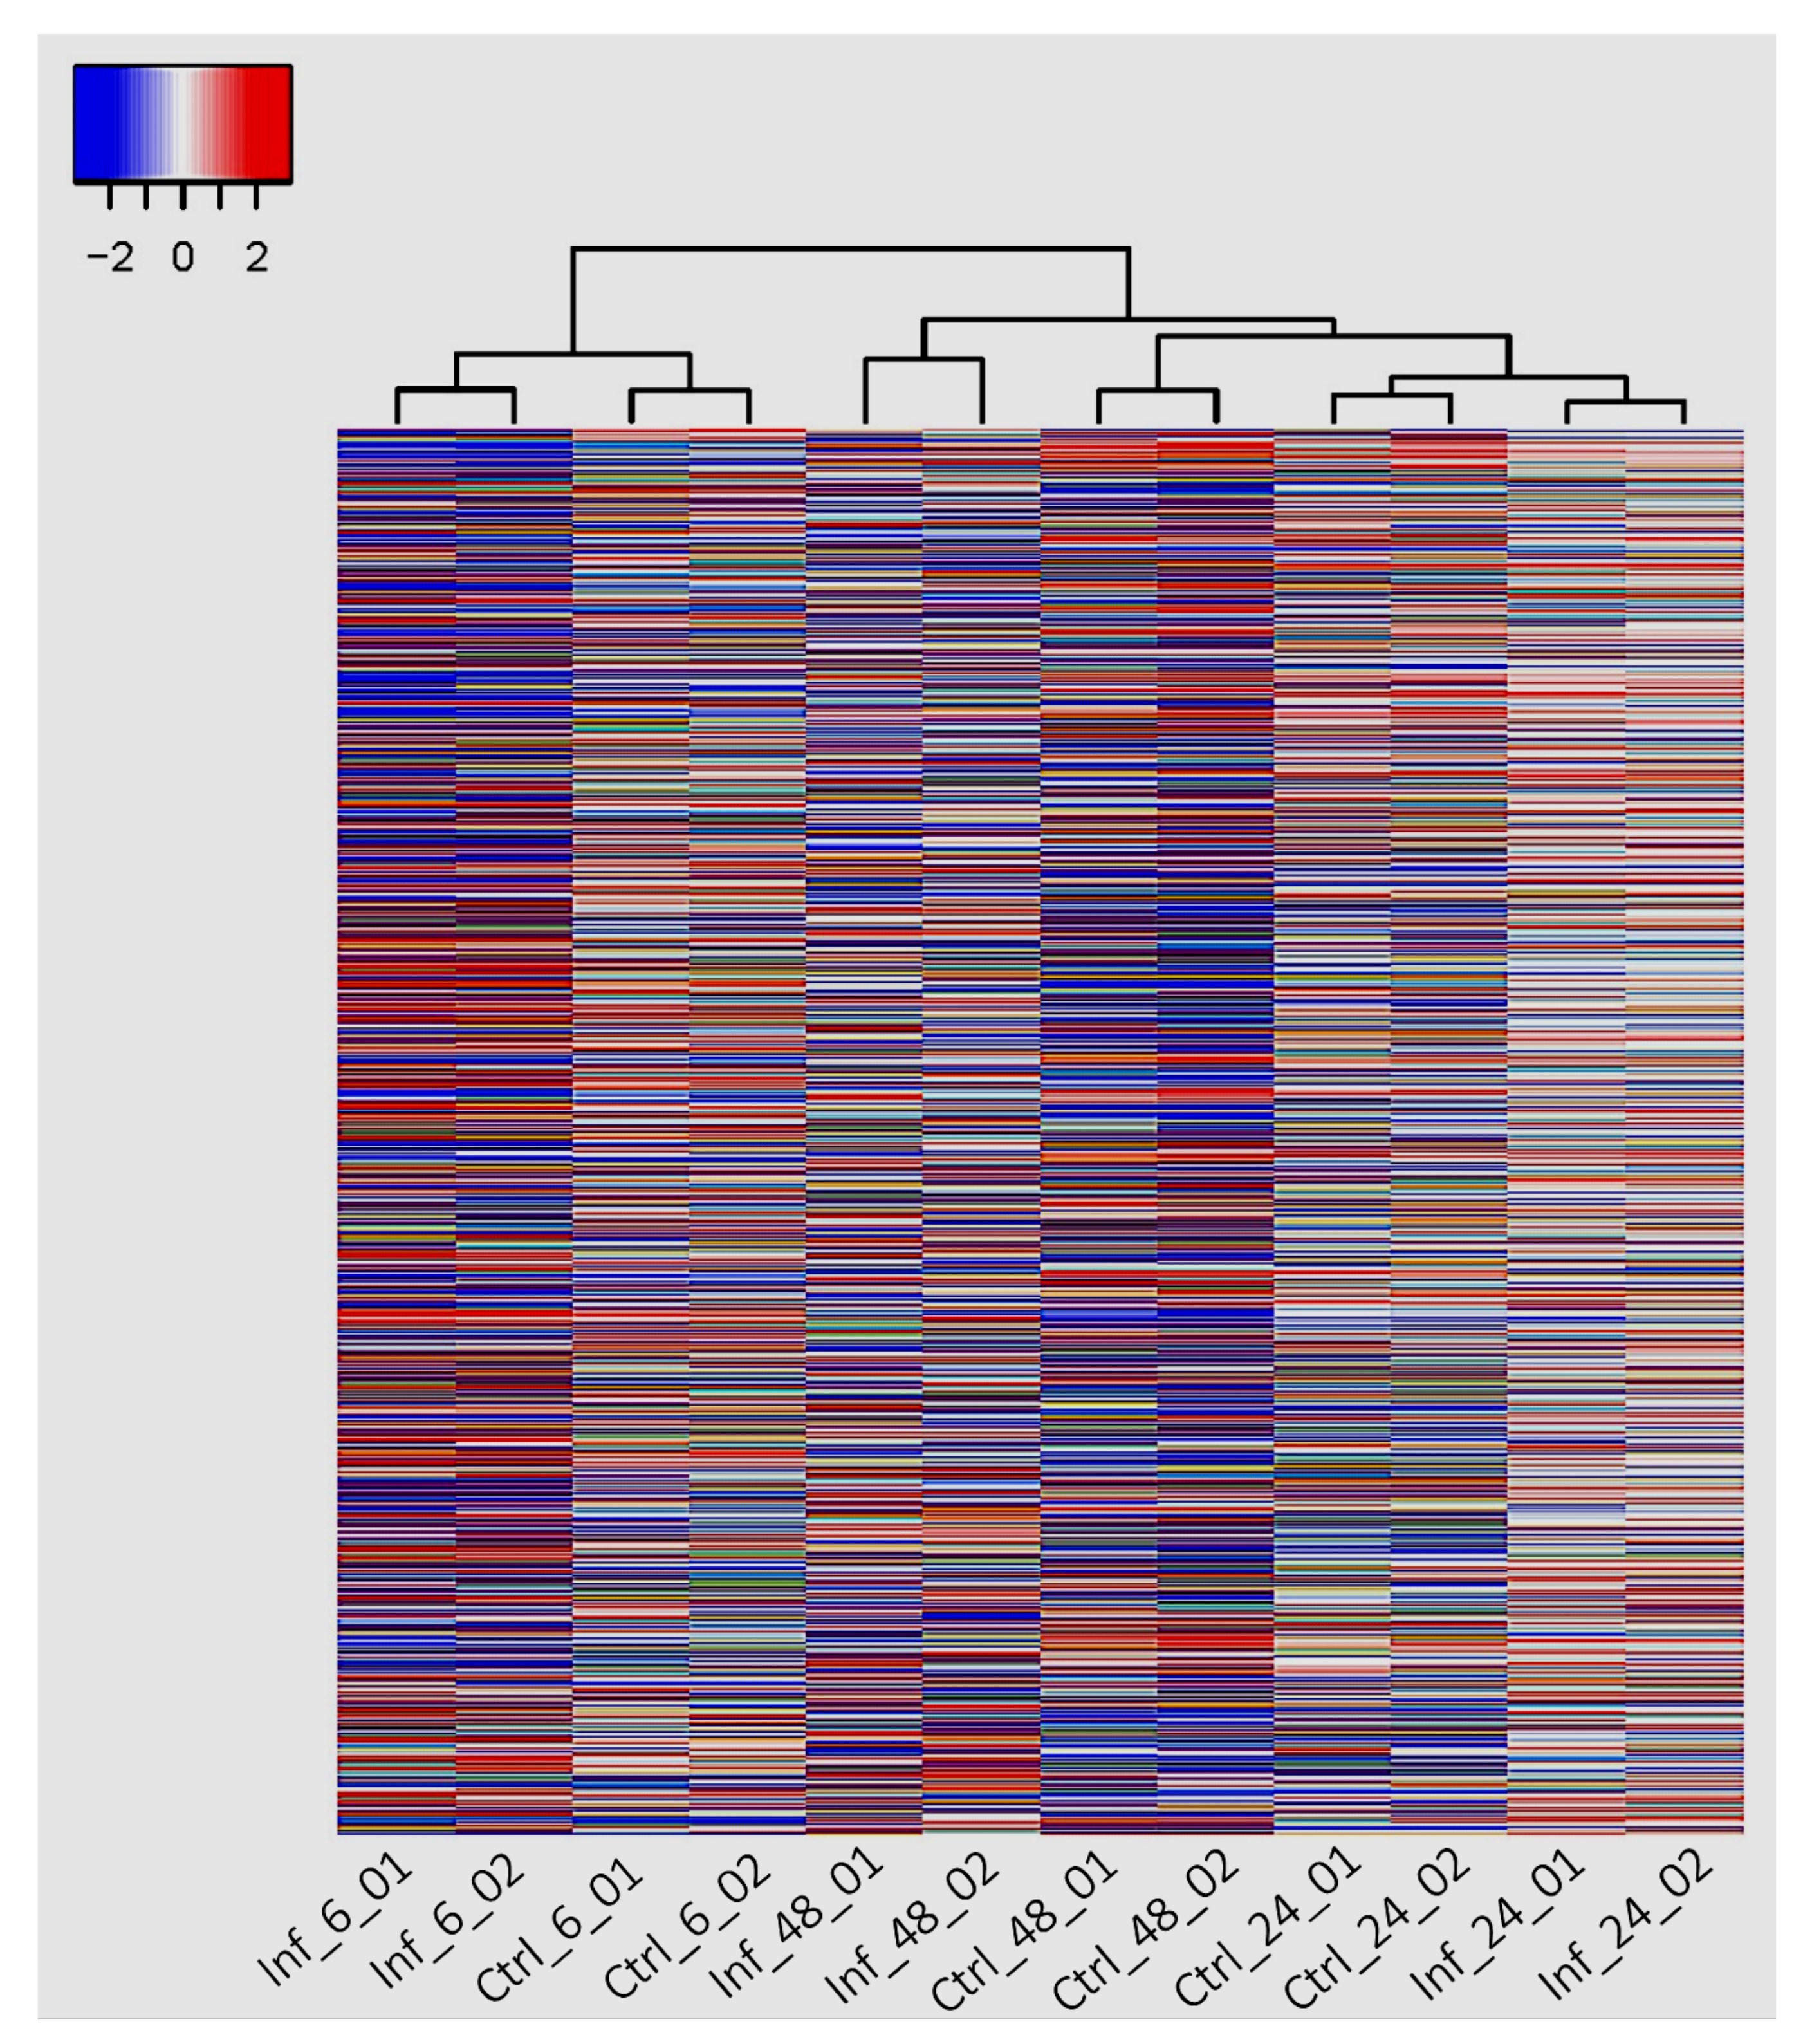
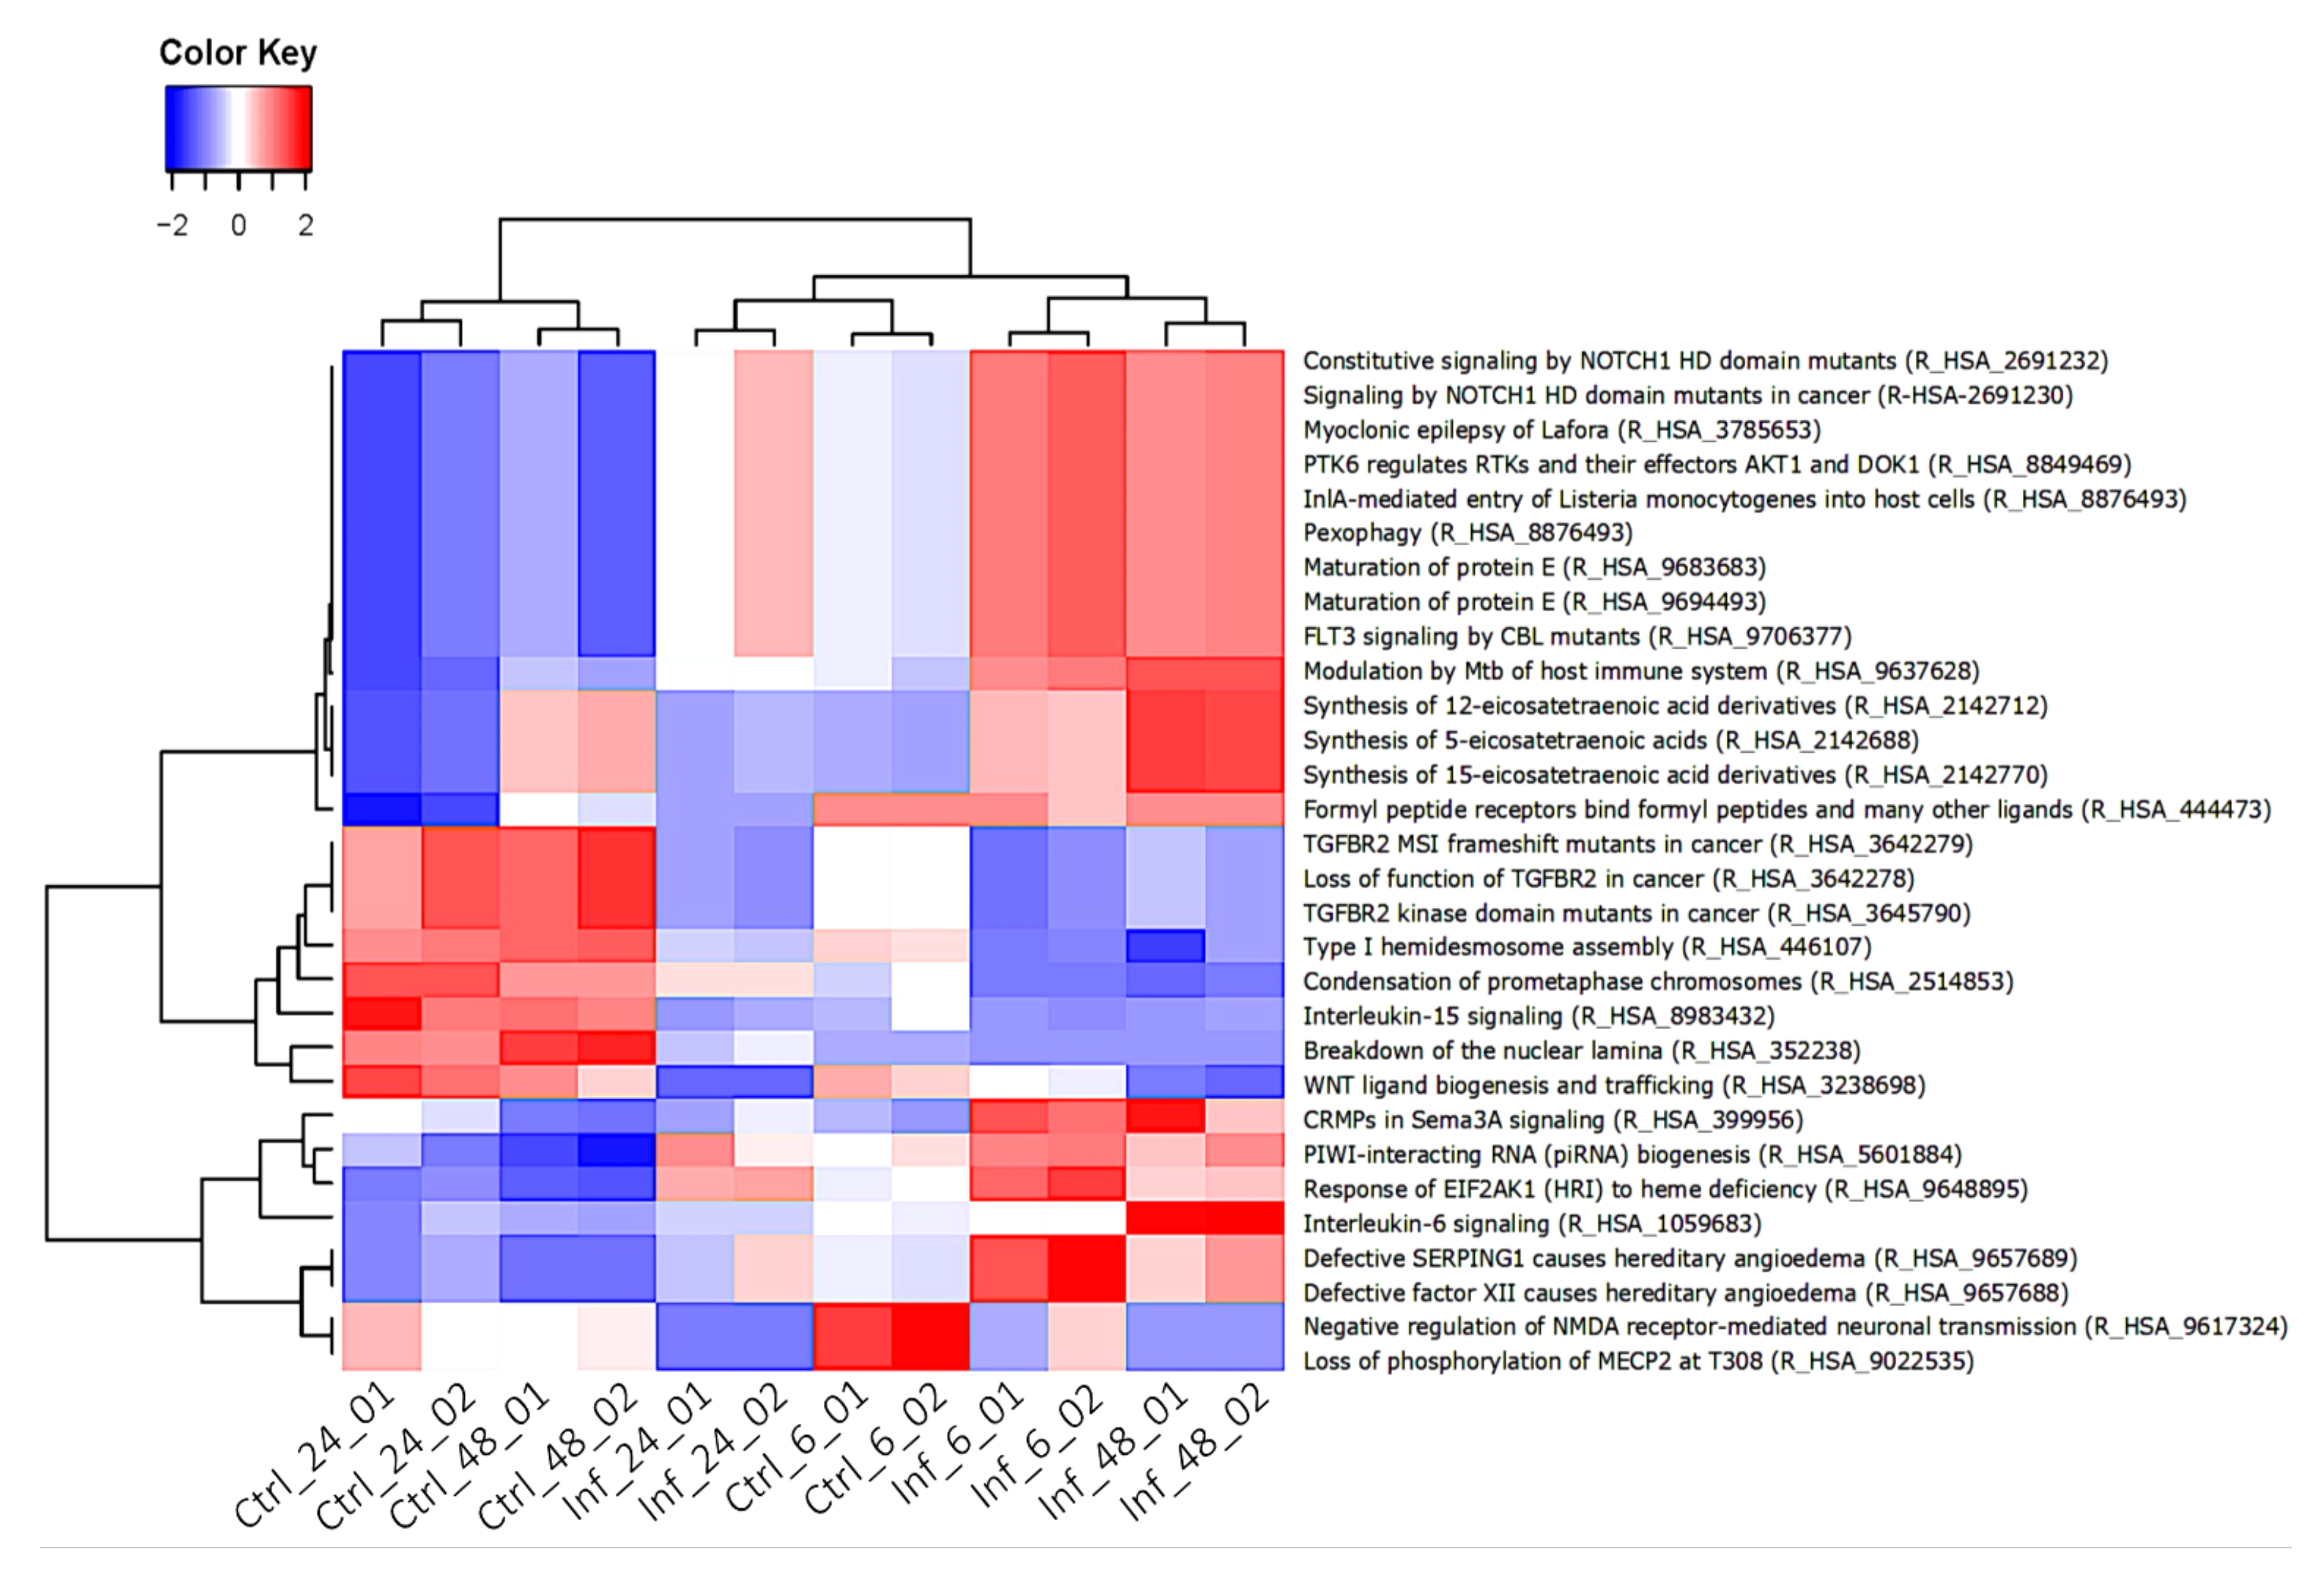
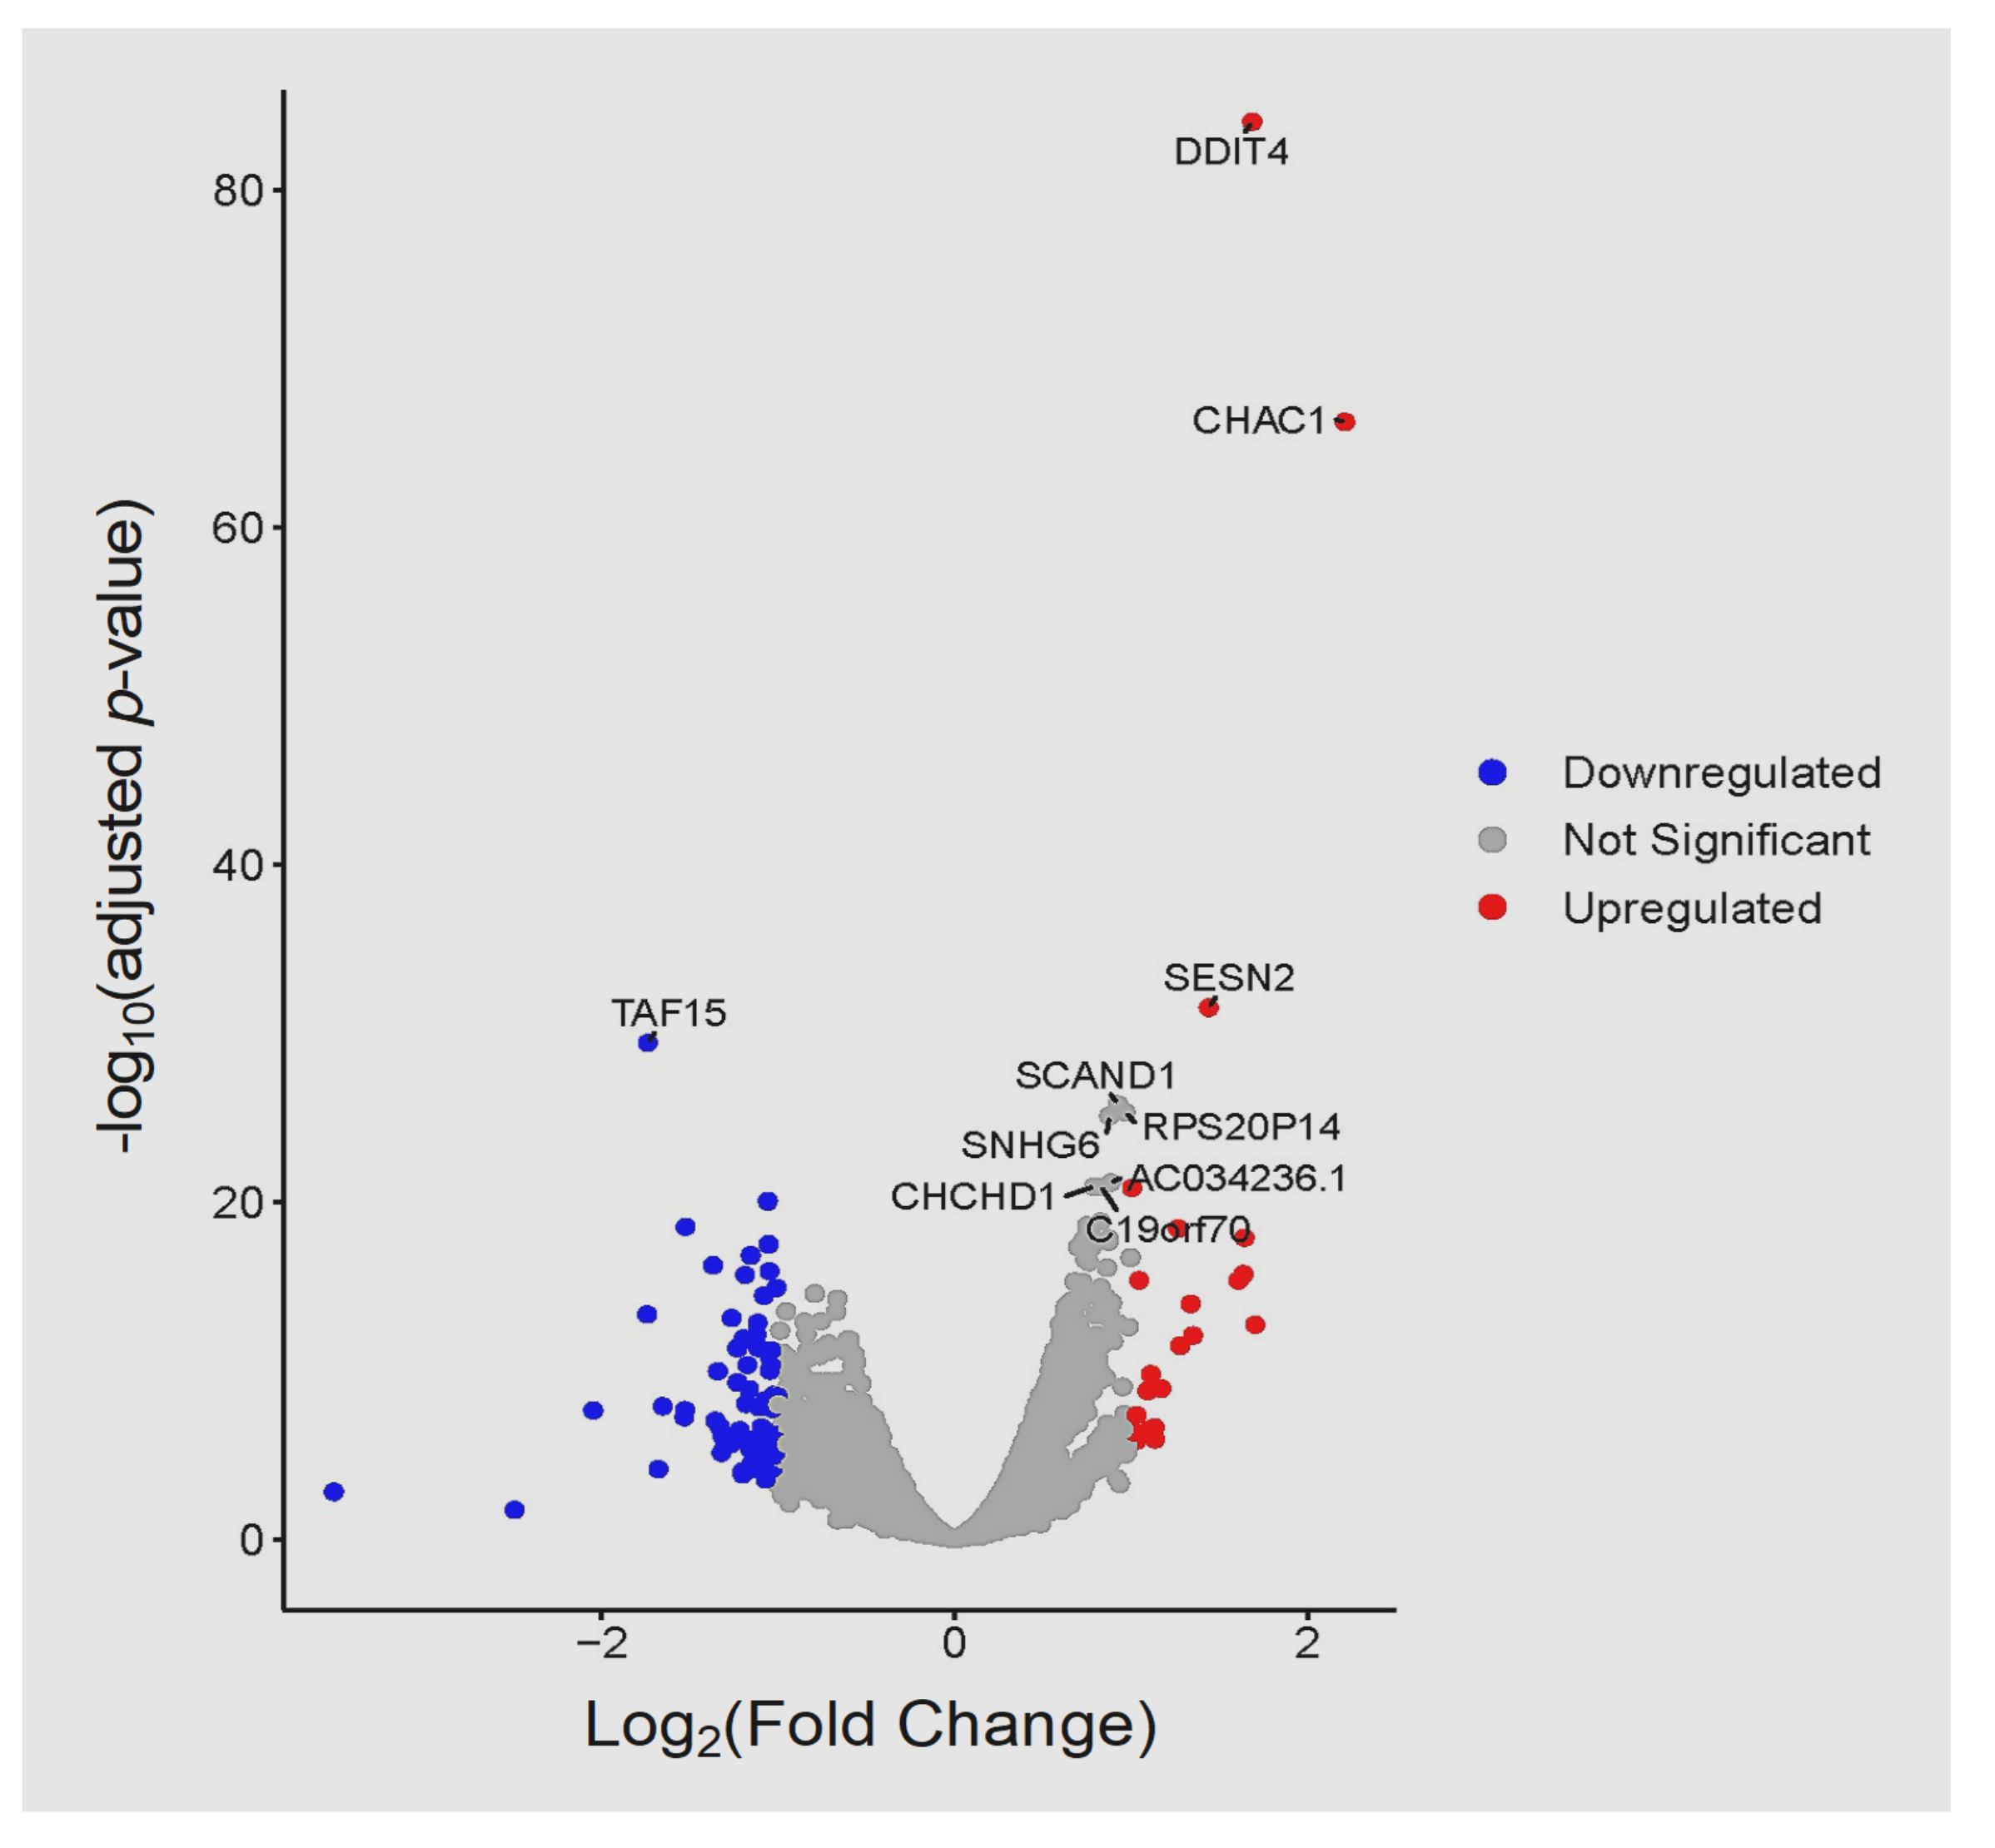
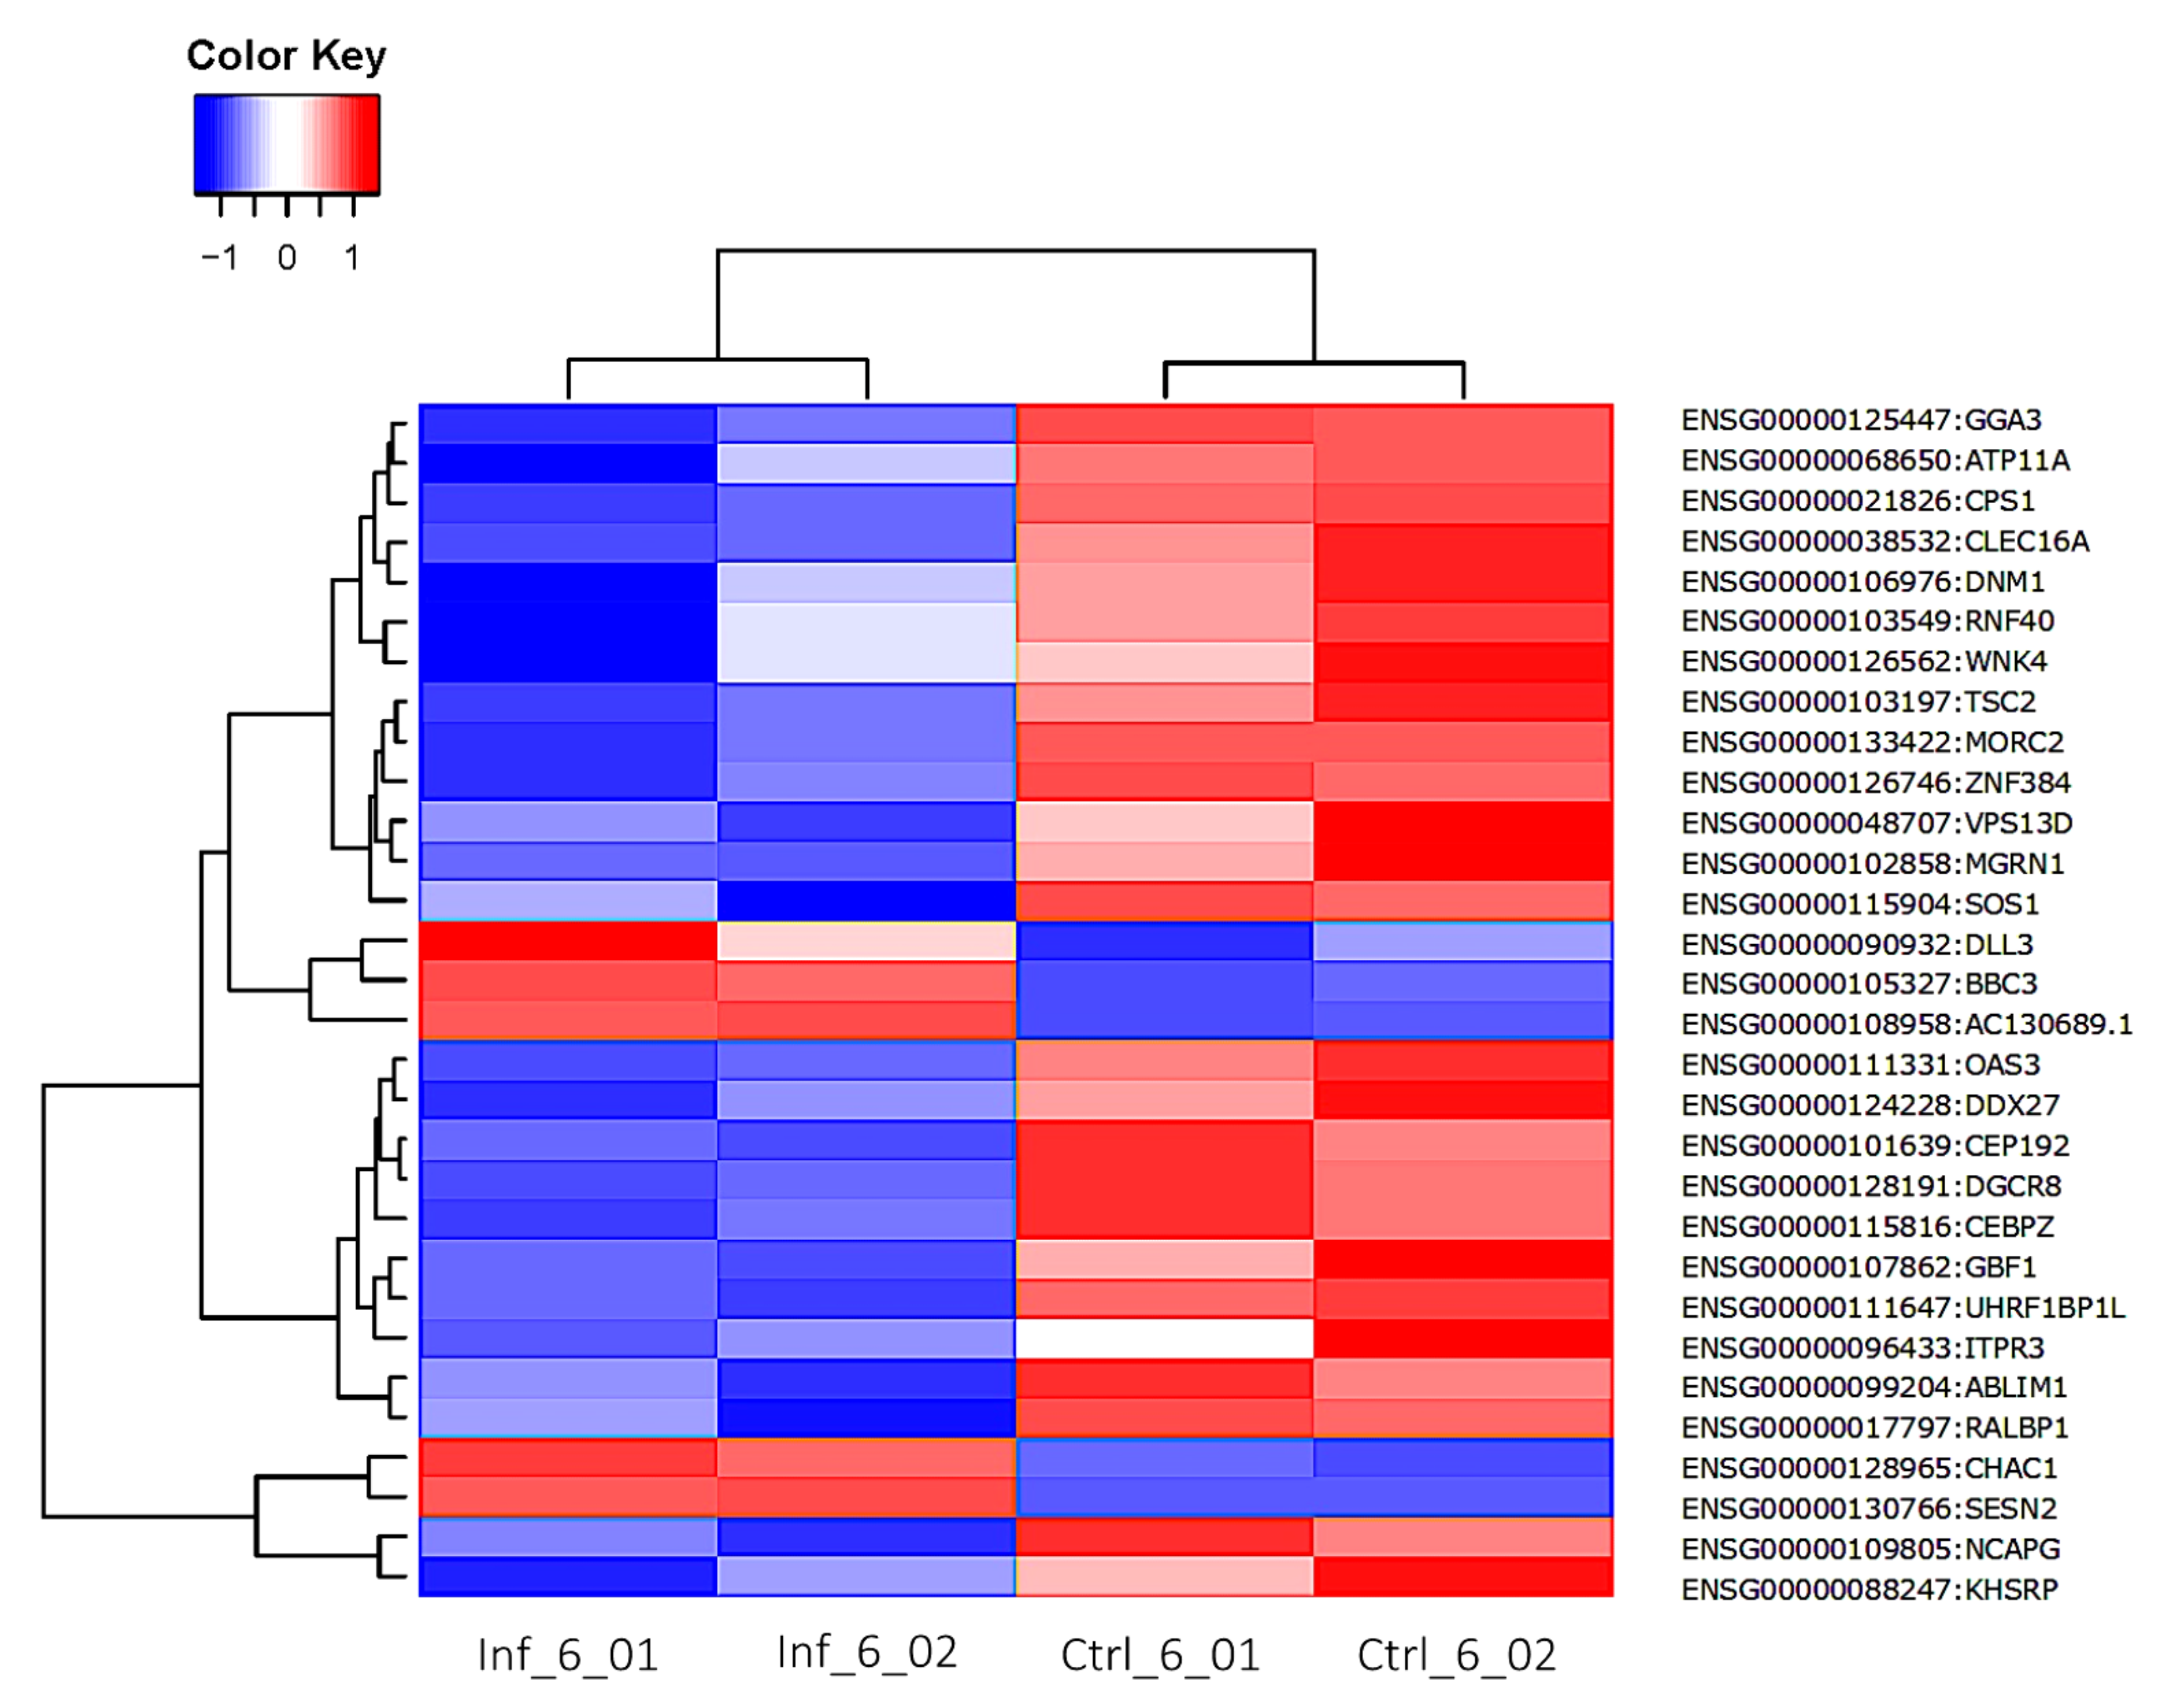
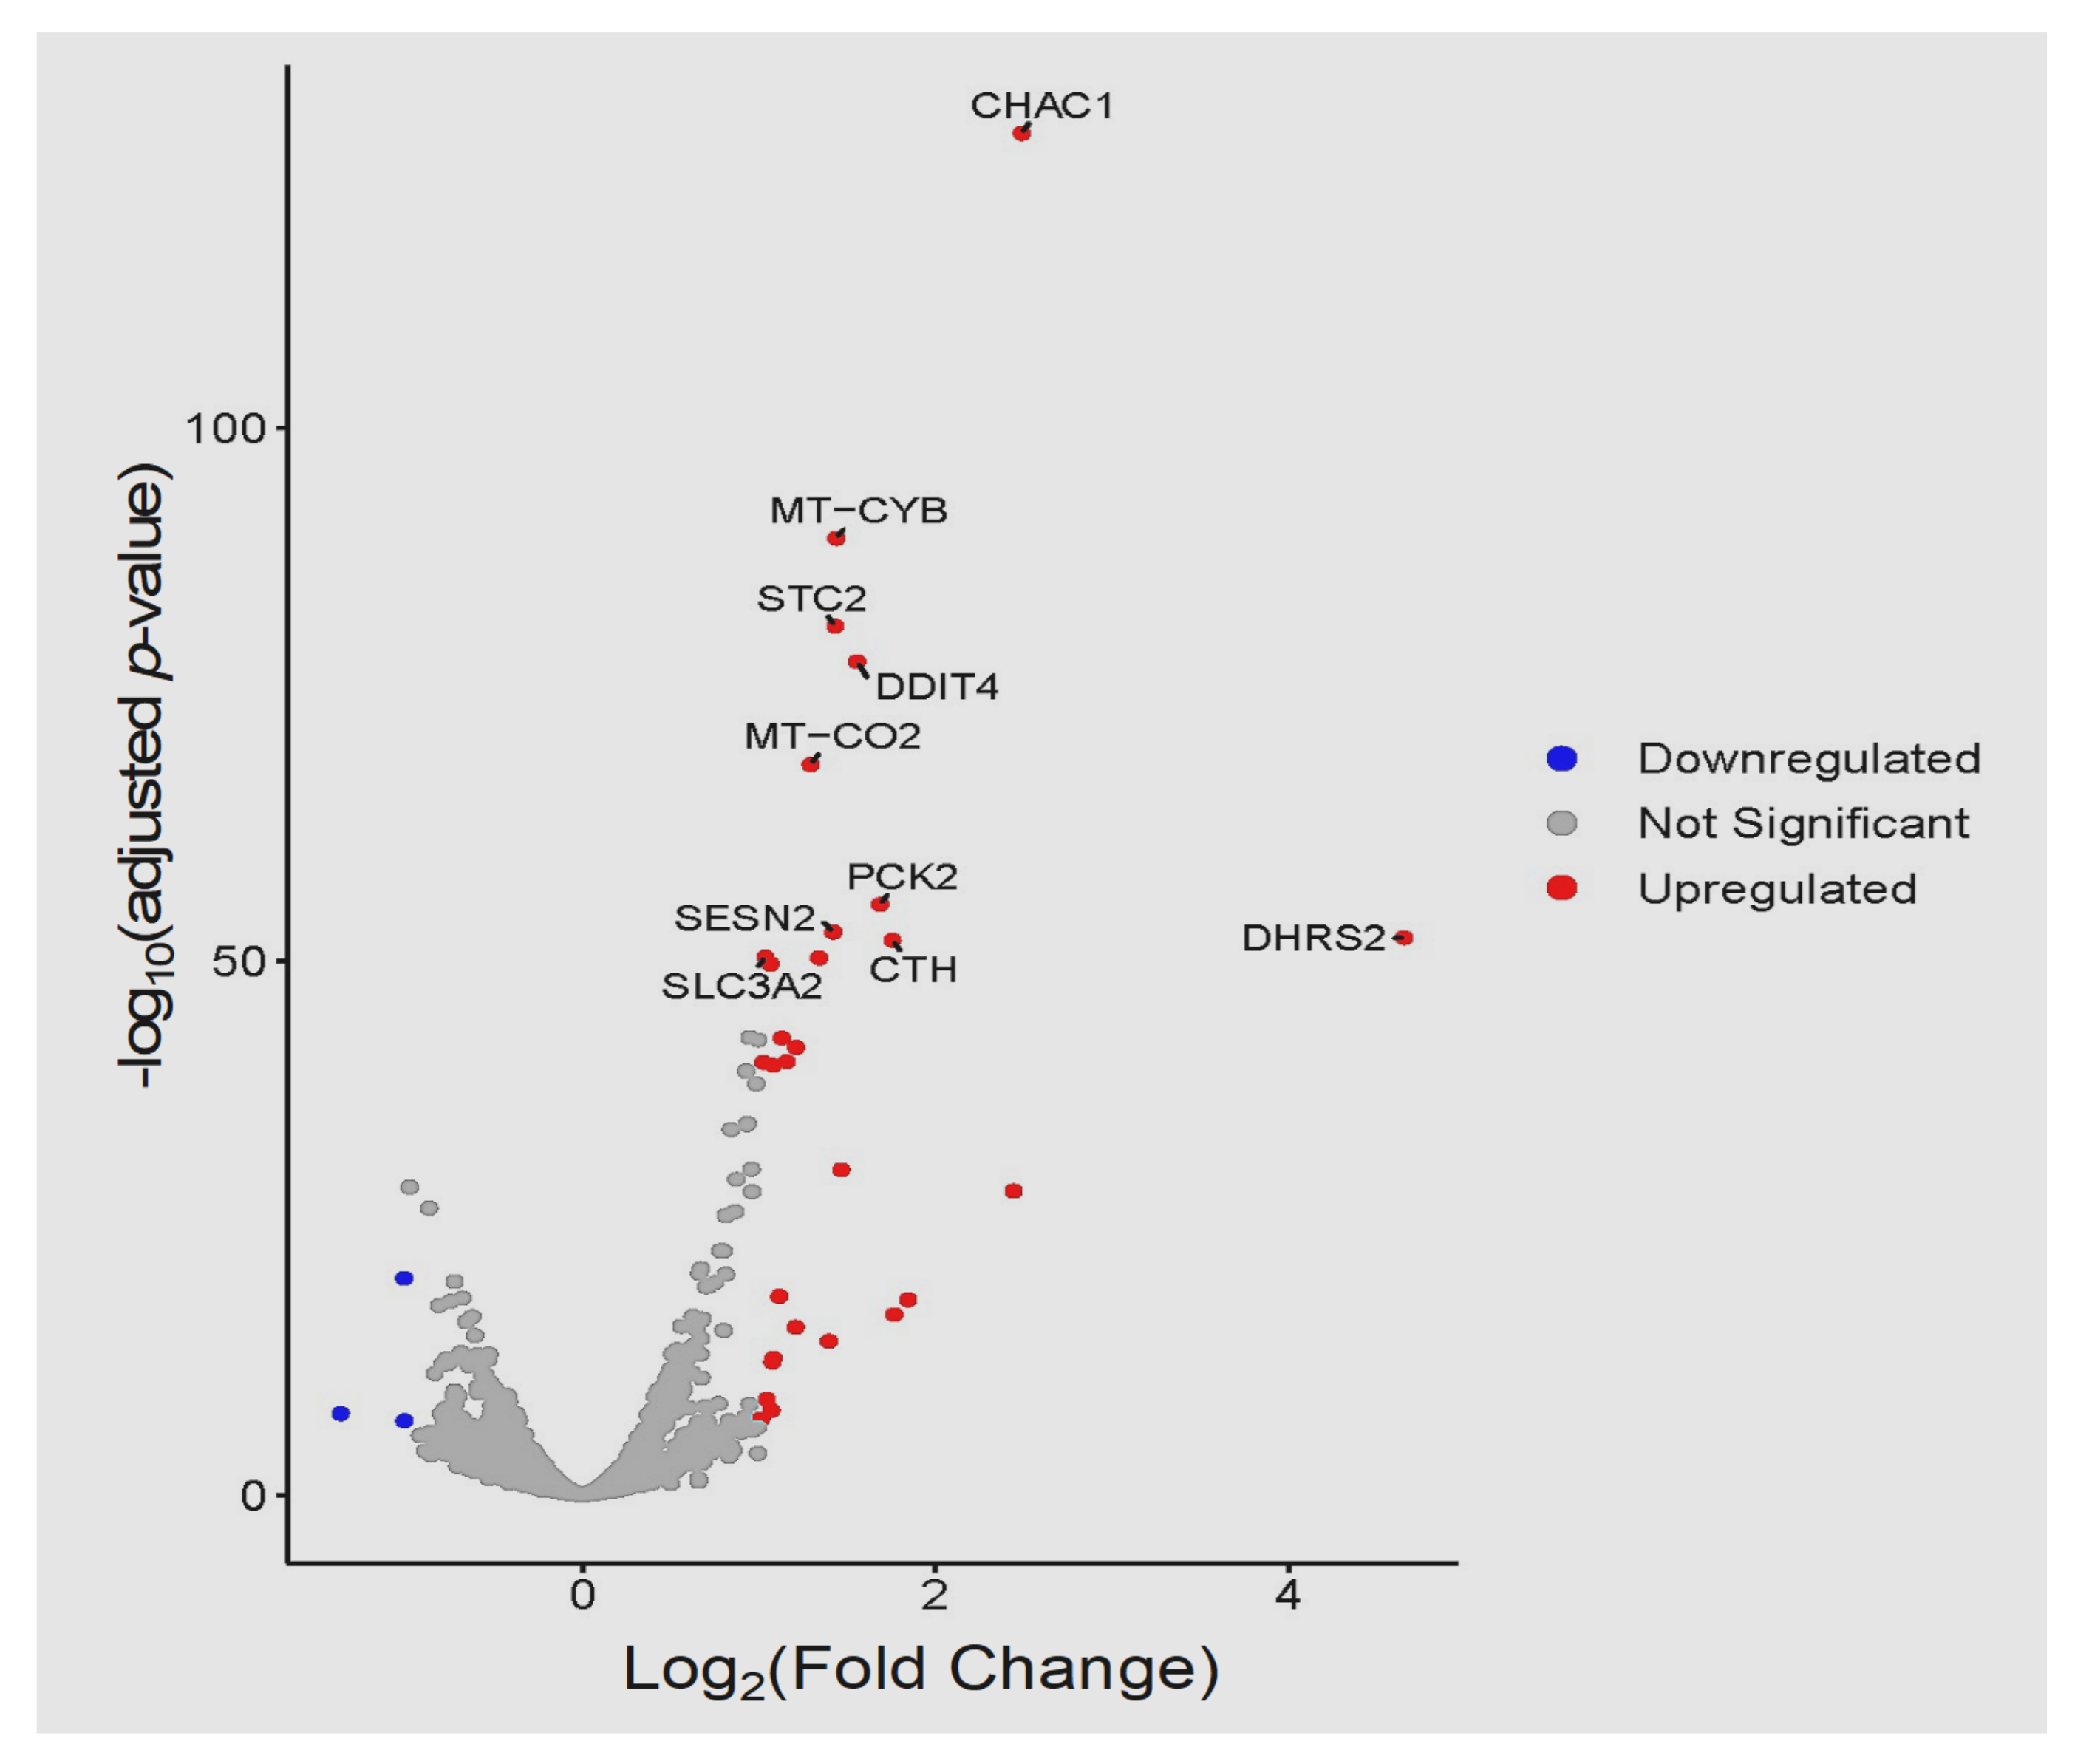
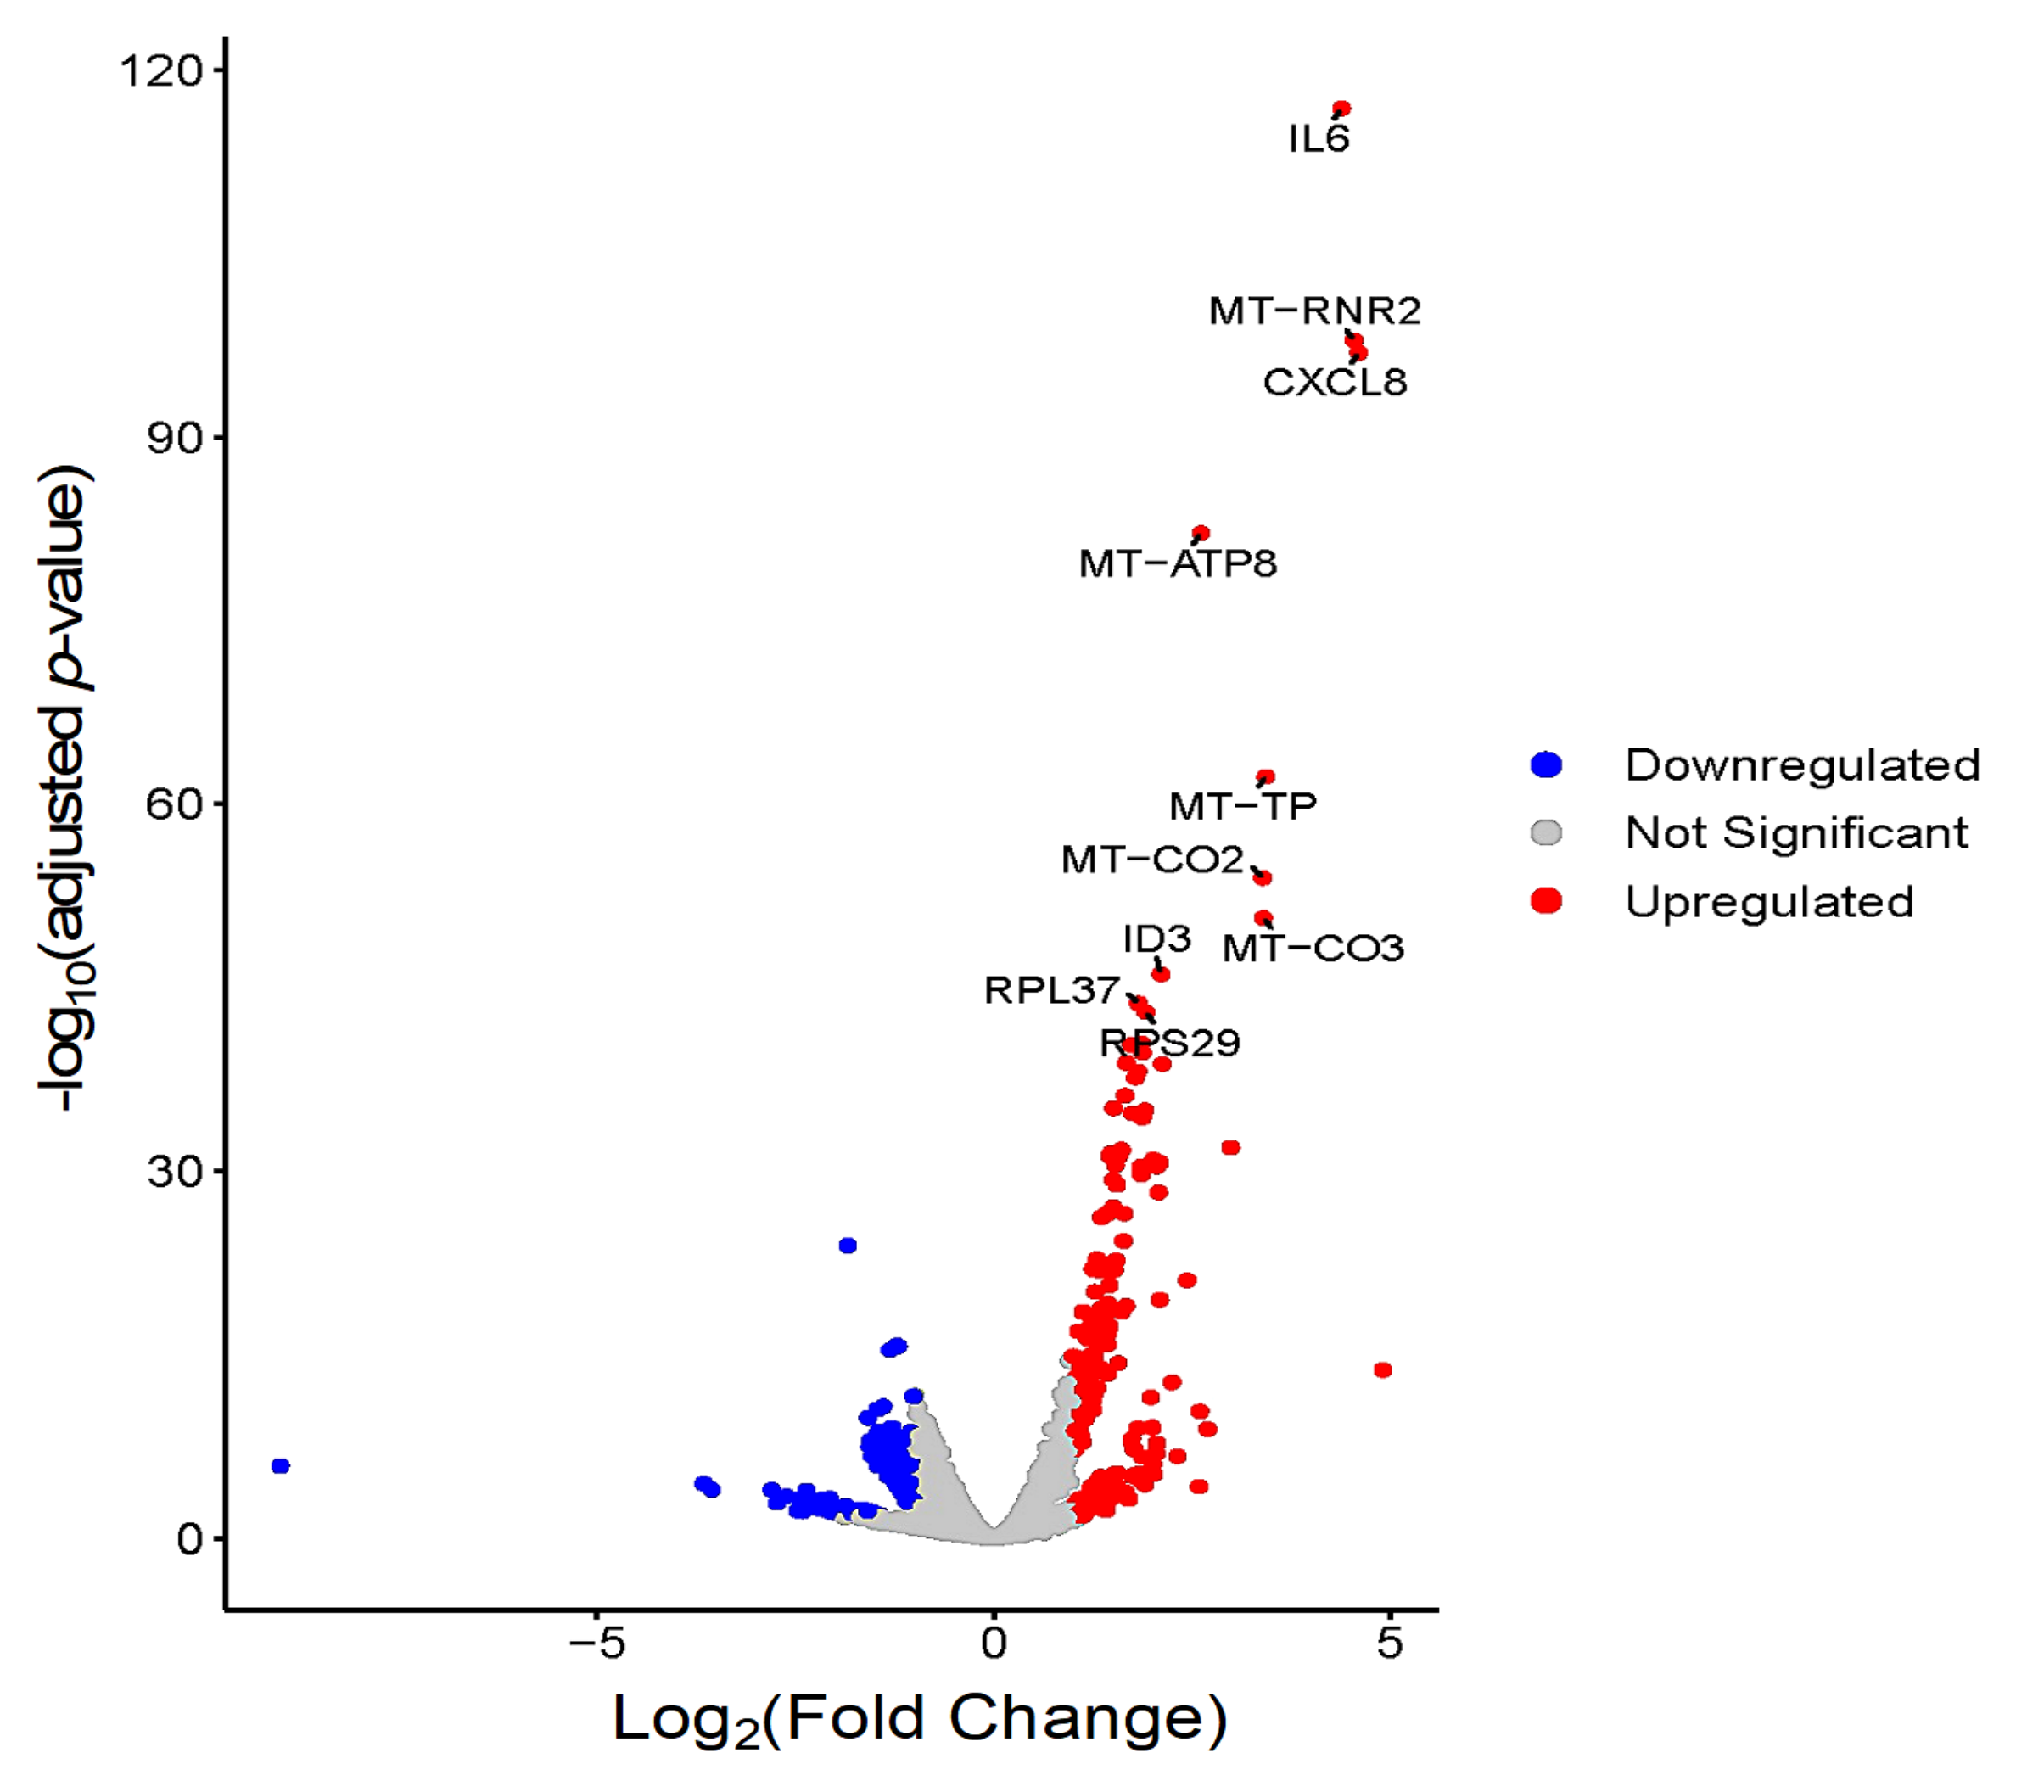
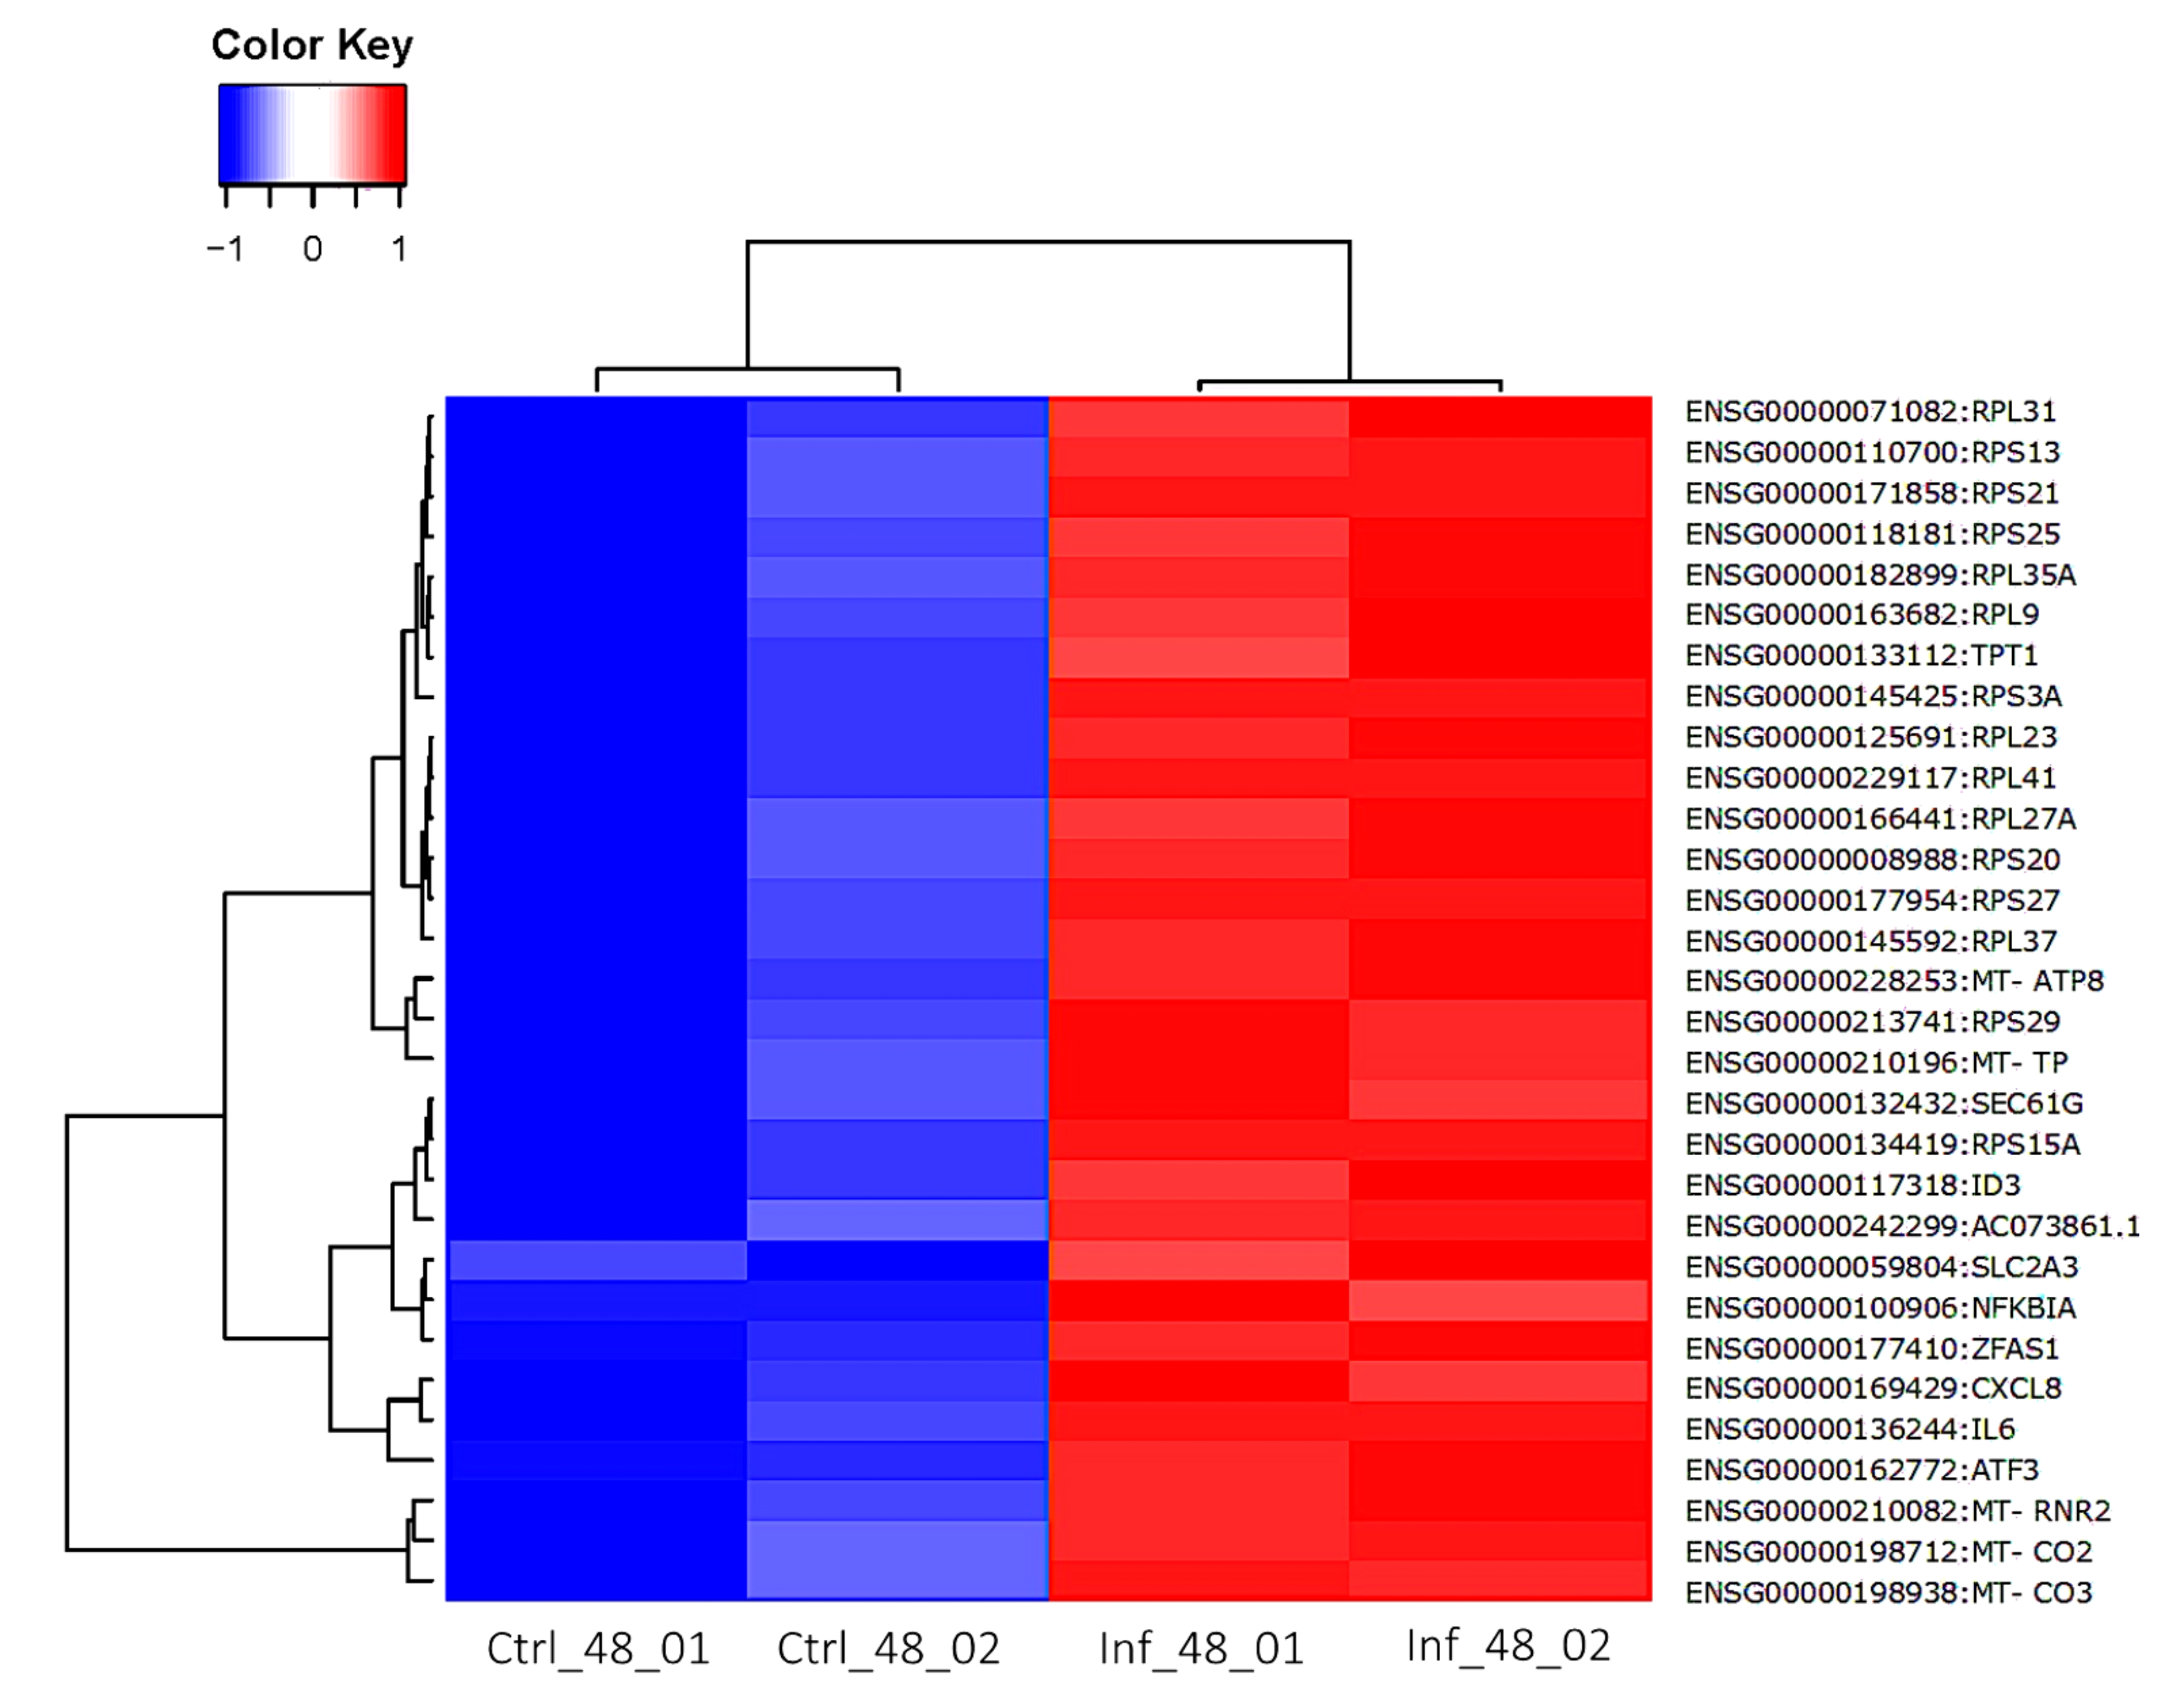
3.3. Global Transcriptomic Changes
4. Discussion
5. Conclusions
Supplementary Materials
Author Contributions
Funding
Institutional Review Board Statement
Informed Consent Statement
Data Availability Statement
Acknowledgments
Conflicts of Interest
References
- Hill, D.E.; Chirukandoth, S.; Dubey, J.P. Biology and epidemiology of Toxoplasma gondii in man and animals. Anim. Health Res. Rev. 2005, 6, 41–61. [Google Scholar] [CrossRef]
- Elsheikha, H.M. Congenital toxoplasmosis: Priorities for further health promotion action. Public Health 2008, 122, 335–353. [Google Scholar] [CrossRef]
- Elsheikha, H.M.; Marra, C.M.; Zhu, X.Q. Epidemiology, pathophysiology, diagnosis, and management of cerebral toxoplasmosis. Clin. Microbiol. Rev. 2021, 34, e00115-19. [Google Scholar] [CrossRef]
- Naemat, A.; Elsheikha, H.M.; Al-Sandaqchi, A.; Kong, K.; Ghita, A.; Notingher, I. Analysis of interaction between the apicomplexan protozoan Toxoplasma gondii and host cells using label-free Raman spectroscopy. Analyst 2015, 140, 756–764. [Google Scholar] [CrossRef]
- Ma, J.; He, J.J.; Hou, J.L.; Zhou, C.X.; Zhang, F.K.; Elsheikha, H.M.; Zhu, X.Q. Metabolomic signature of mouse cerebral cortex following Toxoplasma gondii infection. Parasit. Vectors 2019, 12, 373. [Google Scholar] [CrossRef]
- Zhou, C.X.; Zhou, D.H.; Elsheikha, H.M.; Liu, G.X.; Suo, X.; Zhu, X.Q. Global metabolomic profiling of Mice brains following experimental infection with the cyst-forming Toxoplasma gondii. PLoS ONE 2015, 10, e0139635. [Google Scholar] [CrossRef]
- Al-Sandaqchi, A.T.; Marsh, V.; Williams, H.E.L.; Stevenson, C.W.; Elsheikha, H.M. Structural, functional, and metabolic alterations in human cerebrovascular endothelial cells during Toxoplasma gondii infection and amelioration by verapamil in vitro. Microorganisms 2020, 8, 1386. [Google Scholar] [CrossRef]
- Kendall, C.; Isabelle, M.; Bazant-Hegemark, F.; Hutchings, J.; Orr, L.; Babrah, J.; Baker, R.; Stone, N. Vibrational spectroscopy: A clinical tool for cancer diagnostics. Analyst 2009, 134, 1029–1045. [Google Scholar] [CrossRef]
- Elsheikha, H.M.; Elsaied, N.A.; Chan, K.L.A.; Brignell, C.; Harun, M.S.R.; Wehbe, K.; Cinque, G. Label-free characterization of biochemical changes within human cells under parasite attack using synchrotron based micro-FTIR. Anal. Methods 2019, 11, 2518–2530. [Google Scholar] [CrossRef]
- Wrobel, T.P.; Bhargava, R. Infrared spectroscopic imaging advances as an analytical technology for biomedical sciences. Anal. Chem. 2018, 90, 1444–1463. [Google Scholar] [CrossRef]
- Wrobel, T.P.; Marzec, K.M.; Majzner, K.; Kochan, K.; Bartus, M.; Chlopicki, S.; Baranska, M. Attenuated total reflection Fourier transform infrared (ATR-FTIR) spectroscopy of a single endothelial cell. Analyst 2012, 137, 4135–4139. [Google Scholar] [CrossRef]
- Chan, K.L.A.; Fale, P.L.V.; Atharawi, A.; Wehbe, K.; Cinque, G. Subcellular mapping of living cells via synchrotron microFTIR and ZnS hemispheres. Anal. Bioanal. Chem. 2018, 410, 6477–6487. [Google Scholar] [CrossRef]
- Chan, K.L.A.; Kazarian, S.G. Correcting the effect of refraction and dispersion of light in FT-IR spectroscopic imaging in transmission through thick infrared windows. Anal. Chem. 2013, 85, 1029–1036. [Google Scholar] [CrossRef]
- Chan, K.L.A.; Kazarian, S.G. Aberration-free FTIR spectroscopic imaging of live cells in microfluidic devices. Analyst 2013, 138, 4040–4047. [Google Scholar] [CrossRef]
- Chan, K.L.A.; Altharawi, A.; Fale, P.; Song, C.L.; Kazarian, S.G.; Cinque, G.; Untereiner, V.; Sockalingum, G.D. Transmission Fourier transform infrared spectroscopic imaging, mapping, and synchrotron scanning microscopy with zinc sulfide hemispheres on living mammalian cells at sub-cellular resolution. Appl. Spectrosc. 2020, 74, 544–552. [Google Scholar] [CrossRef]
- Elsheikha, H.M.; McKinlay, C.L.; Elsaied, N.A.; Smith, P.A. Effects of Neospora caninum infection on brain microvascular endothelial cells bioenergetics. Parasit. Vectors 2013, 6, 24. [Google Scholar] [CrossRef]
- Elsheikha, H.M.; Alkurashi, M.; Kong, K.; Zhu, X.Q. Metabolic footprinting of extracellular metabolites of brain endothelium infected with Neospora caninum in vitro. BMC Res. Notes 2014, 7, 406. [Google Scholar] [CrossRef]
- Al-Sandaqchi, A.T.; Brignell, C.; Collingwood, J.F.; Geraki, K.; Mirkes, E.M.; Kong, K.; Castellanos, M.; May, S.T.; Stevenson, C.W.; Elsheikha, H.M. Metallome of cerebrovascular endothelial cells infected with Toxoplasma gondii using mu-XRF imaging and inductively coupled plasma mass spectrometry. Metallomics 2018, 10, 1401–1414. [Google Scholar] [CrossRef]
- Elsheikha, H.M.; Alkurashi, M.; Palfreman, S.; Castellanos, M.; Kong, K.; Ning, E.; Elsaied, N.A.; Geraki, K.; MacNaughtan, W. Impact of Neospora caninum infection on the bioenergetics and transcriptome of cerebrovascular endothelial cells. Pathogens 2020, 9, 710. [Google Scholar] [CrossRef]
- Harun, M.S.R.; Taylor, M.; Zhu, X.Q.; Elsheikha, H.M. Transcriptome profiling of Toxoplasma gondii-infected human cerebromicrovascular endothelial cell response to treatment with monensin. Microorganisms 2020, 8, 842. [Google Scholar] [CrossRef]
- Elsheikha, H.M.; Rosenthal, B.M.; Murphy, A.J.; Dunams, D.B.; Neelis, D.A.; Mansfield, L.S. Generally applicable methods to purify intracellular coccidia from cell cultures and to quantify purification efficacy using quantitative PCR. Vet. Parasitol. 2006, 135, 223–234. [Google Scholar] [CrossRef] [PubMed]
- Jarvis, R.M.; Broadhurst, D.; Johnson, H.; O’Boyle, N.M.; Goodacre, R. PYCHEM: A multivariate analysis package for python. Bioinformatics 2006, 22, 2565–2566. [Google Scholar] [CrossRef] [PubMed]
- Robinson, M.D.; McCarthy, D.J.; Smyth, G.K. edgeR: A Bioconductor package for differential expression analysis of digital gene expression data. Bioinformatics 2010, 26, 139–140. [Google Scholar] [CrossRef]
- Griss, J.; Viteri, G.; Sidiropoulos, K.; Nguyen, V.; Fabregat, A.; Hermjakob, H. ReactomeGSA—Efficient multi-omics comparative pathway analysis. Mol. Cell. Proteom. 2020, 19, 2115–2125. [Google Scholar] [CrossRef]
- Vongsvivut, J.; Perez-Guaita, D.; Wood, B.R.; Heraud, P.; Khambatta, K.; Hartnell, D.; Hackett, M.J.; Tobin, M.J. Synchrotron macro ATR-FTIR microspectroscopy for high-resolution chemical mapping of single cells. Analyst 2019, 144, 3226–3238. [Google Scholar] [CrossRef] [PubMed]
- Whelan, D.R.; Bambery, K.R.; Heraud, P.; Tobin, M.J.; Diem, M.; McNaughton, D.; Wood, B.R. Monitoring the reversible B to A-like transition of DNA in eukaryotic cells using Fourier transform infrared spectroscopy. Nucleic Acids Res. 2011, 39, 5439–5448. [Google Scholar] [CrossRef]
- Cinque, G.; Frodely, M.D.; Wehbe, K.; Que Nguyen, T.-N.; Fitzpatrick, A.; Kelley, C.S. Synchrotron-based infrared spectral imaging at the MIRIAM beamline of Diamond Light Source. Synchrotron Radiat. News 2017, 30, 11–16. [Google Scholar] [CrossRef]
- Ma, J.; He, J.J.; Hou, J.L.; Zhou, C.X.; Elsheikha, H.M.; Zhu, X.Q. Ultra performance liquid chromatography-tandem mass spectrometry-based metabolomics reveals metabolic alterations in the mouse cerebellum during Toxoplasma gondii infection. Front. Microbiol. 2020, 11, 1555. [Google Scholar] [CrossRef]
- Wang, S.; Zhang, Z.; Wang, Y.; Gadahi, J.A.; Xu, L.; Yan, R.; Song, X.; Li, X. Toxoplasma gondii elongation factor 1-alpha (TgEF-1alpha) is a novel vaccine candidate antigen against toxoplasmosis. Front. Microbiol. 2017, 8, 168. [Google Scholar] [CrossRef]
- Li, J.X.; He, J.J.; Elsheikha, H.M.; Chen, D.; Zhai, B.T.; Zhu, X.Q.; Yan, H.K. Toxoplasma gondii ROP17 inhibits the innate immune response of HEK293T cells to promote its survival. Parasitol. Res. 2019, 118, 783–792. [Google Scholar] [CrossRef]
- Hu, R.S.; He, J.J.; Elsheikha, H.M.; Zou, Y.; Ehsan, M.; Ma, Q.N.; Zhu, X.Q.; Cong, W. Transcriptomic profiling of mouse brain during acute and chronic infections by Toxoplasma gondii oocysts. Front. Microbiol. 2020, 11, 570903. [Google Scholar] [CrossRef]
- He, J.J.; Ma, J.; Wang, J.L.; Zhang, F.K.; Li, J.X.; Zhai, B.T.; Wang, Z.X.; Elsheikha, H.M.; Zhu, X.Q. Global transcriptome profiling of multiple porcine organs reveals Toxoplasma gondii-induced transcriptional landscapes. Front. Immunol. 2019, 10, 1531. [Google Scholar] [CrossRef]
- Li, J.X.; He, J.J.; Elsheikha, H.M.; Ma, J.; Xu, X.P.; Zhu, X.Q. ROP18-Mediated transcriptional reprogramming of HEK293T cell reveals new roles of ROP18 in the interplay between Toxoplasma gondii and the host cell. Front. Cell. Infect. Microbiol. 2020, 10, 586946. [Google Scholar] [CrossRef] [PubMed]
- Zhu, Y.C.; Elsheikha, H.M.; Wang, J.H.; Fang, S.; He, J.J.; Zhu, X.Q.; Chen, J. Synergy between Toxoplasma gondii type I ΔGRA17 immunotherapy and PD-L1 checkpoint inhibition triggers the regression of targeted and distal tumors. J. Immunother. Cancer 2021, 9, e002970. [Google Scholar] [CrossRef] [PubMed]
- He, J.J.; Ma, J.; Elsheikha, H.M.; Song, H.Q.; Huang, S.Y.; Zhu, X.Q. Transcriptomic analysis of mouse liver reveals a potential hepato-enteric pathogenic mechanism in acute Toxoplasma gondii infection. Parasit. Vectors 2016, 9, 427. [Google Scholar] [CrossRef] [PubMed]


Publisher’s Note: MDPI stays neutral with regard to jurisdictional claims in published maps and institutional affiliations. |
© 2022 by the authors. Licensee MDPI, Basel, Switzerland. This article is an open access article distributed under the terms and conditions of the Creative Commons Attribution (CC BY) license (https://creativecommons.org/licenses/by/4.0/).
Share and Cite
Elsheikha, H.M.; Al-Sandaqchi, A.T.; Harun, M.S.R.; Winterton, F.; Altharawi, A.; Elsaied, N.A.; Stevenson, C.W.; MacNaughtan, W.; Mina, J.G.M.; Denny, P.W.; et al. Illuminating Host-Parasite Interaction at the Cellular and Subcellular Levels with Infrared Microspectroscopy. Cells 2022, 11, 811. https://doi.org/10.3390/cells11050811
Elsheikha HM, Al-Sandaqchi AT, Harun MSR, Winterton F, Altharawi A, Elsaied NA, Stevenson CW, MacNaughtan W, Mina JGM, Denny PW, et al. Illuminating Host-Parasite Interaction at the Cellular and Subcellular Levels with Infrared Microspectroscopy. Cells. 2022; 11(5):811. https://doi.org/10.3390/cells11050811
Chicago/Turabian StyleElsheikha, Hany M., Alaa T. Al-Sandaqchi, Mohammad S. R. Harun, Francesca Winterton, Ali Altharawi, Nashwa A. Elsaied, Carl W. Stevenson, William MacNaughtan, John G. M. Mina, Paul W. Denny, and et al. 2022. "Illuminating Host-Parasite Interaction at the Cellular and Subcellular Levels with Infrared Microspectroscopy" Cells 11, no. 5: 811. https://doi.org/10.3390/cells11050811
APA StyleElsheikha, H. M., Al-Sandaqchi, A. T., Harun, M. S. R., Winterton, F., Altharawi, A., Elsaied, N. A., Stevenson, C. W., MacNaughtan, W., Mina, J. G. M., Denny, P. W., Cinque, G., & Chan, K. L. A. (2022). Illuminating Host-Parasite Interaction at the Cellular and Subcellular Levels with Infrared Microspectroscopy. Cells, 11(5), 811. https://doi.org/10.3390/cells11050811