Article

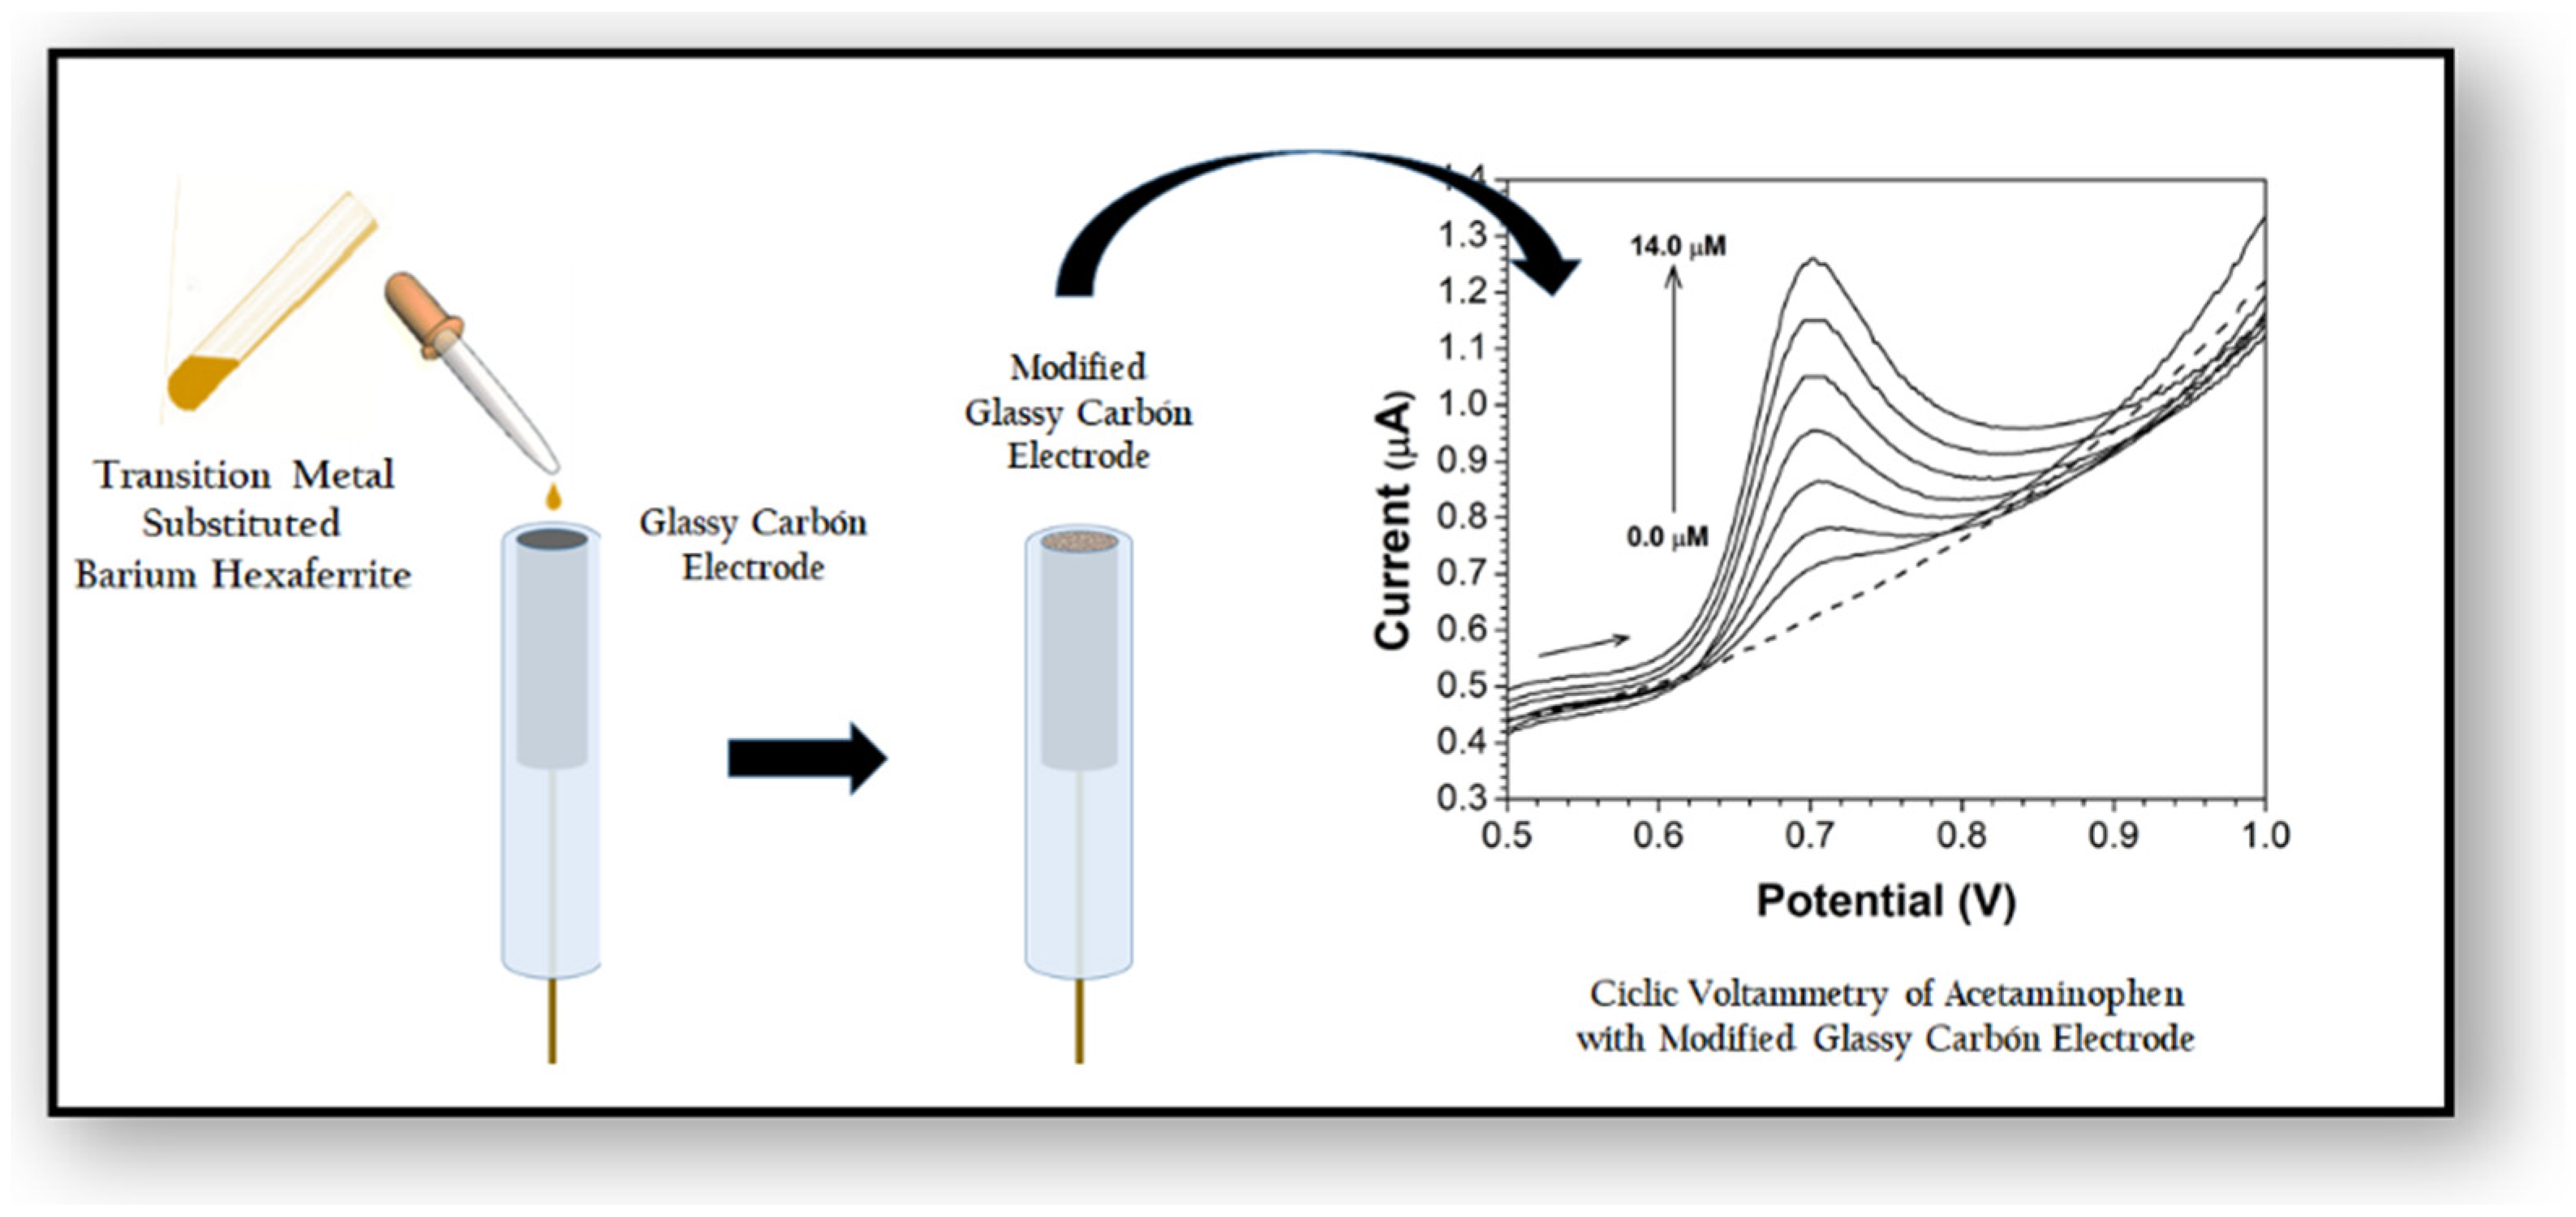
Transition Metal Substituted Barium Hexaferrite-Modified Electrode: Application as Electrochemical Sensor of Acetaminophen

by
Claudia Patricia Granja-Banguera
,
Daniel Gerardo Silgado-Cortázar
and
Jimmy Alexander Morales-Morales
*
Chemistry and Biotechnology Research Group (QUIBIO), Faculty of Basic Sciences, Campus Pampalinda, Universidad Santiago de Cali, Cali 760035, Colombia
*
Author to whom correspondence should be addressed.
Molecules 2022, 27(5), 1550; https://doi.org/10.3390/molecules27051550
Submission received: 15 September 2021 / Revised: 15 December 2021 / Accepted: 16 December 2021 / Published: 25 February 2022
(This article belongs to the Special Issue Nanomaterials for Electrocatalytic Applications)

Abstract

:
This study used substituted barium hexaferrites, which were previously prepared and reported by the authors, to detect acetaminophen by the modification of a conventional glassy carbon electrode (GCE), which led to promising results. The synthesis of this electrode-modifying material was conducted using a citrate sol gel process. A test synthesis using glycerin and propylene glycol revealed that glycerin produced a better result, while less positive anodic potential values were associated with the electrooxidation of N-acetyl-p-aminophenol (NAP). Excellent electroactivity was exhibited by the cobalt-substituted barium-hexaferrite-nanomaterial-modified electrode. A good linear relationship between the concentration and the current response of acetaminophen (paracetamol) was obtained with a detection limit of (0.255 ± 0.005) µM for the Ba1.0Co1.22Fe11.41O18.11 GCE, (0.577 ± 0.007) µM for the Ba1.14Cu0.82Fe11.65O18.02 GCE, and (0.595 ± 0.008) µM for the bare GCE. The levels of NAP in a real sample of urine were quantitatively analyzed using the proposed method, with recovery ranges from 96.6% to 101.0% and 93.9% to 98.4% for the modified electrode with Cobalt-substituted barium hexaferrites (CoFM) and Copper-substituted barium hexaferrites (CuFM), respectively. These results confirm the high electrochemical activity of Ba1.0Co1.22Fe11.41O18.11 nanoparticles and thus their potential for use in the development of sensing devices for substances of pharmaceutical interest, such as acetaminophen (NAP).

1. Introduction

N-acetyl-p-aminophenol (NAP) (i.e., acetaminophen) is used in the manufacture of tinctures and photography and as an analgesic and febrifuge; consequently, it is incorporated into the environment via multiple routes. Occupational exposure can occur via inhalation or dermal absorption at sites of manufacturing or use, although its main source of exposure results from its widespread use as an analgesic. The most-reported route of contamination is via unchanged excretion in urine and feces in medical and domestic settings; consequently, this commonly used medication is a potential water pollutant. Therefore, developing an analytical approach for the simple and precise quantification of this analyte is particularly challenging.
Various techniques have been proposed for the detection of NAP [1,2,3,4,5,6,7,8,9,10,11]. Electroanalytical methods have been used in the field of drug analysis, and in recent decades a variety of nanomaterials have been used to modify the surface of the electrodes to efficiently determine electroactive species of interest and improve the sensitivity of electrochemical sensors [12,13]. In modern voltammetry, chemically modified electrodes are now a developed area in which they are widely recognized for their superior properties of selectivity, sensitivity, and in situ performance.
The modification of an electrode’s surface is intended to increase the electroactive area and active adsorption sites and enhance the selective interactions between the modified electrode and the analyte. Electrode modifiers have been widely used to improve the electroactive surface area, increase the stability, and reduce the charge-transfer resistance of electrodes in comparison with bare electrodes. Electrodes can be modified using magnetic nanoparticles; by increasing the sensitivity and stability of the sensors, they can help in detecting trace levels of different analytes [14].
The unique physical and chemical properties of magnetic nanoparticles have made them an attractive research focus. In the field of electrochemistry, particularly electroanalysis, they are utilized extensively as functional materials due to their high surface area, mass transport, catalytic effect, and control over the local environment. Barium-based ferrites are attractive materials of interest that have emerged due to their interesting physical, chemical, magnetic, and electrical properties. Nano-ferrite-based sensors have many advantages, including high sensitivity and signal-to-noise ratios, low determination limits, and short analysis time [15].
One important group of magnetic oxides is M-type hexagonal ferrites, e.g., barium ferrite; these are used in different sensor technologies on account of their specific favorable properties, including low cost, corrosion-resistant chemical stability and large magnetocrystalline anisotropy [16,17,18]. M-type barium ferrite has a molecular formula BaFe12O19 and a crystalline structure of magneto plumbite [19]. Adequate groundwork has been laid regarding the effect of different elements on the characteristics of BaFe12O19 [20]. However, investigations into substituted BaFe12O19 and the effect of other elements on the structure of M-type hexagonal ferrite and its electrochemical properties remains the subject of increasing research. Various methods of synthesizing M-type barium ferrite powder particles have been developed [21,22,23,24,25,26,27,28,29,30]. For example, the widely used combustion method is reliable, fast, and efficient, and when the process includes transition-metal chlorides, ferrites with satisfactory particle size can be obtained [31,32,33,34,35,36,37,38].
BaFe12O19 nanoparticles have been utilized in electroanalysis due to their considerable electrocatalytic activity [39,40]. On this basis, transition-metal-substituted barium M-type hexagonal ferrite particles with Fe/Ba and a molar ratio of 4 could be used for the electrooxidation processes. Ferrite substituents are especially crucial since they determine variations in physical, magnetic, and electrical transport properties, [38]. The authors recently prepared substituted spinel ferrites of cobalt and copper with potential application in the design/elaboration of metabolite-sensing surfaces for medical applications [41]. Employing the same synthesis method, cobalt- and copper-substituted M-type hexagonal ferrite particles with Fe/Ba and a molar ratio of 4 were synthesized using the sol–gel combustion technique.
To the best of the authors’ knowledge, there have been no reports on the application of cobalt- and copper-substituted M-type barium ferrite powder particles with Fe/Ba (molar ratio of 4) in the electrooxidation processes of acetaminophen. Therefore, the present investigation examines the electrochemical properties of M-type barium ferrite powder particles with an Fe/Ba ratio of 4 in the oxidation of NAP.

2. Results and Discussion

2.1. Characterization of Transition-Metal-Substituted Barium Hexaferrites

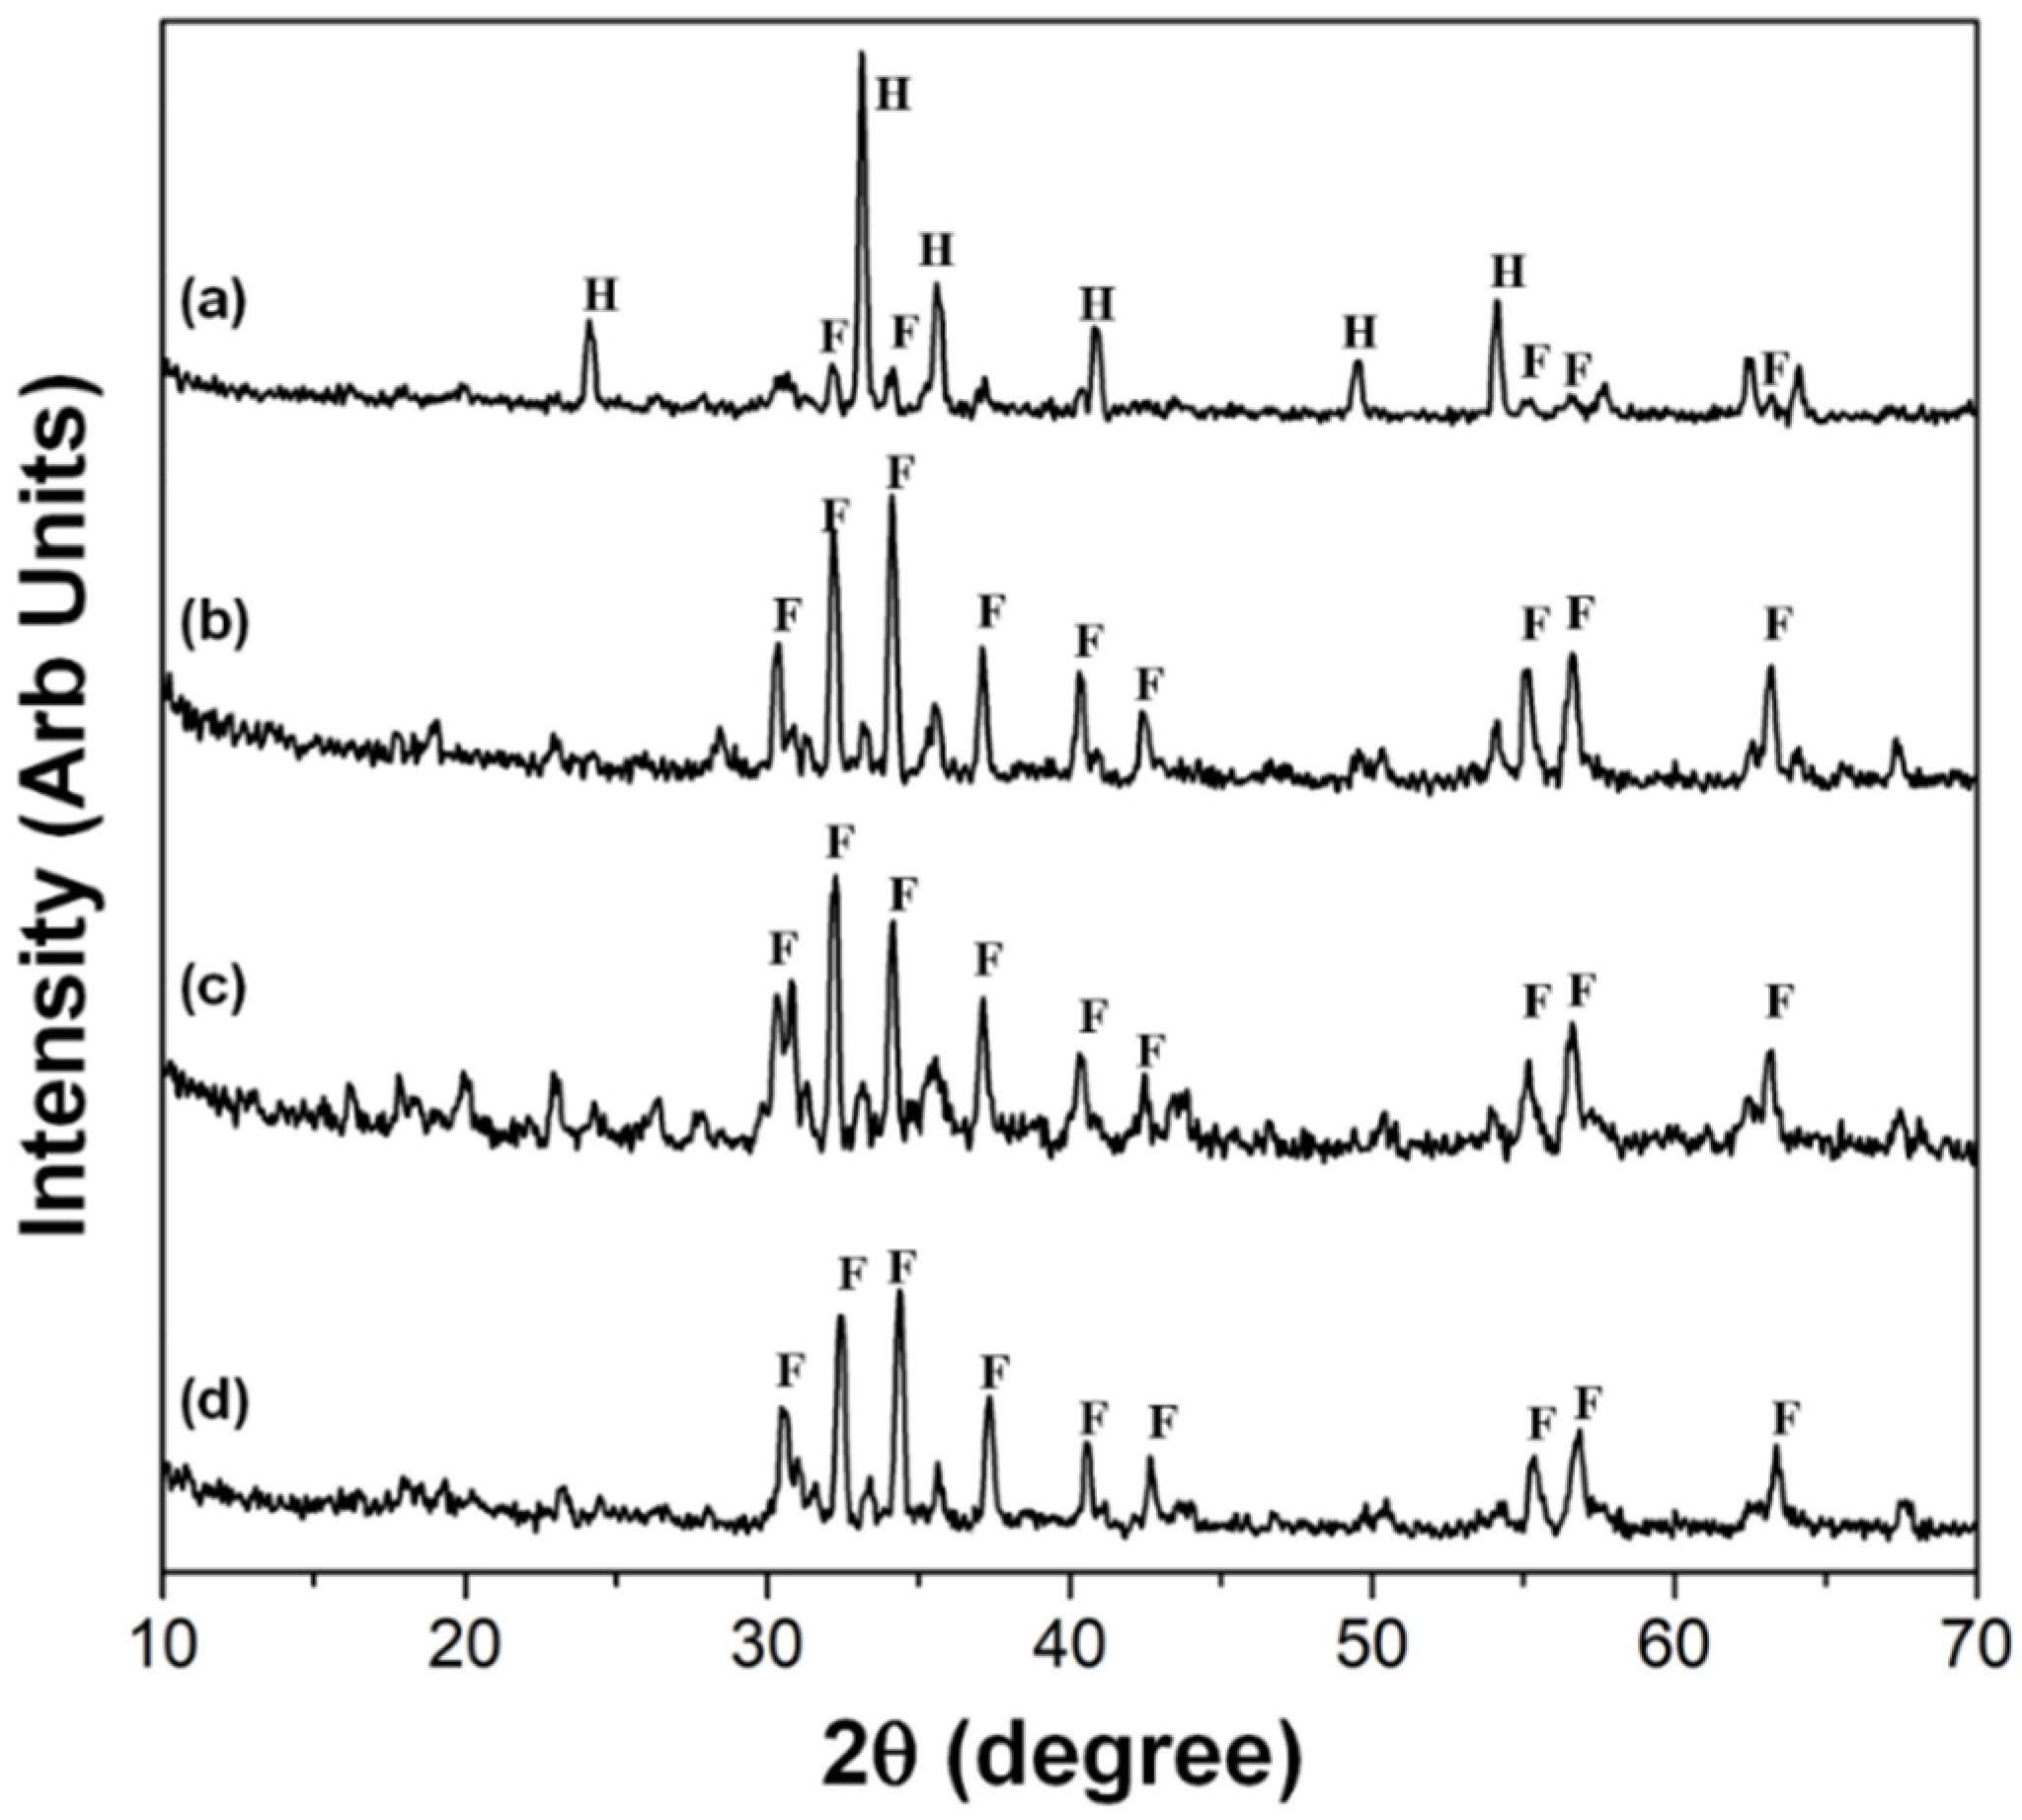
2.1.1. X-ray Diffraction Analysis

The crystallographic structure of the samples was determined using X-ray diffraction (XRD). Table 1 presents the diffraction patterns of the synthesized cobalt- and copper-substituted M-type barium ferrite powder particles and their corresponding planes at 2(θ) values of 30.24° (110), 30.20° (107), 37.12° (203), 40.30° (205), 42.35° (206), 55.10° (217), 56.58° (2011), and 63.16° (220) (peaks marked “F”); these include hexaferrites with preferred orientation along the 30.20° (107) and 34.10° (114) planes [20], which are similar to those in a previously published study [39].
The synthesis methodology followed that of a previously developed procedure [20]. The effect of two alcohols (propylene glycol and glycerin) was evaluated, and the results in the crystal structure are shown in Figure 1a. Propylene glycol led to the formation of the hematite phase in a higher proportion when compared with unsubstituted barium ferrite. Figure 1b–d illustrates the effect of adding glycerol, which promoted the formation of the M-type barium ferrite phase in a greater proportion when compared to the hematite phase. In Figure 1d, there is evidence of the formation of unsubstituted barium ferrites, where signals (the peaks marked “F”) correspond to the diffraction pattern of the ferrite. While the signals (the peaks marked “H”) correspond to hematite phases, the formation of impurities, e.g., hematite (α−Fe2O3), is lower compared with (b) cobalt- and (c) copper-substituted M-type barium ferrite.
The peaks in Figure 1b,c correlate well with the data reported for M-type ferrites substituted with cobalt [35] and copper [22]. The XRD patterns of the ferrite samples reveal characteristic diffraction peaks corresponding to the structure of the M-type barium ferrite; the point group of P63/mmc indicates that there is no transformation of the crystal structure, which, after substitution with copper or cobalt ions, remains as hexagonal magneto plumbite. Figure 1b–d exhibits soft peaks that correspond to the hematite phase. During sintering at 950 °C, there was an increase in the fraction of M-type barium ferrite, while the amount of hematite remained unchanged [38,39,40]. This is the reason for the endurance of the hematite phase (see Figure 1b–d).
These results reveal that glycerol facilitated the formation of hexagonal M-type ferrites. However, its function as an agglomeration obstructer was not confirmed under the experimental conditions of this study.

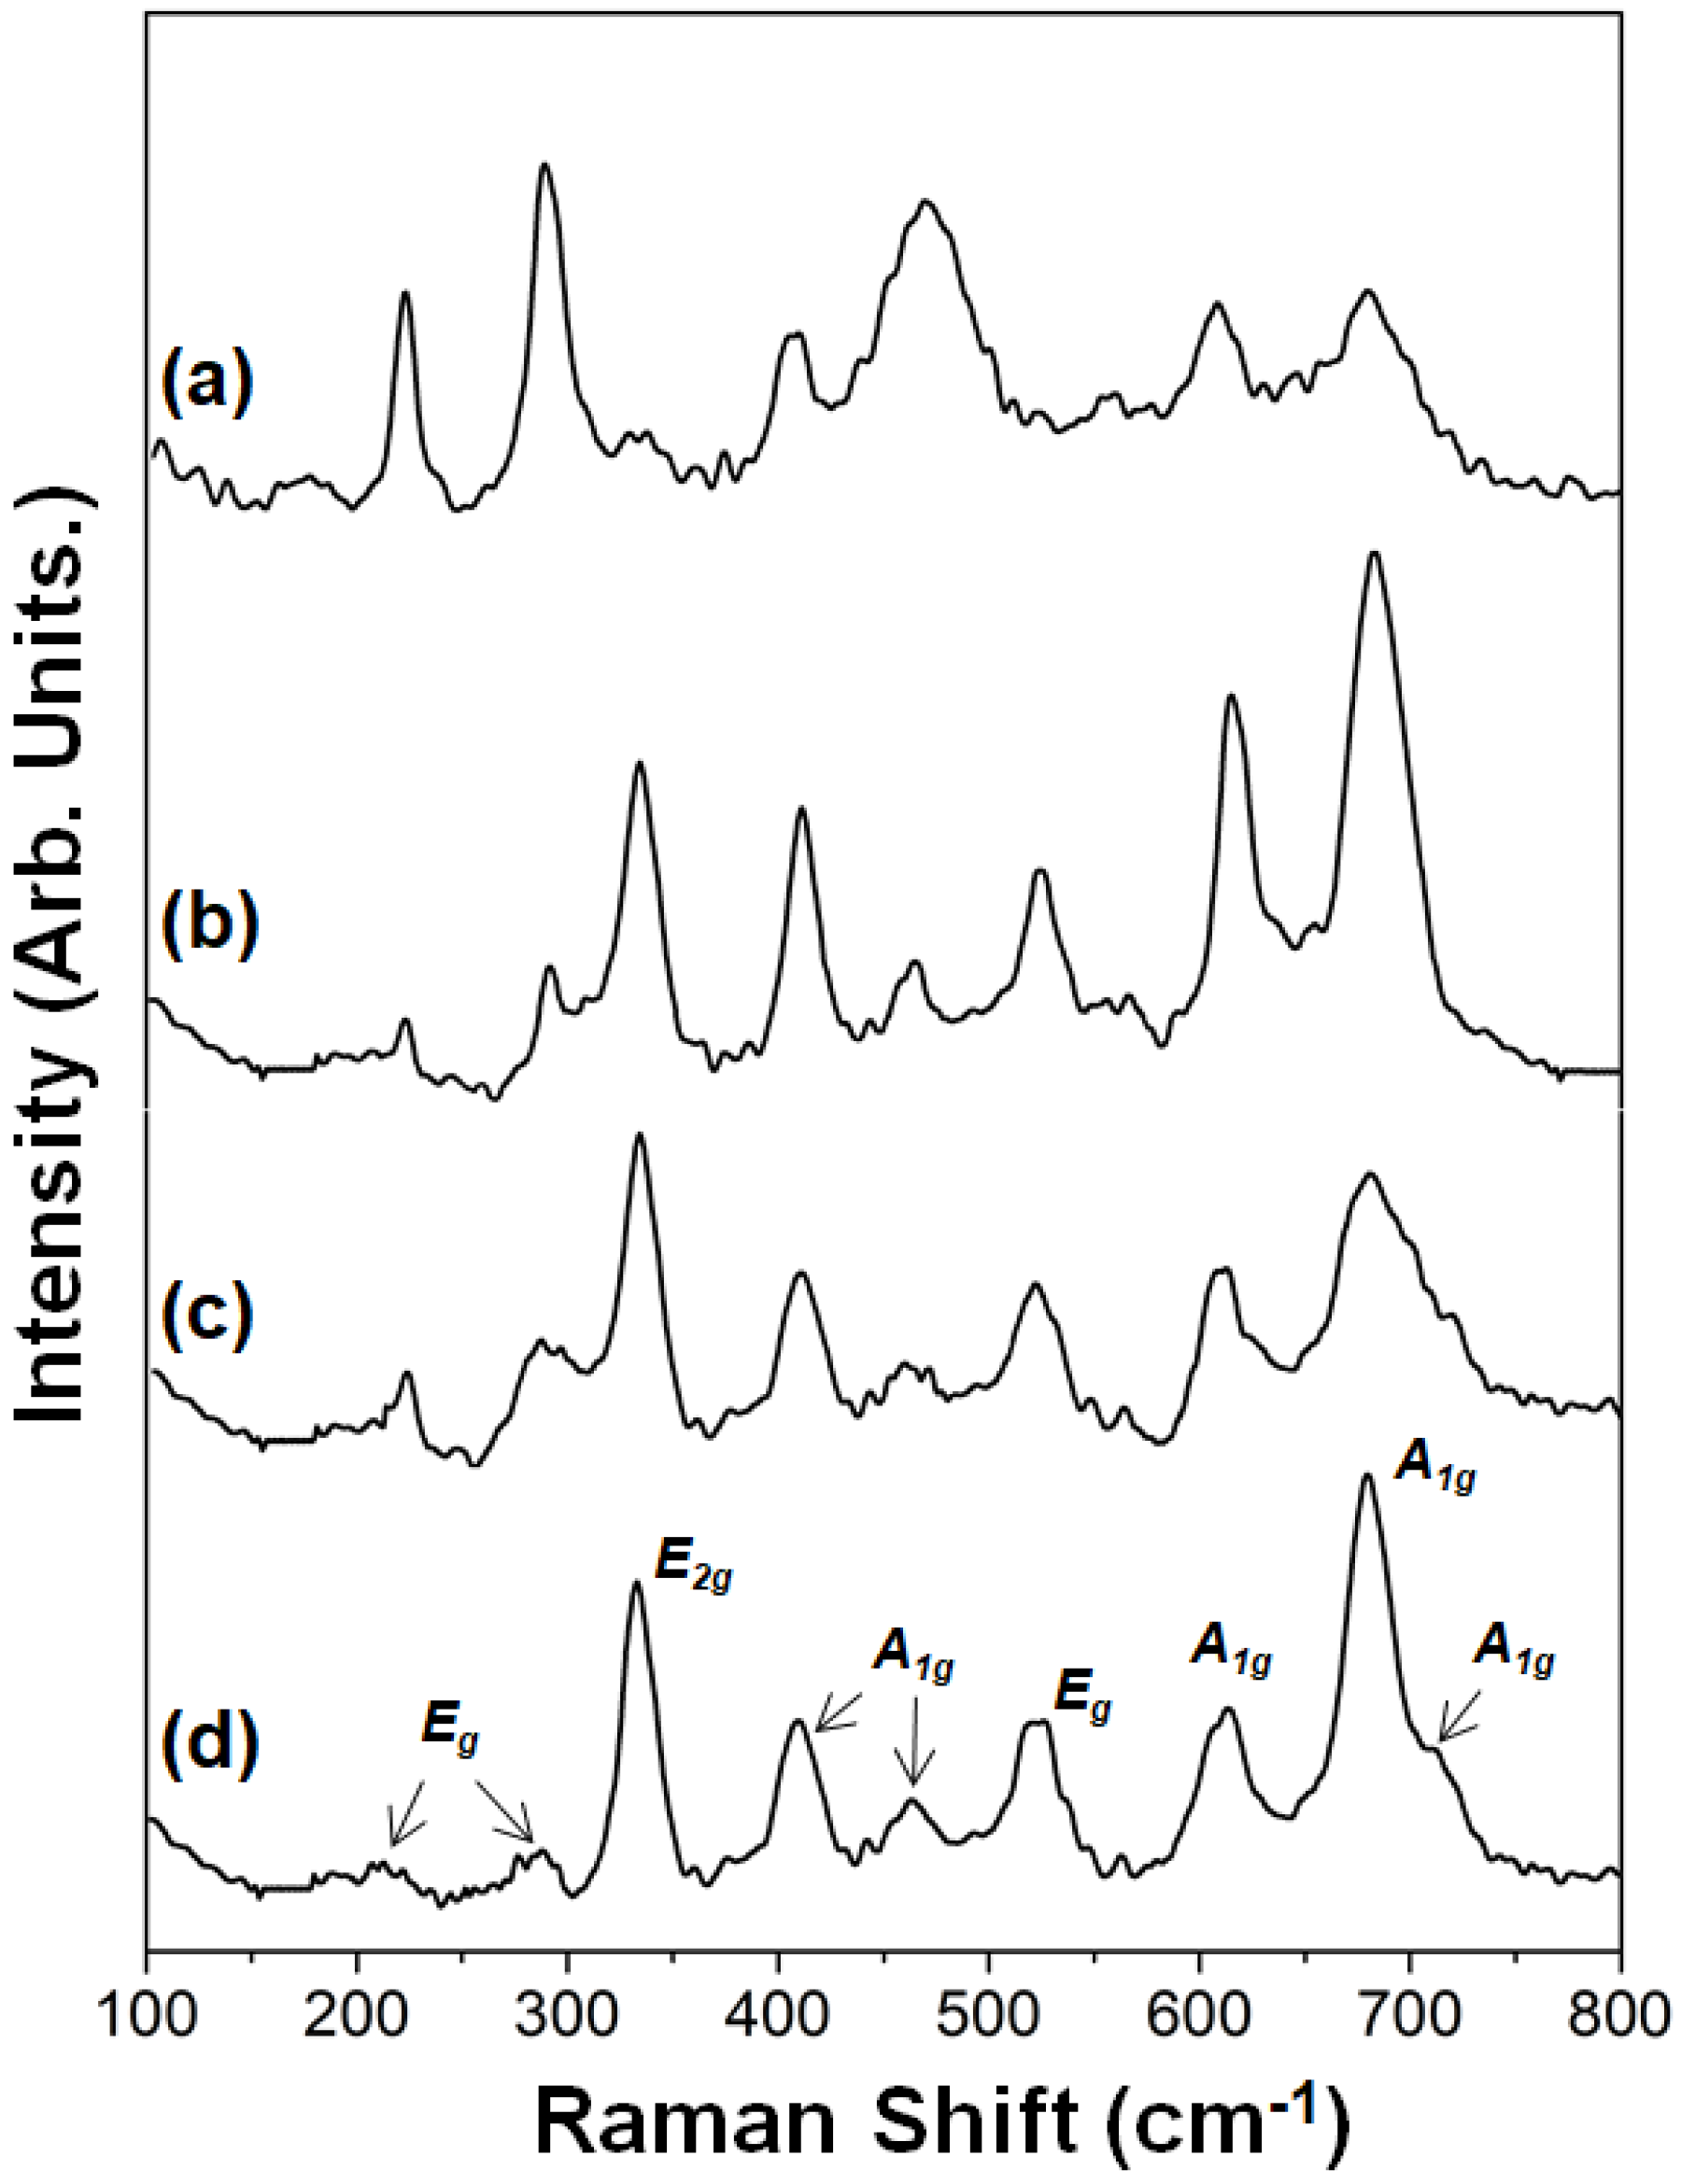
2.1.2. Raman Spectroscopy

Figure 2 presents the characteristic peaks of different M-type barium ferrites synthesized by the citrate sol–gel technique. These peaks were assigned based on the Raman spectral analysis of hexaferrites as reported by Kreisel et al. and Zhao et al. [39,40]. Figure 2a–d shows the differences/modifications resulting from the use of propylene glycol and glycerin, respectively. The appearance of a set of nine peaks (Figure 2d) was confirmed during the analysis of the Raman spectrum of the unsubstituted barium ferrite sample. Peaks at 610, 681, and 709 cm−1 were assigned to active A1g modes that corresponded sequentially to octahedral (4f2), bipyramidal (2b), and tetrahedral (4f1) sites. Other peaks of active-mode A1g were observed at frequencies of 411 and 456 cm−1, which corresponded to octahedral sites. An intense peak at 338 cm−1 was assigned to the E2g active mode of the octahedral sites (12k), while the peaks at 215, 290, and 530 cm−1 corresponded to active-mode Eg [42]. Figure 2a reveals that the latter three peaks were more intense in the Raman spectrum for the sample of barium ferrite in propylene glycol.
The presence of the hematite phase in the sample could affect these peaks due to similar vibrational frequency between the phases. The most representative bands of hematite occurred at around 228 and 295 cm−1 [43,44]. The shifting of the Raman bands toward a lower wavenumber could be attributed to the influence of quantum confinement [45]. The above proposition indicates the presence of hematite phase in the M-type barium ferrite sample synthesized using propylene glycol. The displacements toward lower vibrational frequencies resulted due to copper and cobalt atoms inserted in the structure of barium ferrite. A similar signal pattern is presented in Figure 2b–d. However, in Figure 2a, the differences in the patterns of the observed peaks resulted from the effect of propylene glycol and the other phases that were present in the sample. According to the results of Raman analysis, it was confirmed that the synthesis of M-type barium ferrite substituted with copper and cobalt, separately, was adequate when glycerin was used.

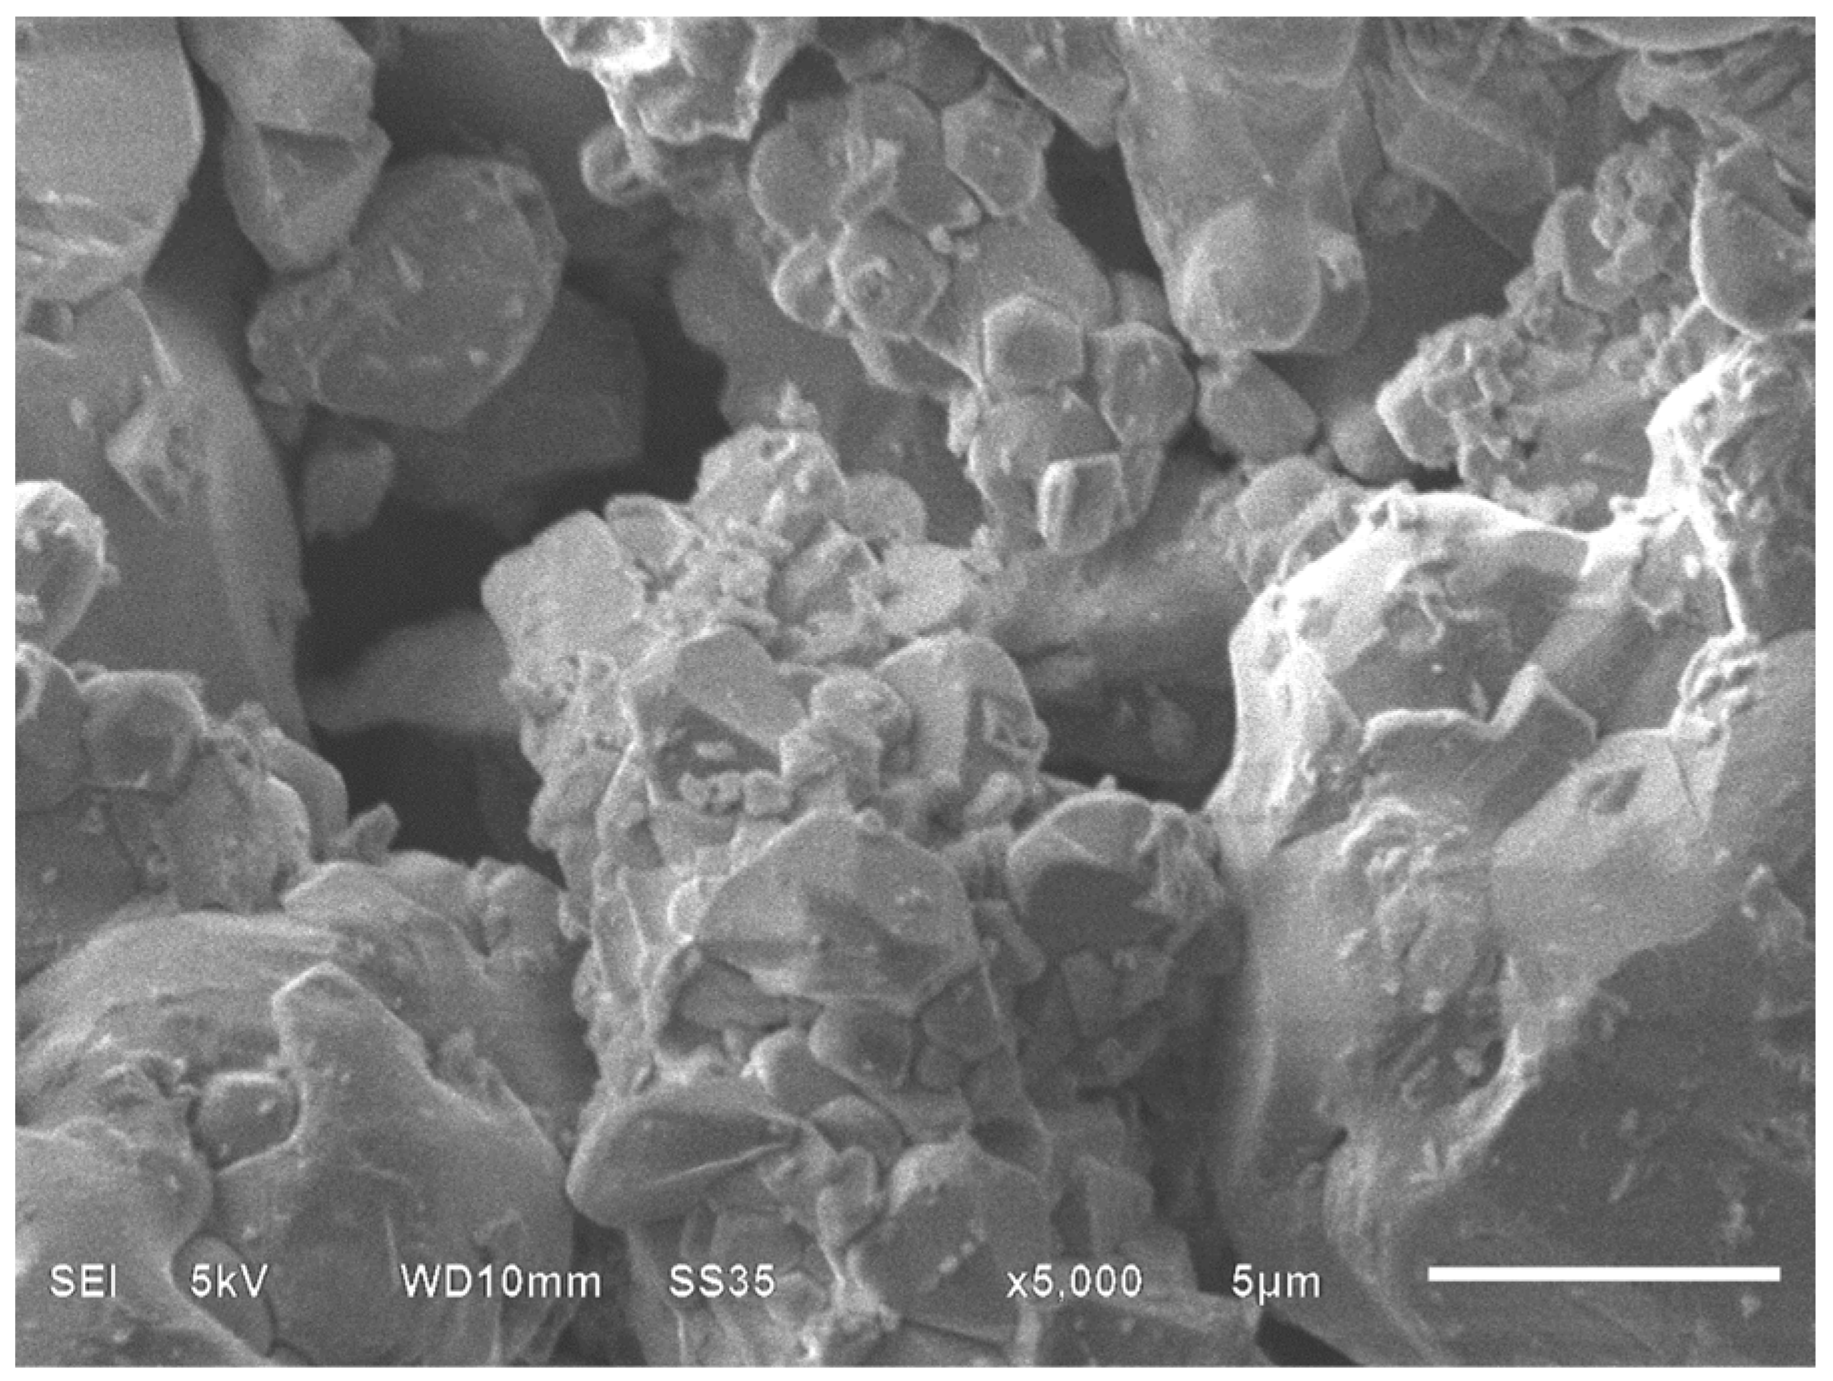
2.1.3. Field-Emission Scanning Electron Microscopy Analysis

The morphology of the synthesized BaFe12O19 nanoparticles was determined using field-emission scanning electron microscopy (FESEM). An image of typical unsubstituted barium hexaferrite is shown in Figure 3. This nanomaterial presented sizes in the range of 200–500 nm, and its high agglomeration made it difficult to accurately determine the particle size and morphology of the image. Additionally, there was a moderate presence of irregular-shaped particles.
The chemical composition of this sample was determined using an Atomic absorption spectroscopy (AAS) device as Ba1.0Fe11.72O18.72, Ba1.0Co1.22Fe11.41O18.11, and Ba1.14Cu0.82Fe11.65O18.02, which were very close to the nominal composition.

2.2. Characterization by Electrocatalysis

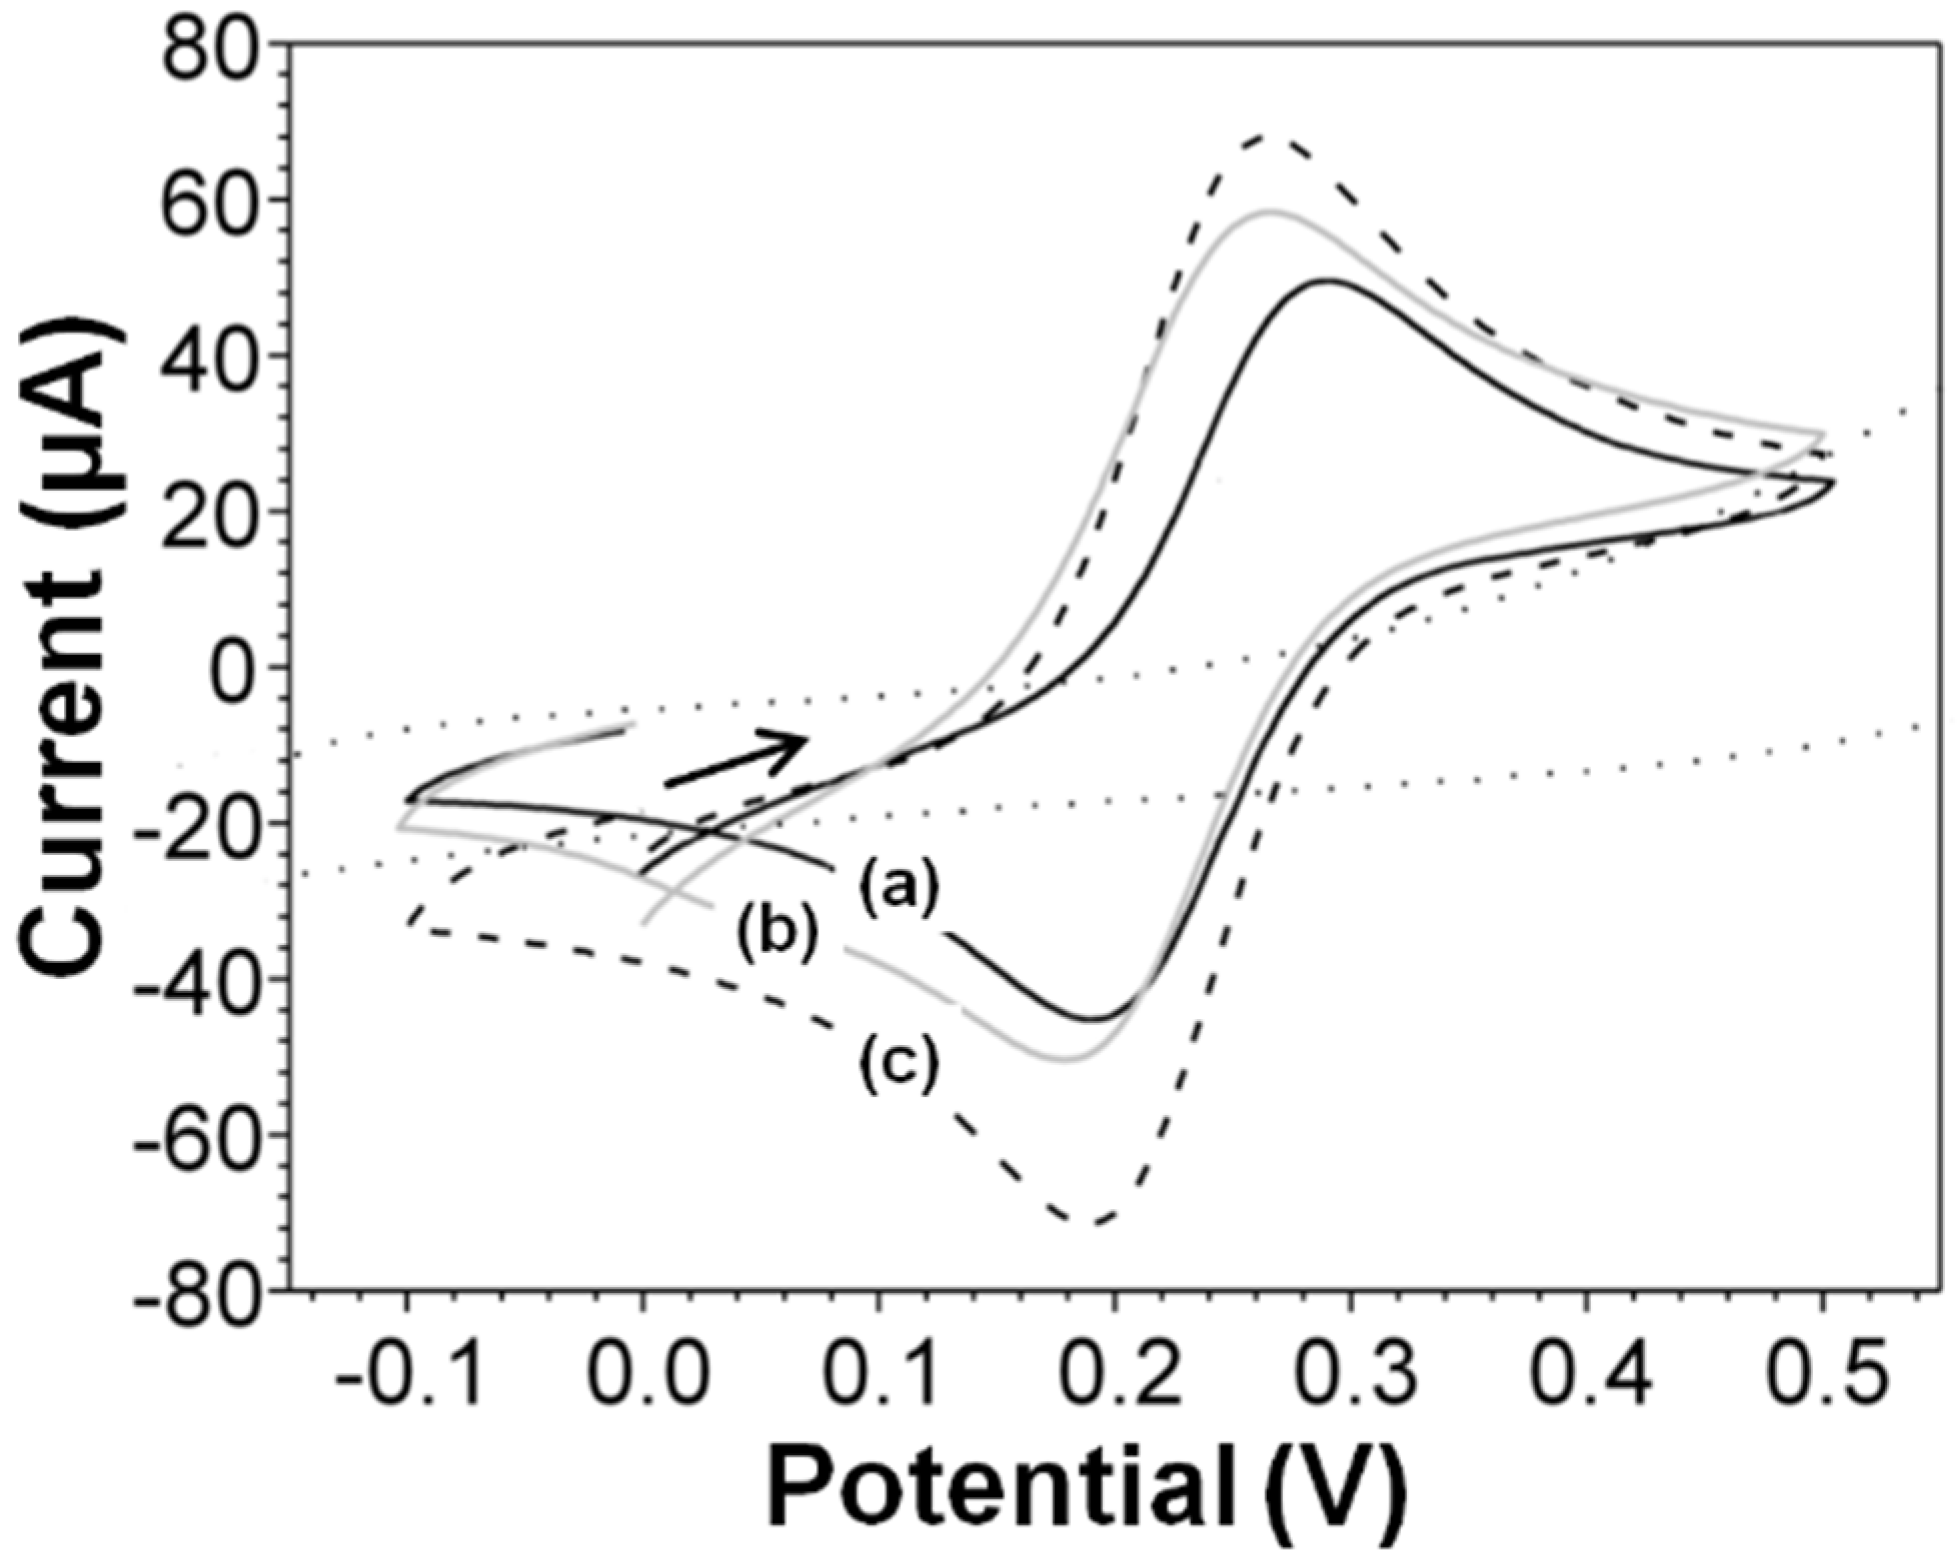
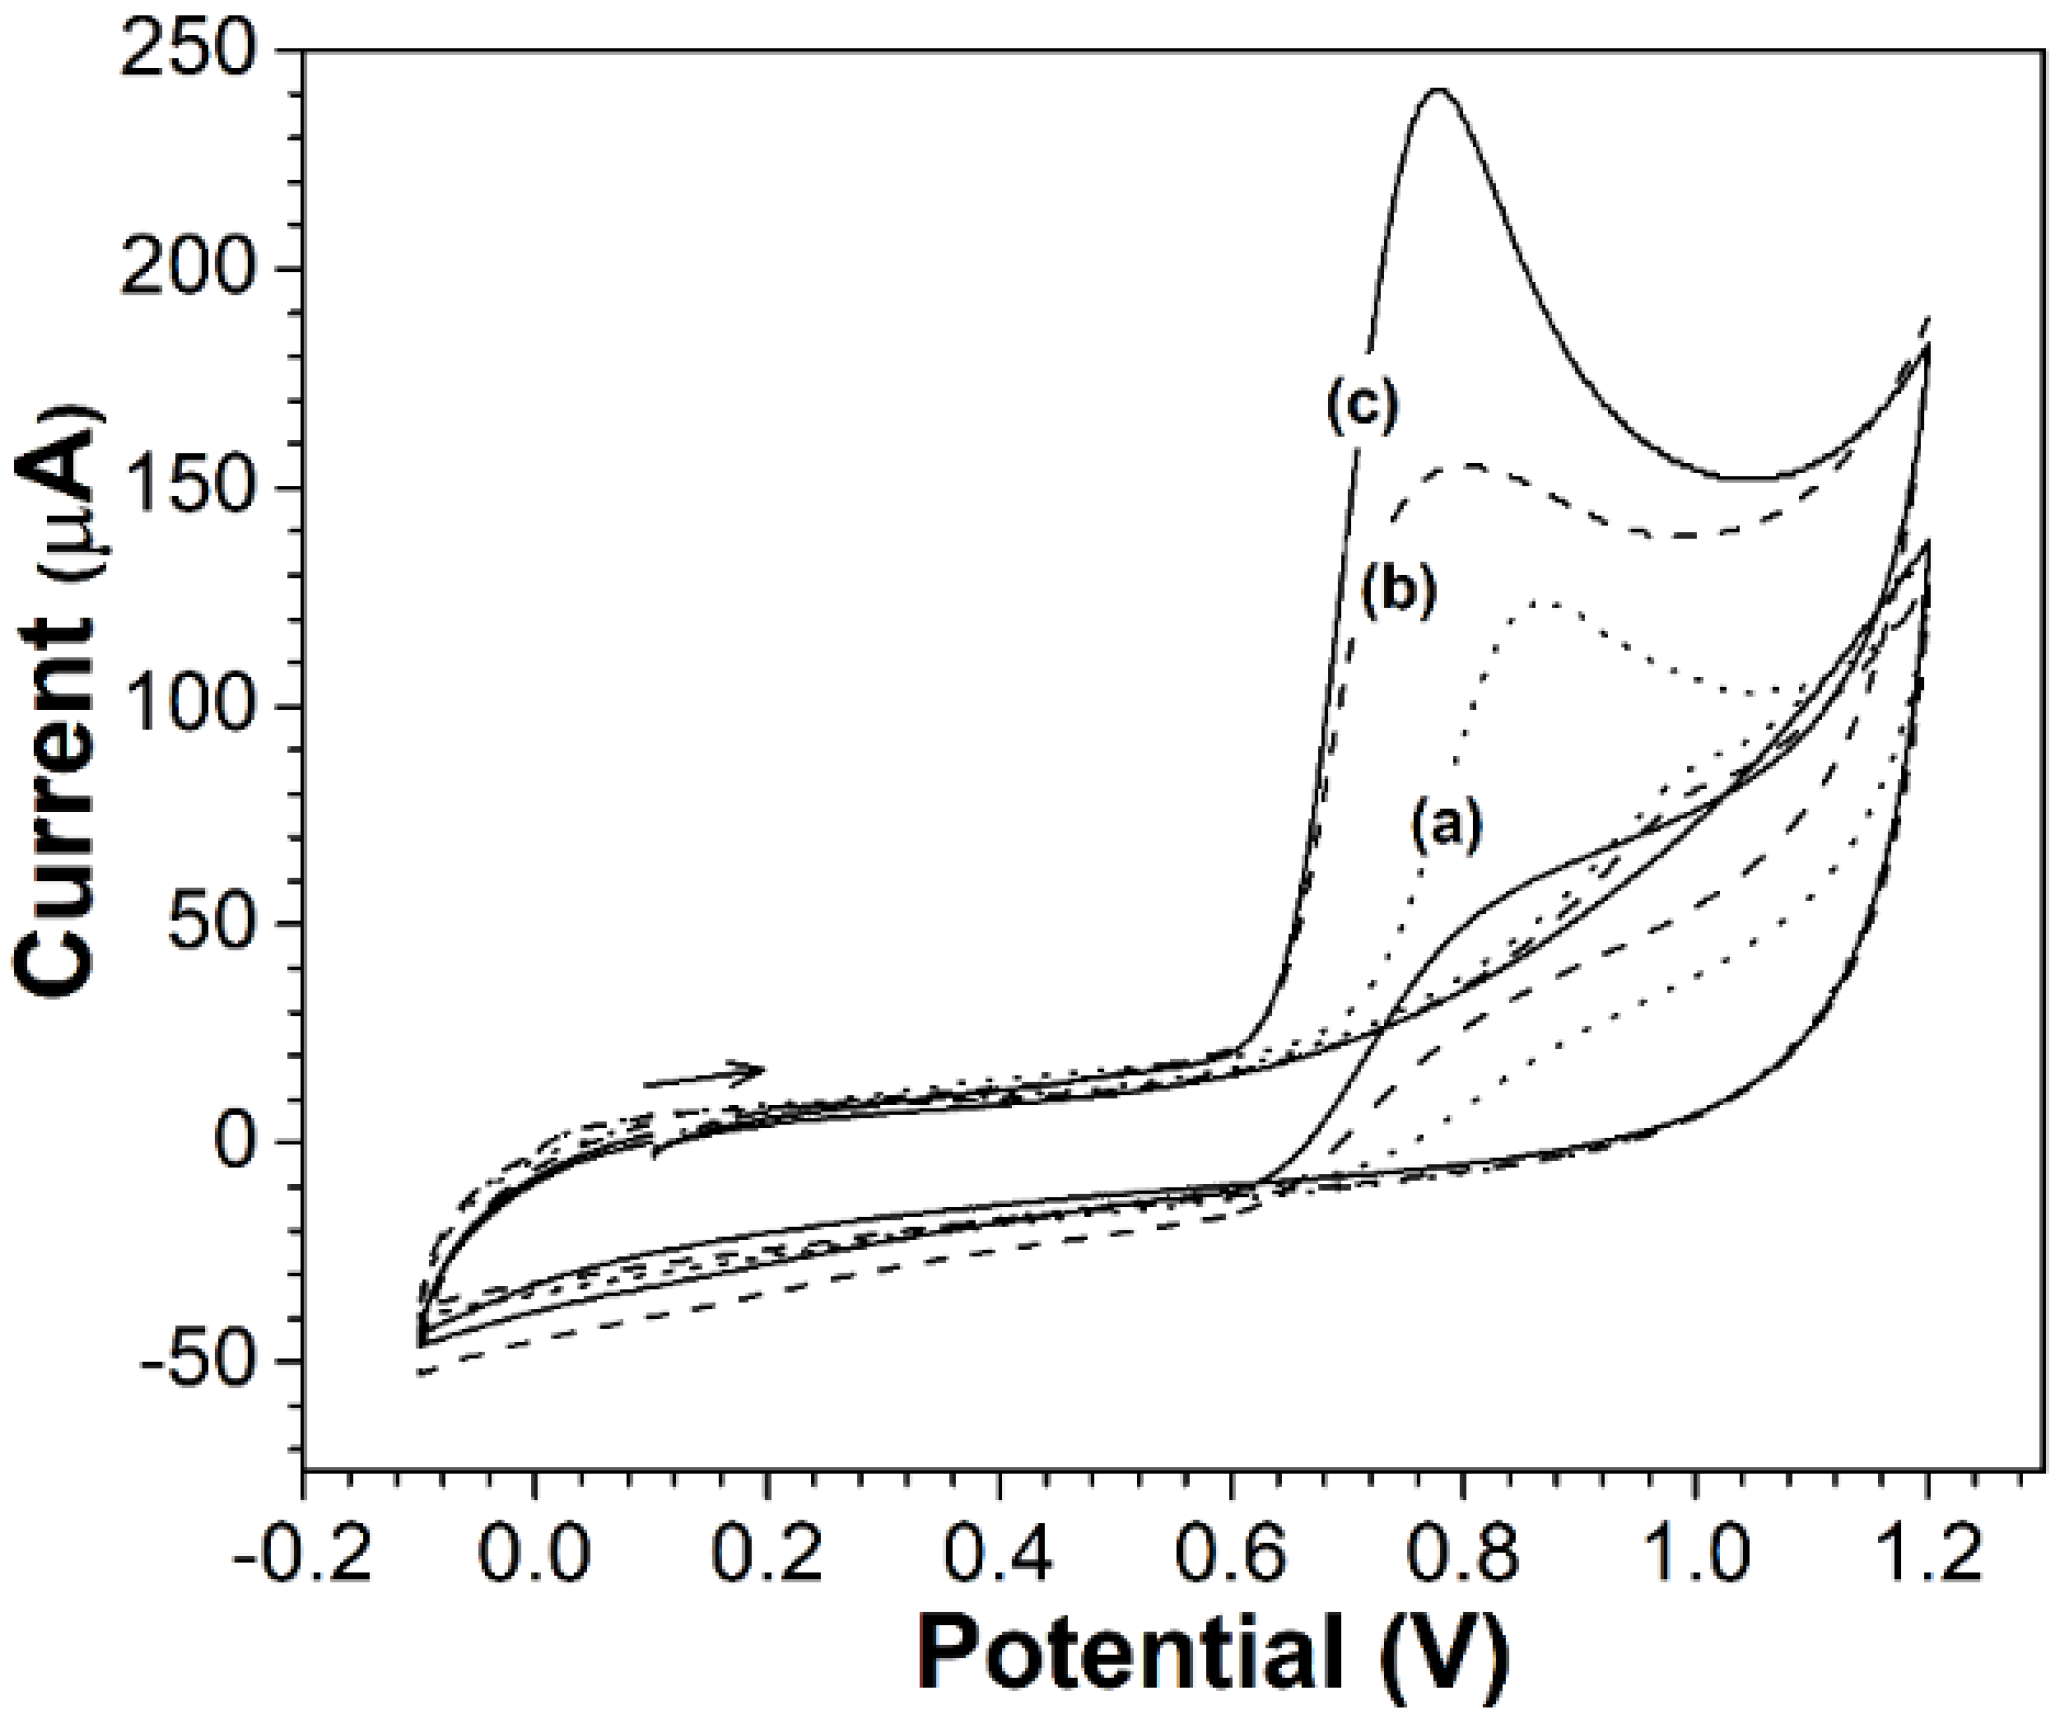
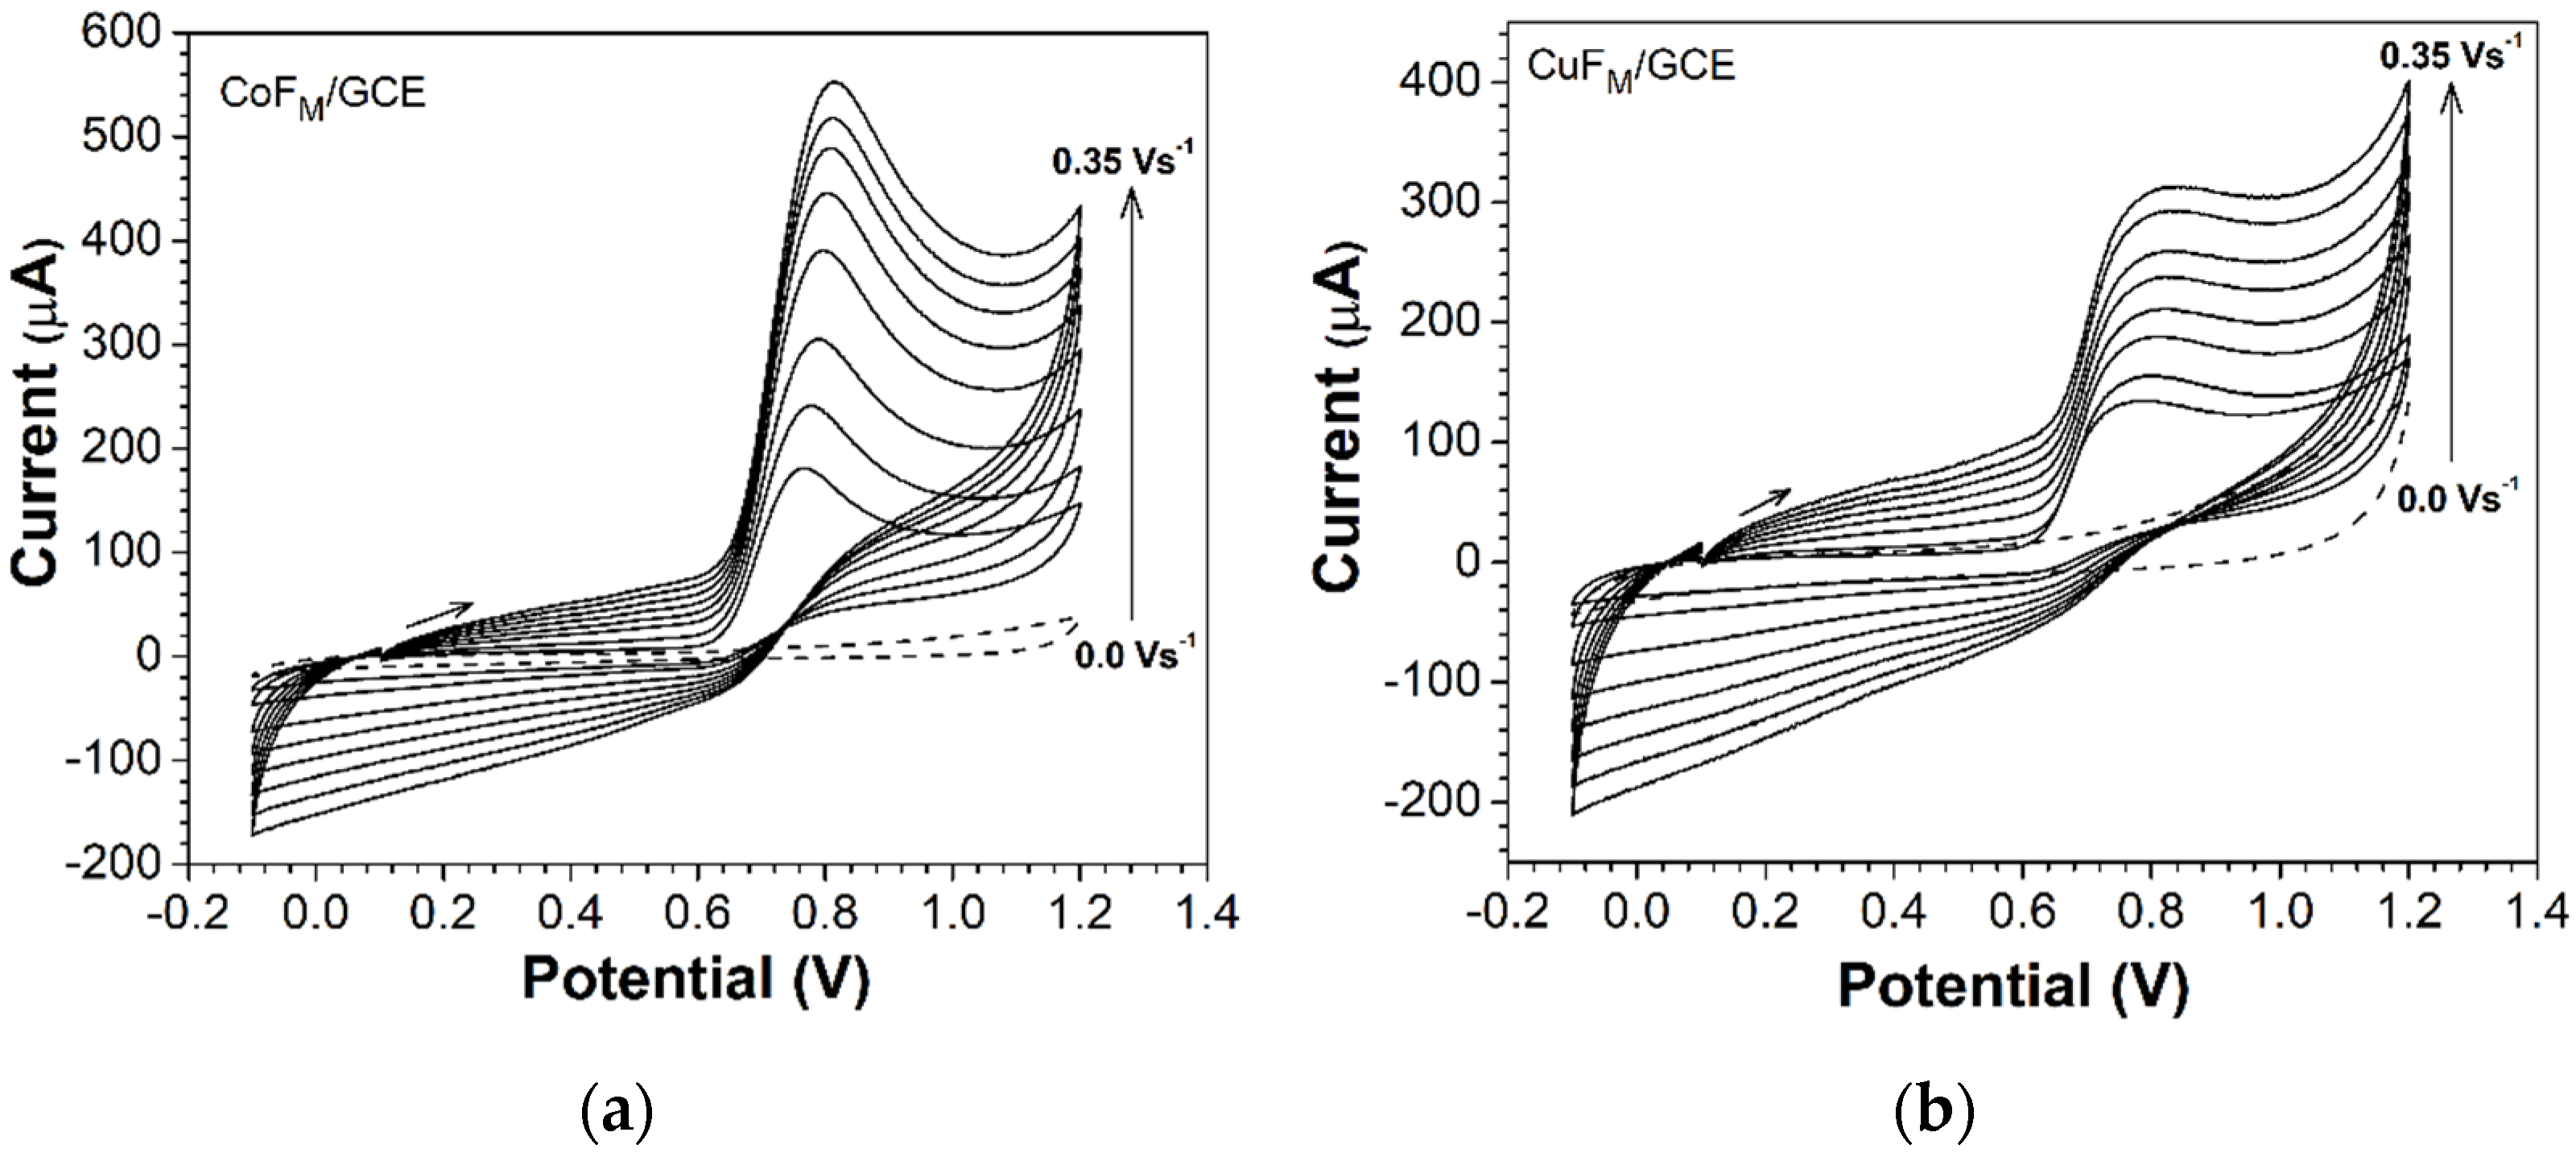
2.2.1. Electrochemical Characterization of Electrodes

Figure 4 shows the electrochemical behavior of a nearly reversible electrode reaction of potassium ferricyanide (K3[Fe(CN)6]) on a modified and unmodified glassy carbon electrode (GCE) with copper- and cobalt-substituted barium hexaferrites.
The modified electrodes produced an increase in the peak redox current relative to the bare electrode. In Figure 4a,b, the GCE, the cyclic voltammogram demonstrated the oxidation and reduction peak potentials of 289 and 205 mV, respectively, at a scan rate of 0.1 Vs−1. Figure 4c presents the oxidation and reduction peak potentials at 264 and 197 mV, respectively, at a scan rate of 0.1 Vs−1. The changes in peak potential (17 mV) and peak current confirmed the effect of a larger electrode area of the CoFM GCE.
A test performed under different scan rates revealed that the peak current varied linearly with respect to the square of the scan rate. Using the Randles–Ševčík equation [46], the areas of the GCE, CuFM GCE, and CoFM GCE were confirmed to be 0.073, 0.079, and 0.84 cm2, respectively.

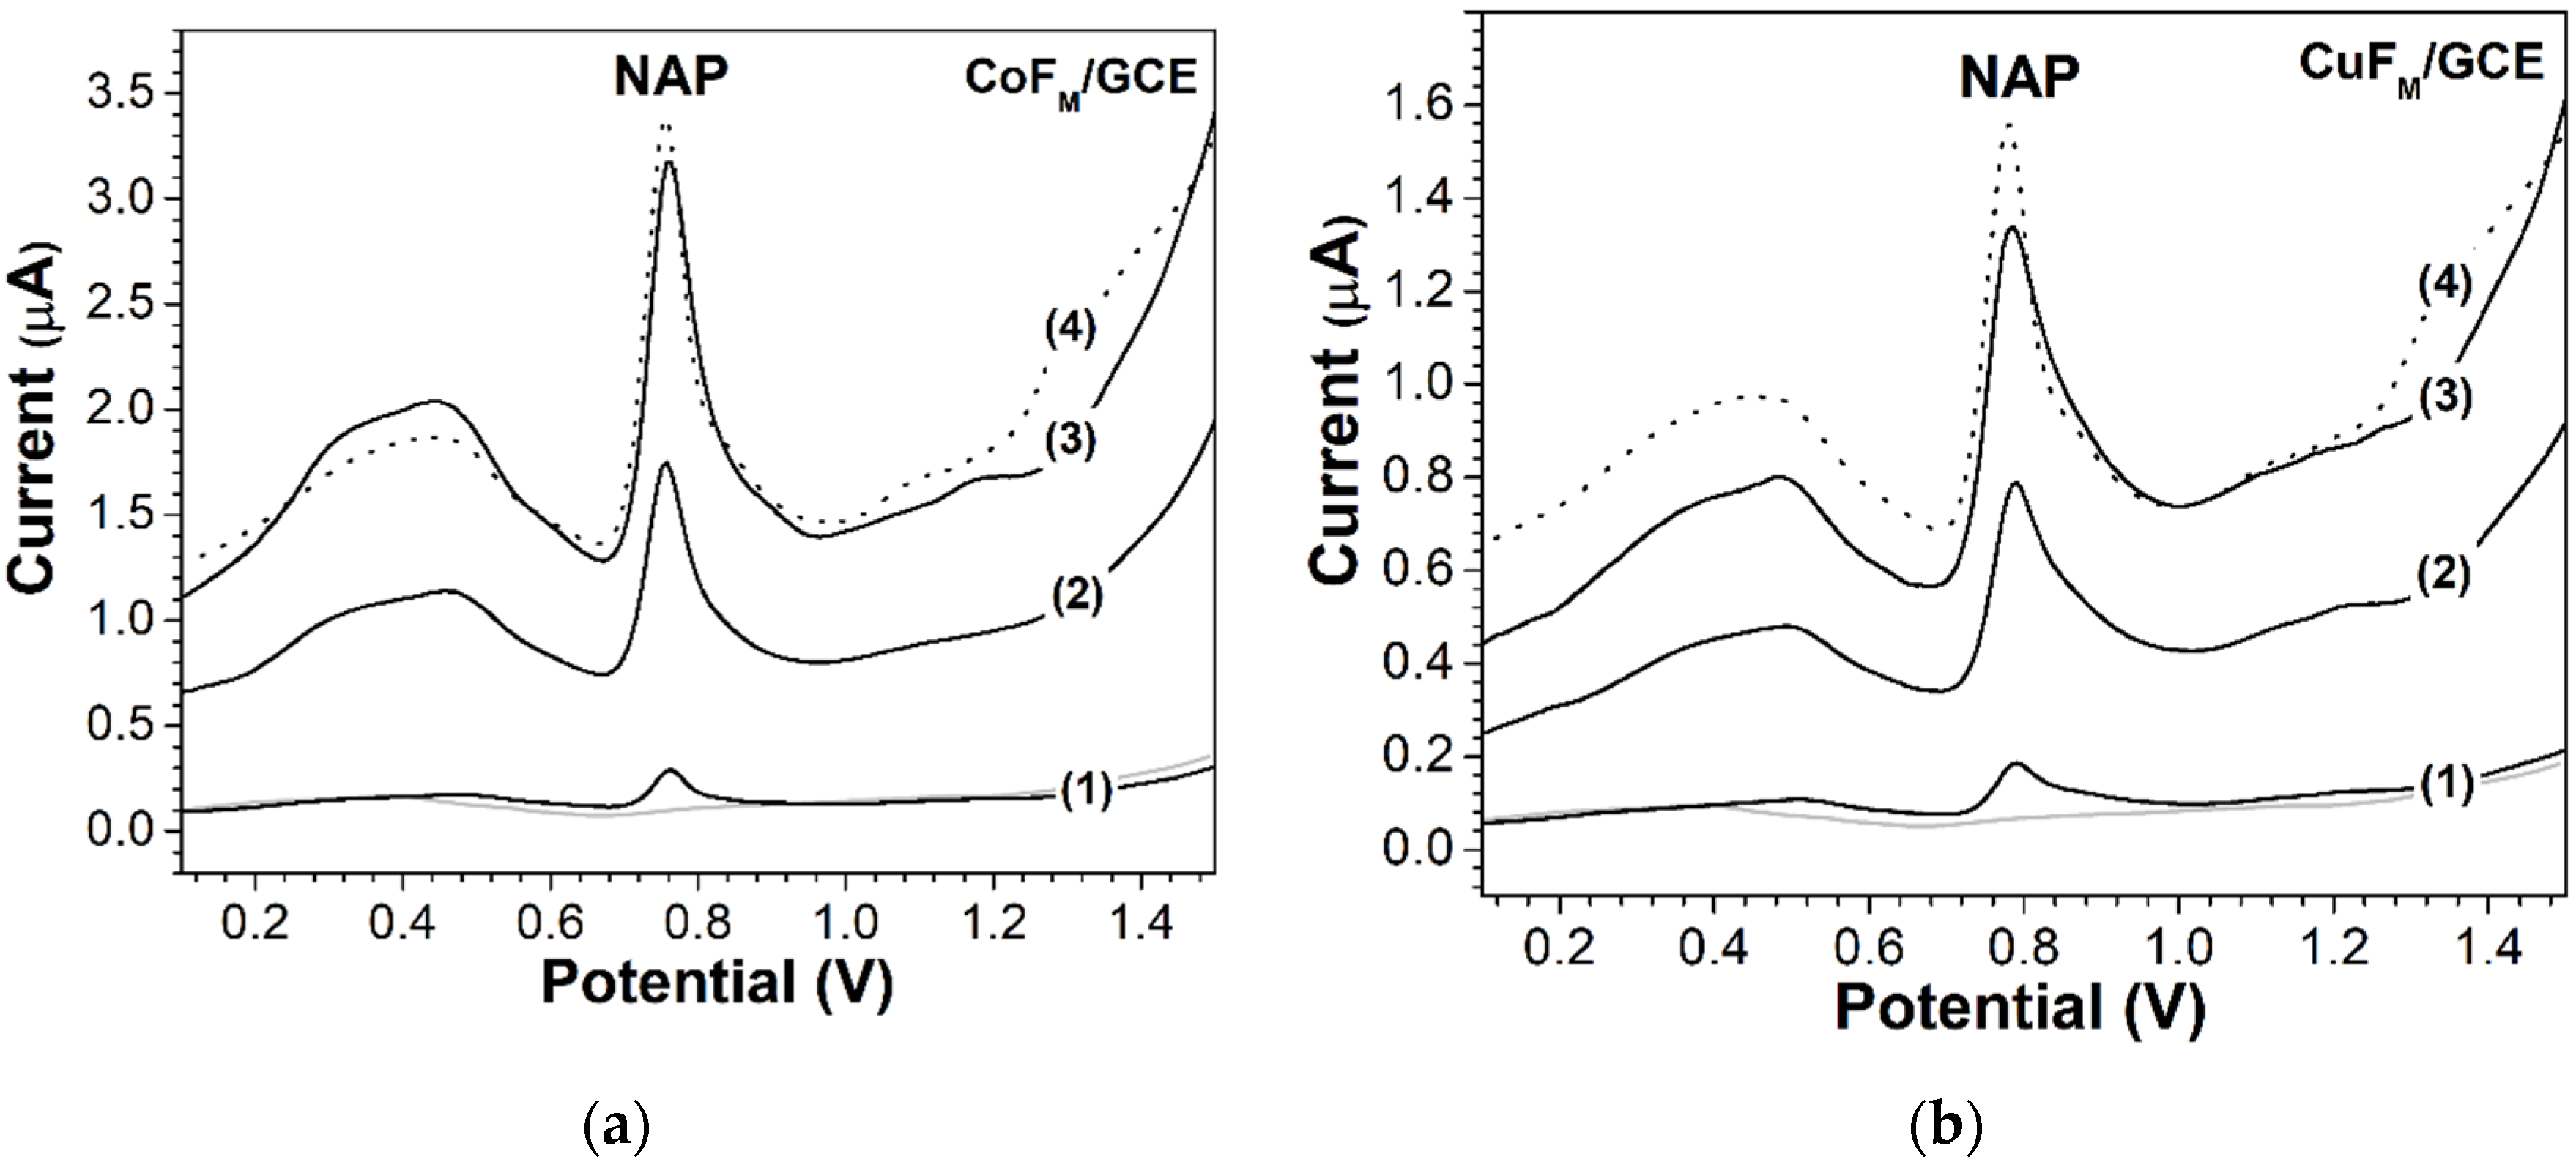
2.2.2. Electrochemical Response of NAP

Figure 5 presents a schematic diagram summarizing the chemical modification of the electrode and the voltammetric response of the NAP analyte at the copper- and cobalt-substituted barium hexaferrite (bare and modified) GCEs (2 × 10⁻³ mol L−1 NAP in 0.1-M phosphate-buffered saline [PBS], pH = 2.50).
The electrochemical properties of copper- and cobalt-substituted barium hexaferrites (bare and modified electrodes) were investigated using a cyclic voltammetry (CV) of 2.0-mM acetaminophen at 0.1 Vs−1, a potential window of −0.2–1.4 V in 0.1-M PBS and a pH of 2.50. Figure 6 shows the comparative cyclic voltammograms of the electrodes.
The electrochemical oxidation of acetaminophen produced higher current responses at the modified electrodes (CuFM GCE and CoFM GCE) than at the bare electrodes. This could be attributed to the presence of barium hexaferrite nanoparticles substituted with copper, which led to an enhancement in the electrical conductivity and porosity; this exposed the analyte to more active surface sites and an increase in mass transport [47]. Figure 6 shows a change in the value of the potential peak. The anodic peak potential at the modified electrodes was observed to be less positive than at the bare electrode, and an increase in the anodic peak current at the modified electrodes was also observed. Together, these facts indicate that the synthesized nanoparticles effectively catalyzed the electrochemical oxidation of NAP [48,49]. Concerning the barium ferrites in this study, the greatest effect occurred when using the hexaferrites substituted with cobalt rather than copper.
Table 1 contains details of the parameters determined in the cyclic voltammetric detection of acetaminophen on bare and modified electrodes.
The behavior of the anodic peak current vs. the variation of the sweep rate in the range of 25–350 mVs−1 is illustrated in Figure 7. A linear trend of the peak current and peak potential according to the scan rate is evident. Furthermore, when the sweep rate was increased, there was an increase in the peak current, and the peak potential shifted toward more positive values, which indicates a diffusion-controlled electrochemical process.
The first cycle shows an oxidation peak at 0.786 V for the CuFM GCE and 0.768 V for the CoFM GCE, respectively. Figure 8 contains a linear plot of the peak currents against the square root of the scan rate (v1/2) and the potential against the logarithm of the scan rate for both anodic lines (CoFM and CuFM GCEs), thereby confirming a diffusion-controlled process. Figure 8b demonstrates that for the oxidation of NAP using the CoFM-modified GCE, lower peak potential values are evident compared with those obtained for the CuFM-modified GCE. This could be attributed to the superior catalytic capacity of cobalt over copper in barium hexaferrite.
At each modified electrode the behavior of the anodic peak potential value against the scan rate revealed that the electrochemical process for the anodic oxidation of NAP was irreversible. According to Laviron, peak potential Ep for an irreversible electron transfer can be expressed by the following equation:
E p = E 0 + ( 2 . 30 RT α nF ) log ( RTk 0 α nF ) + ( 2 . 30 RT α nF ) log   v ,
where k0 is the standard heterogeneous rate constant of the reaction, E0′ is the formal redox potential, α is the charge-transfer coefficient, n is the number of transferred electrons, F is the Faraday constant (96,500 C mol−1), and R and T are 8.123 J mol K−1 and 298 K, respectively [49]. The value of αn can be calculated easily from the slope of Ep vs. the log v plot. The slopes in the given system are for the CuFM GCE (0.0413) and the CoFM GCE (0.0386), respectively. Given that T = 298 K, R = 8.314 J/Kmol, and F = 96,480 C/mol, the value of αn was calculated to be 1.43 (k0 = 38.3 s−1) and 1.53 (k0 = 52.01 s−1). In Equation (1), E0 was obtained from data provided in an Ep vs. v plot at v = 0 (figure not shown); the obtained corresponding E0 values for the anodic process observed in Figure 7 were 0.776 V for the CoFM GCE and 0.796 V for the CuFM GCE [49]. The CoFM GCE produced higher αn and k0 values, which are associated with the major electroactivity of the CoFM GCE [46,47,48,49]. Then, the αn value was used to calculate n using Equation (2) below:
α = 47 . 7 E p E p 2 ,
where Ep/2 is the half-peak potential, Ep is the peak potential, and α is the charge-transfer coefficient [50,51]. The number of exchanged electrons (n) was observed to be ≈ 2, indicating that two electrons were involved in the oxidation of NAP at the CuFM and CoFM GCEs, respectively.

2.3. Electroanalysis of Acetaminophen NAP in Acidic Medium

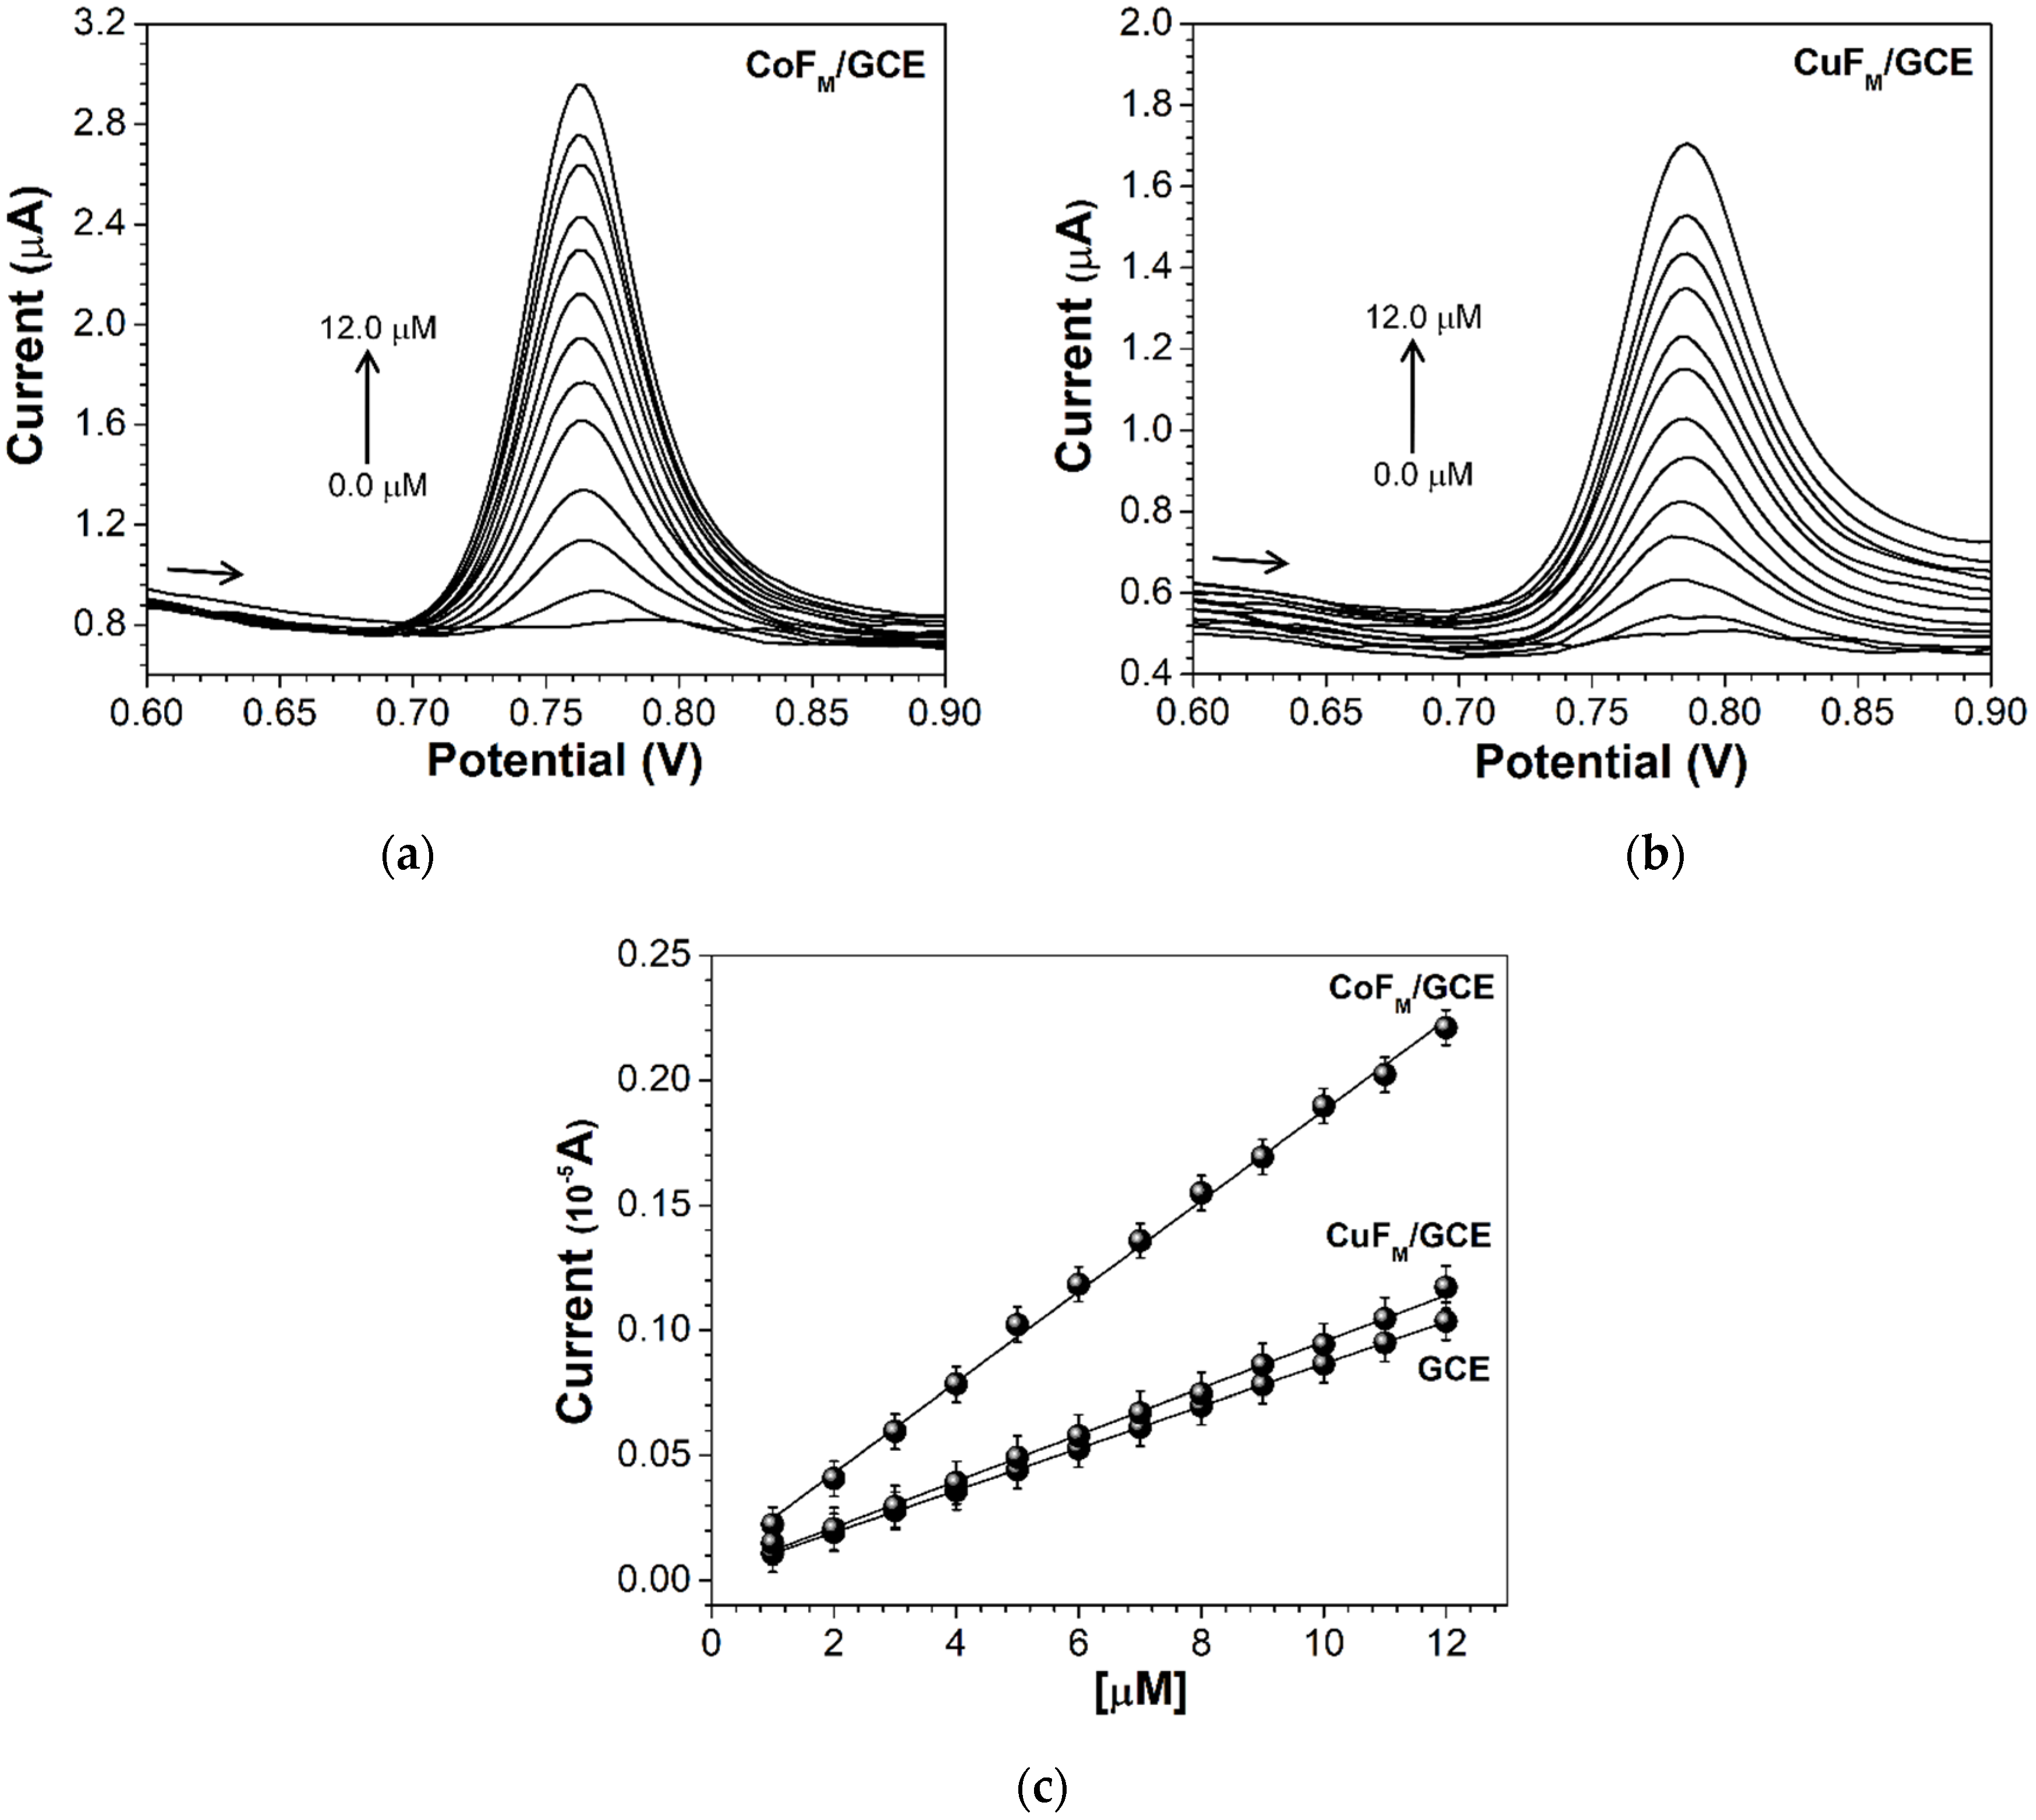
2.3.1. Concentration Analysis of NAP

The sensitivity of the method for determining NAP was evaluated using differential pulse voltammetry (DPV). Sharp and well-defined peaks were obtained at lower concentrations of NAP. Typically, the DPV technique is used to quantitatively analyze compounds of pharmaceutical concern, e.g., NAP. DP voltammograms at varying concentrations of NAP are presented in Figure 9a,b. The anodic peak current is seen to increase linearly with concentration in the range of 1.0 × 10⁻⁶ to 1.2 × 10⁻⁵ M; Figure 9c shows a linear calibration plot in which each calibration point is the mean of three measurements.
Equation (3) was used to calculate the detection limit (LoD) and the quantification limit (LoQ). The LoD was (0.255 ± 0.005), (0.577 ± 0.007), and (0.595 ± 0.008) µM, while the LoQ was (0.773 ± 0.005), (1.721 ± 0.006), and (1.782 ± 0.004) µM for the CoFM, CuFM, and GCEs, respectively:
LoD = 3 . 3   ×   SD Slope   and   LoQ = 10 . 0   ×   SD Slope ,
where SD is the standard deviation of the peak currents over the slope of the calibrated plot. The nanomaterials have different detection limits, and the LoD of the cobalt-substituted barium hexaferrite is lower than the copper-substituted barium hexaferrite nanomaterial and the bare electrode. These results indicate the excellent electroactivity and greater active area of the cobalt-substituted barium hexaferrite. Accordingly, these results support the feasibility of using M-type barium ferrites in the design of sensing devices for substances of pharmaceutical interest. In this study, the detection of NAP at low concentrations was facilitated using transition metals, such as cobalt.
The LoD obtained in this study compares favorably with those reported in previously published research (see Table 2).

2.3.2. Reproducibility and Stability in the Analysis of NAP with Modified Electrodes

Reproducibility and stability were evaluated using the modified electrode surfaces of the CoFM and CuFM GCEs. The study used 2 × 10⁻³ mol L−1 NAP in 0.1-M PBS at pH = 2.50. After 20 consecutive voltammetric cycles ranging from −0.2 to 1.2 V at 25 mVs−1, the maximum current decreased by less than 3.2% and 4.4%, respectively; this result indicates that the method provides good reproducibility for the CoFM and CuFM GCEs, respectively [47]. Additionally, the electrodes were unused for 10 days before being utilized in the NAP analysis. According to the CV and DPV responses of both modified electrodes, there was little change in the peak current, indicating considerable stability of both electrodes [56]. The modified electrode surfaces of the CoFM GCE yielded satisfactory results.

2.3.3. Analysis of Enriched and Real Urine Samples

The modified electrodes were used to quantify NAP concentrations in different pharmaceutical preparations. Additionally, the concentrations of NAP in human urine, which is a more complicated matrix, and commercial acetaminophen tablets were determined. For this investigation, the quantitative determination of NAP in urine samples enriched with commercial medicine containing acetaminophen was studied using DPV. SEVEDOL Extra Strength (SEF), a commercial drug, was selected. This product combines the analgesic properties of acetaminophen with the anti-inflammatory–analgesic activity of ibuprofen; potentiated by the action of caffeine, SEF provides powerful analgesic and anti-inflammatory properties and indicates severe pain, e.g., migraine. The SEF tablets each contained 250, 400, and 65 mg of acetaminophen, ibuprofen, and caffeine. The urine samples were diluted at least 100 times with a PBS buffer (pH = 2.50). The SEF-enriched samples were prepared at the same concentrations that were used to construct the calibration curve (see Figure 10).
It is evident from Figure 10a,b that a wide shoulder occurred at potentials between 0.2 and 0.6 V, which could be associated with the oxidation of ascorbic acid in urine [57]. Additionally, a weak signal around 1.0 V was associated with the oxidation of ibuprofen [58]. Signals corresponding to caffeine were not observed under experimental conditions. According to Figure 10, there is a relative consistency between the behavior of the peak potentials and peak currents with the results obtained in this study up to this point.
The peak potentials in Figure 10a are less positive than the corresponding ones in Figure 10b. The removal of NAP from the capsule supplements before analysis was not necessary.
Voltammetric signals corresponding to the characteristic peak of NAP were observed. The components of the SEF tablet produced no interference in the electrooxidation of NAP. A real human urine sample, which was obtained 4 h after the consumption of SEF, was used to determine the content of excreted NAP; none of the samples were pretreated. The same methodology used for the SEF-enriched samples described above was followed. Figure 10a,b shows the response of the modified electrodes and reveals that both devices responded to the detection of NAP in the actual sample. A calibration chart was used to analyze the enriched NAP in the urine samples; for the CoFM GCE, the recovery ranged from 96.6% to 101.0%, while that of the CuFM GCE was 93.9% to 98.4%. These results demonstrate the outstanding analytical performance of the modified electrode. Table 2 presents the results of the three investigated urine samples; sample 4 (the real urine sample) was analyzed 4 h after the consumption of SEF.
From Table 3, it can be determined that the modified electrodes detected concentrations of SEF in the urine samples according to the content of NAP [59,60,61,62,63]. The NAP concentration obtained in the pharmaceutical formulation agreed with the indicated amount, and the drug content of the tested SEF tablet was within the indicated amount. Therefore, the surface-modified electrodes successfully detected NAP in different samples and matrices.

3. Materials and Methods

The chemicals BaCl2.2H2O, CoCl2.2H2O, and CuCl2.6H2O (reagent grade RG) were purchased from Merck, FeCl3 was bought from Sigma Aldrich, >98% purity citric acid and C6H8O7 from Merck, RG grade propylene glycol (C3H8O2) and glycerin (C3H8O3) were from Merck. NH4OH (RG grade) and acetaminophen (Analytical grade AG) were used as received from Merck. The AG-grade PBS solution (supporting electrolyte) (0.1-M KH2PO4) was purchased from Merck, and the pH was adjusted using 0.1-M KOH (AG grade, Merck) and H3PO4 from Sigma Aldrich at a ratio of 1:1. The solutions were prepared using distilled water. The citrate sol gel method was utilized for the synthesis of the transition-metal-substituted barium ferrite nanomaterials, which were characterized using XRD, SEM, Fourier-transform infrared, and Raman analysis techniques [20].

Electrode Modification and Electrochemical Studies

Substituted M-type barium ferrite nanoparticles (2 mg) were dispersed in 1 mL deionized water before agitation in an ultrasonic bath for 1 h to achieve a well-dispersed suspension. The GCE was polished with 0.05 μm α-Al2O3, which was rinsed ultrasonically with water and absolute ethanol before sonication in deionized water. The modified electrodes with substituted M-type barium ferrites were prepared by casting 5 μL of the suspension on the surface of the pretreated GCE. Then, the prepared electrodes were maintained at a temperature of 29 °C for 3 h.
The electrochemical measurements were obtained using a computer-controlled AUTOLAB 128N electrochemical analyzer. A double-wall single-compartment cell with a three-electrode configuration was used. The auxiliary and reference electrodes comprised a Pt wire (active surface: d = 0.3 mm, l = 0.7 cm) and Ag/AgCl electrodes, respectively, and all potentials reported in this paper were referred to this reference electrode. The working electrodes comprised a bare GCE with a 3 mm diameter and a modified GCE with substituted M-type barium ferrite nanoparticles (Ba1.0Co1.22Fe11.41O18.11 GCE (CoFM GCE) and Ba1.14Cu0.82Fe11.65O18.02 GCE (CuFM GCE)). The DPV specifications were 0.1 ≤ Epa ≤ 1.6 V at a step potential of 5 mV, pulse amplitudes of 100 mV, pulse times of 50 ms, and a scan rate of 10 mV s−1.

4. Conclusions

This study used the authors’ method [20] to prepare substituted barium hexaferrites to modify the surfaces of the electrodes. The use of glycerin produced better than, i.e., propylene glycol and enhanced the formation of hexagonal M-type ferrites. The cobalt- and copper-substituted barium hexaferrite nanomaterials were used to modify the surfaces of GCEs. The electrochemical behavior of the substituted M-type barium ferrite nanoparticles was successfully demonstrated using NAP as a model analyte. NAP oxidation was indicated by the electroactivity of the nano-CoFM GCE and the CuFM GCE. The rate of electron transfer was enhanced by the nanoparticles, and the NAP oxidation current at the modified electrode surfaces was significantly improved. A graph of the peak currents against the square root of the scan rate provided regression values of 0.9983 and 0.9903 for both modifiers, respectively, indicating a diffusion-controlled electrochemical process. However, the calculated detection limits corresponded well with those reported in previous studies. Finally, the CoFM GCE sensor exhibited superior voltammetric behavior than both the CuFM and the unmodified GCE. These findings support the use of the proposed sensor for NAP monitoring in pharmaceutical samples.

Author Contributions

All authors participated in the conceptualization, methodology, and investigation. Project administration, J.A.M.-M.; Resources J.A.M.-M.; Investigation, D.G.S.-C., C.P.G.-B. and J.A.M.-M.; Writing—original draft, J.A.M.-M., Writing—review and editing, J.A.M.-M. and D.G.S.-C. All authors have read and agreed to the published version of the manuscript.

Funding

This research has been funded by Dirección General de Investigaciones of Universidad Santiago de Cali and the authors gratefully acknowledge the Universidad Santiago de Cali for the financial support provided to the DGI-COCEIN no. 939-621119-480 and Project DGI-COCEIN no. 939-621120-2247.

Institutional Review Board Statement

Not applicable.

Informed Consent Statement

Not applicable.

Data Availability Statement

Not applicable.

Acknowledgments

The authors gratefully acknowledge Erika Méndez Benemérita Universidad Autónoma de Puebla, Jairo Alberto Gómez Universidad Pedagógica y Tecnológica de Colombia, William Universidad Militar Nueva Granada, and Sandra Basante Delgado Universidad Santiago de Cali.

Conflicts of Interest

The authors declare no conflict of interest.

Sample Availability

Samples of the compounds are not available from the authors.

References

  1. Gutes, A.; Calvo, D.; Cespedes, F.; del Valle, M. Automatic sequential injection analysis electronic tongue with integrated reference electrode for the determination of ascorbic acid, uric acid and paracetamol. Microchim. Acta 2007, 157, 1–6. [Google Scholar] [CrossRef]
  2. Moreira, A.B.; Oliveira, H.P.M.; Atvars, T.D.Z.; Dias, I.L.T.; Neto, G.O.; Zagatto, E.A.G.; Kubota, L.T. Direct determination of paracetamol in powdered pharmaceutical samples by fluorescence spectroscopy. Anal. Chim. Acta 2005, 539, 257–261. [Google Scholar] [CrossRef]
  3. Erk, N. Application of derivative-differential UV spectrophotometry and ratio derivative spectrophotometric determination of mephenoxalone and acetaminophen in combined tablet preparation. J. Pharm. Biomed. Anal. 1999, 21, 429–437. [Google Scholar] [CrossRef]
  4. Burgot, G.; Auffret, F.; Burgot, J.L. Determination of acetaminophen by thermometric titrimetry. Anal. Chim. Acta 1997, 343, 125–128. [Google Scholar] [CrossRef]
  5. Easwaramoorthy, D.; Yu, Y.C.; Huang, H.J. Chemiluminescence detection of paracetamol by a luminol-permanganate based reaction. Anal. Chim. Acta 2001, 439, 95–100. [Google Scholar] [CrossRef]
  6. Ravisankar, S.; Vasudevan, M.; Gandhimathi, M.; Suresh, B. Reversed-phase HPLC method for the estimation of acetaminophen, ibuprofen and chlorzoxazone in formulations. Talanta 1998, 46, 1577–1581. [Google Scholar] [CrossRef]
  7. Peng, W.; Li, T.; Li, H.; Wang, E. Direct injection of urine and determination of acetaminophen by micellar liquid chromatography with a wall-jet cell/carbon fibre microelectrode. Anal. Chim. Acta 1994, 298, 415. [Google Scholar] [CrossRef]
  8. He, F.Y.; Liu, A.L.; Xia, X.H. Poly(dimethylsiloxane) microchip capillary electrophoresis with electrochemical detection for rapid measurement of acetaminophen and its hydrolysate. Anal. Bioanal. Chem. 2004, 379, 1062. [Google Scholar] [CrossRef]
  9. Heitmer, S.; Blaschke, G. Direct determination of paracetamol and its metabolites in urine and serum by capillary electrophoresis with ultraviolet and mass spectrometric detection. J. Chromotogr. B Biomed. Sci. Appl. 1999, 721, 93. [Google Scholar] [CrossRef]
  10. Suntornsuk, L.; Pipitharome, O.; Wilairat, P. Simultaneous determination of paracetamol and chlorpheniramine maleate by micellar electrokinetic chromatography. J. Pharm. Biomed. Anal. 2003, 33, 441. [Google Scholar] [CrossRef]
  11. Valero, E.; Carrion, P.; Varon, R.; Carmona, F.G. Quantification of acetaminophen by oxidation with tyrosinase in the presence of Besthorn’s hydrazine. Anal. Biochem. 2003, 318, 187. [Google Scholar] [CrossRef]
  12. Malviya, M.; Singh, J.P.; Singh, R.N. Electrochemical characterization of polypyrrole/cobalt ferrite composite films for oxygen reduction. Indian J. Chem. 2005, 44, 2233–2236. [Google Scholar]
  13. Simonsen, V.L.E.; Find, D.; Lilliedal, M.; Petersen, R.; Kammer, K. Spinels as cathodes for the electrochemical reduction of O2 and NO. Top. Catal. 2007, 45, 143. [Google Scholar] [CrossRef]
  14. Rocha-Santos, T.A. Sensors and biosensors based on magnetic nanoparticles. TrAC Trends Anal. Chem. 2014, 62, 28–36. [Google Scholar] [CrossRef]
  15. Kefeni, K.K.; Msagati, T.A.; Mamba, B.B. Ferrite nanoparticles: Synthesis, characterisation and applications in electronic device. Mater. Sci. Eng. B 2017, 215, 37–55. [Google Scholar] [CrossRef]
  16. Song, F.; Shen, X.; Xiang, J.; Zhu, Y. Characterization and magnetic properties of BaxSr1 − xFe12O19 (x = 0 − 1)ferrte hollow fibers via gel-precursor transformation process. J. Alloy. Compd. 2010, 507, 297–301. [Google Scholar] [CrossRef]
  17. Pullar, R.C. Hexagonal ferrites: A review of the synthesis, properties and applications of hexaferrite ceramics. Prog. Mater. Sci. 2012, 57, 1191–1334. [Google Scholar] [CrossRef]
  18. Veisi, S.S.; Yousefi, M.; Amini, M.M.; Shakeri, A.R.; Bagherzadeh, M. Magnetic and microwave absorption properties of Cu/Zr doped M+type Ba/Sr hexaferrites prepared via sol-gel auto-combustion method. J. Alloy. Compd. 2019, 773, 1187–1194. [Google Scholar] [CrossRef]
  19. Valenzuela, R. Magnetic Ceramics. In Chemistry of Solid State Materials Part No. 4; Cambridge University Press: Cambridge, UK, 1994; p. 50. [Google Scholar]
  20. Basante-Delgado, S.F.; González-Vidal, D.; Morales-Morales, J.A.; Aperador-Chaparro, W.A.; Gómez-Cuaspud, J.A. A preliminary study of oxides of Fe doped with Ba, Co, Cu and synthetized by the citrate sol–gel combustion route. J. Phys. Conf. Ser. 2020, 1541, 012013. [Google Scholar] [CrossRef]
  21. Zhon, W.; Ding, W.P.; Zhang, N.; Hong, J.M.; Yan, Q.J.; Du, Y.W. Key step in synthesis of ultrafine BaFe12O19 by sol-gel technique. J. Magn. Magn. Mater. 1997, 168, 196–202. [Google Scholar] [CrossRef]
  22. Vadivelan, S.; Victor Jaya, N. Investigation of magnetic and structural properties of copper substituted barium ferrite powder particles via co-precipitation method. Results Phys. 2016, 6, 843–850. [Google Scholar] [CrossRef] [Green Version]
  23. Fang, T.-T.; Wu, M.-S.; Tsai, J.-D. 13C NMR study of the solution chemistry of barium titanium citrate gels prepared using pechini process. J. Am. Ceram. Soc. 2002, 85, 2984–2988. [Google Scholar] [CrossRef]
  24. Gonzalez-Carreño, T.; Morales, M.P.; Serna, C.J. Barium ferrite nanoparticles prepared directly by aerosol pirolisis. Mater. Lett. 2000, 43, 97–101. [Google Scholar] [CrossRef]
  25. Liu, X.; Wang, J.; Gan, L.-M.; Ng, S.-C. Improving the magnetic properties of hydrothermally synthesized barium ferrite. J. Magn. Magn. Mater. 1999, 195, 452–459. [Google Scholar] [CrossRef]
  26. Müller, R.; Hiergeist, R.; Steinmetz, H.; Ayoub, N.; Fujisaki, M.; Schüppel, W. Barium hexaferrite ferrofluids—Preparation and physical properties. J. Magn. Magn. Mater. 1999, 201, 34–37. [Google Scholar] [CrossRef]
  27. Hüseyin, S.; Hüsnü, O.; Nader, G. Properties of YBCO superconductors prepared by ammonium nitrate melt and solid-state reaction methods. J. Alloys Compd. 2007, 428, 1–7. [Google Scholar]
  28. Hüseyin, S. Simple recipe to synthesize single-domain BaFe12O19 with high saturation magnetization. J. Magn. Magn. Mater. 2009, 321, 2717–2722. [Google Scholar]
  29. Hüseyin, S. Effect of pelletization on magnetic properties of BaFe12O19. J. Alloys Compd. 2009, 486, 809. [Google Scholar]
  30. Ebrahim, P.; Ali, G.; Abdolhamid, J.; Hassan, S. Influence of acid catalysts on the structural and magnetic properties of nanocrystalline barium ferrite prepared by sol–gel method. J. Magn. Magn. Mater. 2008, 320, L137. [Google Scholar]
  31. Chimarro, E.; Moreno, B.; Martin, D.; Gozález, L.; Villanueva, E.; Guinea, D.; Jurado, J.R. Posibilidades del análisis de imagen para el estudio de la síntesis de materiales por combustión. Bol. Soc. Esp. Ceram. V 2005, 44, 105–112. [Google Scholar] [CrossRef]
  32. Rostami, M.; Reza, M.; Vahdani, K.; Moradi, M. Structural, magnetic, and microwave absorption properties of Mg-TiZr-Co-substituted barium hexaferrites nanoparticles synthesized via sol–gel auto-combustion method. J. Sol.-Gel. Sci. Technol. 2017, 82, 783–794. [Google Scholar] [CrossRef]
  33. El-Batal, A.I.; Farrag, A.A.; Elsayed, M.A.; El-Khawaga, A.M. Biodiesel Production by Aspergillus niger Lipase Immobilized on Barium Ferrite Magnetic Nanoparticles. Bioengineering 2016, 3, 14. [Google Scholar] [CrossRef] [PubMed] [Green Version]
  34. Wangchang, L.; Xiaojing, Q.; Mingyu, L.; Ting, L.; Peng, H.X. La and Co substituted M-type barium ferrites processed by sol–gel combustion synthesis. Mater. Res. Bull. 2013, 48, 4449–4453. [Google Scholar]
  35. Sonal, S.; Kirandish, K.; Sheenu, J.; Santosh, B.; Bansal, S. Structural and Magnetic Properties of BaCoxFe12xO19 (x = 0.2, 0.4, 0.6, & 1.0) Nanoferrites Synthesized via Citrate Sol-Gel Method. World J. Condens. Matter Phys. 2011, 1, 101–104. [Google Scholar]
  36. Briceño, S.; Sagredo, V.; del Castillo, H. Synergy in the selective catalytic reduction of nox over cu1-xcoxfe2o4 ferrites. Rev. Latinam. Metal. Mat. 2012, 32, 129–135. [Google Scholar]
  37. Zabiszak, M.; Nowak, M.; Taras-Goslinska, K.; Kaczmarek, M.T.; Hnatejko, Z.; Jastrzab, R. Carboxyl groups of citric acid in the process of complex formation with bivalent and trivalent metal ions in biological systems. J. Inorg. Biochem. 2018, 182, 37–47. [Google Scholar] [CrossRef]
  38. Bagherinasab, Z.; Beitollahi, H.; Yousefi, M.; Bagherzadeh, M.; Hekmati, M. Rapid sol gel synthesis of BaFe12O19 nanoparticles: An excellent catalytic application in the electrochemical detection of tramadol in the presence of acetaminophen. Microchem. J. 2020, 156, 104803. [Google Scholar] [CrossRef]
  39. Kreisel, J.; Lucazeau, G.; Vincent, H. Raman Spectra and Vibrational Analysis of BaFe12O19 Hexagonal Ferrite. J. Solid State Chem. 1998, 137, 127. [Google Scholar] [CrossRef]
  40. Zhao, W.Y.; Wei, P.; Wu, X.Y.; Wang, W.; Zhang, Q.J. Lattice vibration characterization and magnetic properties of M-type barium hexaferrite with excessive iron. J. Appl. Phys. 2008, 103, 063902. [Google Scholar] [CrossRef]
  41. Ali, M.M. Synthesis and Study the Structural and Magnetic Properties of Cobalt Substituted Strontium Hexaferrite. Int. J. Nanoelectron. Mater. 2020, 13, 283–294. [Google Scholar]
  42. Morales-Morales, J.A. Synthesis of Hematite α-Fe2O3 Nano Powders by the controlled precipitation method. Cienc. Desarro. 2017, 8, 99–107. [Google Scholar] [CrossRef] [Green Version]
  43. Jain, S.; Shah, J.; Negi, N.S.; Sharma, C.; Kotnala, R.K. Significance of interface barrier at electrode of hematite hydroelectric cell for generating ecopower by water splitting. Int. J. Energy Res. 2019, 43, 4743–4755. [Google Scholar] [CrossRef]
  44. Zhang, X.; Niu, Y.; Meng, X.; Li, Y.; Zhao, J. Structural evolution and characteristics of the phase transformations between α-Fe2O3, Fe3O4 and γ-Fe2O3 nanoparticles under reducing and oxidizing atmosphere. CrstEngComm 2013, 15, 8166–8172. [Google Scholar] [CrossRef]
  45. Wu, M.S.; Chung, C.J.; Ceng, Z.Z. Cyclic voltammetric deposition of discrete nickel phosphide clusters with mesoporous nanoparticles on fluorine-doped tin oxide glass as a counter electrode for dye-sensitized solar cells. RSC Adv. 2015, 5, 4561–4567. [Google Scholar] [CrossRef]
  46. Oliver-Tolentino, M.A.; Guzmán-Vargas, A.; Manzo-Robledo, A.; Martínez-Ortiz, M.J.; Flores-Moreno, J.L. Modified electrode with hydrotalcite-like materials and their response during electrochemical oxidation of blue 69. Catal. Today 2011, 166, 194–200. [Google Scholar] [CrossRef]
  47. Ashrafi, A.M.; Richtera, L. Preparation and Characterization of Carbon Paste Electrode Bulk-Modified with Multiwalled Carbon Nanotubes and Its Application in a Sensitive Assay of Antihyperlipidemic Simvastatin in Biological Samples. Molecules 2019, 24, 2215. [Google Scholar] [CrossRef] [Green Version]
  48. Santosh, B.K.; Sharanappa, T.N. Electrochemical Behavior of 2-Aminothiazole at Poly Glycine Modified Pencil Graphite Electrode. Anal. Bioanal. Electrochem. 2020, 12, 208–222. [Google Scholar]
  49. Ali, M.F.B.; Abdel-aal, F.A.M. In situ polymerization and FT-IR characterization of polyglycine on pencil graphite electrode for sensitive determination of antiemetic drug, granisetron in injections and human plasma. RSC Adv. 2019, 9, 4325–4335. [Google Scholar] [CrossRef] [Green Version]
  50. Bard, A.J.; Faulkner, L.R. Electrochemical Methods: Fundamentals and Applications, 2nd ed.; Wiley Interscience: New York, NY, USA, 2004. [Google Scholar]
  51. Asadpour-Zeynali, K.; Amini, R. Nanostructured hexacyanoferrate intercalated Ni/Al layered double hydroxide modified electrode as a sensitive electrochemical sensor for paracetamol determination. Electroanalysis 2017, 29, 635–642. [Google Scholar] [CrossRef]
  52. Andawiyah, R.; Mulyasuryani, A.; Sulistyarti, H. Voltammetric Determination of Paracetamol using Polyvinyl Alcohol (PVA)-Fe3O4 Modified Glassy Carbon Electrode. IOP Conf. Ser. Mater. Sci. Eng. 2020, 833, 012059. [Google Scholar] [CrossRef]
  53. Manjunatha, J.G. Electroanalysis of estriol hormone using electrochemical sensor. Sens. Bio-Sens. Res. 2017, 16, 79–84. [Google Scholar] [CrossRef]
  54. Pasban, A.A.; Nia, E.H.; Piryaei, M. Determination of Acetaminophen Via TiO2/MWCNT Modified Electrode. J. Nanoanalysis 2017, 4, 142–149. [Google Scholar]
  55. OmymenaJelen, W.M.; Rogana, J.R.; Jugović, B.Z.; Gvozdenović, M.M.; Grgur, B.N. Photo-assisted electrochemical oxidation of the urea onto TiO2-nanotubes modified by hematite. J. Saudi Chem. Soc. 2017, 21, 990–997. [Google Scholar] [CrossRef]
  56. Osman, N.S.E.; Thapliyal, N.; Alwan, W.S.; Karpoormath, R.; Moyo, T. Synthesis and characterization of Ba0.5Co0.5Fe2O4 nanoparticle ferrites: Application as electrochemical sensor for ciprofloxacin. J. Mater. Sci. Mater. Electron. 2015, 26, 5097–5105. [Google Scholar] [CrossRef]
  57. Khaskheli, A.R.; Fischerb, J.; Barekb, J.; Vyskocil, V.; Uddin, S.; Iqbal Bhanger, M. Differential pulse voltammetric determination of paracetamol in tablet and urine samples at a micro-crystalline natural graphite–polystyrene composite film modified electrode. Electrochim. Acta 2013, 101, 238–242. [Google Scholar] [CrossRef]
  58. Serrano, N.; Castilla, Ò.; Ariño, C.; Diaz-Cruz, M.S.; Díaz-Cruz, J.M. Commercial Screen-Printed Electrodes Based on Carbon Nanomaterials for a Fast and Cost-Effective Voltammetric Determination of Paracetamol, Ibuprofen and Caffeine in Water Samples. Sensors 2019, 19, 4039. [Google Scholar]
  59. Siegers, C.P.; Schütt, A. Dose-Dependent Biliary and Renal Excretion of Paracetamol in the Rat. Pharmacology 1979, 18, 175–179. [Google Scholar] [CrossRef] [PubMed]
  60. Bales, J.R.; Sadler, P.J.; Nicholson, J.K.; Timbrell, J.A. Urinary Excretion of Acetaminophen and Its Metabolites as Studied by Proton NMR Spectroscopy. Clin. Chem. 1984, 30, 1631–1636. [Google Scholar] [CrossRef] [PubMed]
  61. Miller, R.P.; Roberts, R.J.; Fischer, L.J. Acetaminophen elimination kinetics in neonates, children, and adults. Clin. Pharmacol Ther. 1975, 19, 284–294. [Google Scholar] [CrossRef] [PubMed]
  62. Foroozan, H.; Masoumeh, T.; Somayeh, T. Ultra-sensitive electrochemical sensing of acetaminophen and codeine in biological fluids using CuO/CuFe2O4 nanoparticles as a novel electrocatalyst. J. Food Drug Anal. 2018, 26, 879–886. [Google Scholar]
  63. Bose, D.; Durgbanshi, A.; Martinavarro-Domínguez, A.; Capella-Peiró, M.E.; Carda-Broch, S.; Esteve-Romero, J.S.; Gil-Agustí, M.T. Rapid Determination of Acetaminophen in Physiological Fluids by Liquid Chromatography Using SDS Mobile Phase and ED Detection. J. Chromatogr. Sci. 2005, 43, 313–318. [Google Scholar] [CrossRef] [PubMed] [Green Version]
Figure 1. XRD patterns of M-type barium hexaferrite: (a) unsubstituted, (b) cobalt substituted, (c) copper substituted, and (d) unsubstituted. Nanomaterials were sintered at 950 °C for 3 h using (a) propylene glycol and (bd) glycerin, respectively. F = M-type barium ferrite and H = hematite.
Molecules 27 01550 g001
Figure 2. Raman spectra and Eg, E2g, A1g active modes of M-type barium hexaferrite: (a) unsubstituted, (b) cobalt substituted, (c) copper substituted, and (d) unsubstituted. The nanomaterials were sintered at 950 °C for 3 h using (a) propylene glycol and (bd) glycerin, respectively.
Molecules 27 01550 g002
Figure 3. FESEM image of unsubstituted barium hexaferrite Ba1.0Fe11.72O18.72.
Molecules 27 01550 g003
Figure 4. Cyclic voltammograms of (a) bare GCE dashed line, (b) CuFM GCE solid line and (c) CoFM GCE dot line in 1 × 10⁻⁴ M K3[Fe(CN)6] in 0.1 M KCl solution at a scan rate of 0.1 Vs−1.
Molecules 27 01550 g004
Figure 5. Schematic diagram of the electrode modification procedure and the electrochemical response of NAP at the electrode.
Molecules 27 01550 g005
Figure 6. Cyclic voltammograms of 2 × 10⁻³ mol L−1 NAP in 0.1 M PBS (pH = 2.5) on (a) bare electrode dotted line, (b) CuFM GCE dashed line, and (c) CoFM GCE in solution, respectively, at a scan rate of 0.1 Vs−1.
Molecules 27 01550 g006
Figure 7. Cyclic voltammograms of 2 × 10⁻³ mol L−1 NAP in 0.1 M PBS (pH = 2.5) with (a) CoFM-modified GCE and (b) CuFM-modified GCE at different scan rates of from 0.025 at 0.35 Vs−1. The dashed line corresponds to the supporting electrolyte at the modified electrode.
Molecules 27 01550 g007
Figure 8. (a) Linear plots of peak currents (μA) vs. the square of the scan rate: The CoFM GCE Ipa = 22.8642 v1/2 + 53.58, R2 = 0.9983, and the CuFM GCE Ipa = 4.6248 v1/2 + 96.26, R2 = 0.9803. (b) Linear plots of peak potential vs. the logarithm of the scan rate at the CuFM GCE Epa = 0.04131 Log v + 0.7289, R2 = 0.9972, and the CoFM GCE Epa = 0.0386 Log v + 0.7137, R2 = 0.9942 in 0.1-M PBS (pH = 2.5) containing NAP 2 × 10⁻³ mol L−1.
Molecules 27 01550 g008
Figure 9. DP voltammograms of acetaminophen at different concentrations (0, 1, 2, 3, 4, 5, 6, 7, 8, 9, 10, 11, and 12 µM, respectively) in 0.1-M PBS (pH = 2.5) solution at the (a) CoFM GCE and (b) CuFM GCE. (c) Linear graph of current peak vs. NAP concentrations. CoFM GCE Ipa = 0.181 (NAP) + 0.058, R2 = 0.9979, CuFM GCE Ipa = 0.0930 (NAP) + 0.0263, R2 = 0.9974, and CGE Ipa = 0.084 (NAP) + 0.024, R2 = 0.9999.
Molecules 27 01550 g009
Figure 10. DPVs of acetaminophen NAP prepared in urine media and three samples with additions of (1) 1.0, (2) 5.0, and (3) 10.0 mM. (4) The dotted line indicates 10 µL of a real urine sample 4 h after consumption of SEF. The gray line indicates the absence of NAP. (a) CoFM/CGE and (b) CuFM/CGE were modified electrodes respectively.
Molecules 27 01550 g010
Table 1. Parameters obtained using CV at the bare and modified electrodes with 2 × 10⁻³ mol L−1 NAP in 0.1-M PBS (pH = 2.50).
SurfacePeak Current Ipa (µA)Peak Potential Epa (V)
GCE96.12 ± 4.73 0.864 ± 0.028
CuFM/GCE131.24 ± 4.510.793 ± 0.031
CoFM/GCE201.37 ± 4.220.777 ± 0.027
Table 2. Comparison of the designed sensor with previously reported sensors for NAP determination.
Modified ElectrodeMethodsLinear Range(µM)AnalyteLoD (µM)Ref
GCE-arene-ruthenium (II) complexAmperometry1.99–31NAP0.58[52]
GCE-PVA-Fe3O4CV0–100NAP8[53]
GCE-hexacyanoferrate(III) intercalated Ni Al LDHCV3.0–1500NAP0.80[54]
GCE-MWCNT/TiO2CV10–120NAP11.77[55]
GCE-Ba1.0Co1.22Fe11.41O18.11 DPV1–12NAP0.530This work
GCE-Ba1.14Cu0.82Fe11.65O18.02DPV1–12NAP0.895This work
Abbreviations: GCE, glass carbon electrode; NAP, acetaminophen; CV, cyclic voltammetry; DPV, differential pulse voltammetry.
Table 3. Determination of NAP in urine samples.
UrineAdded (μM)(a) Detected (µM)Recovery (%)SD ± RSD (%)
CoFM/GCECuFM/GCECoFM/GCE CuFM/GCECoFM/GCECuFM/GCE
Sample 110.980.9598.095.00.019 ± 1.9390.032 ± 3.371
Sample 254.994.8999.897.80.023 ± 0.4600.021 ± 0.430
Sample 31010.019.84101.098.40.021 ± 0.2100.041 ± 0.417
(b) Sample 4-10.569.18----
1019.8618.0196.693.90.015 ± 0.0760.031 ± 0.172
(a) Average of three replicates. (b) Real urine sample obtained 4 h after the consumption of SEF.
Publisher’s Note: MDPI stays neutral with regard to jurisdictional claims in published maps and institutional affiliations.

