Abstract
The current study was conducted to estimate the carbon (C) storage status of agroforestry systems, via a non-destructive strategy. A total of 75 plots (0.405 ha each) were selected by adopting a lottery method of random sampling for C stock estimations for soil, trees and crops in the Mandi-Bahauddin district, Punjab, Pakistan. Results revealed that the existing number of trees in selected farm plots varied from 25 to 30 trees/ha. Total mean tree carbon stock ranged from 9.97 to 133 Mg C ha−1, between 5–10 km away from the brick kilns in the study area. The decreasing order in terms of carbon storage potential of trees was Eucalyptus camaldulensis > Syzygium cumin > Popolus ciliata > Acacia nilotica > Ziziphus manritiana > Citrus sinensis > Azadirachtta Indica > Delbergia sisso > Bambusa vulgaris > Melia azadarach > Morus alba. Average soil carbon pools ranged from 10.3–12.5 Mg C ha−1 in the study area. Meanwhile, maximum C stock for wheat (2.08 × 10⁶ Mg C) and rice (1.97 × 10⁶ Mg C) was recorded in the cultivated area of Tehsil Mandi-Bahauddin. The entire ecosystem of the study area had an estimated woody vegetation carbon stock of 68.5 Mg C ha−1 and a soil carbon stock of 10.7 Mg C ha−1. These results highlight that climate-smart agriculture has great potential to lock up more carbon and help in the reduction of CO2 emissions to the atmosphere, and can be further used in planning policies for executing tree planting agendas on cultivated lands and for planning future carbon sequestration ventures in Pakistan.
1. Introduction
Pakistan is predicted to be among the ten countries most affected by climate change, according to the 2019 Global Climate Risk Index [1]. Global climate change, by increasing the amount of greenhouse gases (GHG) in the atmosphere, is causing severe environmental and climatic effects. Carbon dioxide (CO2) is one of the most commonly highlighted greenhouse gasses. Global climate change and the increase in the trend of CO2 emissions are a growing concern today [2]. Pakistan is confronting this powerful danger to social, environmental, and economic development [3]. The impacts of climate change can be categorized into extreme and non-extreme types [4,5]. The World Bank [6] recognizes five foremost factors through which climate change will affect agricultural production: change in precipitation pattern and temperature, climatic variability, CO2 fertilization and surface water runoff. Reilly et al. [7] found that higher rainfall results in reduction of yield. Variations in climate cause many people to move into poverty and food insecurity [8]. In Pakistan, the general origin of air pollution is customarily untidy industrial buildings of brick formation, present in the peri-metropolitan and rural regions [9]. Inferior quality fuels, including corncobs, rubber tires, rice straw, bagasse, rice husk, coal, oil and wood, used in these brick kilns produce fly ash particles that deposit on nearby plants affecting their photosynthetic potential [6]. Brick kilns release over 1072 million tons of CO2 emissions into the atmosphere per year, making 2.7% of total emissions. Most of the brick kilns in the rural areas in Pakistan use conventional technology that is very dangerous from an environmental aspect. According to the Punjab Disaster Management Authority (PDMA), 37.4% of brick kilns have moved to zig-zag technology in Punjab alone [1]. All the types of fuel utilized in this type of kiln cause a high concentration of pollutants in gaseous form in the air, with destructive effects on the atmosphere, plants and people [10,11]. Islam et al. [12] estimated that the soil close to the brick kiln was reduced in quantity when compared with the same soil further from brick kiln, showing a variation in agricultural production. The mean values of total nitrogen, available phosphorus and sulfur were significantly less in the soil samples close to the brick kiln (0.05%, 12.4, and 8.36 ppm, respectively) than those in the soil further from the brick kiln (0.06%, 24.6, and 11.7 ppm, respectively).
Agriculture is a key economic sector that contributes 21% to the gross domestic product (GDP), employs 45% of the total workforce and contributes about 60% to exports [13]. Changing climatic variables, particularly temperature and rainfall, will introduce several challenges to agriculture in the future. Changes in the frequency and intensity of droughts, flooding, and storm damage are anticipated [13]. Agroforestry could provide adaptation to this climate change [14] by protecting crops from temperature elevation. On the other hand, this causes a decrease in soil evaporation, wind seeds, and transpiration of crops. The carbon (C) sequestration above ground could easily be increased by planting trees and this also increases carbon in the soil on the land where crops are cultivated [15,16]. The general sequestration of carbon due to such actions has been assumed to be 9, 21, 50, and 63 Mg C ha−1 in temperate, sub-humid, semiarid, and humid regions, respectively [17]. The planting of trees together with crops has many advantages, involving higher soil richness, limitation of soil erosion, lower water logging, decreased fermentation and eutrophication of streams and rivers, enhancement of local biodiversity, and reduction of pressure on common forests for fuel [18,19,20]. At a global scale, unproductive croplands of about 630 million ha could be used for agroforestry as part of an ecological engineering tool to potentially sequester 586,000 Mg C year−1 by 2040. Moreover, in present national and global monitoring protocols for carbon, there is a need to include agroforestry in C stocks to estimate the share of this abandoned pool in a precise way. Agroforestry systems are considered as a carbon sink to sequester CO2, so there is a need to evaluate the carbon sequestration potential of agroforestry systems in order to decrease emissions near brick kilns on irrigated land. The main objectives of the current investigation were (1) to assess and quantify the potential of agroforestry systems in C stock at various distances from brick kilns in an irrigated agro-ecosystem, (2) to discover differences between agroforestry systems and the carbon capturing capacity of crops, trees and soil organic carbon (SOC).
2. Materials and Methods
2.1. Study Locations and Sampling Methodology
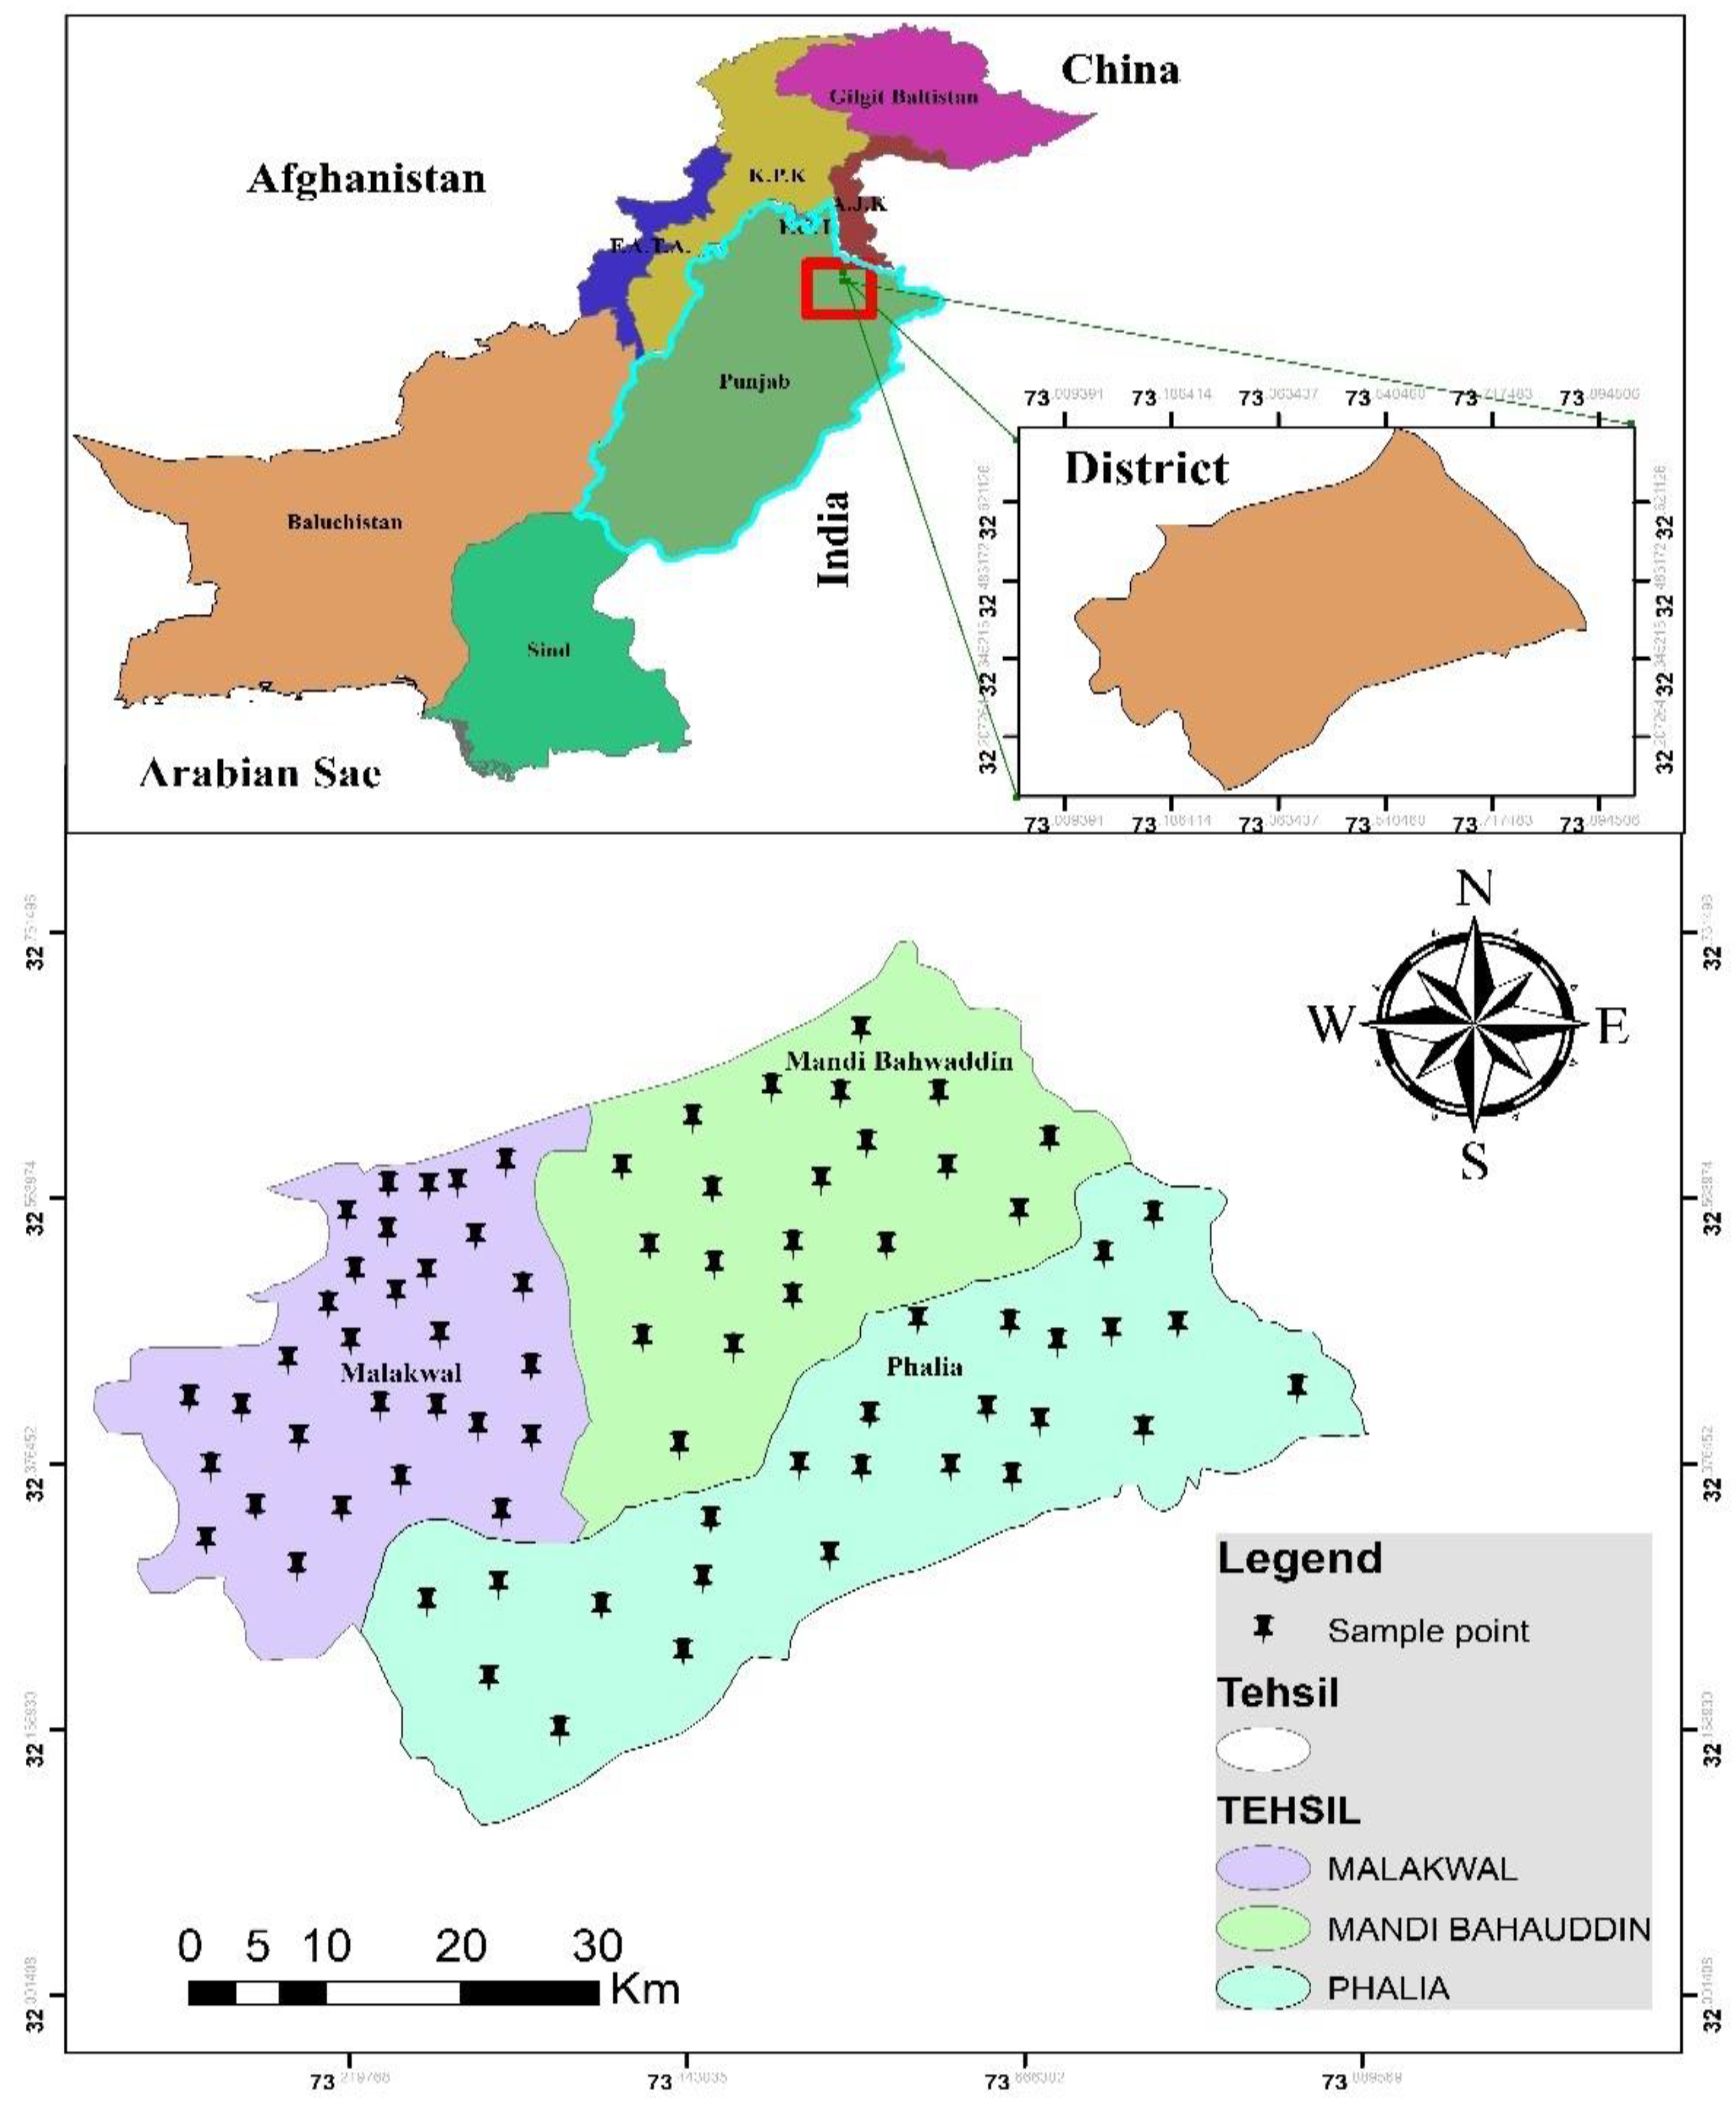
The present study was conducted in the Mandi-Bahauddin district, central Punjab, Pakistan (Figure 1). According to the population survey in 2017, Mandi-Bahauddin is the 41st city by population. This city is located between the river Chenab (39 km in south) and the river Jhelum (12 km in north). It lies between 30°8′ to 32°40′ north latitude, and 73°36′ to 73°37′ east longitude. It has a total area of 2673 km2. Major rivers are River Jhelum, with Rasool Barrage & Chenab and the Qadirabad Barrage. According to the Pakistan Bureau of Statistics (2019), the total population of Mandi-Bahuddin is 198,609 with a population density of 30 km2. The annual change in population is 1.68%. The elevation of this district is 220 m above the sea level. The weather conditions experience a maximum average temperature of 45 °C and minimum average temperature of 3 °C, with average rainfall of 388 mm and wind direction mostly from north to east (Pakistan meteorological department, PMD). According to the US Department of Agriculture classification system, the soil type of the study area falls in the category of loam to clay loam soil with organic matter ranging from 0.50–1.01%. Most farmers in these areas use conventional practices (chemical fertilizer) for crop production instead of using organic methods for crop production to improve soil health. According to the agricultural department, the main crops in study area are wheat, rice and sugarcane and the total cultivated area is 214,348.83 ha. Maize and pulses are also grown in smaller areas.

Figure 1.
Map of the study area and sampling points.
2.2. Above and Below Ground Trees’ Biomass Carbon Estimation
Field visits were carried out from November 2020 to May 2021 at regular intervals for the collection of data in 3 selected Tehsils, i.e., Mandi-Bahauddin, Phalia, Malakwal. A total of 75 quadrate plots of 0.405 ha = 1 acre each with agroforestry practices were selected and a tree inventory such as diameter at breast height in cm (DBH) and height (m) was taken for each plot (Table 1). By adopting a lottery method of random sampling, the sample collection sites were selected on the basis of brick kiln location at 0, 5 and 10 km distance. Mean values of tree height and diameter at breast height of potential tree species at various distances from the brick kilns are depicted in Table 2.

Table 1.
Number of plots measured from selected Tehsils in Mandi-Bahauddin sampling.
Table 2.
Diameter at Breast Height (DBH) and Height of Potential Tree Species at Various Distance from Brick Kilns in the Agroforestry System of Mandi-Bahauddin district (Mean Values).
Acacia nilotica [Fabaceae], Delbergia sisso [Fabaceae], Melia azedarach [Meliaceae], Citrus reticulate [Rutaceae], Popolus ciliate [Salicaceae], Eucalyptus camaldulensis [Myrtaceae], Melia azedarach [Meliaceae], Populus deltoides [Salicaceae], Syzygium cumini [Myrtaceae], Ziziphus mauritiana [Rhamnaceae], Azadirachtta indica [Meliaceae], Morus alba [Moraceae] and Bambusa vulgaris [Poaceae] were the most commonly planted tree species in and along the farm fields in all three tehsils.
2.3. Total Carbon Stock Estimate
Allometric equations from the literature were used for the estimation of tree biomass and where appropriate corrected for log bias (Table 3). In case of non-availability of allometric equations, 26% of the above ground biomass was assumed as below ground biomass [21,22,23]. Next, biomass of individual trees was scaled to biomass/plot, biomass/hectare, and carbon stock/hectare. Contents of carbon were measured from biomass by presumption that the dry mass contains 48.1% of carbon [21,24]. The total tehsil tree carbon was estimated by multiplying carbon amount per hectare from sampled plots by the total area of the tehsil.
Table 3.
Allometric equations for the calculation of above and below ground biomass.
2.4. Soil Sampling Collection
From 0, 5 and 10 km away from the brick kilns, soil was sampled in a random subset of plots to represent the major tree and crop combinations. Soil samples (n = 420) were collected at a depth of 0–30 cm near the base of a randomly selected tree, from the four cardinal directions. Samples were stored in polythene bags and analyzed at the Soil and Water Testing Laboratory for Research, Bahawalpur. A 100 cm3 stainless-steel cylinder was used to measure soil bulk density. After being air-dried and passed through a 2 mm sieve, organic carbon was measured using the Walkley–Black method [33]. To calculate the soil carbon per hectare, the values of bulk density, soil depth, and percentage of organic carbon were then multiplied [34].
2.5. Crop Carbon Stock Determination
Wheat and rice plants were manually harvested to the required depth, sun dried and then weighed with a spring balance to measure above and below ground biomass per plot, converted into Mg ha−1. From each plot at different locations, a different number of tillers of wheat and rice crops were selected randomly from an area of 1 m2. Above ground and below ground C stock in wheat and rice samples was determined by multiplying the respective above ground and below ground biomass with carbon conversion factor of 0.45, as explained by Prommer et al. [35]. Next, biomass of individual crop was scaled to biomass/hectare, carbon stock/hectare, and finally on a tehsil basis.
2.6. Data Analysis
Collected data was analyzed using “Statistix 8.1” and “Statistix 10” statistical packages. Data regarding analytical analysis of AGB, BGB and SOC were analyzed using descriptive statistics. Graphical work was performed using Microsoft Office software (Version, 2016; Microsoft Corporation, Albuquerque, NM, USA).
3. Results
3.1. Tree Abundance and Distribution
Variations in trees’ abundance and distribution were observed in the Mandi-Bahauddin district. All the tehsils showed variations in trees’ abundance; the maximum percentage of trees species was shown in Mandi-Bahauddin (48%), followed by Malakwal (34%) and Phalia (18%) (Figure 2A). All the values regarding the tree’s distribution in Mandi-Bahauddin varied based on brick kiln distance. Mandi-Bahauddin showed variations in tree distribution, with maximum percentage (15%) noticed for E. camaldulensis (15%) and V. nilotica (15%) followed by C. sinensis (14%), M. azadarach (14%), D. sisso (12%) and P. ciliate (10%), while the lowest tree distribution was recorded in S. cumin (3%), Z. manritiana (3%) and B. vulgaris (2%) (Figure 2B). Phalia showed variations in tree distribution, the maximum percentage of tree species being E. camaldulensis (19%) and V. nilotica (17%) followed by C. sinensis (14%), M. azadarach (12%), D. sisso (10%) and P. ciliate (10%), while the lowest tree distribution was noticed in A. indica (6%), S. cumin (2%), Z. manritiana (2%) and B. vulgaris (2%) (Figure 2C). Malakwal showed variations in tree distribution, the maximum percentage of trees being V. nilotica (15%) and E. camaldulensis (14%), followed by C. sinensis (13%), M. azadarach (13%), D. sisso (10%) and P. ciliate (10%), while the lowest tree distribution was found in A. indica (6%), S. cumin (5%), Z. manritiana (3%) and B. vulgaris (3%) (Figure 2D).
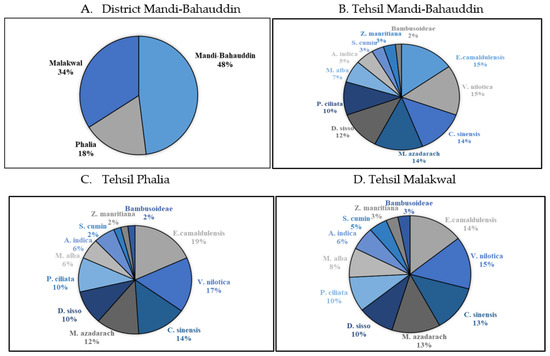
Figure 2.
Tree species abundance in Mandi-Bahauddin district (A) and tree species distribution expressed as a percentage of total basal area for agroforestry plots in tehsils Mandi-Bahauddin (B), Phalia (C) and Malakwal (D) in Punjab, Pakistan.
3.2. Carbon Stock of Trees
The above ground and below ground carbon stock and total carbon stock potential of trees in Mandi-Bahauddin district were different, which describes the variations in carbon stock capacity of potential species of all three tehsils of the district (Table 4). Maximum C stock was recorded in E. camaldulensis (3951 Mg C ha−1), followed by S. cumin (282 Mg C ha−1), P. ciliate (75.9 t/ha), and minimum C stock was observed in C. sinensis (17.3 Mg C ha−1) in Mandi-Bahauddin. In Phalia, maximum C stock was shown in A. nilotica (18.5 Mg C ha−1), followed by S. cumin (16.8 Mg C ha−1) and B. vulgaris (2.5 Mg C ha−1) and minimum C stock was observed in M. alba (0.02 Mg C ha−1). Maximum C stock was shown in P. ciliata (44.5 Mg C ha−1), followed by A. nilotica (21.2 Mg C ha−1), E. camaldulensis (20.9 Mg C ha−1), and minimum C stock was observed in M. azadarach (0.05 Mg C ha−1) in Malakwal. Maximum C stock was shown in the trees of Mandi-Bahauddin followed by Malakwal, and minimum C stock was shown in Phalia. The descending order in terms of carbon sequestration potential of trees in Mandi-Bahauddin was S. cumin > E. camaldulensis > P. ciliate > B. vulgaris > A. nilotica > Z. manritiana > M. azadarach > A. Indica > D. sisso > M. alba > C. sinensis. The descending order in terms of carbon sequestration potential of trees in Tehsil Phalia was E. camaldulensis > A. nilotica > D. sisso > Z. manritiana > A. Indica > P. ciliate > S. cumin > M. alba > M. azadarach > C. sinensis > B. vulgaris. The decreasing order in terms of carbon stock potential of trees in Malakwal was E. camaldulensis > P. ciliate > C. sinensis > A. nilotica > Z. manritiana > A. Indica > S. cumin > B. vulgaris > D. sisso > M. alba > M. azedarach (Table 4).
Table 4.
Summary of above ground carbon, below ground carbon and total carbon (Mg C ha−1) of selected species at various points from the brick kilns.
3.3. Total Tree Carbon Stock in Mandi-Bahauddin District
All the values regarding total tree carbon stock were different at various distances from the brick kilns in an agroforestry system in various tehsils of Mandi-Bahauddin district (Table 5). Maximum tree carbon stock (133 Mg C ha−1) was noticed in Mandi-Bahauddin followed by Malakwal (62.6 Mg C ha−1), while the minimum was recorded in Phalia (9.97 Mg C ha−1) in (Table 5).
Table 5.
Total Tree Carbon stock.
3.4. Total Soil Organic Carbon Stock
Notable variations were observed for soil organic carbon at various distances from the brick kilns in the agroforestry system of various tehsils in Mandi-Bahauddin district (Table 6). Maximum total organic carbon of soil was noticed in Malakwal 10 km away from the brick kilns compared with control (near brick kilns). The highest stock of C in soil (15.30 Mg C ha−1) in Mandi-Bahauddin was noticed near the brick kiln, and minimum stock of soil C (9.06 Mg C ha−1) was measured 5 km away from the brick kiln, and an average organic C stock of (11.6 Mg C ha−1) was noticed. In Phalia maximum measured soil C stock (13.58 Mg C ha−1) was shown near the brick kiln and minimum soil C stock (11.6 Mg C ha−1) was shown 5 km away from the brick kiln, and average organic carbon of (12.5 Mg C ha−1) was noticed. In Malakwal, maximum soil C stock (15.3 Mg C ha−1) was measured 10 km from the brick kiln and minimum soil C stock (3.12 Mg C ha−1) was shown 5 km away, with an average organic C stock of (10.3 Mg C ha−1) (Table 6).
Table 6.
Average Soil Organic Carbon Stock.
3.5. Total Organic Carbon Stock in Potential Crops
All the values regarding the carbon stock in Triticum aestivum and Oryza sativa at various distances were different in the agroforestry system of cultivated area for various tehsils of Mandi-Bahauddin district (Table 7). Maximum carbon stock was recorded in Triticum aestivum in Tehsil Mandi-Bahauddin (2.08 × 10⁶ Mg C) followed by Malakwal (1.85 × 10⁶ Mg C). Minimum carbon stock was noticed in wheat crop in Phalia (1.83 × 10⁶ Mg C). For rice crop, maximum carbon stock was noticed in Mandi-Bahauddin (1.97 × 10⁶ Mg C), followed by Phalia (1.83 × 10⁶ Mg C), while minimum carbon stock in rice was recorded in Tehsil Malakwal (1.48 × 10⁶ Mg C) (Table 8).
Table 7.
Measured Carbon stock in Triticum aestivum.
Table 8.
Measured Carbon stock in Oryza sativa.
4. Discussion
This study provides the estimation of potential C pools for agroforestry systems in relation to brick kilns in Mandi-Bahauddin district, Pakistan. The agroforestry systems observed in the research site are crucial for the livelihoods of local farmers, as they have both commercial and subsistence production values [36,37]. In addition to timber from tree species, field crops such as wheat also have good market prospects at local and international level, as these are widely used for consumption [38,39]. Although not intrinsically C dense compared to systems such as forests or intensively managed agroforestry systems and pastures, C storage in agricultural farms can be increased by 20.4 to 21.4 t C ha−1 globally [40,41] through the incorporation of long-living, deep-rooted trees [42,43]. While climatic attributes are consistent across the district where sampling was performed, the amount of C sequestered varied, largely depending on the tree species’ distribution, density of tree species, basal area of tree, age of tree, area under crops and distance of agroforestry system from the brick kiln, emphasizing the importance of management decisions in determining carbon stocks. For example, district total mean tree carbon stock was the lowest (9.97 Mg ha−1) in Phalia, 5 km away from the brick kiln and the highest (133 Mg ha−1) in Mandi-Bahauddin, 10 km away from the brick kiln, among all tehsils in the study area. This appears to be related primarily to the level of tree stocking in the district, with Mandi-Bahauddin having the highest average basal area of all tehsils (8.9 m2 ha−1), and Malakwal having the lowest tree basal area (3.2 m2 ha−1). The current study revealed that maximum carbon sequestration was noticed in E. camaldulensis while the minimum was observed in M. alba. Among various tree species, the difference in biomass might be due to numerous aspects, i.e., number of trees/ha, tree age, quality and location of site, cultural practices, techniques and system of planting and ecological conditions in that area [21,22,23,24]. The average stored C stock of agroforestry systems in our study area was 11.46 Mg C ha−1 in soil, 68.5 Mg C ha−1 in trees, 60.4 Mg C ha−1 in wheat and 54.2 Mg C ha−1 in rice. The carbon stocks of simple systems (i.e., combination of single trees with cash crop or grass) and mixed-tree systems are similar to C stock on agroforestry systems reported by other studies in Indonesia [44,45]. Tree biomass accumulation representing the value of tree basal area has a correlation with C stock value [46]. The tree species having a higher basal area have the capacity for higher biomass accumulation which results in higher C stocks [47]. Our findings reflect that the plots near the brick kilns showed more growth of trees and potential crops (wheat and rice) in the study area, due to shifting of brick kilns to zig-zag technology that reduced dust emission. Similar patterns were reported in other studies [21,36,37,48,49].
In a terrestrial ecosystem, soil is a very notable system for CO2 mitigation. Many agroecologists have revealed that the soil carbon pool has prime importance in agroforestry systems [50,51]. The outcomes of the current investigation regarding SOC supports the hypothesis that SOC contents are maximum at 0–15 cm layers, with increased higher buildup of tree litter [52]. Higher soil carbon contents in agroforestry systems largely depend on the quality and amount of biomass input by non-tree and tree components of the system [53,54]. Moreover, vegetation detritus and litter from pruning under proper agroforestry management return a greater amount of organic carbon to the soil [55,56] (Figure 3). In this study, the average SC pools ranged from 10.3 to 15.3 Mg C ha−1 10 km away from the brick kilns. Kimaro et al. [57] reported that a significant variation was noticed in carbon sequestered by an agroforestry system with legume trees, compared with a mono-crop system. Carbon storage in plants can be high in complex agroforestry systems and productivity of field crops depends on several factors such as age, structure and the way the systems are managed [58,59]. The results are comparable with the findings of other studies [42,60,61,62], which reported that agroforestry can store carbon in the range of 12–228 Mg ha−1. In our study it was noticed that maximum tree C stock potential (133 Mg C ha−1) was observed in Mandi-Bahauddin followed by Malakwal (62.6 Mg C ha−1), 10 km away from the brick kilns, while the minimum value was observed in Phalia (9.97 Mg C ha−1), 5 km away from brick kilns. In our research, the carbon sequestration potential of an agroforestry system (soil, trees and crops) showed differential response in relation to brick kilns (5 and 10 km away from brick kilns). Similar observations were reported by Gera et al. [63] who claimed that the variations in the carbon sequestration potential relate to the mean annual increment, which varies with site, age, density and plantation, as well as with the quality of planting stock.
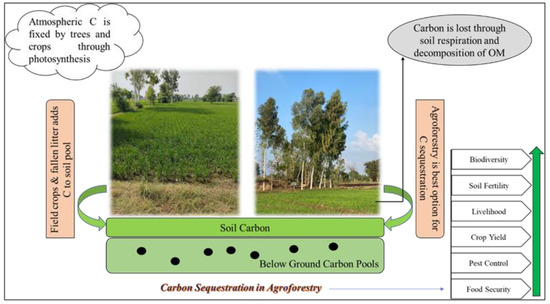
Figure 3.
Schemes of carbon sequestration in agroforestry.
Various factors such as species, land use type, cultural practices and CO2 supply play important roles in C stock and C sequestration rate [64]. Most farmers planted trees on their farmland for a short rotation. After regular intervals, harvesting of cultivated trees results in loss of C, but C is again stored when the harvested wood is converted into plywood, packaging materials, poles and the manufacturing of furniture [65]. Moreover, more accumulation of biomass was observed at the early stages and this decreased with the passage of time and age [66]. Tree stem sequesters the carbon for a longer time after felling as compared to the carbon stored in leaves and branch biomass [59]. These results highlight both the current and potential carbon sequestration potential of agroforestry in Pakistan, and can be further used in devising strategies for implementing tree planting programs on agricultural land and designing future carbon sequestration projects in Pakistan.
5. Conclusions
For the development of better management strategies, understanding of the influence of potential trees on farmlands in linear plantations is critical. Our intensive sampling in three tehsils showed that agroforestry systems in Punjab, Pakistan, currently store moderate amounts of carbon in plants and soil. In the agroforestry system, the increased soil organic carbon was due to litter fall and gave higher monetary returns in terms of more C stock 5 and 10 km away from the brick kilns. The decreasing order in terms of C stock potential of crops was wheat > rice. Variation was observed for C stock in crops (wheat and rice) at various distances from the brick kiln at the sampling sites. More C stock in the crops was noticed in Mandi-Bahauddin due to the maximum cultivated area, followed by Phalia and Malakwal. Crops had the maximum potential to store carbon dioxide at different sampling points, compared to trees and soil. The descending order in terms of C stock potential of agroforestry was crops > trees > soil. The findings of this study suggest that planting of tree species along with farm crops is a sustainable way to mitigate climate change by sequestering large amounts of carbon from the atmosphere. However, future studies should be conducted to highlight more indicators associated with the operation of the brick kilns. Given appropriate incentives, Punjab’s farmers could help Pakistan meet its commitments to the Paris Climate Accord through reasonable changes in tree planting on existing agroforestry systems.
Author Contributions
Conceptualization, Q.u.Z., G.Y. and Y.C.; methodology, N.K., I.T. and S.N.; software, G.Y.; formal analysis, N.K.; investigation, Q.u.Z.; resources, N.K.; data curation, K.A.; writing—original draft preparation, N.K., M.A., M.W. and A.B.; writing—review and editing, Q.u.Z. and Y.C.; supervision, Q.u.Z.; project administration, Q.u.Z. and I.T. All authors have read and agreed to the published version of the manuscript.
Funding
This research received no external funding.
Institutional Review Board Statement
Not applicable.
Informed Consent Statement
Not applicable.
Data Availability Statement
Not Applicable.
Acknowledgments
We are thankful to Umair Riaz (Scientific Officer), Soil and Water Testing Laboratory for Research Bahawalpur, Punjab Government, Pakistan for providing the research facilities for soil analysis.
Conflicts of Interest
The authors declare no conflict of interest.
References
- Eckstein, D.; Künzel, V.; Schäfer, L. Global Climate Risk Index 2021. Who Suffers Most from Extreme Weather Events 2021, 2000–2019. Available online: https://www.germanwatch.org/en/19777 (accessed on 25 January 2021).
- Mondal, M.; Goswami, S.; Ghosh, A.; Oinam, G.; Tiwari, O.N.; Das, P.; Halder, G.N. Production of biodiesel from microalgae through biological carbon capture: A review. 3 Biotech 2017, 7, 99. [Google Scholar] [CrossRef] [Green Version]
- Khan, M.A.; Khan, J.A.; Ali, Z.; Ahmad, I.; Ahmad, M.N. The challenge of climate change and policy response in Pakistan. Environ. Earth Sci. 2016, 75, 412. [Google Scholar] [CrossRef]
- Davenport, F.V.; Diffenbaugh, N.S. Using machine learning to analyze physical causes of climate change: A case study of US Midwest extreme precipitation. Geophys. Res. Lett. 2021, 48, e2021GL093787. [Google Scholar] [CrossRef]
- Dalby, S. Global climate change and security threats. In Handbook of Security and the Environment; Edward Elgar Publishing: Washington, DC, USA, 2021. [Google Scholar]
- World Bank. World Development Report 2008: Agriculture for Development; Herndon, V.A., Ed.; World Bank Publisher: Washington, DC, USA, 2017; pp. 20172–20960. [Google Scholar]
- Reilly, J.; Tubiello, F.; McCarl, B.; Abler, D.; Darwin, R.; Fuglie, K.; Rosenzweig, C. US agriculture and climate change: New results. Clim. Chang. 2003, 57, 43–67. [Google Scholar] [CrossRef]
- Van Ginkel, M.; Biradar, C. Drought Early Warning in Agri-Food Systems. Climate 2021, 9, 134. [Google Scholar] [CrossRef]
- Jahan, S.; Falah, S.; Ullah, H.; Ullah, A.; Rauf, N. Antioxidant enzymes status and reproductive health of adult male workers exposed to brick kiln pollutants in Pakistan. Environ. Sci. Pollut. Res. 2016, 23, 12932–12940. [Google Scholar] [CrossRef]
- Monga, V.; Singh, L.P.; Bhardwaj, A.; Singh, H. Respiratory health in brick kiln workers. Int. J. Phys. Soc. Sci. 2012, 2, 226–244. [Google Scholar]
- Raza, A.; Qamer, M.F.; Afsheen, S.; Adnan, M.; Naeem, S.; Atiq, M. Particulate matter associated lung function decline in brick kiln workers of Jalalpur Jattan, Pakistan. Pak. J. Zool. 2014, 46, 237–243. [Google Scholar]
- Islam, M.S.; Akbar, A.; Akhtar, A.; Kibria, M.M.; Bhuyan, M.S. Water quality assessment along with pollution sources of the Halda River. J. Asiat. Soc. Bangladesh Sci. 2017, 43, 61–70. [Google Scholar] [CrossRef] [Green Version]
- Ullah, S.; Ahmad, W.; Majeed, M.T.; Sohail, S. Asymmetric effects of premature deagriculturalization on economic growth and CO2 emissions: Fresh evidence from Pakistan. Environ. Sci. Pollut. Res. 2021, 28, 66772–66786. [Google Scholar] [CrossRef]
- Vignola, R.; Harvey, C.A.; Bautista-Solis, P.; Avelino, J.; Rapidel, B.; Donatti, C.; Martinez, R. Ecosystem-based adaptation for smallholder farmers: Definitions, opportunities and constraints. Agric. Ecosyst. Environ. 2015, 211, 126–132. [Google Scholar] [CrossRef] [Green Version]
- Abbas, F.; Hammad, H.M.; Fahad, S.; Cerdà, A.; Rizwan, M.; Farhad, W.; Bakhat, H.F. Agroforestry: A sustainable environmental practice for carbon sequestration under the climate change scenarios a review. Environ. Sci. Pollut. Res. 2017, 24, 11177–11191. [Google Scholar] [CrossRef]
- Arévalo-Gardini, E.; Farfán, A.; Barraza, F.; Arévalo-Hernández, C.O.; Zúñiga-Cernades, L.B.; Alegre, J.; Baligar, V.C.C. Growth, Physiological, Nutrient-Uptake- Efficiency and Shade-Tolerance Responses of Cacao Genotypes under Different Shades. Agronomy 2021, 11, 1536. [Google Scholar] [CrossRef]
- Hidayat, N.; Sianipar, J. The Potential of Agroforestry in Supporting Food Security for Peatland Community—A Case Study in the Kalampangan Village, Central Kalimantan. Ecol. Eng. 2021, 22, 123–130. [Google Scholar]
- Murthy, I.K.; Gupta, M.; Tomar, S.; Munsi, M.; Tiwari, R.; Hegde, G.T.; Ravindranath, N.H. Carbon sequestration potential of agroforestry systems in India. J. Earth Sci. Clim. Chang. 2013, 4, 1–7. [Google Scholar] [CrossRef]
- Saco, P.M.; McDonough, K.R.; Rodriguez, J.F.; Rivera-Zayas, J.; Sandi, S.G. The role of soils in the regulation of hazards and extreme events. Philos. Trans. R. Soc. Lond. B 2021, 376, 20200178. [Google Scholar] [CrossRef]
- Baig, M.B.; Burgess, P.J.; Fike, J.H. Agroforestry for healthy ecosystems: Constraints, improvement strategies and extension in Pakistan. Agrofor. Syst. 2021, 95, 995–1013. [Google Scholar] [CrossRef]
- Yasin, G.; Nawaz, M.F.; Martin, T.A.; Niazi, N.K.; Gul, S.; Yousaf, M.T.B. Evaluation of Agroforestry Carbon Storage Status and Potential in Irrigated Plains of Pakistan. Forests 2019, 10, 640. [Google Scholar] [CrossRef] [Green Version]
- Giri, K.; Pandey, R.; Jayaraj, R.S.C.; Nainamalai, R.; Ashutosh, S. Regression equations for estimating tree volume and biomass of important timber species in Meghalaya, India. Curr. Sci. 2019, 116, 75–81. [Google Scholar] [CrossRef]
- Ravindranath, N.H.; Ostwald, M. Methods for Below-Ground Biomass. In Carbon Inventory Methods: Handbook for Greenhouse Gas Inventory, Carbon Mitigation and Roundwood Production Projects; Springer Science & Business Media: Dordrecht, The Netherlands, 2008; Volume 29, pp. 149–156. [Google Scholar]
- Thomas, S.C.; Martin, A.R. Carbon content of tree tissues. A Synthesis. Forests 2012, 3, 332–352. [Google Scholar] [CrossRef] [Green Version]
- Rawat, V.R.S.; Kishwan, J. Forest conservationbased, climate changemitigation approach for India. Int. For. Rev. 2008, 10, 269–280. [Google Scholar] [CrossRef]
- Brown, S.; Gillespie, A.J.; Lugo, A.E. Biomass estimation methods for tropical forests with applications to forest inventory data. For. Sci. 1989, 35, 881–902. [Google Scholar]
- Cairns, M.A.; Brown, S.; Helmer, E.H.; Baumgardner, G.A. Root biomass allocation in the world’s upland forests. Oecologia 1997, 111, 1–11. [Google Scholar] [CrossRef]
- Hawkins, T. Biomass and Volume Tables for Eucalyptus camaldulensis, Dalbergia sissoo, Acacia auriculiformis and Cassia siamea in the Central Bhabar-Terai of Nepal; Oxford Forestry Institute, University of Oxford: Oxford, UK, 1987; p. 33. [Google Scholar]
- Roy, M.M.; Pathak, P.S.; Rai, A.K.; Kushwaha, D. Tree growth and biomass production in Melia azedarach on farm boundaries in a semi-arid region. Indian For. 2006, 132, 105–110. [Google Scholar]
- Das, D.K.; Chaturvedi, O.P. Structure and function of Populus deltoides agroforestry systems in eastern India: 1. Dry matter dynamics. Agrofor. Syst. 2005, 65, 215–221. [Google Scholar] [CrossRef]
- Rai, S.N. Above ground biomass in tropical rain forests of Western Ghats, India. Indian For. 1984, 110, 754–764. [Google Scholar]
- Singh, B.; Tripathi, K.P.; Singh, K. Community structure, diversity, biomass and net production in a rehabilitated subtropical forest in north India. Open J. For. 2011, 1, 11. [Google Scholar] [CrossRef] [Green Version]
- Walkley, A.J.; Black, I.A. An examination of the Degtjare method for determining soil organic matter and a proposed modification of the chromic acid titration method. Soil Sci. 1934, 37, 29–38. [Google Scholar] [CrossRef]
- De Joa Carlos, M.S.; Carlos, C.C.; Warren, A.D.; Lal, R.; Filho, S.P.V.; Piccolo, M.C.; Feigl, B.E. Organic matter dynamics and carbon sequestration rates for a tillage chrono sequence in a Brazilian Oxisol. Soil Sci. Soc. Am. J. 2001, 65, 1486–1499. [Google Scholar]
- Prommer, J.; Walker, T.W.; Wanek, W.; Braun, J.; Zezula, D.; Hu, Y.; Richter, A. Increased microbial growth, biomass, and turnover drive soil organic carbon accumulation at higher plant diversity. Glob. Chang. Biol. Bioenergy 2020, 26, 669–681. [Google Scholar] [CrossRef] [Green Version]
- Siarudin, M.; Rahman, S.A.; Artati, Y.; Indrajaya, Y.; Narulita, S.; Ardha, M.J.; Larjavaara, M. Carbon Sequestration Potential of Agroforestry Systems in Degraded Landscapes in West Java, Indonesia. Forests 2021, 12, 714. [Google Scholar] [CrossRef]
- Khadka, D.; Aryal, A.; Bhatta, K.P.; Dhakal, B.P.; Baral, H. Agroforestry Systems and Their Contribution to Supplying Forest Products to Communities in the Chure Range, Central Nepal. Forests 2021, 12, 358. [Google Scholar] [CrossRef]
- Razafindratsima, O.H.; Kamoto, J.F.; Sills, E.O.; Mutta, D.N.; Song, C.; Kabwe, G.; Sunderland, T. Reviewing the evidence on the roles of forests and tree-based systems in poverty dynamics. Policy Econ. 2021, 131, 102576. [Google Scholar] [CrossRef]
- Ranjan, R. Payments for ecosystems services-based agroforestry and groundwater nitrate remediation: The case of Poplar deltoides in Uttar Pradesh, India. J. Clean. Prod. 2021, 287, 125059. [Google Scholar] [CrossRef]
- Zomer, R.J.; Neufeldt, H.; Xu, J.; Ahrends, A.; Bossio, D.; Trabucco, A.; Wang, M. Global Tree Cover and Biomass Carbon on Agricultural Land: The contribution of agroforestry to global and national carbon budgets. Sci. Rep. 2016, 6, 29987. [Google Scholar] [CrossRef] [PubMed] [Green Version]
- Grigorov, B.; Assenov, A. Tree Cover and Biomass Carbon on Agricultural Land in Mala Planina. In Smart Geography; Springer: Cham, Switzerland, 2020; pp. 265–274. [Google Scholar]
- Albrecht, A.; Kandji, S.T. Carbon sequestration in tropical agroforestry systems. Agric. Ecosyst. Environ. 2003, 99, 15–27. [Google Scholar] [CrossRef]
- Schwarz, J.; Schnabel, F.; Bauhus, J. A conceptual framework and experimental design for analysing the relationship between biodiversity and ecosystem functioning (BEF) in agroforestry systems. Basic Appl. Ecol. 2021, 56, 51–60. [Google Scholar] [CrossRef]
- Rahayu, S.; Lusiana, B.; van Noordwijk, M. Above ground carbon stock assessment for various land use systems in Nunukan, East Kalimantan. In Carbon Stock Monitoring in Nunukan, East Kalimantan: A Spatial and Modelling Approach. Report from the Carbon Monitoring Team of the Forest Resource Management for Carbon Sequestration (FORMACS) Project; Lusiana, B., van Noordwijk, M., Rahayu, S., Eds.; World Agroforestry Center: Bogor, Indonesia, 2005; pp. 21–34. [Google Scholar]
- Zhu, X.; Liu, W.; Chen, J.; Bruijnzeel, L.A.; Mao, Z.; Yang, X.; Jiang, X.J. Reductions in water, soil and nutrient losses and pesticide pollution in agroforestry practices: A review of evidence and processes. Plant Soil 2020, 453, 45–86. [Google Scholar] [CrossRef]
- Sajad, S.; Haq, S.M.; Yaqoob, U.; Calixto, E.S.; Hassan, M. Tree composition and standing biomass in forests of the northern part of Kashmir Himalaya. Vegetos 2021, 34, 1–10. [Google Scholar] [CrossRef]
- Laskar, S.Y.; Sileshi, G.W.; Nath, A.J.; Das, A.K. Allometric models for above and below-ground biomass of wild Musa stands in tropical semi evergreen forests. Glob. Ecol. Conserv. 2020, 24, e01208. [Google Scholar] [CrossRef]
- Marone, D.; Poirier, V.; Coyea, M.; Olivier, A.; Munson, A.D. Carbon storage in agroforestry systems in the semi-arid zone of Niayes, Senegal. Agrofor. Syst. 2017, 91, 941–954. [Google Scholar] [CrossRef]
- Sanogo, K.; Dayamba, D.S.; Villamor, G.B.; Bayala, J. Impacts of Climate Change on Ecosystem Services of Agroforestry Systems in the West African Sahel: A Review. Agrofor. Deg. Landsc. 2020, 4, 213–224. [Google Scholar]
- Huang, L.; Liu, J.; Shao, Q.; Xu, X. Carbon sequestration by forestation across China: Past, present and future. Renew. Sust. Energy Rev. 2012, 16, 1291–1299. [Google Scholar] [CrossRef]
- Nawaz, M.F.; Mazhar, K.; Gul, S.; Ahmad, I.; Yasin, G.; Asif, M.; Tanvir, M. Comparing the early stage carbon sequestration rates and effects on soil physicochemical properties after two years of planting agroforestry trees. J. Basic Appl. Sci. 2017, 13, 527–533. [Google Scholar]
- Kaushal, R.; Verma, K.S.; Chaturvedi, O.P.; Alam, N.M. Leaf litter decomposition and nutrient dynamics in four important multiple tree species. Range Manag. Agrofor. 2012, 33, 20–27. [Google Scholar]
- Sarto, M.V.; Borges, W.L.; Sarto, J.R.; Rice, C.W.; Rosolem, C.A. Deep soil carbon stock, origin, and root interaction in a tropical integrated crop–livestock system. Agrofor. Syst. 2020, 94, 1865–1877. [Google Scholar] [CrossRef]
- Hairiah, K.; van Noordwijk, M.; Sari, R.R.; Saputra, D.D.; Suprayogo, D.; Kurniawan, S.; Gusli, S. Soil carbon stocks in Indonesian (agro) forest transitions: Compaction conceals lower carbon concentrations in standard accounting. Agric. Ecosyst. Environ. 2020, 294, 106879. [Google Scholar] [CrossRef]
- Ma Howald, N.M.; Randerson, J.T.; Lindsay, K.; Munoz, E.; Doney, S.C.; Lawrence, P.; Hoffman, F.M. Interactions between land use change and carbon cycle feedbacks. Glob. Biogeochem. Cycles 2017, 31, 96–113. [Google Scholar] [CrossRef]
- Hübner, R.; Kühnel, A.; Lu, J.; Dettmann, H.; Wang, W.; Wiesmeier, M. Soil carbon sequestration by agroforestry systems in China: A meta-analysis. Agric. Ecosyst. Environ. 2021, 315, 107437. [Google Scholar] [CrossRef]
- Kimaro, A.A.; Isaac, M.E.; Chamsharma, S.A.O. Carbon pools in tree biomass and soils under rotational woodlot systems in eastern Tanzania. In Carbon Sequestration Potential of Agroforestry Systems: Opportunities and Challenges; Kumar, B.M., Nair, P.K.R., Eds.; Springer Science + Business Media: Dordrecht, The Netherlands, 2010; Volume 8, pp. 129–144. [Google Scholar]
- Oelbermann, M.; Voroney, R.P.; Gordon, A.M. Carbon sequestration in tropical and temperate agroforestry systems: A review with examples from Costa Rica and Southern Canada. Agric. Ecosyst. Environ. 2004, 104, 359–377. [Google Scholar] [CrossRef]
- Swamy, S.L.; Puri, S. Biomass production and C-sequestration of Gmelina arborea in plantation and agroforestry system in India. Agrofor. Syst. 2005, 64, 181–195. [Google Scholar] [CrossRef]
- Rizvi, R.H.; Dhyani, S.K.; Yadav, R.S.; Singh, R. Biomass production and carbon stock of popular agroforestry systems in Yamunanagar and Saharanpur districts of northwestern India. Curr. Sci. 2011, 100, 736–742. [Google Scholar]
- Wani, N.; Velmurugan, A.; Dadhwal, V.K. Assessment of agricultural crop and soil carbon pools in Madhya Pradesh, India. Trop. Ecol. 2010, 51, 11–19. [Google Scholar]
- Yadav, R.P.; Bisht, J.K. Agroforestry: A way to conserve MPTs in North Western Himalaya. Res. J. Agric. For. Sci. 2013, 1, 8–13. [Google Scholar]
- Gera, M.; Mohan, G.; Bisht, N.S.; Gera, N. Carbon sequestration potential of agroforestry under CDM in Punjab state of India. Indian J. For. 2011, 34, 1–10. [Google Scholar]
- Ramachandran Nair, P.K.; Mohan Kumar, B.; Nair, V.D. Agroforestry as a strategy for carbon sequestration. J. Plant Nutr. Soil Sci. 2009, 172, 10–23. [Google Scholar] [CrossRef]
- Arora, G.; Chaturvedi, S.; Kaushal, R.; Nain, A.; Tewari, S.; Alam, N.M.; Chaturvedi, O.P. Growth, biomass, carbon stocks, and sequestration in an age series of Populus deltoides plantations in Tarai region of central Himalaya. Turk. J. Agric. For. 2014, 38, 550–560. [Google Scholar] [CrossRef]
- Yasin, G.; Nawaz, M.F.; Siddiqui, M.T.; Niazi, N.K. Biomass, carbon stocks and CO2 sequestration in three different aged irrigated Populus deltoides bartr. Ex marsh. Bund planting agroforestry systems. Appl. Ecol. Environ. Res. 2018, 16, 6239–6252. [Google Scholar] [CrossRef]


Publisher’s Note: MDPI stays neutral with regard to jurisdictional claims in published maps and institutional affiliations. |
© 2022 by the authors. Licensee MDPI, Basel, Switzerland. This article is an open access article distributed under the terms and conditions of the Creative Commons Attribution (CC BY) license (https://creativecommons.org/licenses/by/4.0/).