
Phage Display-Derived Compounds Displace hACE2 from Its Complex with SARS-CoV-2 Spike Protein

 , , , , ,
Abstract
:
1. Introduction
2. Materials and Methods
2.1. Phage Display Selection
2.2. Enrichment ELISA
2.3. ssDNA Purification and Next Generation Sequencing (NGS) of Phage Samples
2.4. Analysis of Next Generation Obtained Sequences
2.5. CVRBDL Compounds
2.6. SARS-CoV-2 Spike Protein and hACE2 Sample Preparation
2.7. NMR Sample Preparation
2.8. NMR Spectroscopy
2.9. Surface Plasmon Resonance (SPR) Experiments
2.10. SPR Affinity Measurements
2.11. SPR Inhibition Assay
2.12. SPR Displacement Assay
3. Results
3.1. Phage Display Selection on the SARS-CoV-2 RBD Target Protein
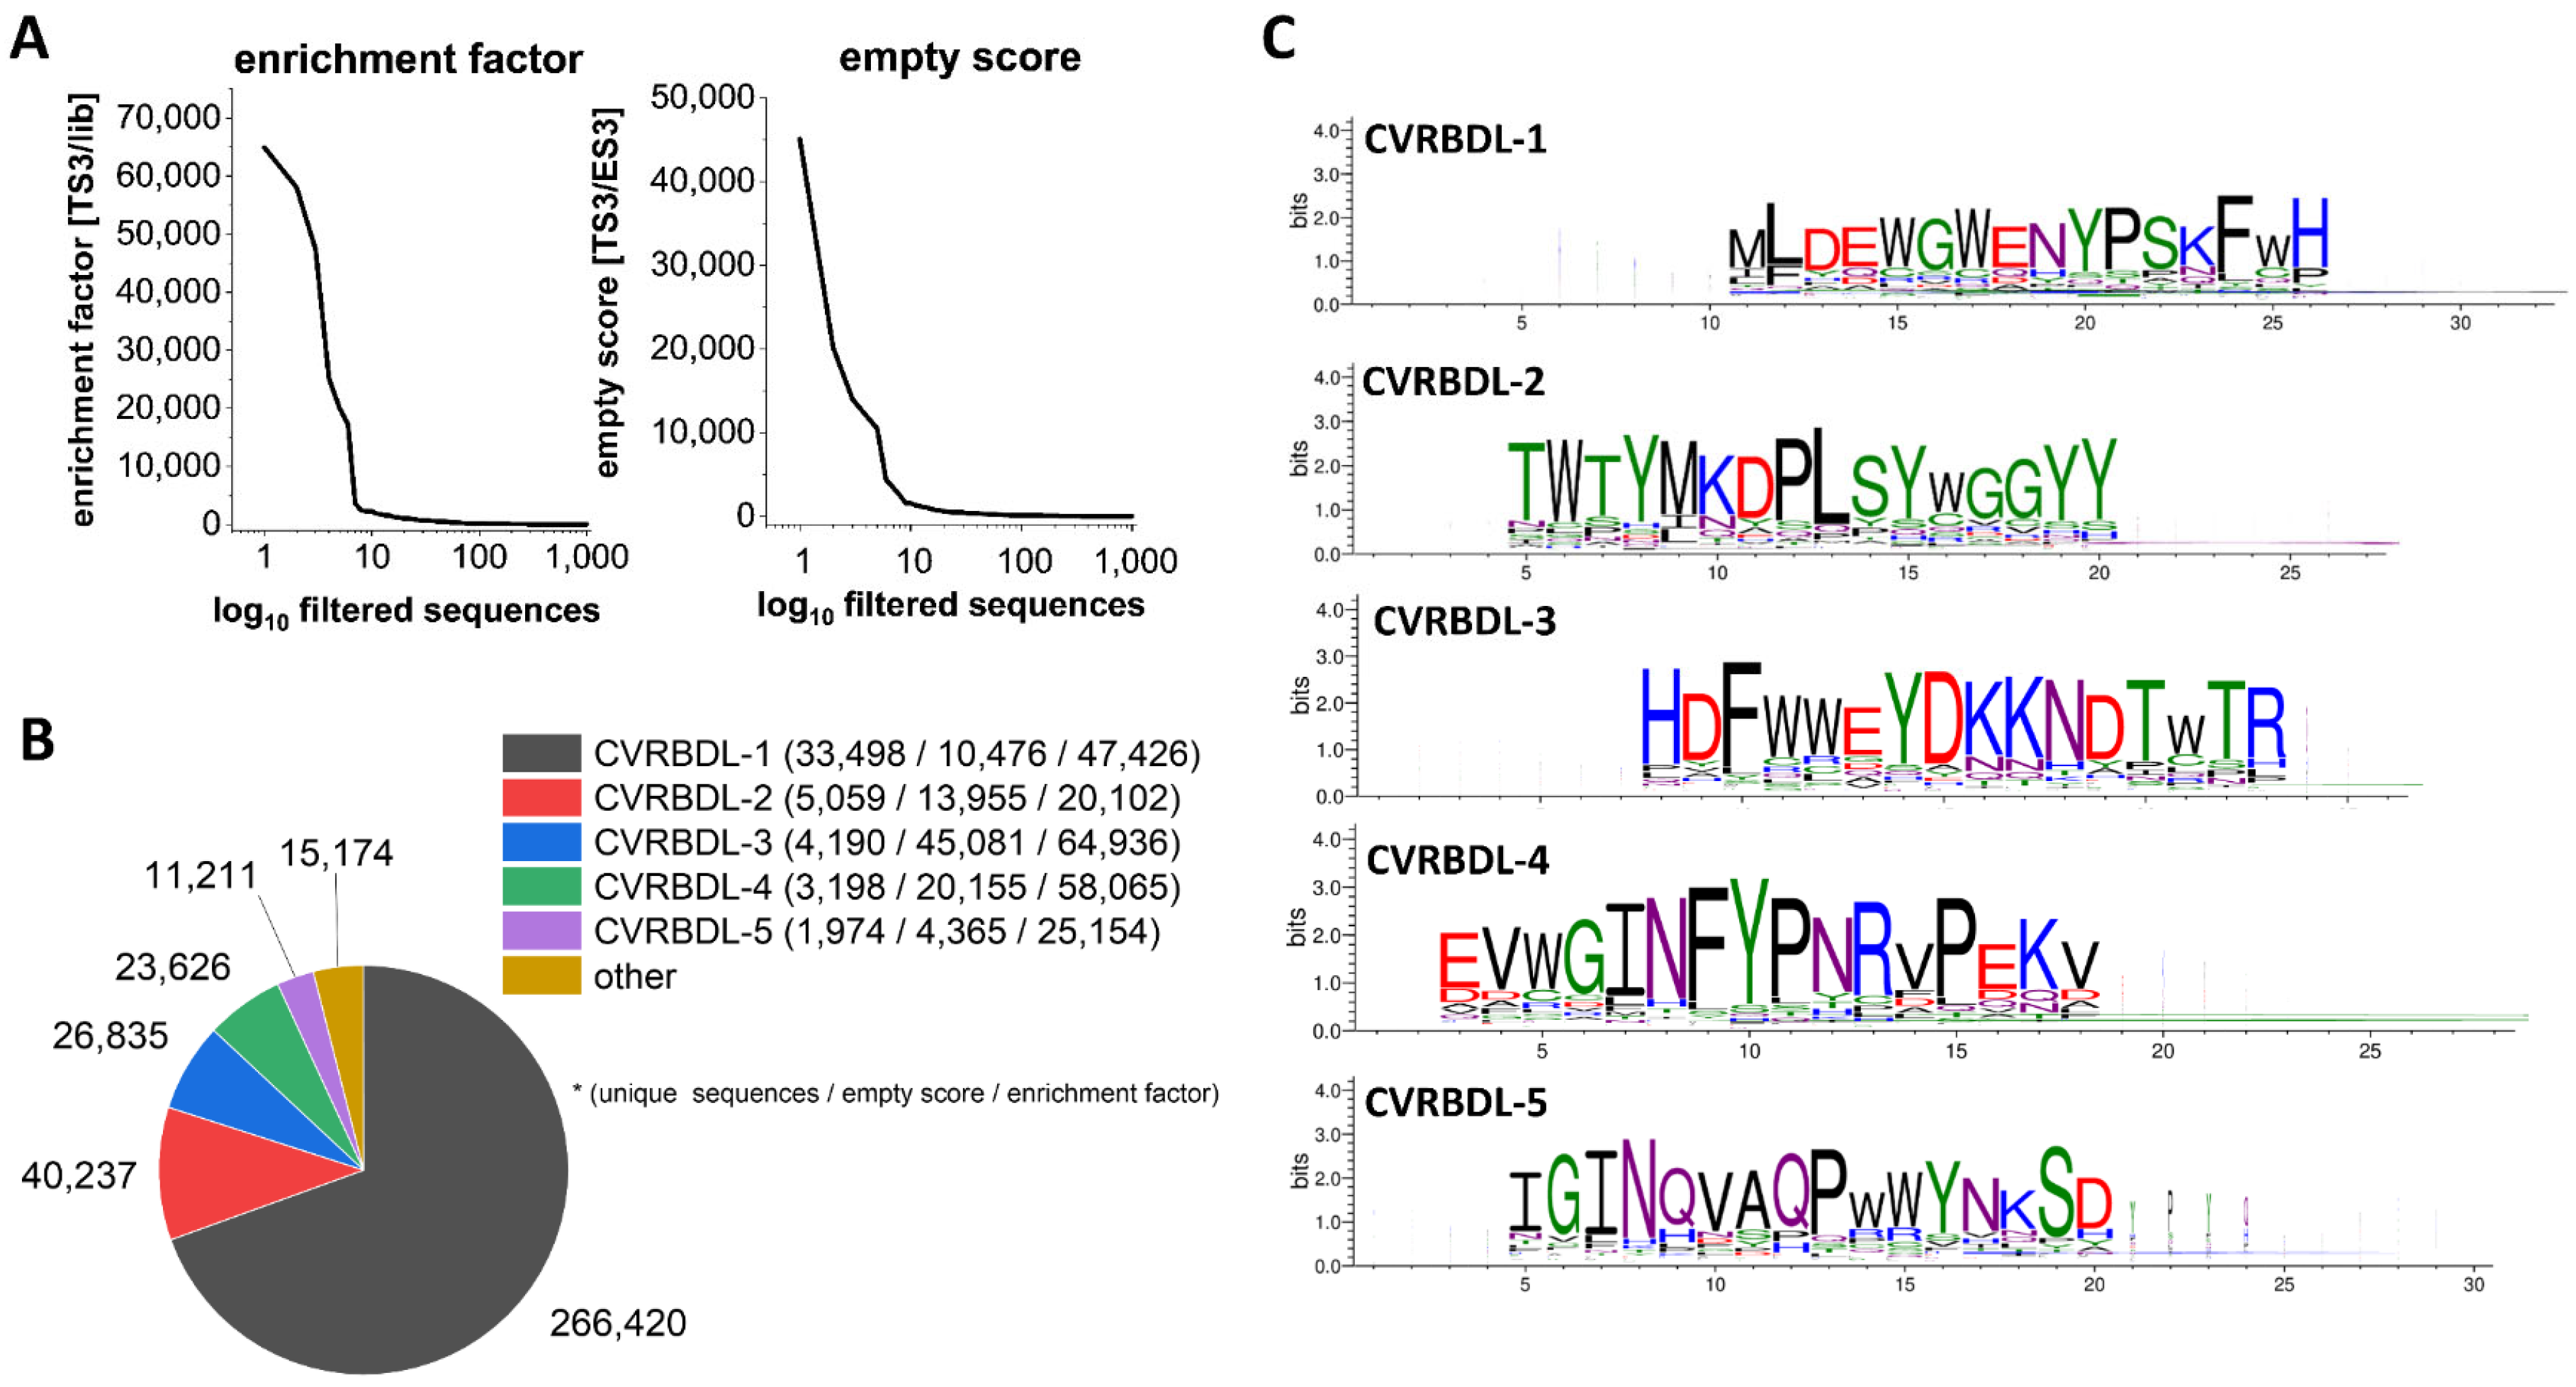
3.2. Analysis of Sequences Derived from NGS Sequencing
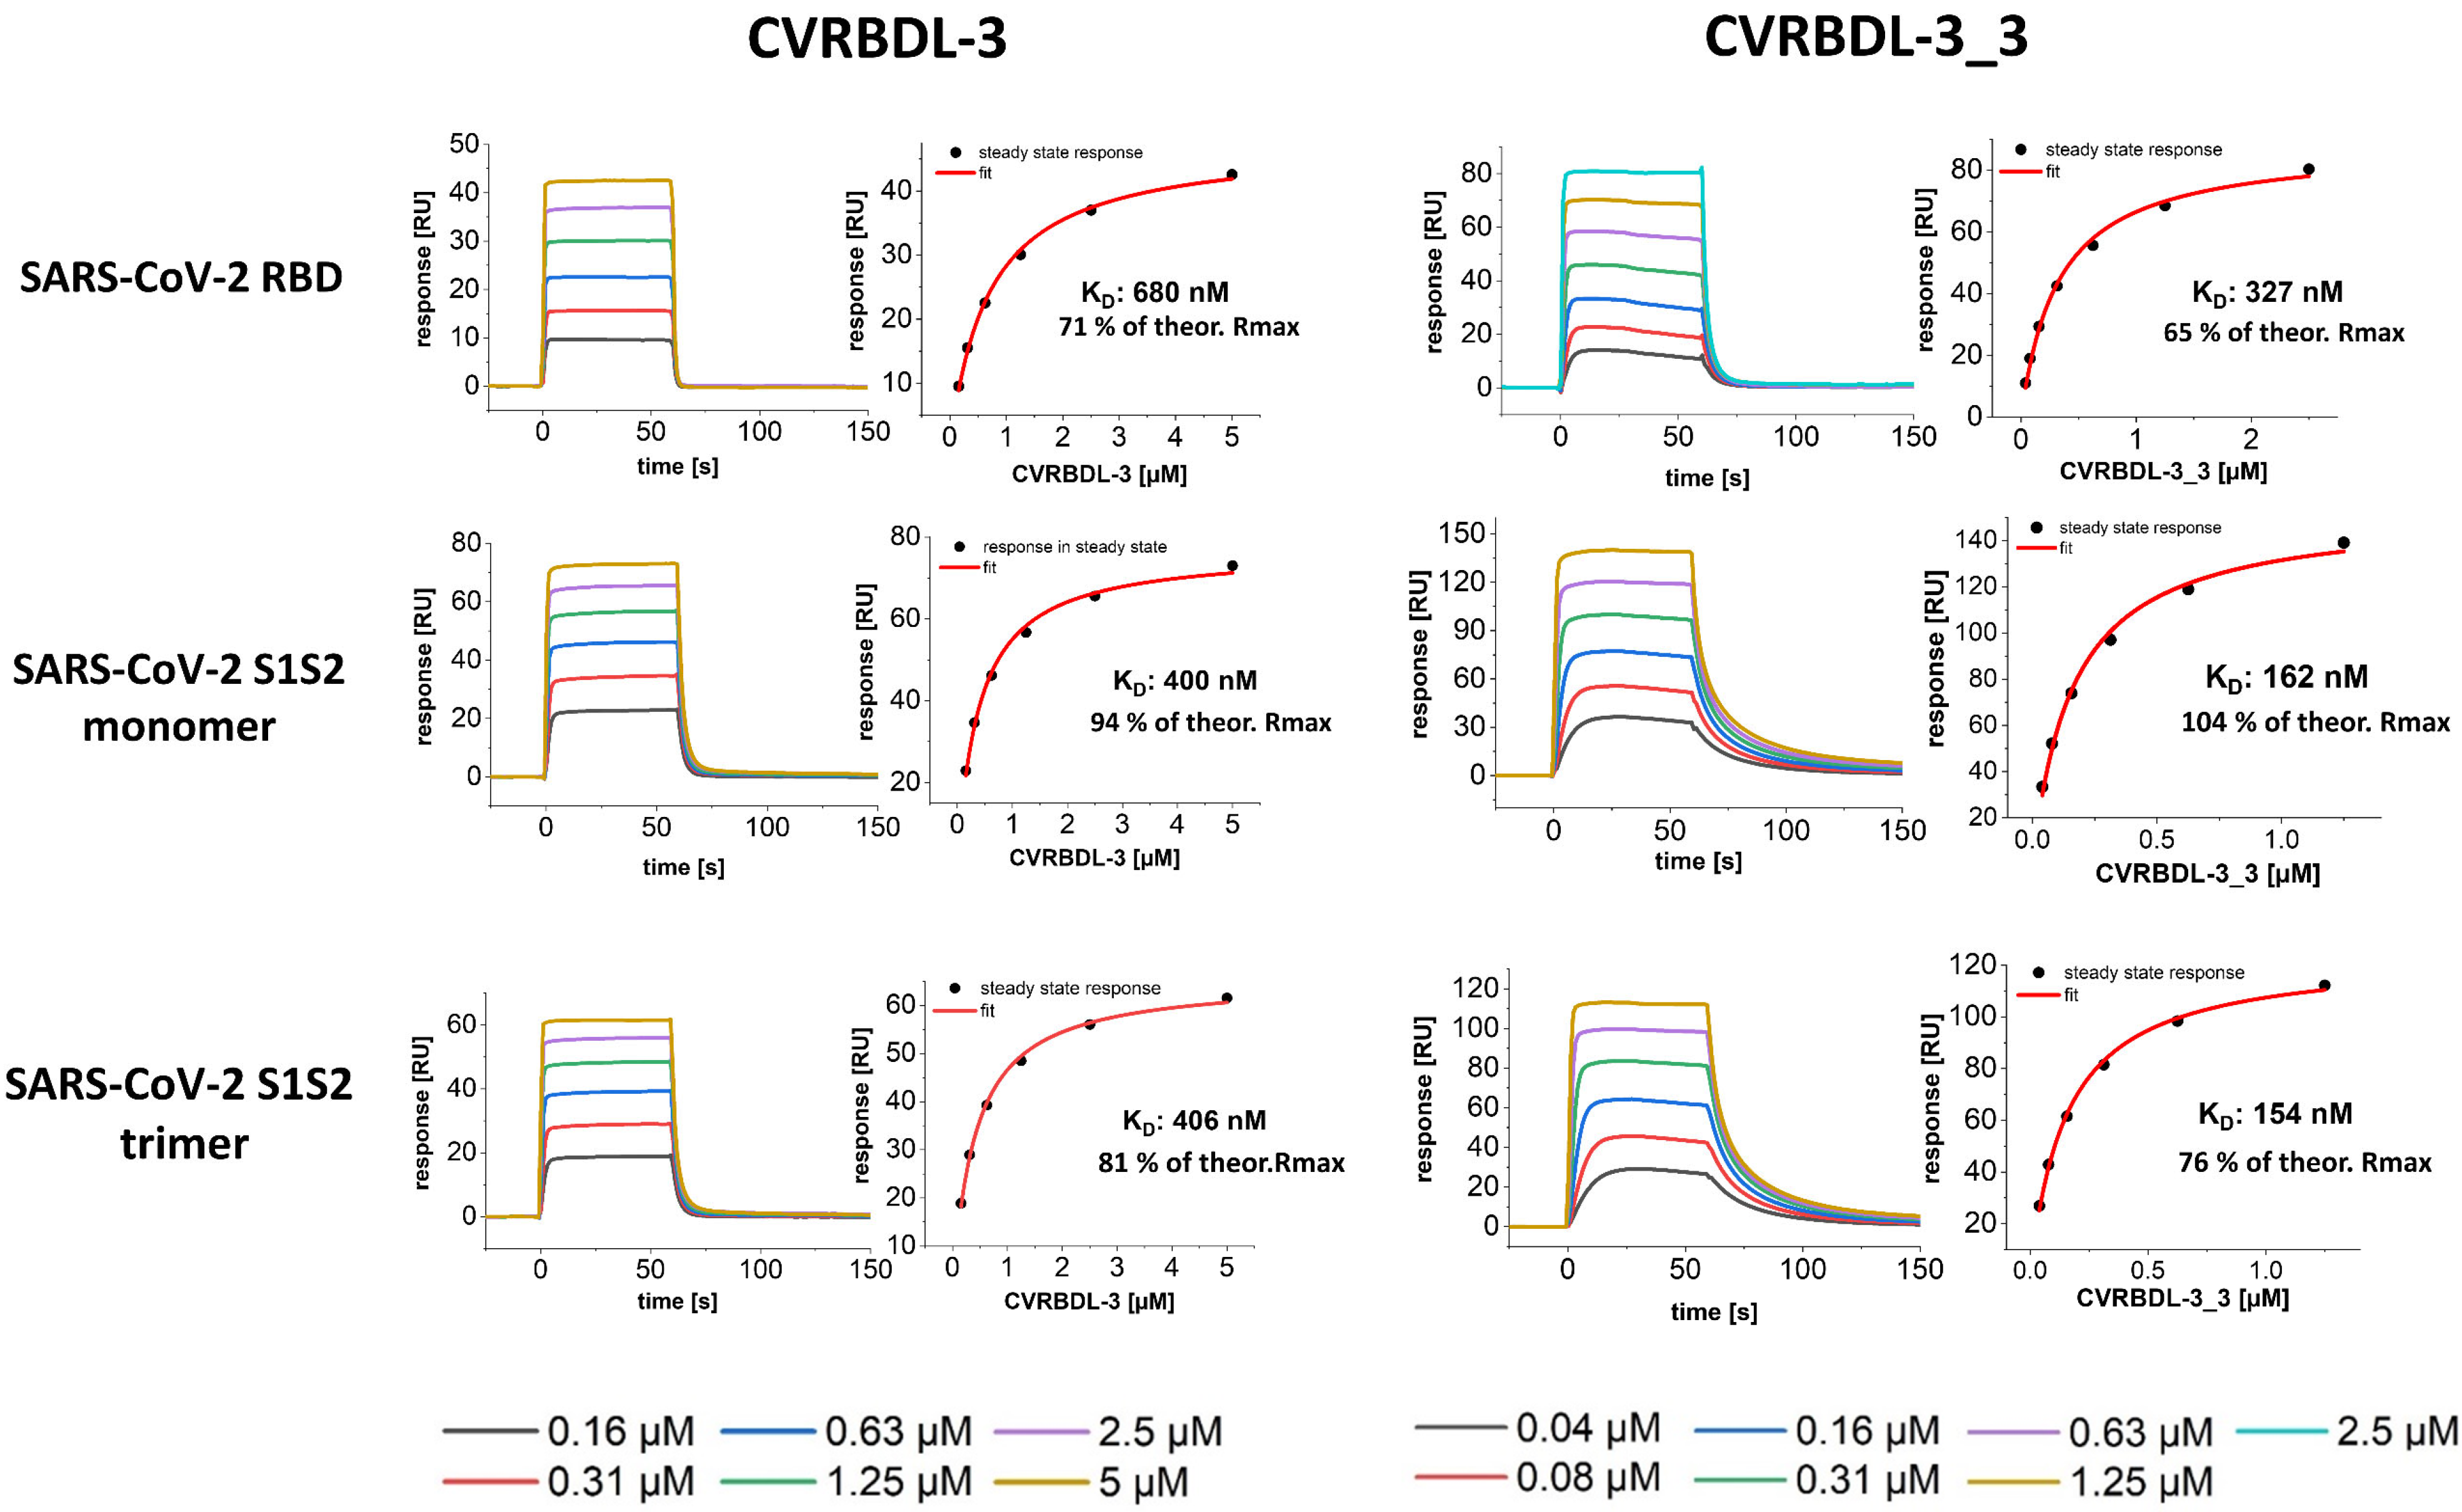
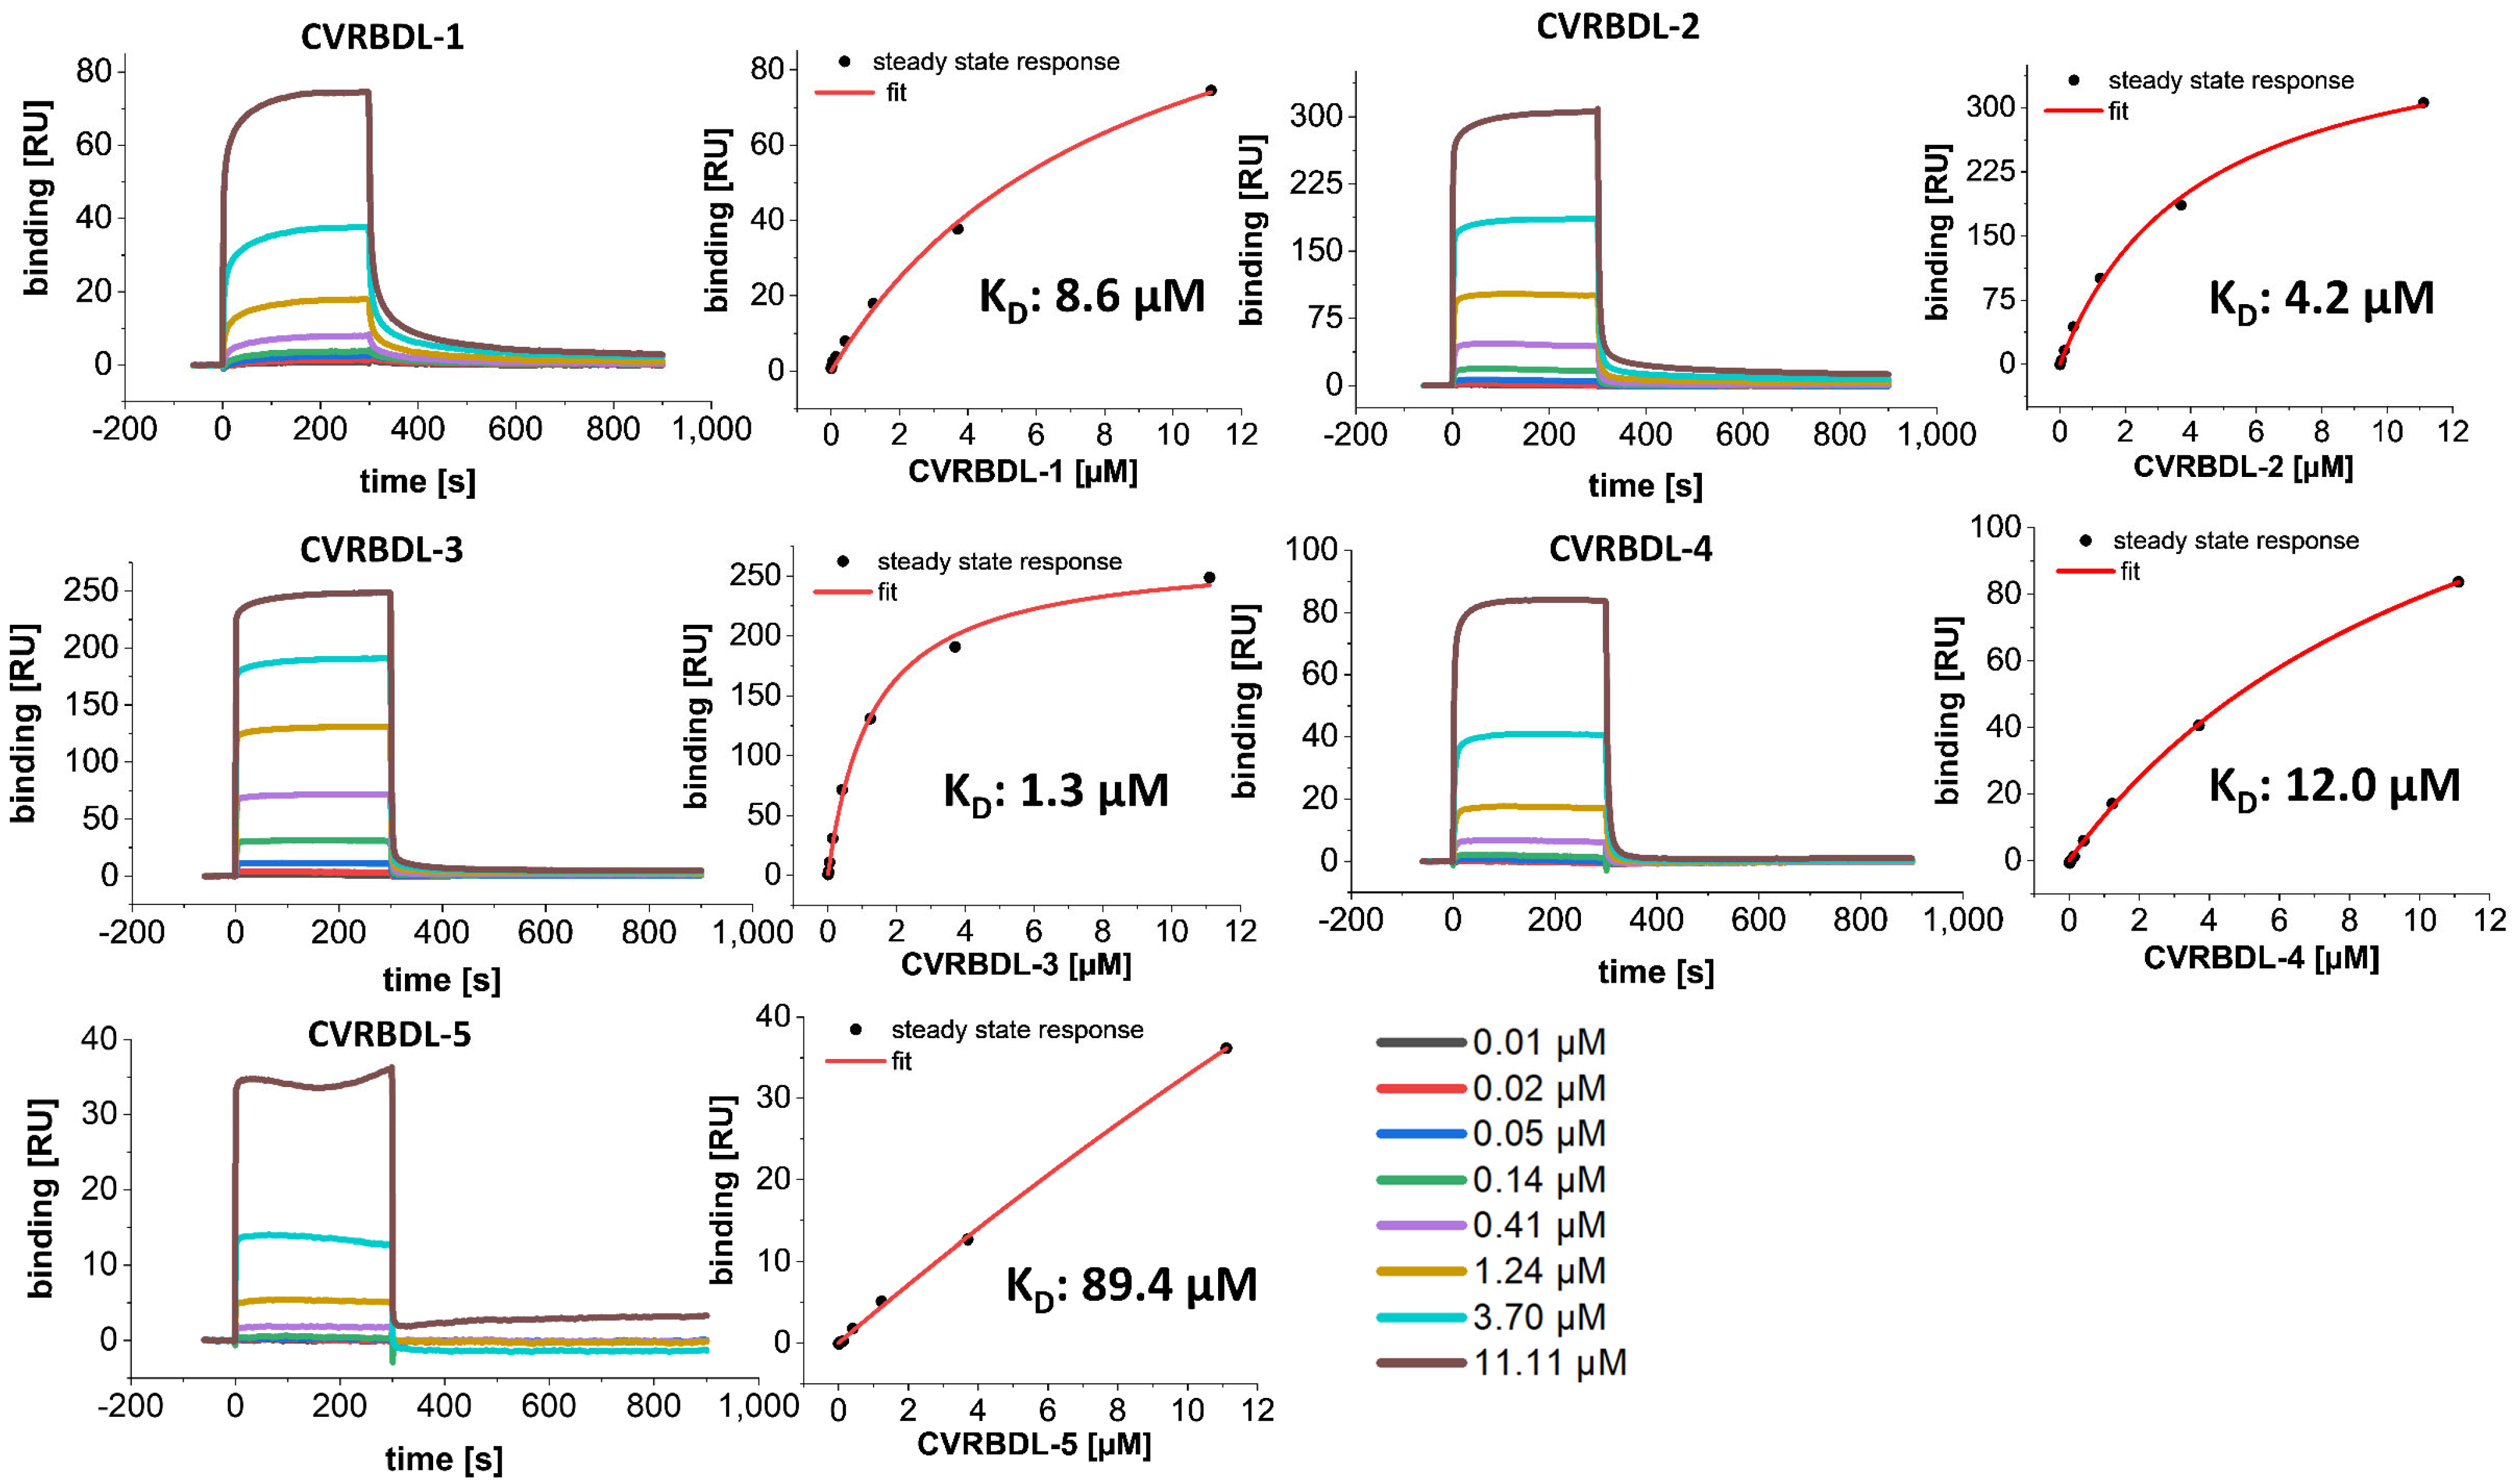
3.3. Affinity of CVRBDL Peptides towards the SARS-CoV-2 RBD
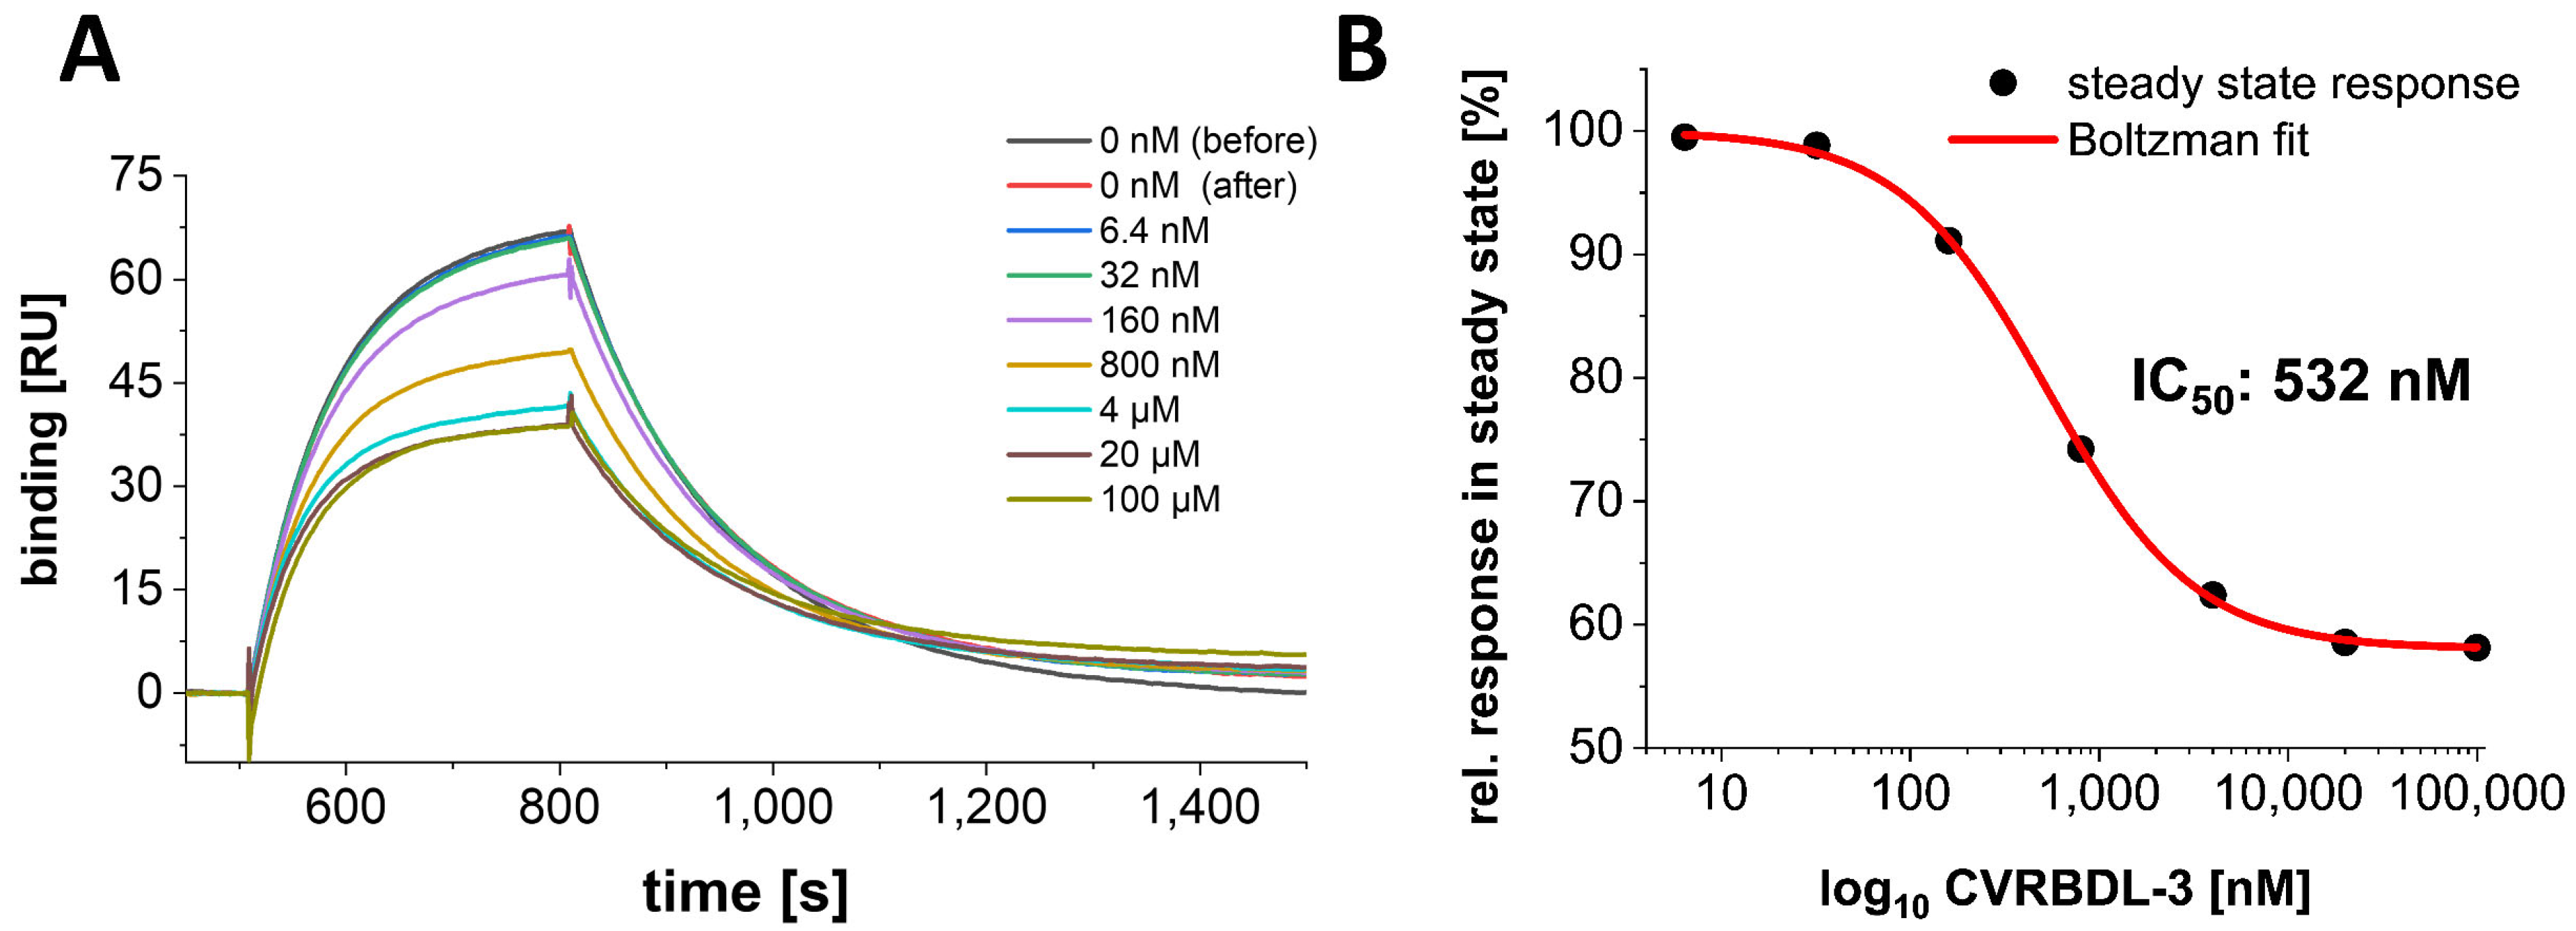
3.4. Inhibition of the SARS-CoV-2 S1S2 Spike Protein Interaction with hACE2
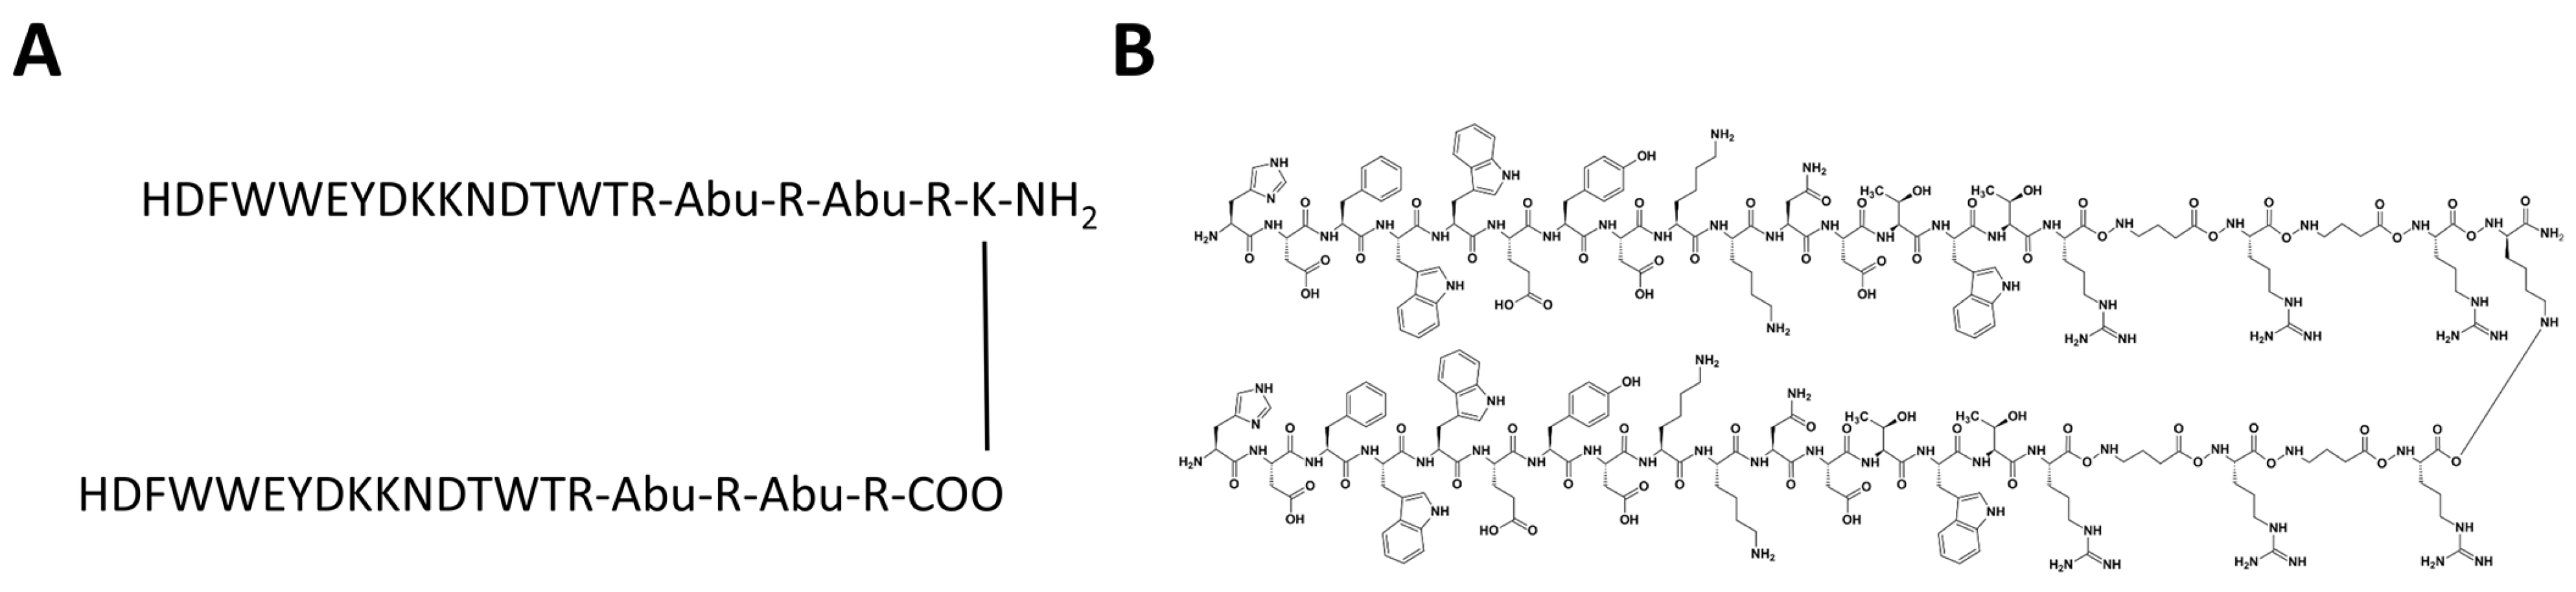
3.5. Tail-To-Tail Construct Design: CVRBDL-3_3
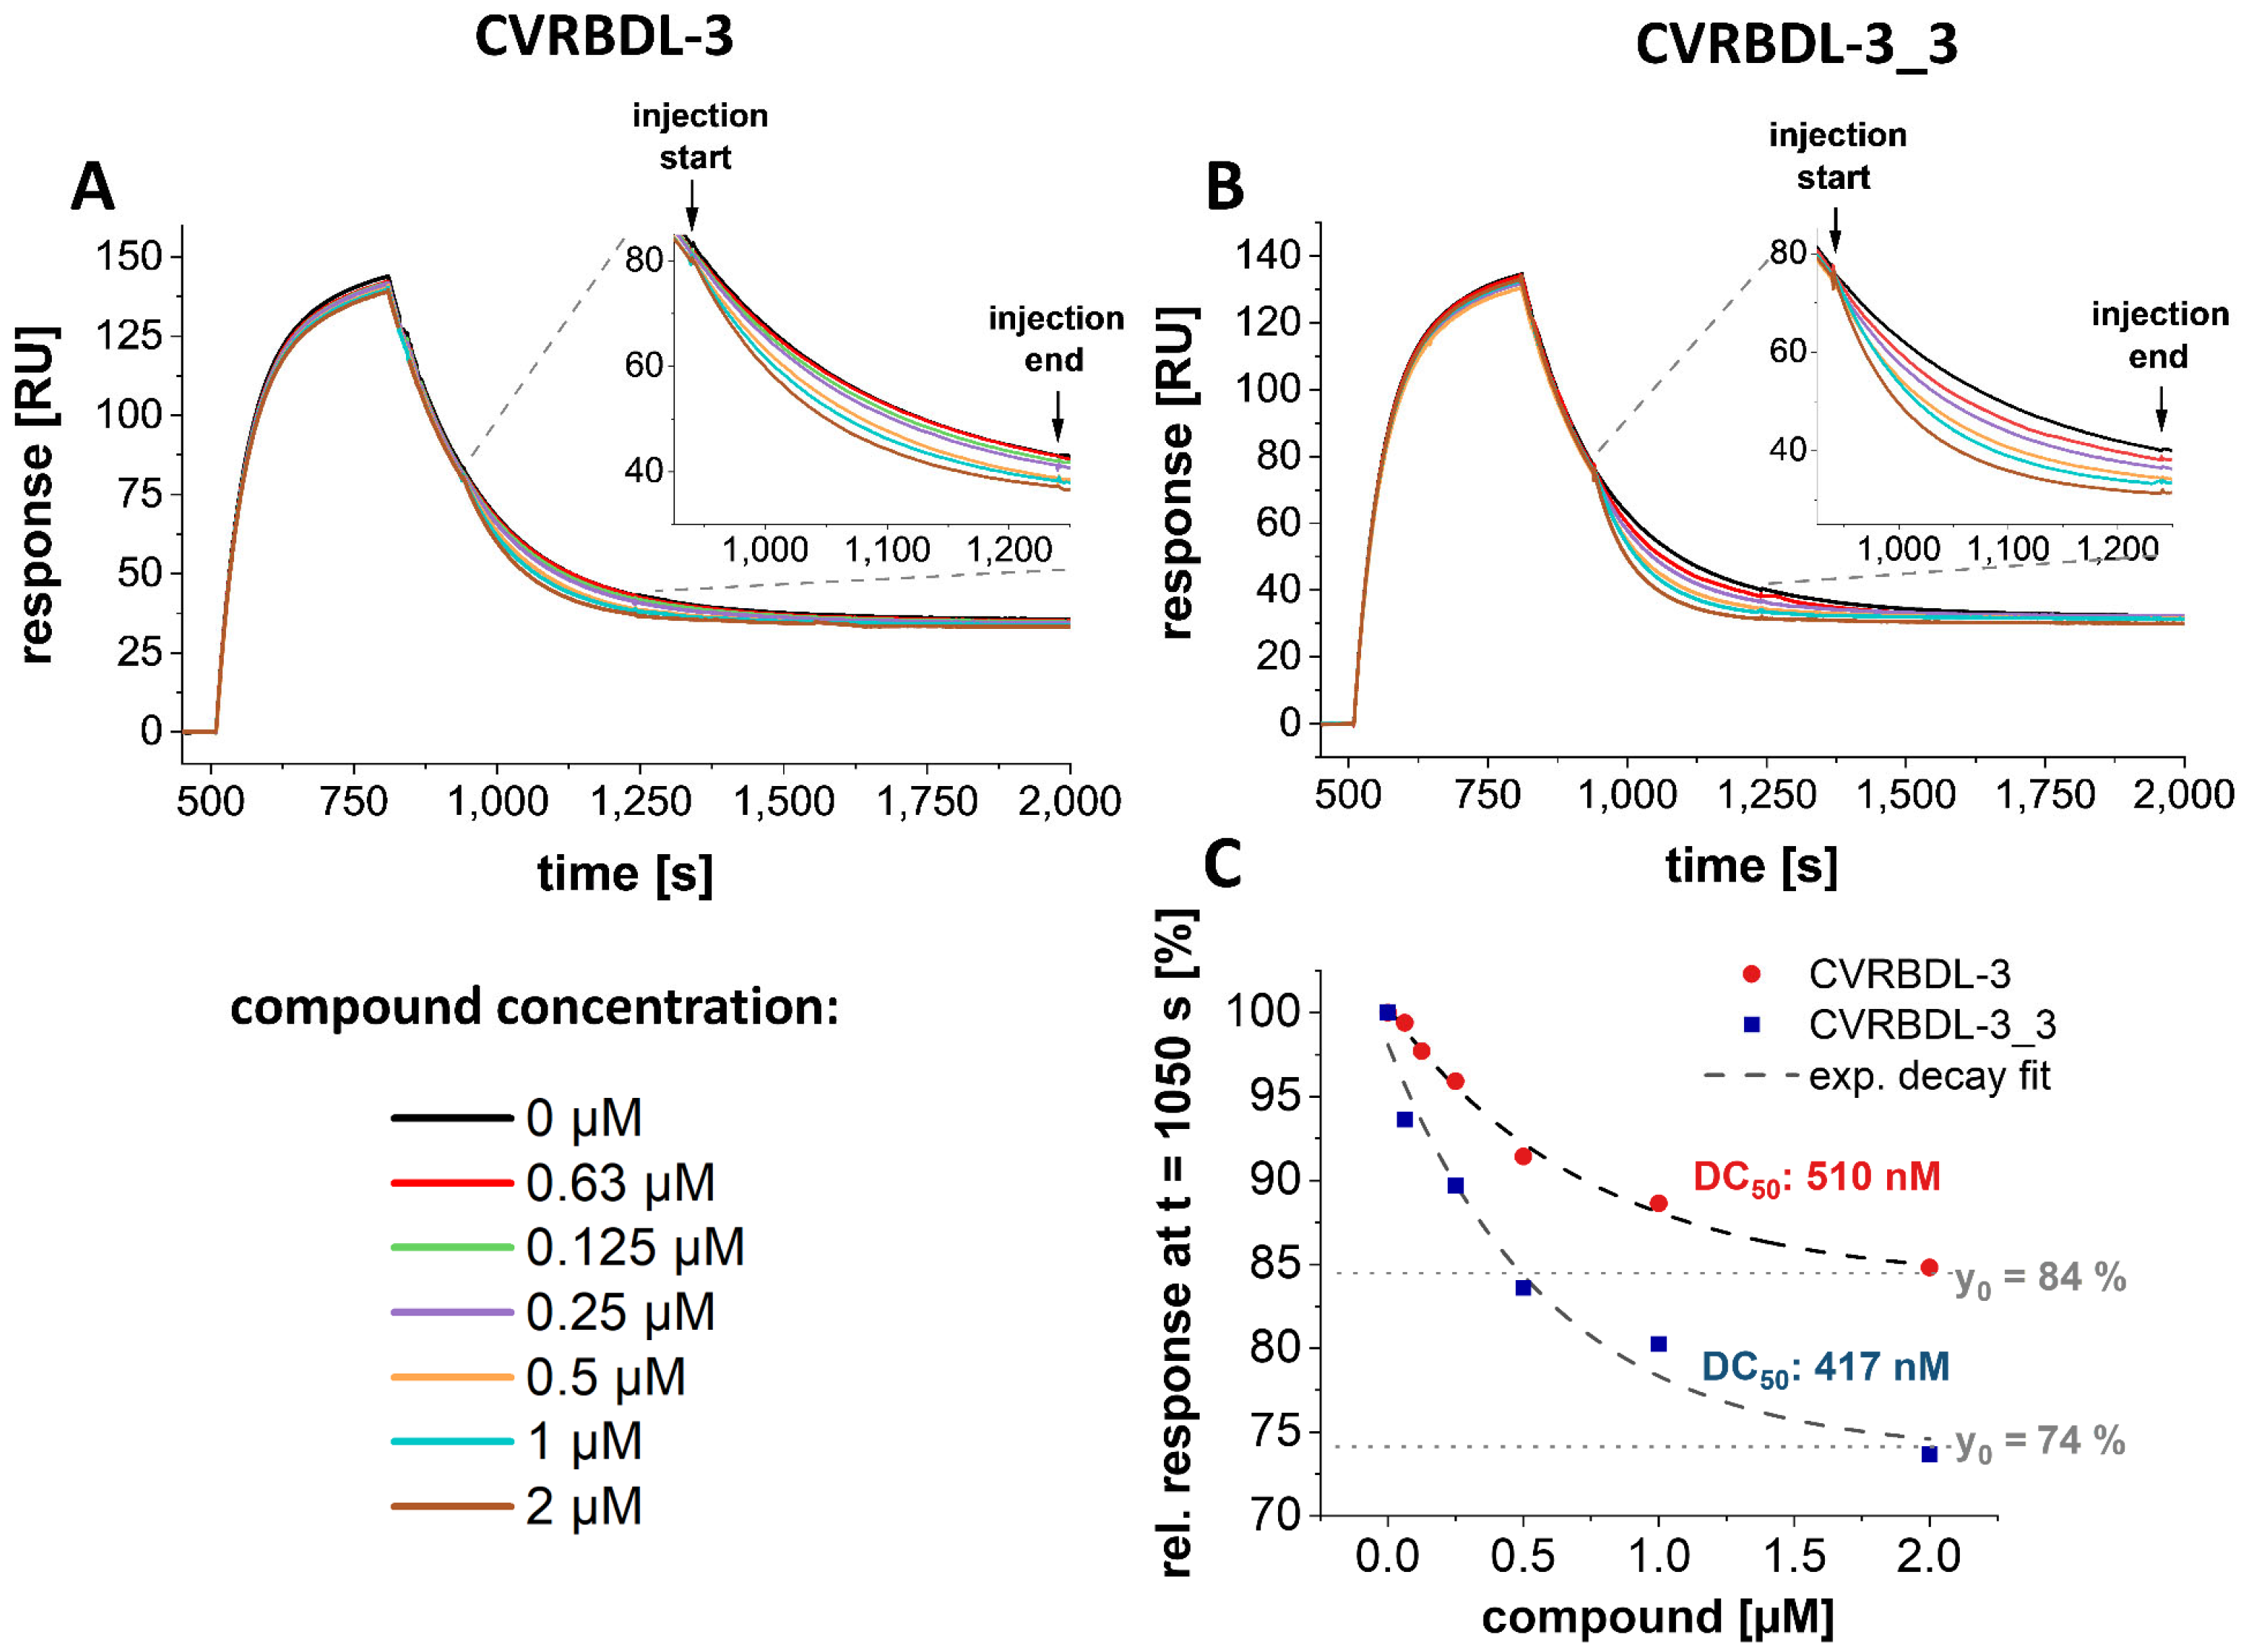
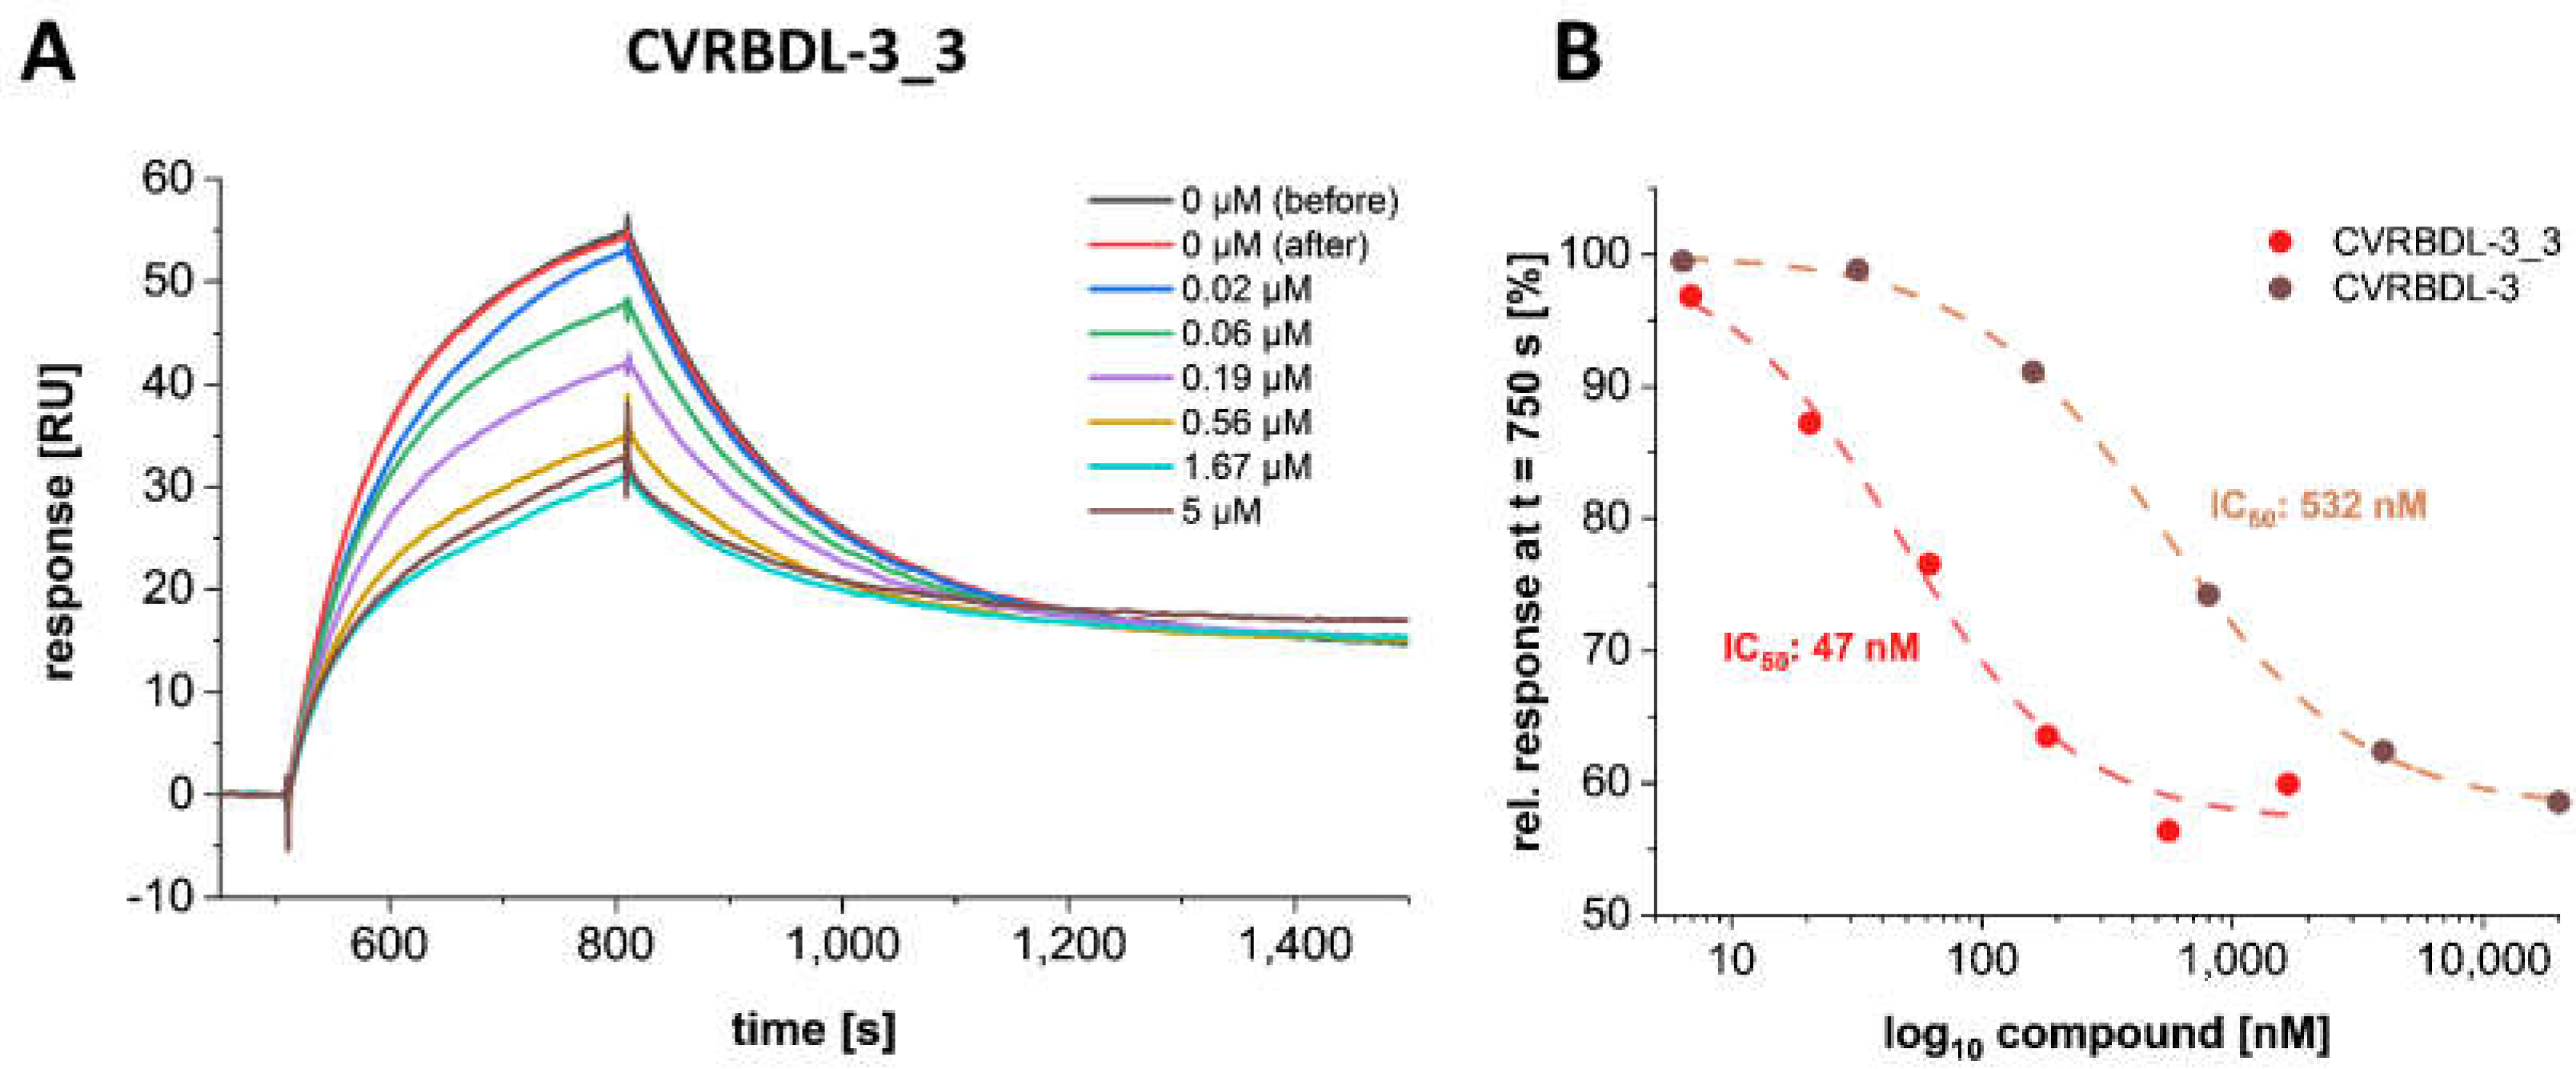
3.6. CVRBDL-3_3 Shows Increased Affinity for the CoV-2 Spike Protein Compared with CVRBDL-3
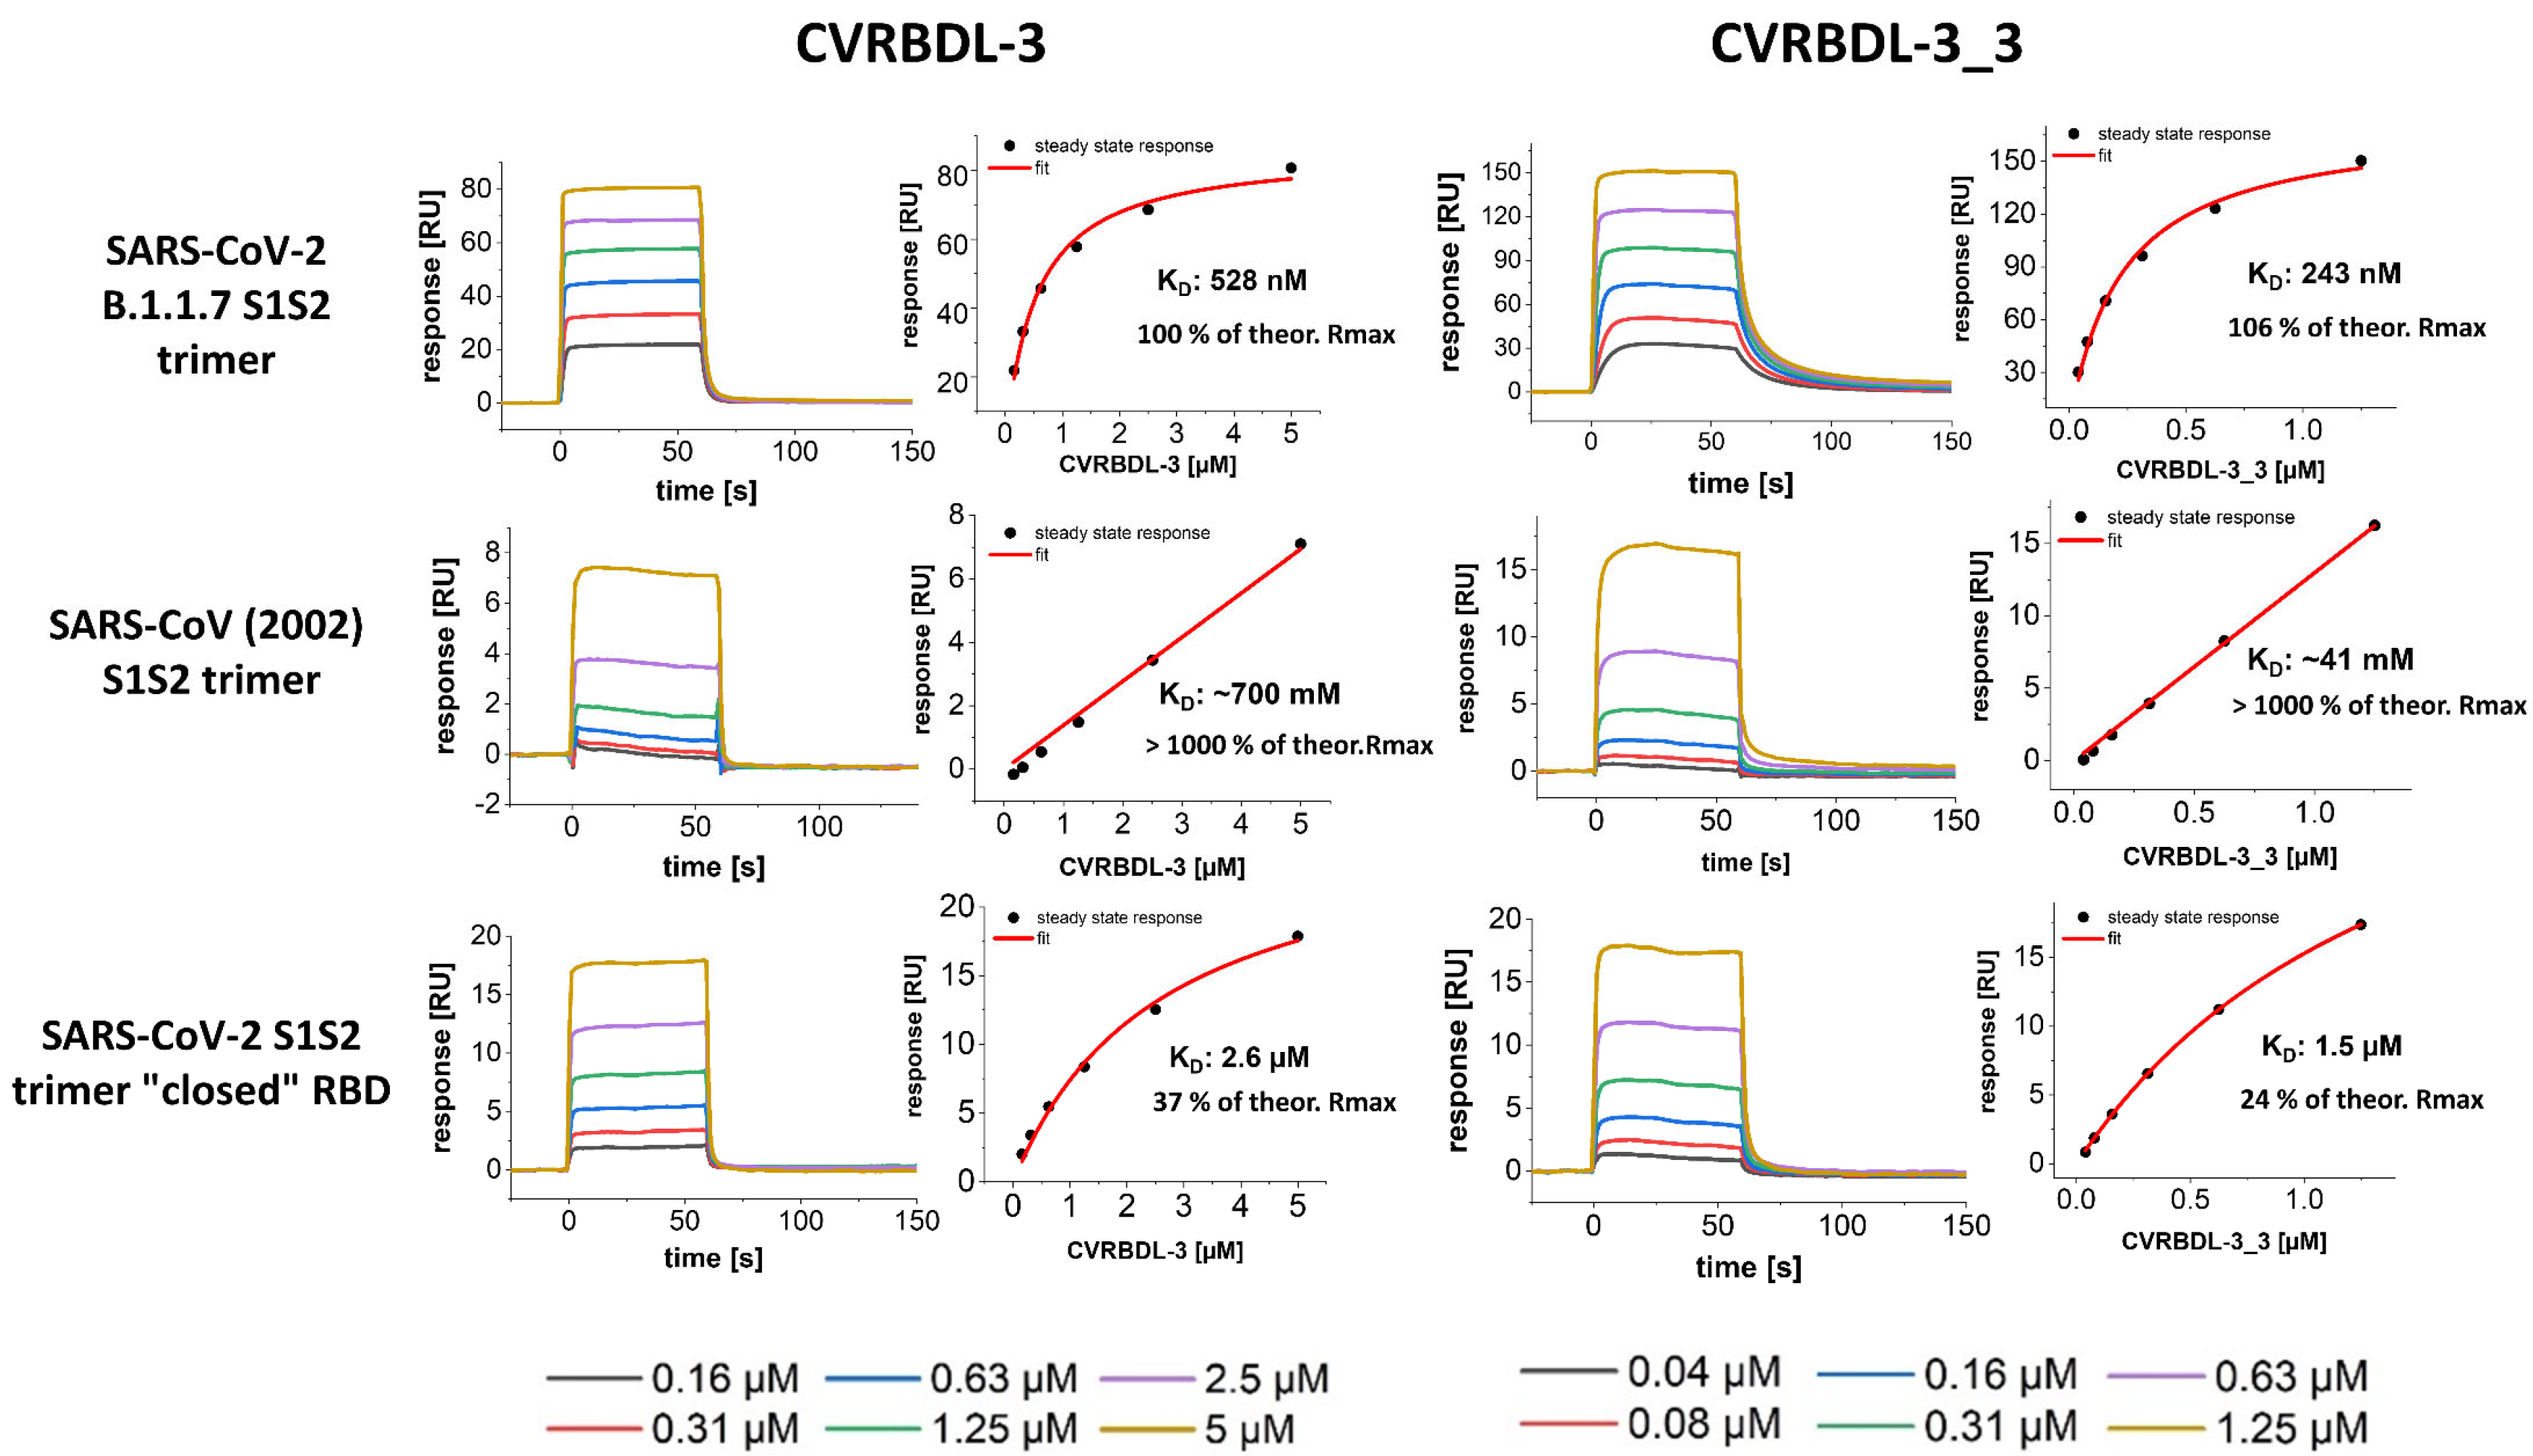
3.7. CVRBDL-3 and CVRBDL -3_3 Show High Affinity for the B.1.1.7 Mutant Spike Trimer and Bind the SARS-CoV (2002) and SARS-CoV-2 “Closed” RBD Trimer with Reduced Affinity
3.8. CVRBD-3_3 Efficiently Inhibits the Spike-hACE2 Complex Formation and Displaces the Spike Protein from the Pre-Formed Complex
4. Discussion
Author Contributions
Funding
Institutional Review Board Statement
Informed Consent Statement
Data Availability Statement
Acknowledgments
Conflicts of Interest
Appendix A

| Construct Name | Expression Organism | Tag | MW Monomer [kDa] | Experimental Usage |
|---|---|---|---|---|
| SARS-CoV-2 RBD (Acrobiosystems) | HEK293 cells | Avitag, 6xHis-tag | 28.2 | Phage display screening, affinity screening |
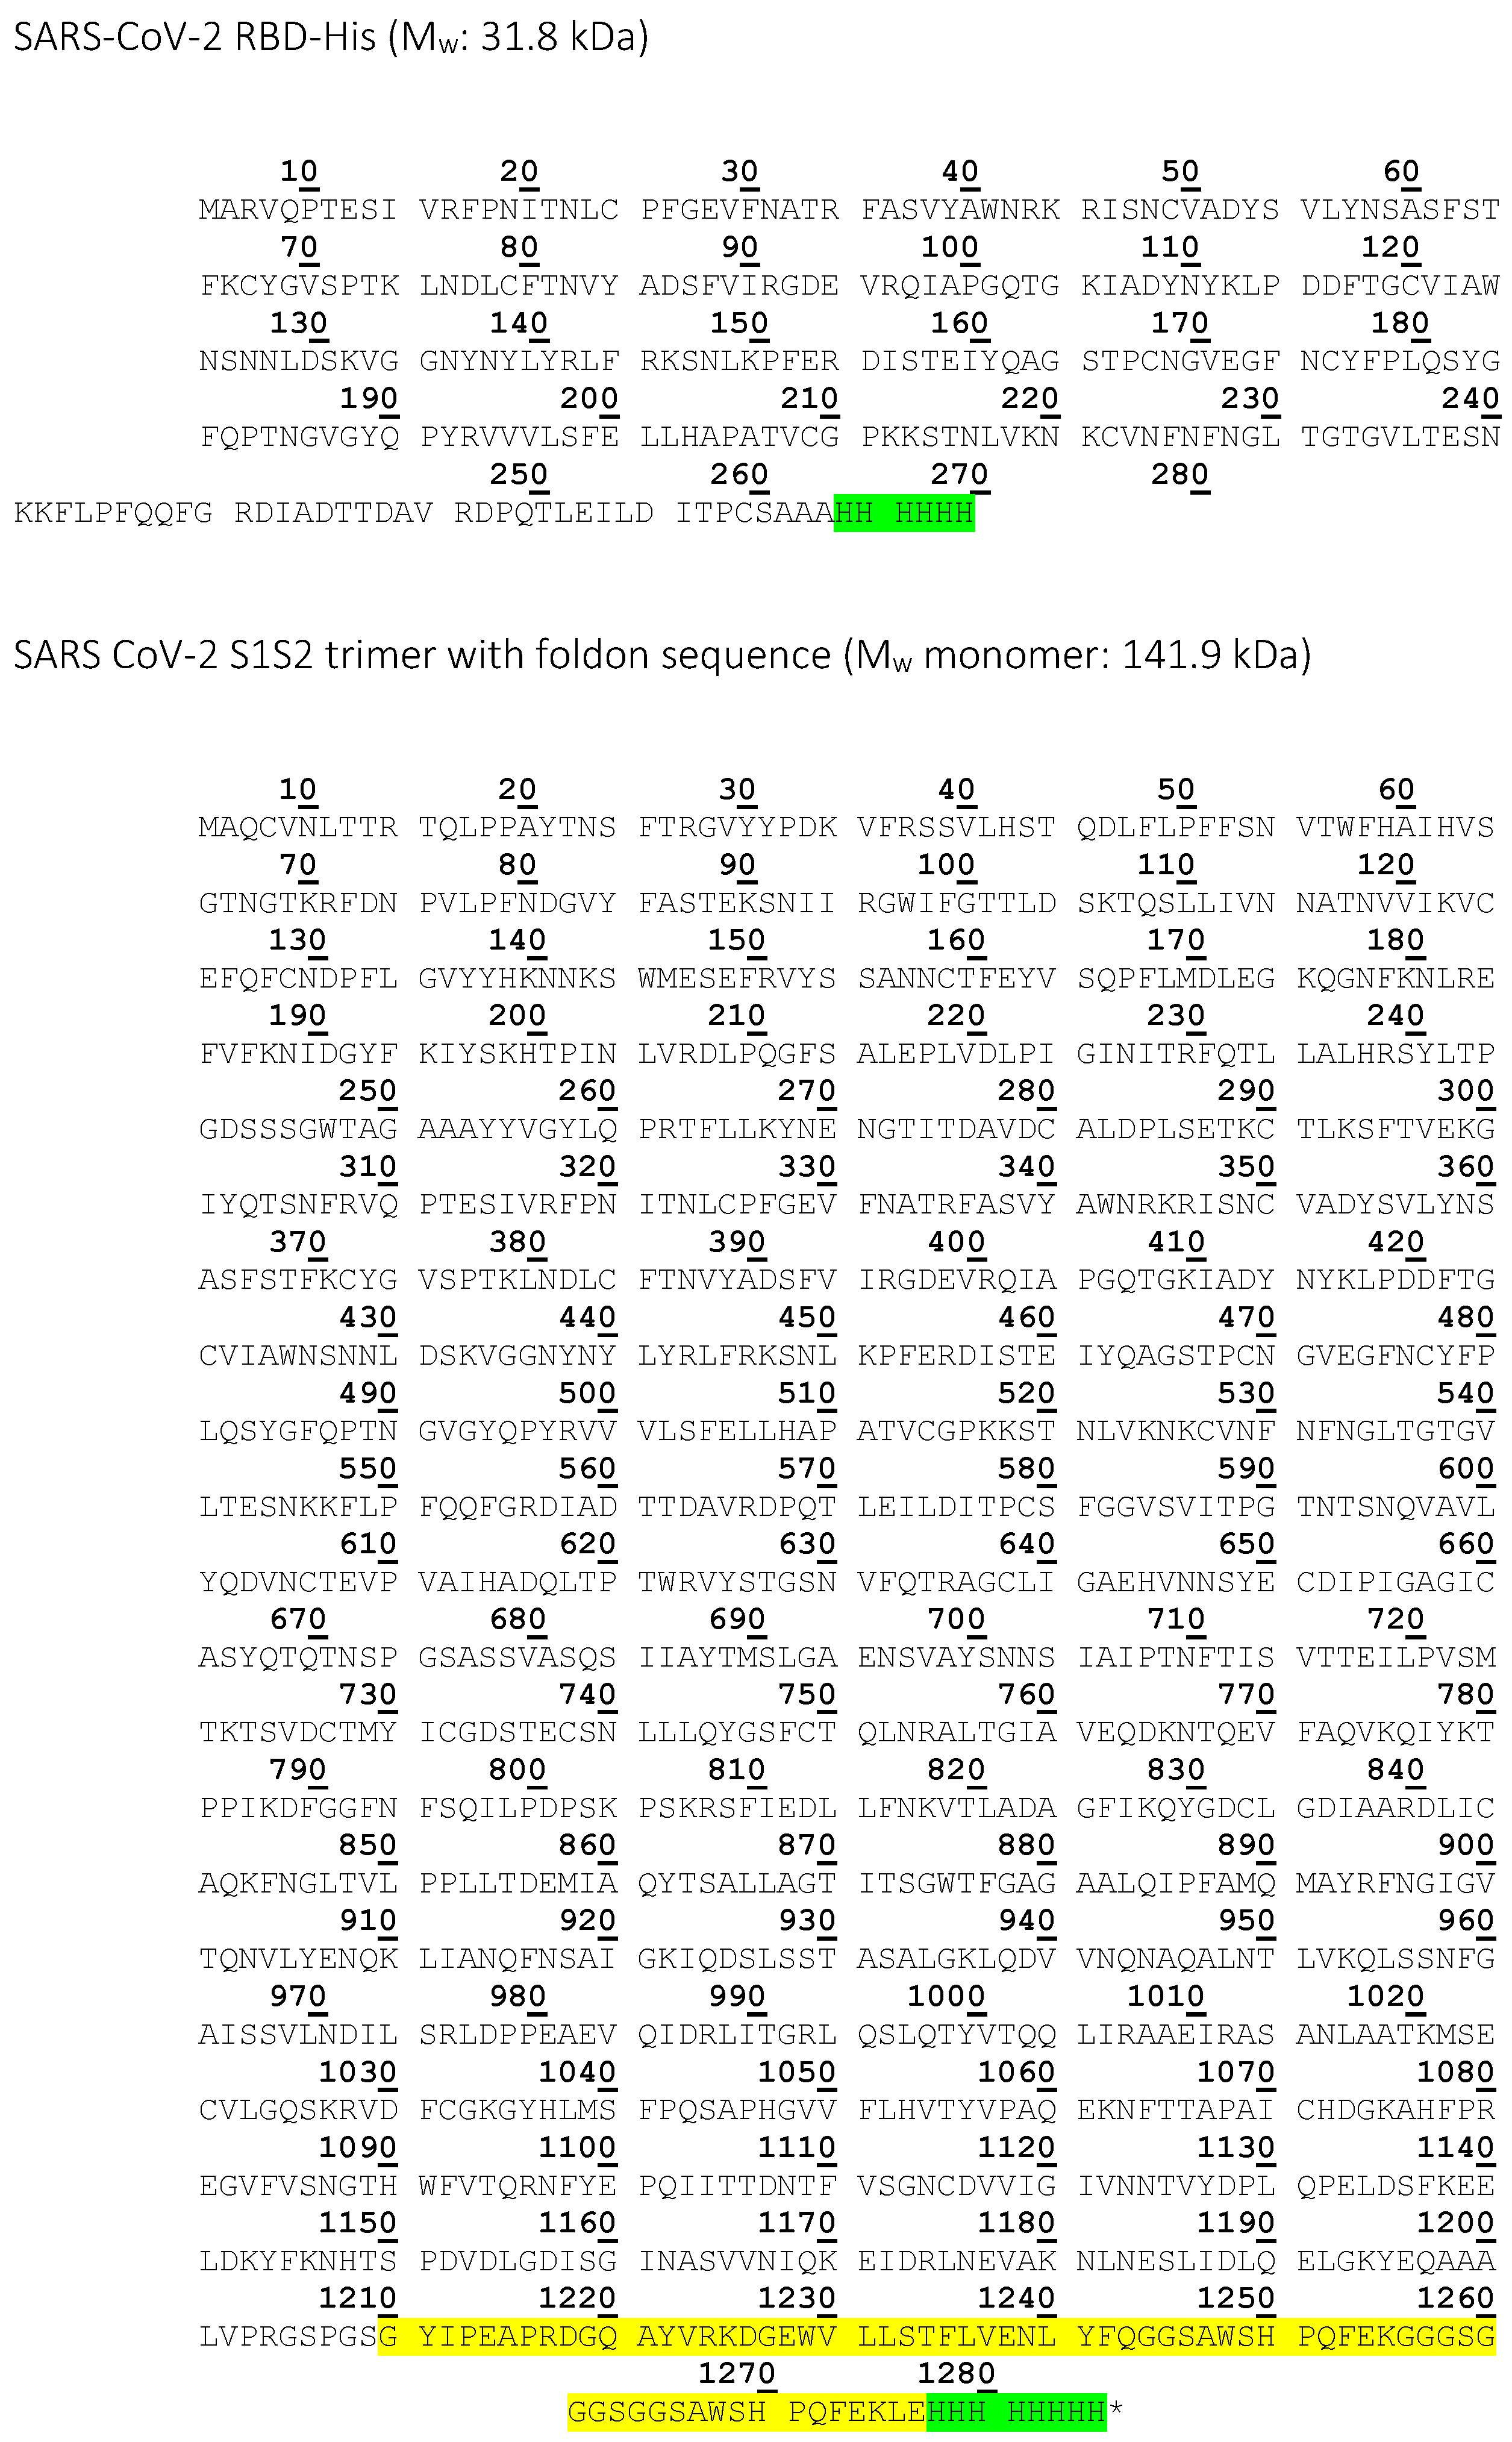
| SARS-CoV-2 RBD | High Five insect cells | 6x His-tag | 31.8 | Affinity measurement with CVRBDL-3 and CVRBDL-3_3, NMR |
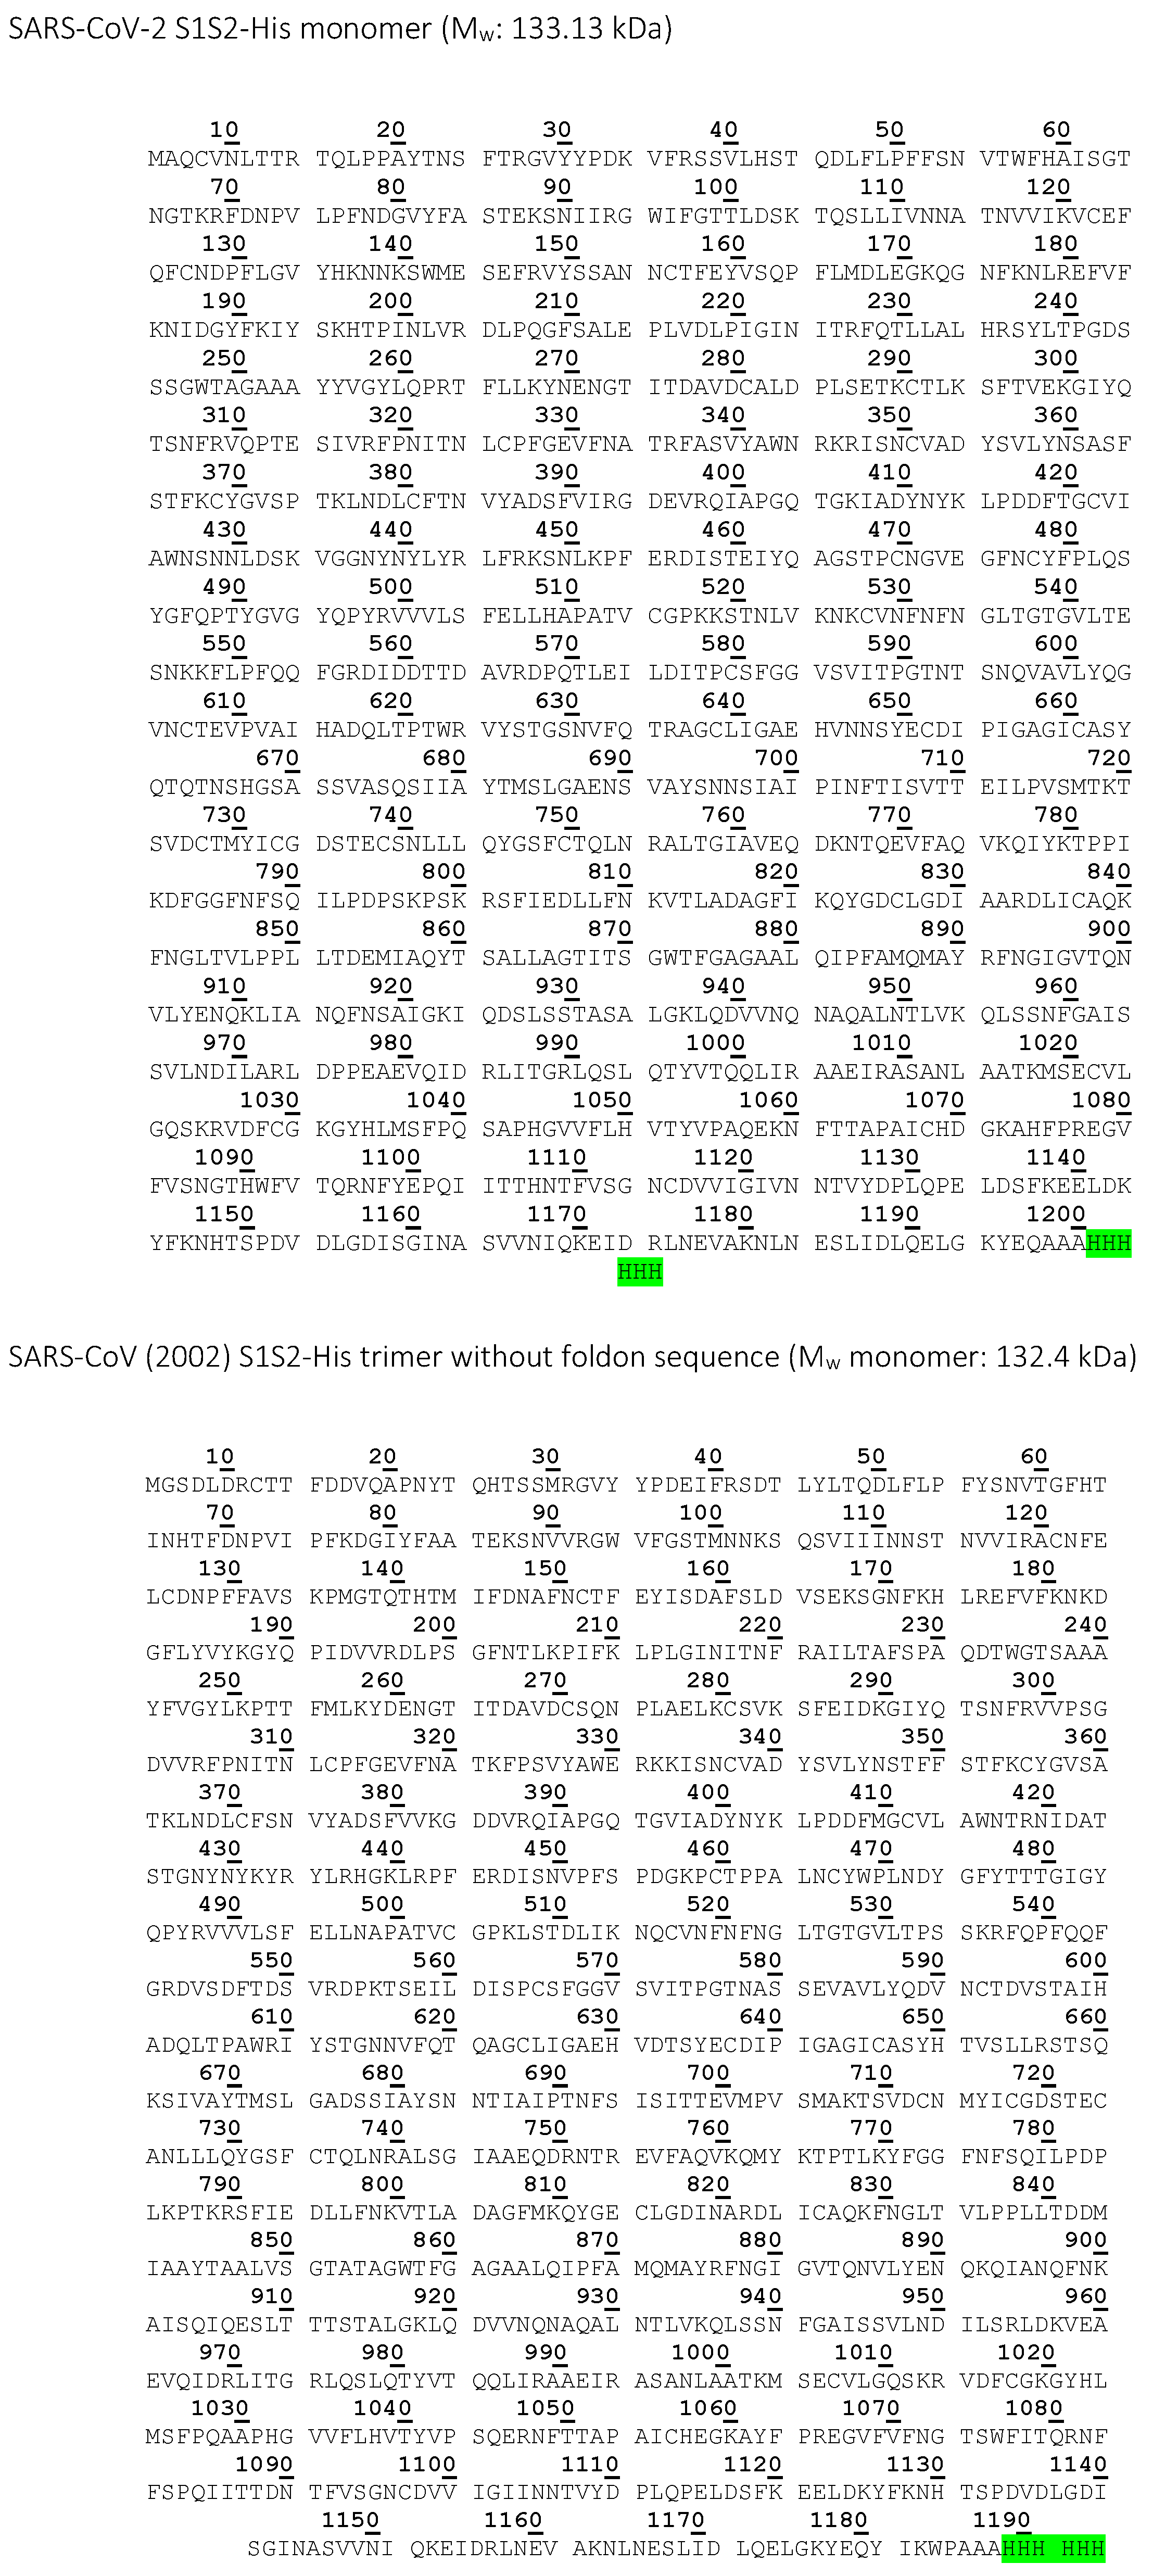
| SARS-CoV-2 S1S2-His | High Five insect cells | 6x His-tag | 133.13 | Inhibition and displacement analysis with CVRBDL-3 and CVRBDL-3_3 |
| SARS-CoV (2002) S1S2-His trimer | High Five insect cells | 6x His-tag | 132.4 | Affinity measurement with CVRBDL-3 and CVRBDL-3_3 |
| SARS CoV-2 S1S2 trimer | High Five insect cells | 6x His-tag, T4-foldon | 141.9 | Affinity measurement with CVRBDL-3 and CVRBDL-3_3 |
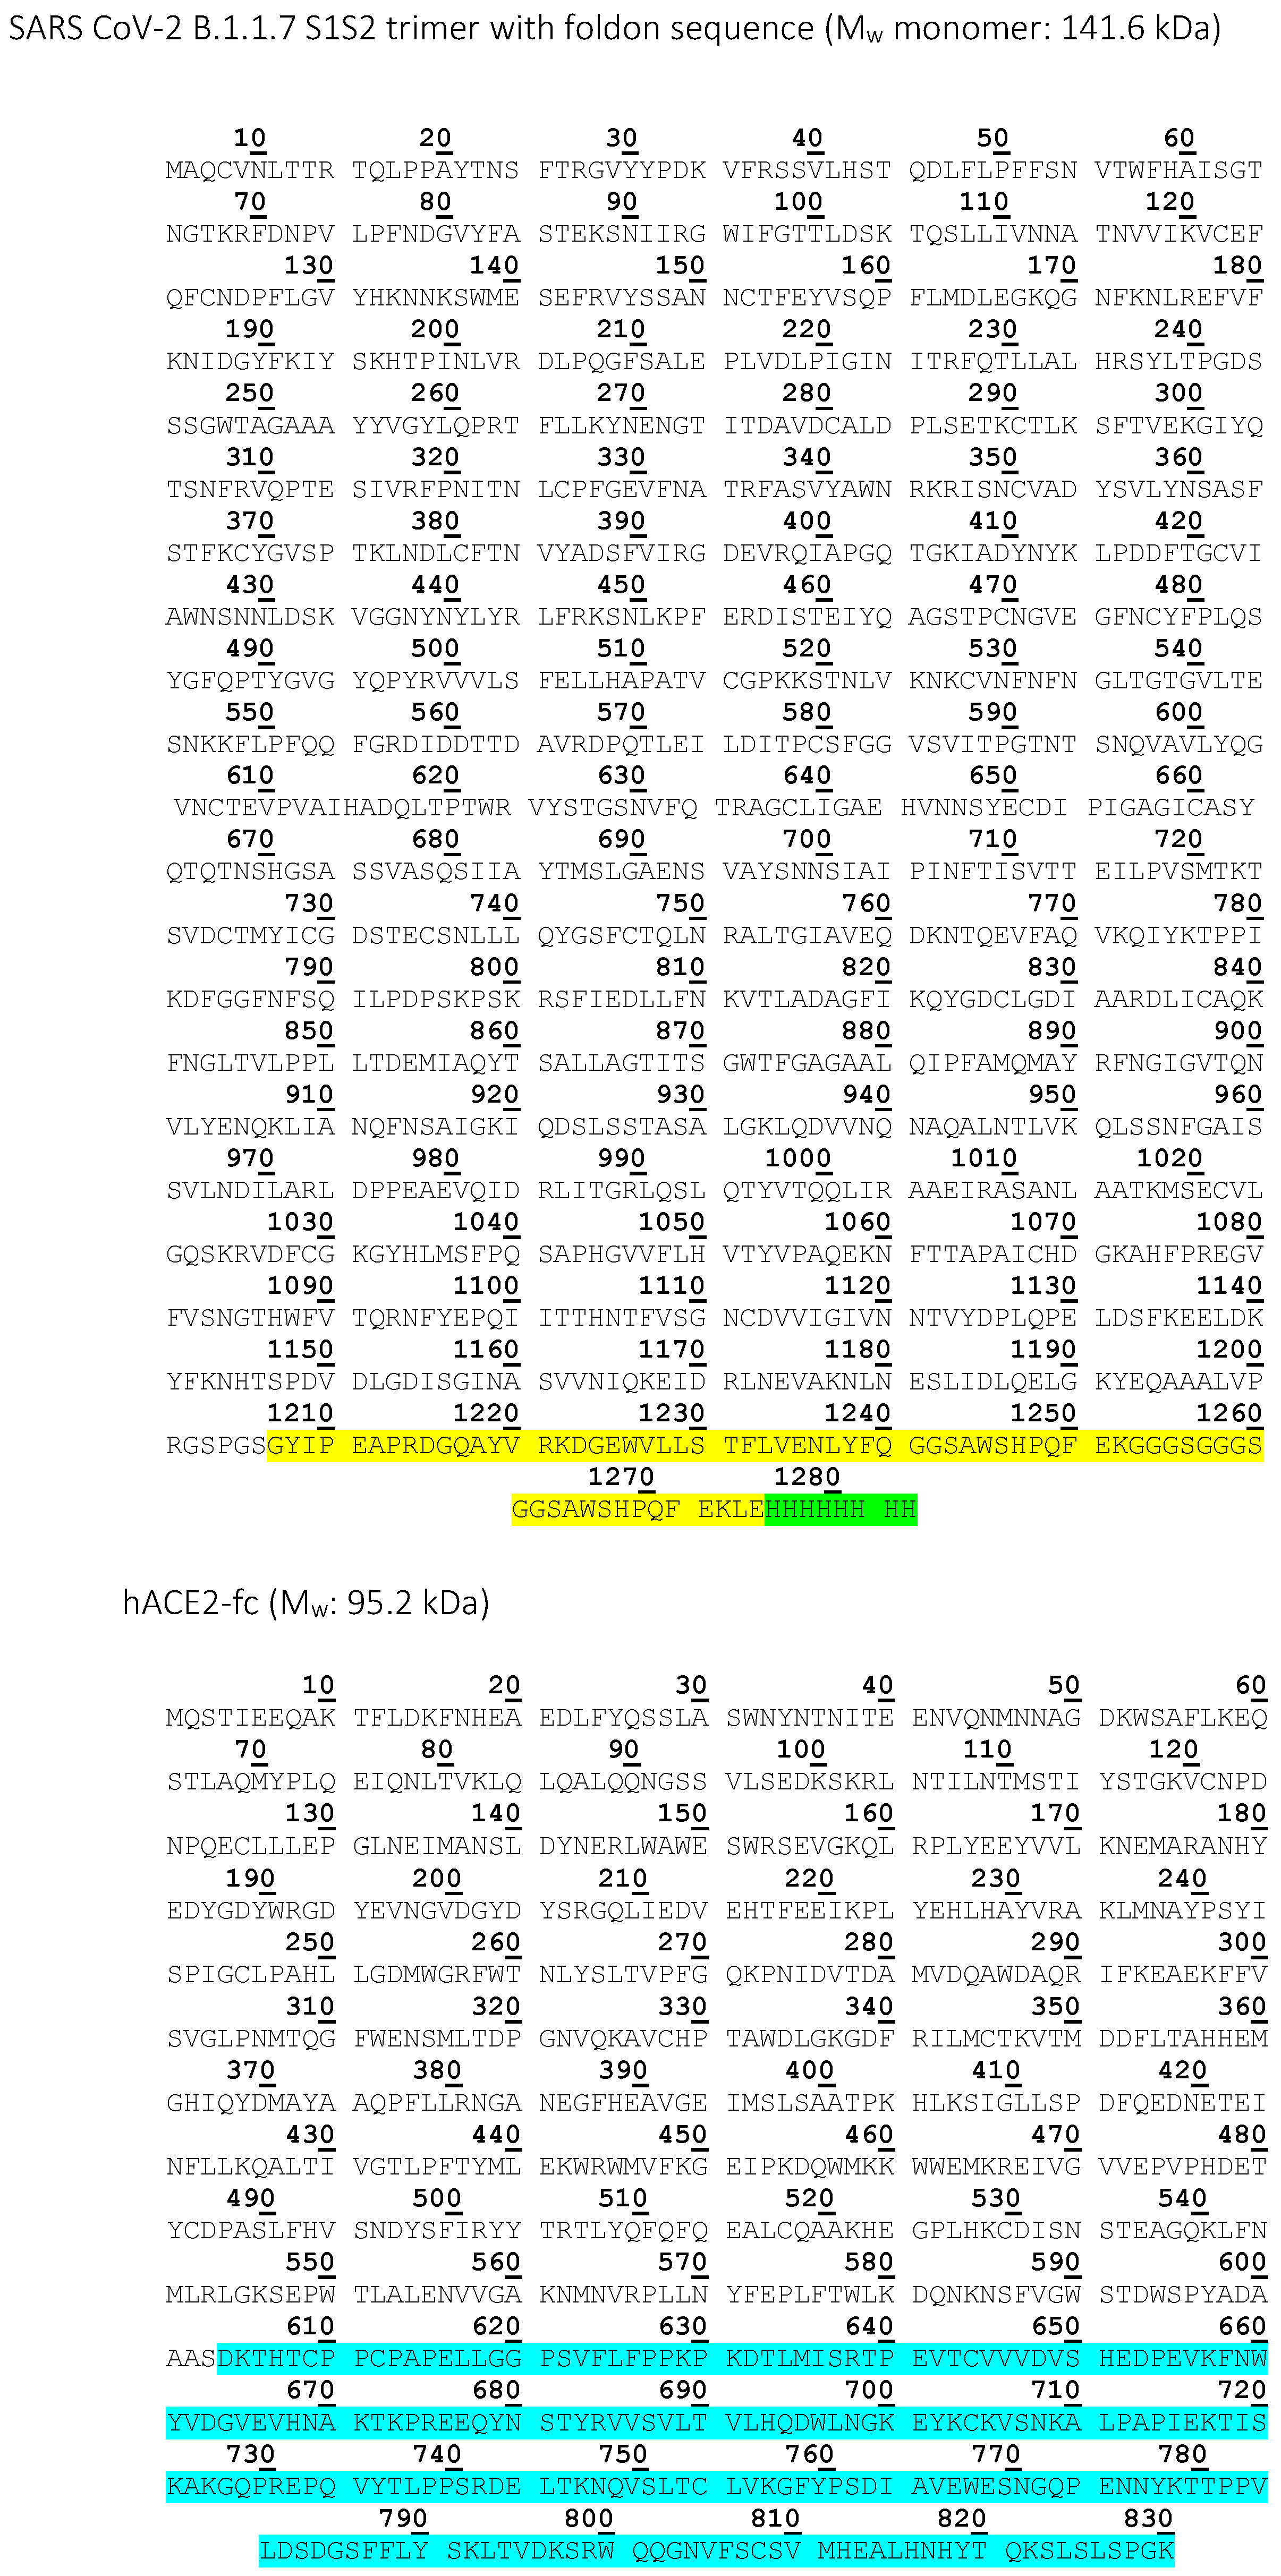
| SARS CoV-2 B.1.1.7 S1S2 | High Five insect cells | 6x His-tag, T4-foldon | 141.6 | Affinity measurement with CVRBDL-3 and CVRBDL-3_3 |
| hACE2 | HEK293-6E cells | IgG1-Fc | 95.2 | Inhibition and displacement analysis with CVRBDL-3 and CVRBDL-3_3 |


References
- Huang, C.; Wang, Y.; Li, X.; Ren, L.; Zhao, J.; Hu, Y.; Zhang, L.; Fan, G.; Xu, J.; Gu, X.; et al. Clinical features of patients infected with 2019 novel coronavirus in Wuhan, China. Lancet 2020, 395, 497–506. [Google Scholar] [CrossRef] [Green Version]
- Li, Q.; Guan, X.; Wu, P.; Wang, X.; Zhou, L.; Tong, Y.; Ren, R.; Leung, K.S.; Lau, E.H.; Wong, J.Y.; et al. Early Transmission Dynamics in Wuhan, China, of Novel Coronavirus-Infected Pneumonia. N. Engl. J. Med. 2020, 382, 1199–1207. [Google Scholar] [CrossRef] [PubMed]
- Rabaan, A.A.; Al-Ahmed, S.H.; Haque, S.; Sah, R.; Tiwari, R.; Malik, Y.S.; Dhama, K.; Yatoo, M.I.; Bonilla-Aldana, D.K.; Rodriguez-Morales, A.J. SARS-CoV-2, SARS-CoV, and MERS-COV: A comparative overview. Infez Med. 2020, 28, 174–184. [Google Scholar]
- Lee, N.; Hui, D.; Wu, A.; Chan, P.; Cameron, P.; Joynt, G.M.; Ahuja, A.; Yung, M.Y.; Leung, C.; To, K.; et al. A major outbreak of severe acute respiratory syndrome in Hong Kong. N. Engl. J. Med. 2003, 348, 1986–1994. [Google Scholar] [CrossRef] [PubMed]
- Hänel, K.; Willbold, D. SARS-CoV accessory protein 7a directly interacts with human LFA-1. Biol. Chem. 2007, 388, 1325–1332. [Google Scholar] [CrossRef] [PubMed]
- WHO Coronavirus (COVID-19) Dashboard. Available online: https://covid19.who.int/ (accessed on 7 February 2022).
- Wang, Q.; Zhang, Y.; Wu, L.; Niu, S.; Song, C.; Zhang, Z.; Lu, G.; Qiao, C.; Hu, Y.; Yuen, K.Y.; et al. Structural and Functional Basis of SARS-CoV-2 Entry by Using Human ACE2. Cell 2020, 181, 894–904.e899. [Google Scholar] [CrossRef] [PubMed]
- Koch, J.; Uckeley, Z.M.; Doldan, P.; Stanifer, M.; Boulant, S.; Lozach, P.Y. TMPRSS2 expression dictates the entry route used by SARS-CoV-2 to infect host cells. Embo J. 2021, 40, e107821. [Google Scholar] [CrossRef]
- Chen, J.; Wang, R.; Wang, M.; Wei, G.W. Mutations Strengthened SARS-CoV-2 Infectivity. J. Mol. Biol. 2020, 432, 5212–5226. [Google Scholar] [CrossRef]
- Choe, H.; Farzan, M. How SARS-CoV-2 first adapted in humans. Science 2021, 372, 466–467. [Google Scholar] [CrossRef]
- Shang, J.; Ye, G.; Shi, K.; Wan, Y.; Luo, C.; Aihara, H.; Geng, Q.; Auerbach, A.; Li, F. Structural basis of receptor recognition by SARS-CoV-2. Nature 2020, 581, 221–224. [Google Scholar] [CrossRef] [Green Version]
- Wan, Y.S.; Shang, J.; Graham, R.; Baric, R.S.; Li, F. Receptor Recognition by the Novel Coronavirus from Wuhan: An Analysis Based on Decade-Long Structural Studies of SARS Coronavirus. J. Virol. 2020, 94, e00127-20. [Google Scholar] [CrossRef] [PubMed] [Green Version]
- Letko, M.; Marzi, A.; Munster, V. Functional assessment of cell entry and receptor usage for SARS-CoV-2 and other lineage B betacoronaviruses. Nat. Microbiol. 2020, 5, 562–569. [Google Scholar] [CrossRef] [Green Version]
- Tang, J.W.; Tambyah, P.A.; Hui, D.S. Emergence of a new SARS-CoV-2 variant in the UK. J. Infect. 2021, 82, e27–e28. [Google Scholar] [CrossRef] [PubMed]
- Guruprasad, L. Human SARS CoV-2 spike protein mutations. Proteins 2021, 89, 569–576. [Google Scholar] [CrossRef] [PubMed]
- Huang, Y.; Yang, C.; Xu, X.F.; Xu, W.; Liu, S.W. Structural and functional properties of SARS-CoV-2 spike protein: Potential antivirus drug development for COVID-19. Acta Pharmacol. Sin. 2020, 41, 1141–1149. [Google Scholar] [CrossRef]
- Yi, C.; Sun, X.; Ye, J.; Ding, L.; Liu, M.; Yang, Z.; Lu, X.; Zhang, Y.; Ma, L.; Gu, W.; et al. Key residues of the receptor binding motif in the spike protein of SARS-CoV-2 that interact with ACE2 and neutralizing antibodies. Cell Mol. Immunol. 2020, 17, 621–630. [Google Scholar] [CrossRef]
- Lan, J.; Ge, J.; Yu, J.; Shan, S.; Zhou, H.; Fan, S.; Zhang, Q.; Shi, X.; Wang, Q.; Zhang, L.; et al. Structure of the SARS-CoV-2 spike receptor-binding domain bound to the ACE2 receptor. Nature 2020, 581, 215–220. [Google Scholar] [CrossRef] [Green Version]
- Harvey, W.T.; Carabelli, A.M.; Jackson, B.; Gupta, R.K.; Thomson, E.C.; Harrison, E.M.; Ludden, C.; Reeve, R.; Rambaut, A.; Peacock, S.J.; et al. SARS-CoV-2 variants, spike mutations and immune escape. Nat. Rev. Microbiol. 2021, 19, 409–424. [Google Scholar] [CrossRef]
- Volz, E.; Mishra, S.; Chand, M.; Barrett, J.C.; Johnson, R.; Geidelberg, L.; Hinsley, W.R.; Laydon, D.J.; Dabrera, G.; O’Toole, Á.; et al. Assessing transmissibility of SARS-CoV-2 lineage B.1.1.7 in England. Nature 2021, 593, 266–269. [Google Scholar] [CrossRef]
- Mlcochova, P.; Kemp, S.A.; Dhar, M.S.; Papa, G.; Meng, B.; Ferreira, I.A.T.M.; Datir, R.; Collier, D.A.; Albecka, A.; Singh, S.; et al. SARS-CoV-2 B.1.617.2 Delta variant replication and immune evasion. Nature 2021, 599, 114–119. [Google Scholar] [CrossRef]
- Karim, S.S.A.; Karim, Q.A. Omicron SARS-CoV-2 variant: A new chapter in the COVID-19 pandemic. Lancet 2021, 398, 2126–2128. [Google Scholar] [CrossRef]
- Tagliamonte, M.S.; Mavian, C.; Zainabadi, K.; Cash, M.N.; Lednicky, J.A.; Magalis, B.R.; Riva, A.; Deschamps, M.M.; Liautaud, B.; Rouzier, V.; et al. Rapid emergence and spread of SARS-CoV-2 gamma (P.1) variant in Haiti. Clin. Infect. Dis. 2021. [Google Scholar] [CrossRef] [PubMed]
- Arora, P.; Pohlmann, S.; Hoffmann, M. Mutation D614G increases SARS-CoV-2 transmission. Signal Transduct. Target. Ther. 2021, 6, 101. [Google Scholar] [CrossRef]
- Thomson, E.C.; Rosen, L.E.; Shepherd, J.G.; Spreafico, R.; da Silva Filipe, A.; Wojcechowskyj, J.A.; Davis, C.; Piccoli, L.; Pascall, D.J.; Dillen, J.; et al. Circulating SARS-CoV-2 spike N439K variants maintain fitness while evading antibody-mediated immunity. Cell 2021, 184, 1171–1187. [Google Scholar] [CrossRef] [PubMed]
- Couch, R.B. Seasonal inactivated influenza virus vaccines. Vaccine 2008, 26 (Suppl. 4), D5–D9. [Google Scholar] [CrossRef] [Green Version]
- Bolarin, J.A.; Oluwatoyosi, M.A.; Orege, J.I.; Ayeni, E.A.; Ibrahim, Y.A.; Adeyemi, S.B.; Tiamiyu, B.B.; Gbadegesin, L.A.; Akinyemi, T.O.; Odoh, C.K.; et al. Therapeutic drugs for SARS-CoV-2 treatment: Current state and perspective. Int. Immunopharmacol. 2021, 90, 107228. [Google Scholar] [CrossRef]
- Mohapatra, S.; Nath, P.; Chatterjee, M.; Das, N.; Kalita, D.; Roy, P.; Satapathi, S. Repurposing therapeutics for COVID-19: Rapid prediction of commercially available drugs through machine learning and docking. PLoS ONE 2020, 15, e0241543. [Google Scholar] [CrossRef]
- Eberle, R.J.; Olivier, D.S.; Amaral, M.S.; Gering, I.; Willbold, D.; Arni, R.K.; Coronado, M.A. The Repurposed Drugs Suramin and Quinacrine Cooperatively Inhibit SARS-CoV-2 3CL(pro) In Vitro. Viruses 2021, 13, 873. [Google Scholar] [CrossRef]
- Loschwitz, J.; Jäckering, A.; Keutmann, M.; Olagunju, M.; Eberle, R.J.; Coronado, M.A.; Olubiyi, O.O.; Strodel, B. Novel inhibitors of the main protease enzyme of SARS-CoV-2 identified via molecular dynamics simulation-guided in vitro assay. Bioorg. Chem. 2021, 111, 104862. [Google Scholar] [CrossRef]
- Gordon, C.J.; Tchesnokov, E.P.; Schinazi, R.F.; Gotte, M. Molnupiravir promotes SARS-CoV-2 mutagenesis via the RNA template. J. Biol. Chem. 2021, 297, 100770. [Google Scholar] [CrossRef]
- Mahase, E. Covid-19: Pfizer’s paxlovid is 89% effective in patients at risk of serious illness, company reports. BMJ 2021, 375, n2713. [Google Scholar] [CrossRef] [PubMed]
- Ibrahim, M.A.; Abdelrahman, A.H.; Hussien, T.A.; Badr, E.A.; Mohamed, T.A.; El-Seedi, H.R.; Pare, P.W.; Efferth, T.; Hegazy, M.E.F. In silico drug discovery of major metabolites from spices as SARS-CoV-2 main protease inhibitors. Comput. Biol. Med. 2020, 126, 104046. [Google Scholar] [CrossRef] [PubMed]
- Barderas, R.; Benito-Pena, E. The 2018 Nobel Prize in Chemistry: Phage display of peptides and antibodies. Anal. Bioanal. Chem. 2019, 411, 2475–2479. [Google Scholar] [CrossRef] [PubMed]
- Cronan, J.E., Jr. Biotination of proteins in vivo. A post-translational modification to label, purify, and study proteins. J. Biol. Chem. 1990, 265, 10327–10333. [Google Scholar] [CrossRef]
- Santur, K.; Reinartz, E.; Lien, Y.; Tusche, M.; Altendorf, T.; Sevenich, M.; Tamgüney, G.; Mohrlüder, J.; Willbold, D. Ligand-Induced Stabilization of the Native Human Superoxide Dismutase 1. ACS Chem. Neurosci. 2021, 12, 2520–2528. [Google Scholar] [CrossRef]
- Krejci, A.; Hupp, T.R.; Lexa, M.; Vojtesek, B.; Muller, P. Hammock: A hidden Markov model-based peptide clustering algorithm to identify protein-interaction consensus motifs in large datasets. Bioinformatics 2016, 32, 9–16. [Google Scholar] [CrossRef] [Green Version]
- Schubert, M.; Nimtz, M.; Bertoglio, F.; Schmelz, S.; Lukat, P.; Heuvel, J.V.D. Reproducible and Easy Production of Mammalian Proteins by Transient Gene Expression in High Five Insect Cells. Methods Mol. Biol. 2021, 2305, 129–140. [Google Scholar]
- Meyer, S.; Lorenz, C.; Başer, B.; Wördehoff, M.; Jäger, V.; Heuvel, J.V.D. Multi-Host Expression System for Recombinant Production of Challenging Proteins. PLoS ONE 2013, 8, e68674. [Google Scholar] [CrossRef]
- Papanikolopoulou, K.; Forge, V.; Goeltz, P.; Mitraki, A. Formation of highly stable chimeric trimers by fusion of an adenovirus fiber shaft fragment with the foldon domain of bacteriophage T4 fibritin. J. Biol. Chem. 2004, 279, 8991–8998. [Google Scholar] [CrossRef] [Green Version]
- Vranken, W.; Boucher, W.; Stevens, T.J.; Fogh, R.H.; Pajon, A.; Llinas, M.; Ulrich, E.L.; Markley, J.L.; Ionides, J.; Laue, E.D. The CCPN data model for NMR spectroscopy: Development of a software pipeline. Proteins 2005, 59, 687–696. [Google Scholar] [CrossRef]
- Sevenich, M.; van den Heuvel, J.; Gering, I.; Mohrlüder, J.; Willbold, D. Conversion rate to the secondary conformation state in the binding mode of SARS-CoV-2 spike protein to human ACE2 may predict infectivity efficacy of the underlying virus mutant. bioRxiv 2021. [Google Scholar]
- Ostrov, D.A. Structural Consequences of Variation in SARS-CoV-2 B.1.1.7. J. Cell Immunol. 2021, 3, 103–108. [Google Scholar] [PubMed]
- Starr, T.N.; Greaney, A.J.; Hilton, S.K.; Ellis, D.; Crawford, K.H.; Dingens, A.S.; Navarro, M.J.; Bowen, J.E.; Tortorici, M.A.; Walls, A.C.; et al. Deep Mutational Scanning of SARS-CoV-2 Receptor Binding Domain Reveals Constraints on Folding and ACE2 Binding. Cell 2020, 182, 1295–1310. [Google Scholar] [CrossRef] [PubMed]
- Khan, A.; Zia, T.; Suleman, M.; Khan, T.; Ali, S.S.; Abbasi, A.A.; Mohammad, A.; Wei, D.Q. Higher infectivity of the SARS-CoV-2 new variants is associated with K417N/T, E484K, and N501Y mutants: An insight from structural data. J. Cell Physiol. 2021, 236, 7045–7057. [Google Scholar] [CrossRef] [PubMed]
- Zhang, L.; Jackson, C.B.; Mou, H.; Ojha, A.; Peng, H.; Quinlan, B.D.; Rangarajan, E.S.; Pan, A.; Vanderheiden, A.; Suthar, M.S.; et al. SARS-CoV-2 spike-protein D614G mutation increases virion spike density and infectivity. Nat. Commun. 2020, 11, 6031. [Google Scholar] [CrossRef] [PubMed]
- Brielle, E.S.; Schneidman-Duhovny, D.; Linial, M. The SARS-CoV-2 Exerts a Distinctive Strategy for Interacting with the ACE2 Human Receptor. Viruses 2020, 12, 497. [Google Scholar] [CrossRef] [PubMed]
- Xiong, X.; Qu, K.; Ciazynska, K.A.; Hosmillo, M.; Carter, A.P.; Ebrahimi, S.; Ke, Z.; Scheres, S.H.; Bergamaschi, L.; Grice, G.L.; et al. A thermostable, closed SARS-CoV-2 spike protein trimer. Nat. Struct. Mol. Biol. 2020, 27, 934–941. [Google Scholar] [CrossRef]
- Vauquelin, G. Effects of target binding kinetics on in vivo drug efficacy: K(off), k(on) and rebinding. Br. J. Pharmacol. 2016, 173, 2319–2334. [Google Scholar] [CrossRef] [Green Version]
- Larue, R.C.; Xing, E.; Kenney, A.D.; Zhang, Y.; Tuazon, J.A.; Li, J.; Yount, J.S.; Li, P.K.; Sharma, A. Rationally Designed ACE2-Derived Peptides Inhibit SARS-CoV-2. Bioconjugate Chem. 2021, 32, 215–223. [Google Scholar] [CrossRef]
- Panda, S.K.; Gupta, P.S.S.; Biswal, S.; Ray, A.K.; Rana, M.K. ACE-2-Derived Biomimetic Peptides for the Inhibition of Spike Protein of SARS-CoV-2. J. Proteome Res. 2021, 20, 1296–1303. [Google Scholar] [CrossRef]
- Rai, J. Peptide and protein mimetics by retro and retroinverso analogs. Chem. Biol. Drug Des. 2019, 93, 724–736. [Google Scholar] [CrossRef] [PubMed]
- Elfgen, A.; Hupert, M.; Bochinsky, K.; Tusche, M.; González de San Román Martin, E.; Gering, I.; Sacchi, S.; Pollegioni, L.; Huesgen, P.F.; Hartmann, R.; et al. Metabolic resistance of the D-peptide RD2 developed for direct elimination of amyloid-beta oligomers. Sci. Rep. 2019, 9, 5715. [Google Scholar] [CrossRef] [PubMed] [Green Version]


Publisher’s Note: MDPI stays neutral with regard to jurisdictional claims in published maps and institutional affiliations. |
© 2022 by the authors. Licensee MDPI, Basel, Switzerland. This article is an open access article distributed under the terms and conditions of the Creative Commons Attribution (CC BY) license (https://creativecommons.org/licenses/by/4.0/).
Share and Cite
Sevenich, M.; Thul, E.; Lakomek, N.-A.; Klünemann, T.; Schubert, M.; Bertoglio, F.; van den Heuvel, J.; Petzsch, P.; Mohrlüder, J.; Willbold, D. Phage Display-Derived Compounds Displace hACE2 from Its Complex with SARS-CoV-2 Spike Protein. Biomedicines 2022, 10, 441. https://doi.org/10.3390/biomedicines10020441
Sevenich M, Thul E, Lakomek N-A, Klünemann T, Schubert M, Bertoglio F, van den Heuvel J, Petzsch P, Mohrlüder J, Willbold D. Phage Display-Derived Compounds Displace hACE2 from Its Complex with SARS-CoV-2 Spike Protein. Biomedicines. 2022; 10(2):441. https://doi.org/10.3390/biomedicines10020441
Chicago/Turabian StyleSevenich, Marc, Elena Thul, Nils-Alexander Lakomek, Thomas Klünemann, Maren Schubert, Federico Bertoglio, Joop van den Heuvel, Patrick Petzsch, Jeannine Mohrlüder, and Dieter Willbold. 2022. "Phage Display-Derived Compounds Displace hACE2 from Its Complex with SARS-CoV-2 Spike Protein" Biomedicines 10, no. 2: 441. https://doi.org/10.3390/biomedicines10020441