Article

Carbon, Nitrogen and Water Footprints of Organic Rice and Conventional Rice Production over 4 Years of Cultivation: A Case Study in the Lower North of Thailand

1
Faculty of Environment and Resource Studies, Mahidol University, Nakhon Pathom 73170, Thailand
2
Hydro-Informatics Innovation Division, Hydro Informatics Institute, Bangkok 10400, Thailand
3
State Key Joint Laboratory of Environment Simulation and Pollution Control (SKLESPC), School of Environment, Tsinghua University, Beijing 100084, China
4
Tsinghua-Rio Tinto Joint Research Centre for Resources, Energy and Sustainable Development, Beijing 100084, China
5
Laboratory of Soil Science, Graduate School of Agriculture, Hokkaido University, Sapporo 060-8589, Japan
*
Author to whom correspondence should be addressed.
Agronomy 2022, 12(2), 380; https://doi.org/10.3390/agronomy12020380
Submission received: 11 December 2021 / Revised: 14 January 2022 / Accepted: 1 February 2022 / Published: 3 February 2022

Abstract

:
An integrated method is required for comprehensive assessment of the environmental impacts and economic benefits of rice production systems. Therefore, the objective of this study was to apply different footprinting approaches (carbon footprint (CF), nitrogen footprint (NF), water footprint (WF)) and determine the economic return on organic rice farming (OF) and conventional rice farming (CVF) at the farm scale. Over the 4-year study period (2018–2021), the results showed lower net greenhouse gas (GHG) emissions in OF (3289.1 kg CO2eq ha−1 year−1) than in CVF (4921.7 kg CO2eq ha−1 year−1), indicating that the use of OF can mitigate the GHG emissions from soil carbon sequestration. However, there was a higher CF intensity in OF (1.17 kg CO2eq kg−1 rice yield) than in CVF (0.93 kg CO2eq kg−1 rice yield) due to the lower yield. The NF intensities of OF and CVF were 0.34 and 11.94 kg Neq kg−1 rice yield, respectively. The total WF of CVF (1470.1 m3 ton−1) was higher than that in OF (1216.3 m3 ton−1). The gray water in CVF was significantly higher than that in OF due to the use of chemical fertilizers, herbicides, and pesticides. Although the rice yield in OF was nearly two times lower than that in CVF, the economic return was higher due to lower production costs and higher rice prices. However, more field studies and long-term monitoring are needed for future research.

1. Introduction

With approximately 10–12% in carbon dioxide equivalents (CO2eq), agriculture—mainly rice cultivation—is part of global greenhouse gas (GHG) emissions and is a major anthropogenic source of atmospheric methane (CH4) [1,2]. Global fertilizer usage has increased from 32 to 106 Mt year−1 (+331%) since the Green Revolution in the 1950s, leading to an increase in nitrous oxide (N2O) emissions since then. Moreover, farming activities contribute to carbon dioxide (CO2) emission in the field from the use of fossil fuels [2]. Thus, GHG emissions from the agricultural sector are a non-negligible part of global warming that has caused serious environmental problems.
Thailand is one of the world’s major producers and exporters of rice (Oryza sativa L.) and was ranked as the sixth-largest rice producer in the world, producing about 25.31 million tons in the 2020/2021 season [3]. As reported in several studies (e.g., Ding et al. [4]; Pandey and Agrawal, [5]; Arunrat et al. [6]; Maraseni et al. [7]), rice cultivation requires continuous flooding, which causes an anerobic condition in paddy fields, leading to CH4 generation by methanogenic bacteria. Nitrogen fertilizer is commonly used in conventional rice farming (CVF) to enhance plant growth and increase rice yield. Farming activities (e.g., transportation, tillage, planting, spraying, water pumping, and harvesting) involve using fossil fuels that generate CO2 from combustion. After harvest, rice straw and stubble are left on the ground to decay or burned to ashes and are thus likely to produce CH4, N2O, and CO2. Organic rice farming (OF) has been promoted in many counties. This is because it stores more carbon in the soil, using no synthetic fertilizers, pesticides, and herbicides as well as avoiding rice residue burning, leading to net GHG emission reduction compared with CVF [8,9]. However, most studies have shown a lower average yield in OF than in CVF [10,11,12]. Moreover, rice production always requires water, whether as rainfall, irrigation, or groundwater, while water scarcity requires consideration of water-use efficiency and the maintenance of water quality [13]; yet the comparison between OF and CVF is still limited. Beyond the abovementioned issues, rice cultivation is closely linked to farmers’ income, which means a reduction in their incomes can negatively affect their livelihoods, especially if the low yield in OF would generate lower income compared with CVF. When considering these challenges, the need for an integrated assessment of rice production is crucial. Sustainable management should consider the environmental impact of GHG emissions while emphasizing water use efficiency, and the economic benefits should not be ignored.
In seeking sustainable management and combatting climate change, the “footprint family” could be beneficial for integrated assessment indicators. The carbon footprint (CF), water footprint (WF), and nitrogen footprint (NF) have been developed to understand how human activities exert pressure on the environment. The CF is expressed as a quantity of CO2eq, which corresponds to the sum of each GHG contribution to global warming [14]. The WF is an indicator for measuring the volume of direct and indirect water use in the life cycle of a product, consisting of green, blue, and gray WFs [15]. Green WF refers to the amount of rainwater that is stored in the soil and evaporated, transpired, or consumed by plants during cultivation. Blue WF indicates the consumption of water from rivers, lakes, and groundwater, and gray WF represents the consumption of freshwater to assimilate a load of pollutants and meet water quality standards [16,17,18,19]. In addition, the NF is a new footprint concept that was introduced after the concepts of ecological footprint, CF, and WF. The NF was developed to quantitatively assess the influence of human production and lifestyle on reactive nitrogen (Nr), all nitrogen species (N2O, ammonia [NH3] volatilization, and nitrate leaching) except N2 emissions to the environment per ton of products [20,21,22].
Soils have the potential to reduce the increase in the atmospheric CO2 concentration by capturing CO2 into plants and soil [23]. Rice fields have been reported as a high potential source of soil carbon sequestration [24,25] via incorporation of crop residues, direct manure and compost application, growing crop rotation, minimum/no tillage, and application of organic fertilizers [24,26,27]. These have led to increased attention on OF, motivated by the expected lower risks from negligible chemical inputs and reduction in net GHG emissions [12,28]. The number of OF and cultivation areas are quite small due to the lower average yield obtained than when using synthetic fertilizers, pesticides, and herbicides, but OF has lower production costs than CVF. Reganold and Wachter [10] and Willer et al. [29] reported that around 1% of global agricultural area is covered by organic farms, and this figure rises to slightly >1% in several developed countries. In Thailand, there is a project to promote organic rice production for 160,000 ha during 2017–2021 and help farmers obtain the organic rice standard from the Ministry of Agriculture and Cooperatives. Although the goal of 160,000 ha of organic rice represents approximately 2% of the total rice cultivation area in Thailand [30], it indicates an increase in the total organic rice area compared to the past few years. Thus, the development of a rice production system with low environmental impacts and high agronomic benefits is needed, and a new integrated method of comprehensive assessment should be adopted. However, there is limited research considering more than two members of the footprint family for rice production in combination with an economic perspective. Therefore, the objective of this study was to apply the different footprinting approaches (CF, NF, WF) and determine the economic return on OF and CVF at the farm scale.

2. Materials and Methods
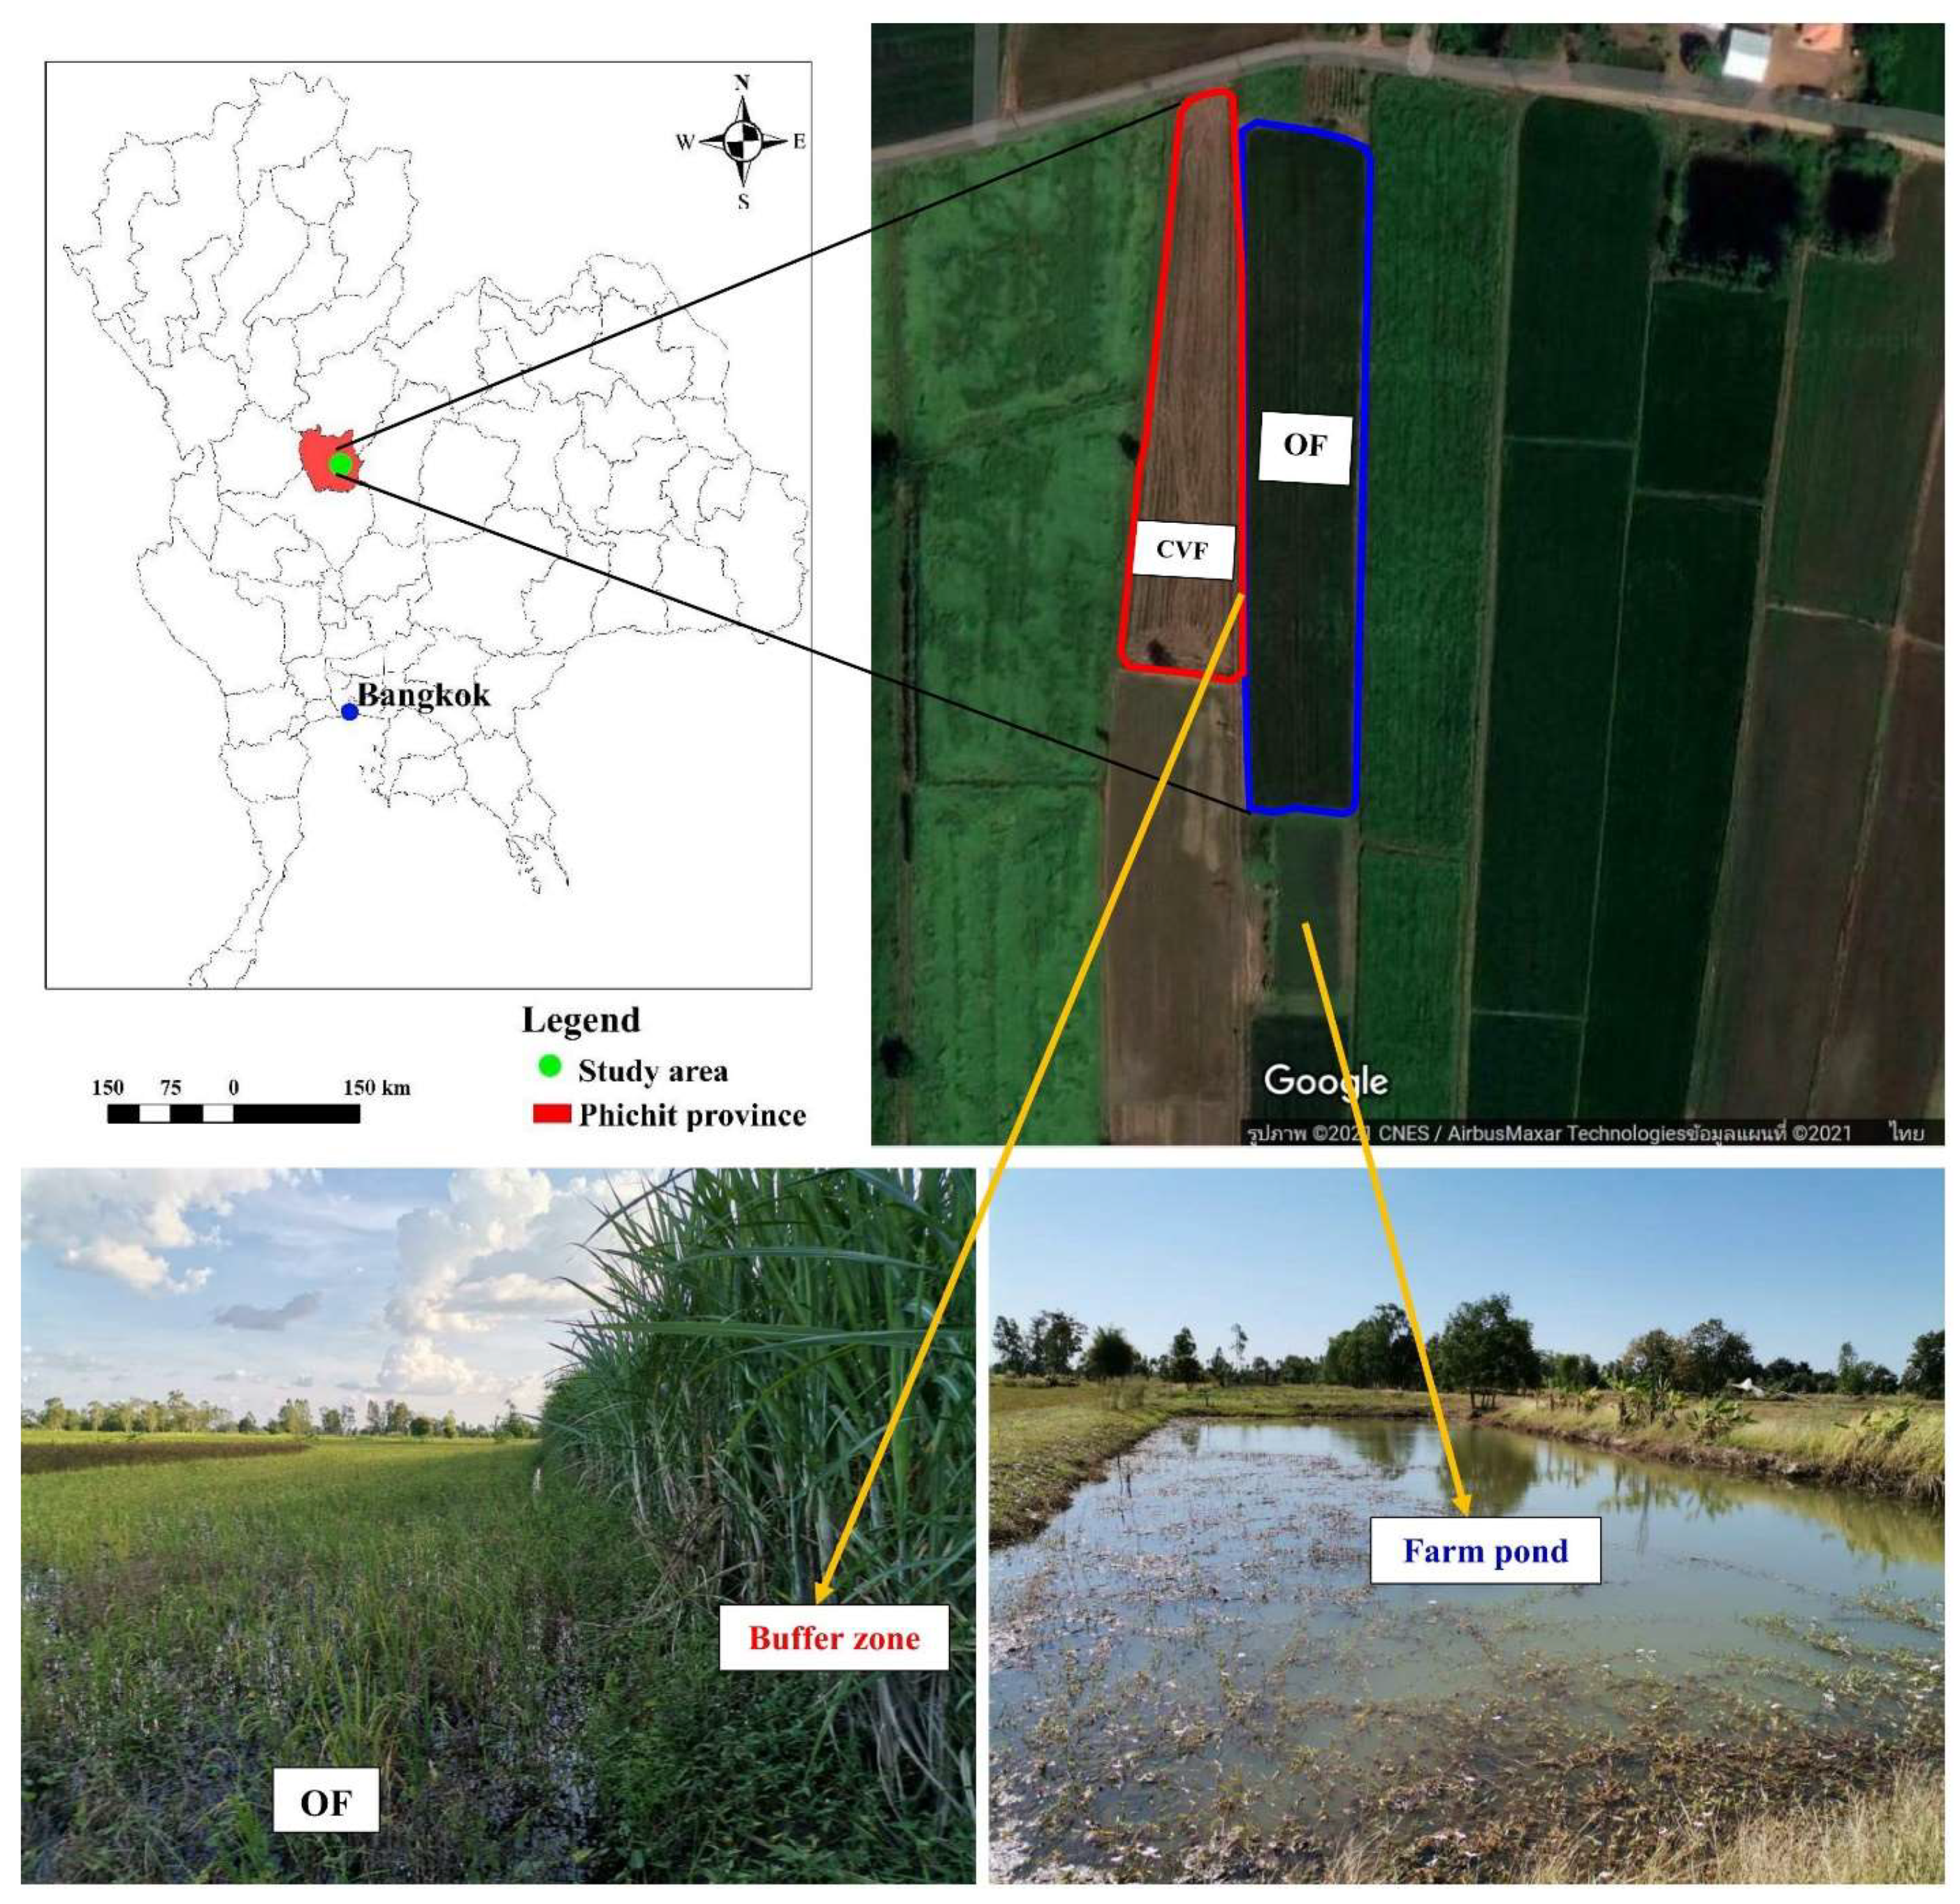
2.1. Study Sites

Soil organic carbon (SOC) sequestration was not considered in CF estimation by many studies due to a lack of data and the requirement for long-term investigation. Meanwhile, several studies [23,31,32,33,34] have asserted that accounting for SOC sequestration in the CF estimation can increase the accuracy of the net CF estimation, which supports effective policy and individual decision-making to reduce GHG emissions or sequester more carbon. Therefore, SOC sequestration was accounted in the present study, which added important insights into the estimation of the CF of rice production.
Both organic and conventional rice farming were conducted in the farmer’s field over 4 years of cultivation (2018–2021) to reduce the uncertainty of data. These fields were good representatives under identical soil texture and differed only in the management practices of typical conventional and organic systems. Furthermore, conducting the study in the farmer’s own fields and allowing them to manage all farming practices in the usual way provided a realistic view of the farmer’s management practices. Thus, the organic rice farm (wet rice farming) at the Samnak Khun Nen Subdistrict, Dong Charoen District, Phichit province was monitored and the data collected there (16°04′04.1″ N, 100°32′31.1″ E, Figure 1). This farm has been producing organic rice for more than 10 years and was first certified by the International Federation of Organic Agriculture Movements (IFOAM) in 2016 and EU/USDA Organic Standards in 2018. The farmer grows the “Riceberry” rice variety once a year from August to December (120 days). For a fair comparison, a conventional rice farm (wet rice farming) (16°04′04.5″ N, 100°32′29.8″ E) was monitored and investigated as the comparison site (Figure 1). This farm can also grow rice once a year (from August to November) by choosing the “RD41” (105 days), “RD57” (110 days), or “RD79” (115 days) rice varieties.
According to the IFOAM and EU/USDA organic regulations, a buffer zone sufficient to prevent contamination from adjacent areas must be present. In this study site, sugarcane was planted as a 2 m-wide buffer zone to prevent contact with prohibited substances applied to the conventional field. The water sources used on an organic farm must be free of contaminants from natural, irrigated, and non-organic fields, so the organic farm must be built with a farm pond to store the water before it drains into the organic field (Figure 1).

2.2. Data Collection

2.2.1. Farm Management Practice Data

Data on farm management practices in four crop years (2017/2018–2020/2021) were obtained from the owner of organic rice and conventional rice farms. The farmers were requested to record all management practices throughout the crop year of rice production in personal notebooks. The quantities of agricultural inputs were recorded, including rice seeds, organic materials, chemical fertilizers, insecticides, herbicides, diesel and gasoline fuels, transportation (type of vehicle, distance, and fossil fuel used), harvest, paddy rice yield, and post-harvest. Moreover, the exact dates and months of all activities (land preparation, sowing, transplanting, applying chemical fertilizers, insecticides, herbicides, and bio-fermented juice, water pumping, and harvesting) were recorded and collected.

2.2.2. Soil Sampling and Analysis

Soil was sampled from both farms at 0–30 cm depth after the harvest in four consecutive years (2018–2021). At each farm, soil samples were randomly gathered from five pits. At each pit, soil samples were collected in three replications. The soil bulk density was taken using a soil core (5.0 cm width × 5.5 cm length) and was then measured after drying in an oven at 105 °C for 24 h. All soil samples were air dried at room temperature for 7 days; then, they were crushed and passed through a 2 mm sieve.
Soil particles size (soil texture) was determined by using a hydrometer. The electrical conductivity (ECe) was determined by using an EC meter following preparation of the saturated soil extracts (1:5) [35]. Soil pH was measured in a 1:1 soil-to-water mixture using a pH meter [36]. The molybdate blue method (Bray II extraction) was used to analyze the available phosphorus (Avail. P) [37]. The available potassium (Avail. K), calcium (Avail. Ca), and magnesium (Avail. Mg) were determined by atomic absorption spectrometry (NH4OAc extraction) [38]. Organic carbon (OC) was analyzed following the description of Walkley and Black [39].

2.2.3. Soil Organic Carbon Calculation

Equations (1) and (2) were used to calculate the SOC stock.
SOC30 cm = (φ × OC × L) × 1000 
SOCS 30   cm = SOCS 2021 SOCS 2018 3 × 44 12
where SOC30 cm is soil organic carbon stock (kg C ha−1); φ is soil bulk density (g cm−3); OC is organic carbon content (%); L is soil thickness (cm); SOCS 30   cm   is the annual amount of SOC at a depth of 30 cm (kg CO2eq ha−1 year−1); SOCS 2021 and SOCS 2018 are the amounts of SOC stock (kg C ha−1) in 2021 and 2018, respectively, 30 cm is the total soil depth in this study, and 44/12 is the coefficient for converting C into CO2.
In this study, the soil thickness (cm) was adjusted by using the equivalent soil mass method to reduce the error in carbon stock calculation due to farming activities over time. The soil mass values at the beginning were in 2018, and at the end, they were in the year 2021. The equation is presented below [40]:
Soil   mass =   φ ×   L
where soil   mass is the mass of soil sample (kg soil m−2). After determining soil thickness, the SOC stock was calculated using Equations (1) and (2), respectively, to obtain the equivalent soil mass.

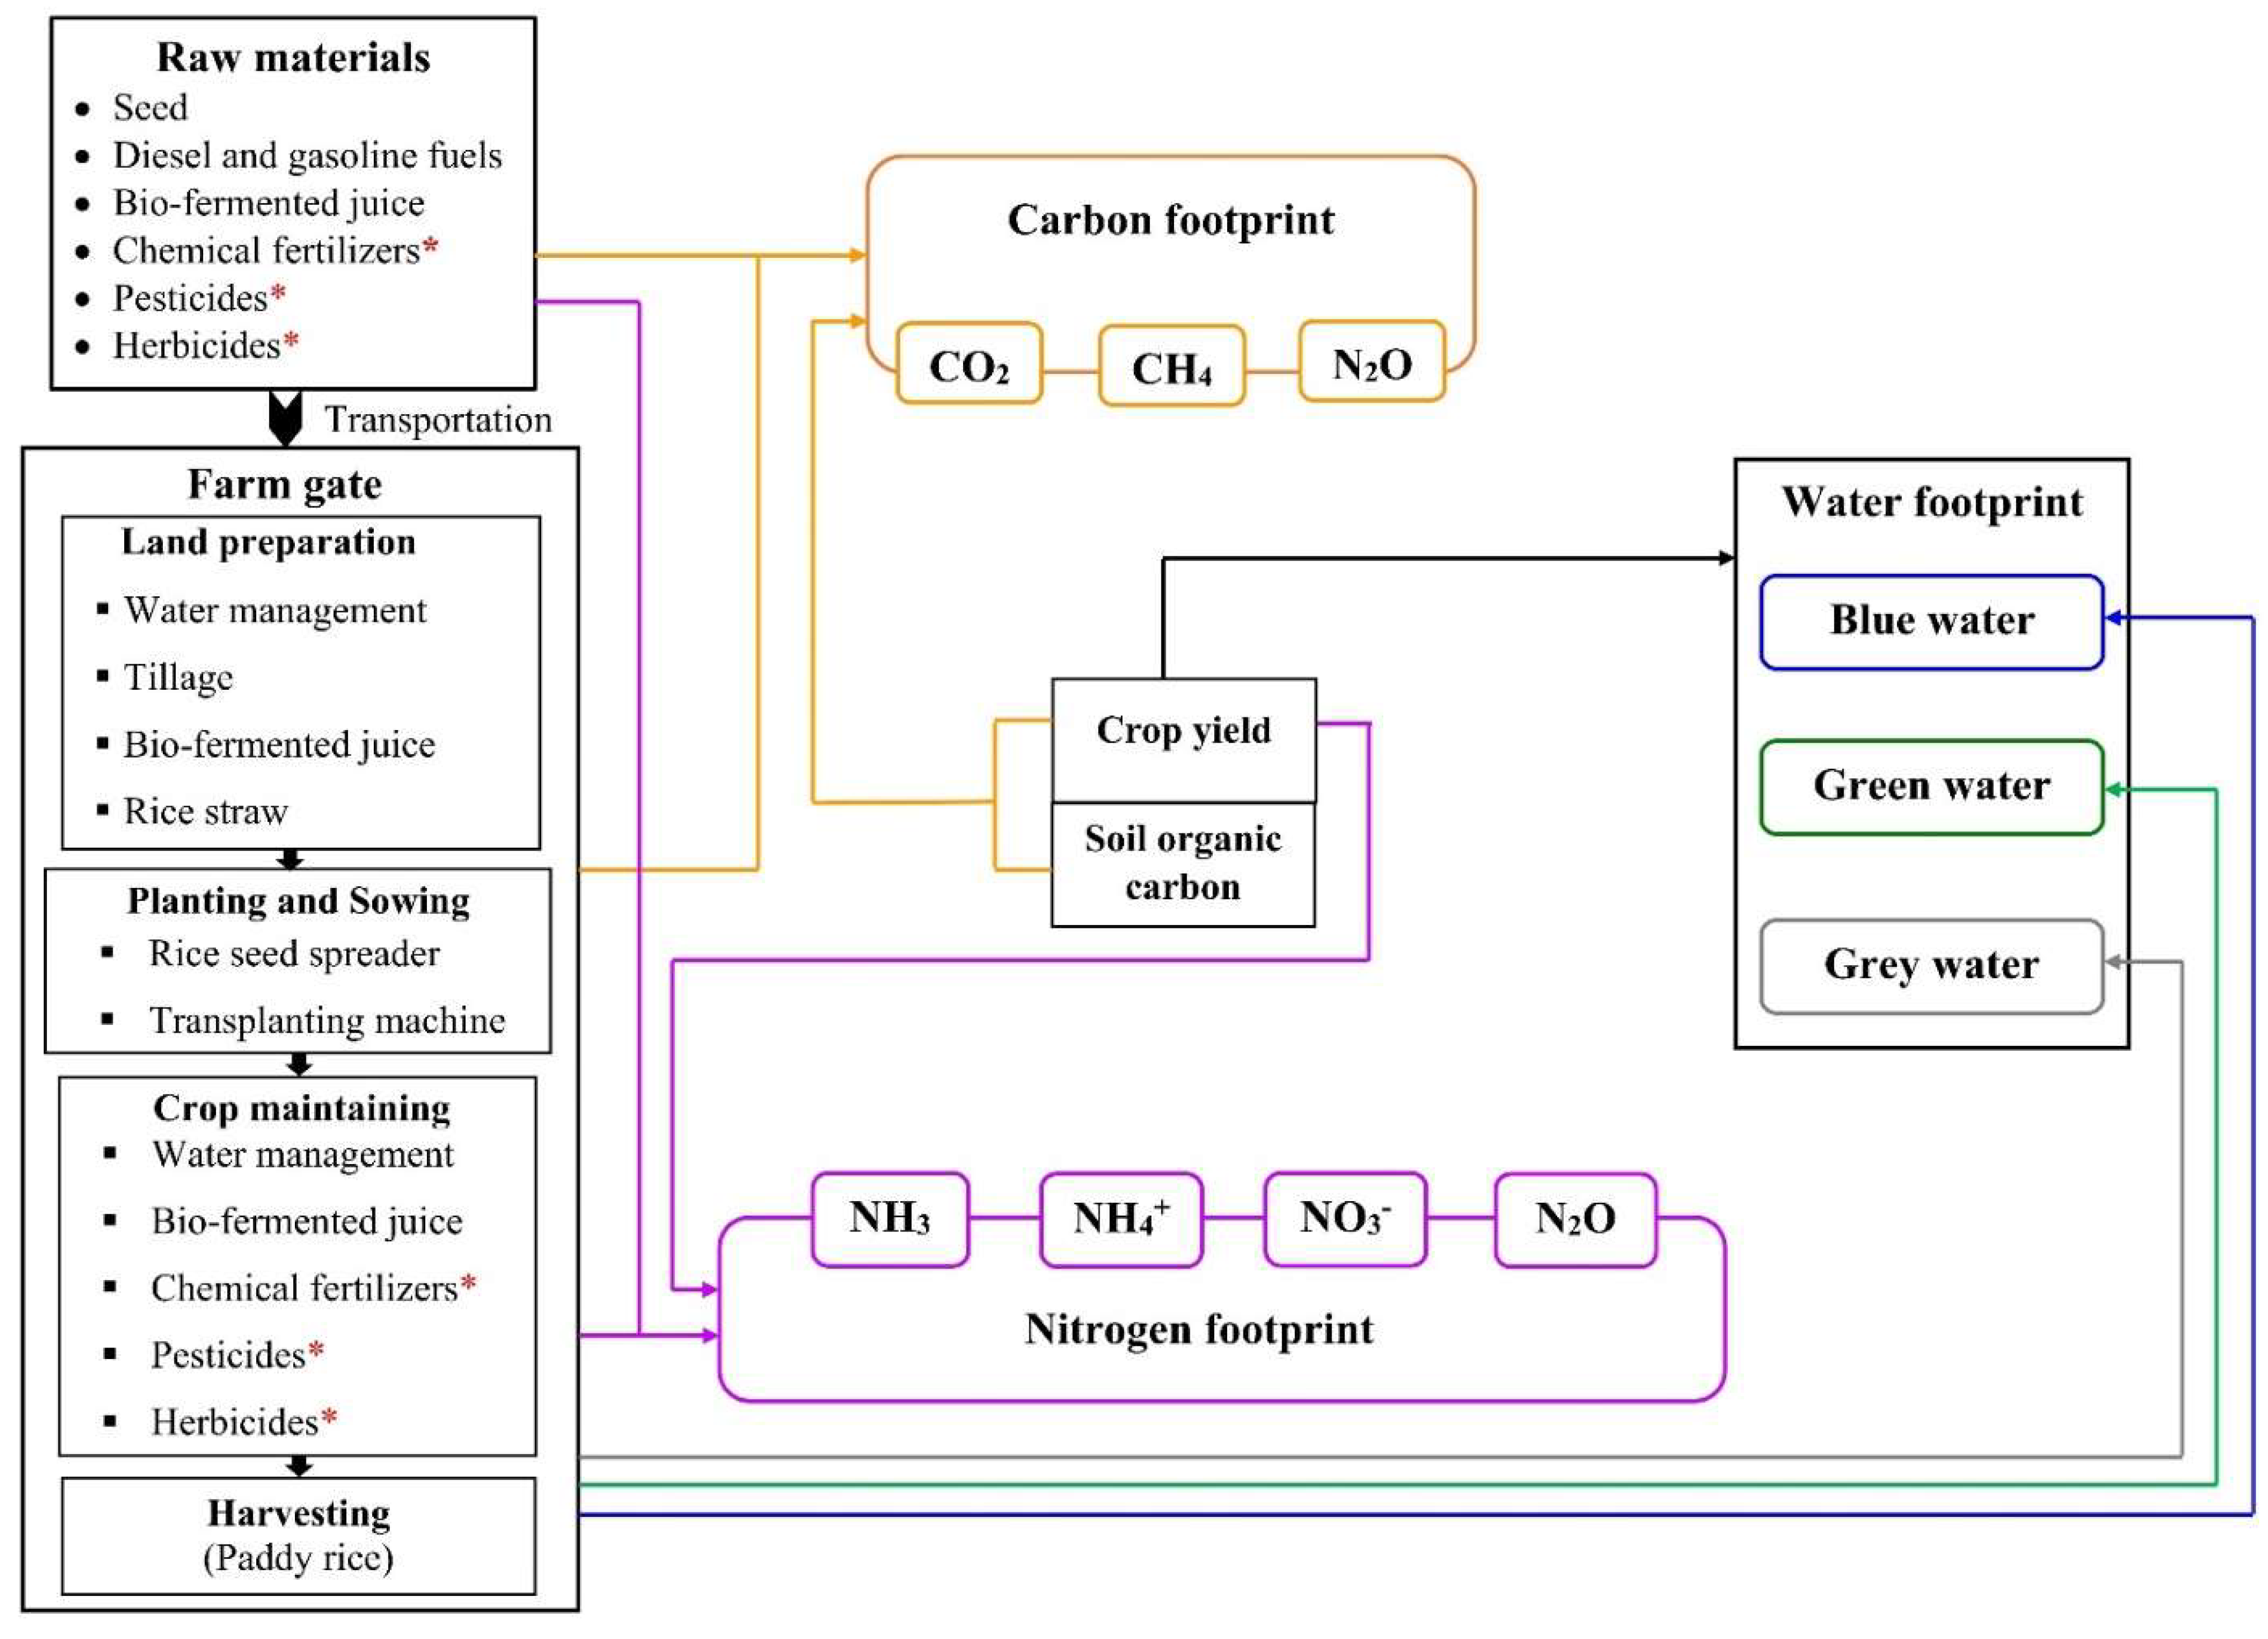
2.3. System Boundary and Functional Unit

The CF and NF were calculated based on the 2019 Refinement to the 2006 IPCC Guidelines for National Greenhouse Gas Inventories [41]. Moreover, the life cycle assessment of products from the cradle to the gate was used and considered in four stages: raw material production, transportation, field emissions, and harvesting (Figure 2). The CO2, CH4, and N2O emissions were expressed in the form of CO2eq. The radiative forcing potential relative to CO2 was 28 for CH4 and 265 for N2O [42]. Meanwhile, the NF was considered NH3 volatilization, N2O emission, NO 3 and NH 4 + leaching. The functional unit of CF is expressed as kg CO2eq ha−1 year−1 and kg CO2eq kg−1 rice yield, while kg Neq ha−1 year−1 and kg Neq kg−1 rice yield are defined as the functional units of NF.

2.4. Carbon Footprint Calculation

The equations were provided by the 2019 Refinement to the 2006 IPCC Guidelines for National Greenhouse Gas Inventories [41] as follows:
CFI = CE total Δ SOCS 30   cm Y
CE total = GHG raw   material + GHG transportation + GHG utilization + GHG CH 4 + GHG N 2 O
where CFI is the carbon footprint intensity (kg CO2eq kg−1 rice yield), CEtotal is the total GHG emissions throughout the entire process of rice production from cradle to gate (kg CO2eq ha−1 year−1), Y is the rice yield (kg ha−1 year−1), GHG raw   material is GHG emissions during the production of raw material (kg CO2eq ha−1 year−1), GHG transportation is GHG emissions during transportation (kg CO2eq year−1), GHG utilization is GHG emissions during the utilization phase of agricultural input (kg CO2eq ha−1 year−1), GHG CH 4 is the methane emissions from rice cultivation (kg CH4 ha−1), and GHG N 2 O is the direct N2O emissions from paddy fields during rice cultivation (kg N2O ha−1). All the emission factors used were from the 2019 Refinement to the 2006 IPCC Guidelines for National Greenhouse Gas Inventories [41], The National Technical Committee on Product Carbon Footprinting (Thailand) [43], TGO [44], EPA [45], The National Technical Committee on Product Carbon Footprinting (Thailand) [46], Ecoinvent Centre [47], and Maciel et al. [48], which are provided in the Supplementary Material.

2.5. Nitrogen Footprint Calculation

In this study, NF was used to characterize the eutrophication potential that is released into the air, water and soil [49] and evaluate the Nr emission and losses during the entire process of rice production from cradle to gate according to ISO 14044 [50]. The formulas used in these calculations were as follows:
NFI = NE total Y
where NFI is nitrogen footprint intensity (g Neq kg−1 rice yield), NEtotal is the total Nr emission throughout the entire process of rice production from cradle to gate (g Neq ha−1 year−1), and Y is the rice yield (kg ha−1 year−1).
NE total = NE inputs + NV NH 3 + NE N 2 O + NL NO 3 + NL NH 4 +
NE inputs = i Q used i × Υ i
where NE inputs is the indirect total amount of Nr emissions using agricultural input (g Neq ha−1 year−1), Q used i is the amount of agricultural input type i used (kg ha−1 year−1), and Υ i is the emission factor of the agricultural input type i (g Neq ha−1 year−1). Due to Υ i values being unavailable in Thailand as yet, the specific emission factors ( Υ i ) from IKE eBalance v3.0 (IKE Environment Technology CO., Ltd., Chengdu, China) were used in this study.
The Nr emissions and losses from the field included NH3 volatilization and N2O emission as well as NO 3 and NH 4 + leaching, which were calculated by multiplying the pure amount of N used with the relative loss coefficient and then converting to the eutrophication potential values according to the following Equations (9)–(12).
NV NH 3 = N   ×   φ   × 17 14 × 0.833 × 1000
NE N 2 O = N   × × 44 28 × 0.476 × 1000
NL NO 3 = N   ×   ε   × 62 14 × 0.238 × 1000
NL NH 4 + = N   ×   σ   × 18 14 × 0.786 × 1000
where NV NH 3 is the volatilization loss of NH3 due to N application (g Neq ha−1 year−1); NE N 2 O is the cumulative amount of direct N2O emission due to fertilizer applications (g Neq ha−1 year−1); NL NO 3 is the rate of NO 3 leaching (g Neq ha−1 year−1); NL NH 4 + is the rate of NH 4 + leaching (g Neq ha−1 year−1); φ is the coefficient of NH3 volatilization loss (0.338); ∅ is the emission factor of N2O emission due to N application (0.003 kg N2O-N kg−1 of N for continuous flooding); φ is the coefficient of NO 3   leaching (0.305); σ is the coefficient of NH 4 +   leaching (0.339); 17/14, 44/28, 62/14, and 18/14 are the molecular weight ratios of NH3 to NH3-N, N2O to N2O-N, NO 3 to NO 3 - N , and NH 4 + to NH 4 + - N , respectively. The values of 0.833, 0.476, 0.238, and 0.786 are eutrophication potential factors of NH3 (kg Neq kg−1 of NH3), N2O (kg Neq kg−1 of N2O), NO 3 (kg Neq kg−1 of NO 3 ), and NH 4 + (kg Neq kg−1 of NH 4 + ), respectively, and 1000 is a unit conversion factor (g kg−1). In this study, the eutrophication potential factors were obtained from Guinée et al. [51] based on the CML2002 methodology. The nitrogen percentages of agricultural residues were obtained from Arunrat et al. [27].

2.6. Water Footprint Calculation

The total WF in the rice-growing process (WFtotal, m3 ton−1) is the sum of green, blue, and gray water [52,53,54], as in Equation (13).
WF total =   WF green +   WF blue +   WF grey  
The green WF and blue WF are calculated using in Equations (14) and (15), respectively.
WF green = CWU green Y = 10 × d = 1 lgp ET green Y
WF blue = CWU blue Y = 10 × d = 1 lgp ET blue Y
ET green =   min   ( ET c ,   P eff )  
ET blue =   max   ( 0 ,   ET c P eff )
where CWU is crop water use (m3 ha−1), ETgreen is evapotranspiration of green water (mm day−1), ETblue is evapotranspiration of blue water (mm day−1), lgp is the growing period, Y is rice yield (ton ha−1 year−1), Peff is the effective rainfall available, and ETc is the crop evapotranspiration. The “0” value is considered when Peff exceeds crop evapotranspiration. Evapotranspiration was calculated using the CROPWAT 8.0 model.
The gray WF (WFgray, m3 ha−1) was calculated using Equation (18) [55]:
WF grey = α × ( x = 1 n N + ON ) ( C max C nal ) / Y
where α is the fraction of leaching-runoff (nitrogen = 0.1, IPCC [56]), ON is the organic amendment rate (kg N ha−1), Cmax is the maximum acceptable concentration of a load of pollutant (NO3-N < 5 mg L−1, Pollution Control Department [57]), and Cnal is the natural N concentration (Cnal = 0 kg m−3).

2.7. Calculation of Economic Return and CF, NF, and WF Per Net Return

The net returns from rice production of organic rice and conventional rice farms were calculated by subtracting the total costs throughout rice production processes from the total benefit of selling paddy rice each year. The CF, NF, and WF per net returns were calculated according to the equations by Yang et al. [58] and Wang et al. [59].
CF E = CE total Δ SOCS 30   cm R net
NF E = NE total R net
WF E = WF total R net
where CFE, NFE, and WFE are the CF, NF, and WF per net return in units of kg CO2eq THB−1 year−1, g Neq THB−1 year−1, and m3 THB−1 year−1, respectively, and Rnet is the net economic return (THB ha−1 year−1).

2.8. Statistical Analysis

The analyses were performed using SPSS (v. 20.0). T-tests and least significant difference (LSD) tests (p < 0.05) were performed to identify differences in soil properties (CF, SOC, NF, WF, CFE, NFE, and WFE) between OF and CVF.

3. Results and Discussion

3.1. Input Inventory Analysis and Soil Physical and Chemical Properties

The amounts of rice seeds needed and the gasoline used were significantly different between OF and CVF. The OF method used fewer rice seeds than the CVF one due to use of the transplanting method, while the broadcasting method was commonly used for CVF. Gasoline consumption was high in CVF compared with OF. This is because the spreader machine was used several times to spread fertilizer, herbicides, and insecticides during the crop maintenance stage. Significant differences in the diesel used and the remaining rice straw were not detected between OF and CVF. The bio-fermented juice was only applied in OF, not in CVF, because bio-fermented juice was the main material input providing the nutrients for crop growth. Unlike in OF, the nutrients in CVF mainly came from chemical fertilizers. Clearly, the OF used much lower material inputs than the CVF (Table 1). This is consistent with the studies of Bennett and Franzell [60] and Arunrat et al. [12], who revealed that organic agriculture has not only improved the livelihoods of farmers but also minimized the external input.
The soil textures of both sites were silty clay with 8.5–16.3% sand, 43.3–47.3% silt, and 40.4–46.62% clay content. The differences in the sand, silt, and clay contents were not significant between OF and CVF. Soil bulk density (BD) ranged from 1.35 to 1.36 g cm−3 and from 1.37 to 1.40 g cm−3 for OF and CVF, respectively. Although the values of BD in OF and CVF were not significantly different, the BD in OF was slightly lower than that in CVF. Soil pH values were 5.38–5.6 and 5.03–5.54 for OF and CVF, respectively, and a significant difference was not detected. The available P values were not significantly different between OF and CVF, with an overall range of 11.69–18.96 mg kg−1. The available K, available Ca, and available Mg values were found to have significant differences between OF and CVF in some years, ranging from 107.96 to 188.53, 1564.0 to 3770.4, and 100.31 to 274.65 mg kg−1, respectively. The ECe values ranged from 0.25 to 0.49 dS m−1. Interestingly, organic matter (OM) was significantly different between OF and CVF. Higher OM was found in OF than in CVF: 3.16–3.20% vs. 2.75–2.82%, respectively (Table 2).
Although there was an insignificant difference in pH between OF and CVF, the pH in OF was slightly higher than that in CVF (Table 2). This is because using chemical fertilizers decreased the soil pH. This is consistent with the study of Sun et al. [61], who mentioned that the long-term use of chemical fertilizers could significantly reduce the soil pH, resulting in decreased bacterial diversity in the soil. Moreover, the transformation of nitrogen fertilizer into different forms influences soil acidification, which depends on the type of nitrogen, the soil buffering capacity, and the net balance of proton-generating and consuming processes [62]. On the other hand, applying organic fertilizer or organic materials can alleviate these negative effects in the long term [63]. This is also supported by the studies of Rukshana et al. [64] and Sun et al. [61], who reported that the alkalinity of livestock manures could enhance the soil pH and prevent negative effects on soil bacteria. Similar to the soil pH, the BD in OF was a little lower than that in CVF (Table 2). This can be explained by the practice of organic rice farming, where retaining and incorporating rice residue in the soil decreases BD. In this study, the rice residue in OF has been retained in the rice field for more than 10 years, while the rice residue in CVF was removed or burnt in some years. Gathala et al. [65] reported that crop residue retention can improve soil quality and decrease bulk density due to increasing OM, resulting in soil compaction reduction and crop root growth enhancement [66,67]. It was found in the present study that the OM in OF was higher than that in CVF (Table 2). OM is an important factor in providing the necessary nutrient elements for plants; it enhances the activity of soil microorganisms, loosens the soil structure, decreases BD, and increases the cation exchange capacity [68].

3.2. Soil Organic Carbon Stock of OF and CVF

The SOC stocks were significantly higher in OF than in CVF from years 2018 to 2021. The ΔSOCS stocks increased by 147.3 kg C ha−1 year−1 (539.9 kg CO2eq ha−1 year−1) in OF, while the annual SOC stock value in CVF increased by 86.3 kg C ha−1 year−1 (316.3 kg CO2eq ha−1 year−1), as shown in Table 3. Thus, the increase in SOC is an effective measure to mitigate CO2 emissions, contributing to climate change mitigation through carbon fixation into the soil. Hiederer and Köchy [69], estimated the global SOC stocks at a 1 m depth, which contained 1206 Pg C (574 and 632 Pg C for the earth’s topsoil [0–30 cm] and subsoil [30–100 cm], respectively). It was greater than the atmospheric carbon stock (800 Pg C) [70]. This indicated that a small increase in SOC stock can play a crucial role in GHG reduction in the atmosphere [71]. Most of the agricultural soil carbon pool is an active carbon pool, which is important for crop productivity and the soil carbon cycle [23]. As shown in Table 3, both types of rice cultivation have the potential to sequester soil carbon in paddy soils. Indeed, Pan et al. [24] and Pan et al. [72] proved that paddy soils have higher potential than croplands. The SOC stock was higher in OF than in CVF (Table 3). This is because adding the bio-fermented juice and carbon inputs from the turnover of roots, return of rice residue, root exudates, and rhizodeposits helps to increase SOC sequestration [73,74,75].
It should be noted that changing land management practices from CVF to OF can increase soil carbon sinks, but the soil carbon level may decrease at the beginning if there is an intensive disturbance (e.g., intensive tillage, elimination of all rice residues, and removal of topsoil). Moreover, the rate of carbon removal from the atmosphere into the soil decreases with time because a new equilibrium is reached [76]. Paustian [77] and IPCC [78] stated that IPCC used a figure of 20 years for soil carbon to reach a new equilibrium in the IPCC good practice guidelines for GHG inventories. This implies that nearly 20–30 years after a land use change, the capacity of the soil to stock further quantities of carbon is near zero and may begin to decline if the soils are significantly disturbed. Therefore, implementation of soil carbon sequestration measures should be considered within a broader framework of sustainable development and possible policy implications [76,79].

3.3. Greenhouse Gas Emissions and Carbon Footprint of OF and CVF

The rice yield in CVF was nearly two times higher than that in OF (Table 4). This was due to the use of chemical fertilizers, which enhances crop growth and maintains the crop yield better than the use of bio-fermented juice. Moreover, herbicide and insecticide application in CVF is more efficient at protecting and eliminating weeds and diseases than the application of bio-fermented juice in OF, leading to less reduction in the rice yield in CVF. With the higher material input in CVF than in OF, the total GHG of CVF was significantly higher than that in OF, with values of 5238.0 and 3829.0 kg CO2eq ha−1 year−1, respectively. In the raw material production stage, significant differences in GHG emissions between OF and CVF were found for rice seeds, gasoline, and diesel production. Chemical fertilizer production of CVF generated the highest GHG emissions in this stage, with a value of 884.2 kg CO2eq ha−1 year−1. Throughout the life cycle of rice production, rice planting until the harvesting period is the largest stage of GHG emissions, especially CH4 emission. No significant difference was found for CH4 emissions between OF (2932.2 kg CO2eq ha−1 year−1) and CVF (2876.8 kg CO2eq ha−1 year−1). GHG emissions from gasoline, diesel, and direct N2O in CVF were significantly higher than those in OF, especially direct N2O. This is mainly due to N2O emissions emitted from the chemical fertilizers used. Notably, net GHG emissions in OF (3289.1 kg CO2eq ha−1 year−1) were significantly lower than those in CVF (4921.7 kg CO2eq ha−1 year−1), indicating that organic farms can mitigate the net GHG emissions with soil carbon sequestration; see Table 4.
The higher the agricultural inputs consumed, the higher the GHG emissions [80,81,82], which was the case in our study where the total GHG emissions were significantly higher in CVF than in OF (Table 4). The chemical fertilizers and fossil fuels in both raw material production and utilization phases were detected as the second and third hotspots of GHG emissions in CVF (Table 4). Obviously, the CVF used a high amount of chemical fertilizers, whereas they were not used in OF. This is consistent with the study of Zhang et al. [83] and Arunrat et al. [6], who reported that nitrogen fertilizer production dominated GHG emissions. Moreover, there was a higher frequency of use of a diesel water pump in CVF for draining the water from the natural ditch into the paddy field, while in OF the personal water pond was drained by gravity, or the diesel water pump used only a few times per year. The first hotspot of GHG emission was CH4 emission in both OF and CVF (Table 4). Dubey [84], Yu et al. [85], and Yan et al. [86] explained that CH4 was produced by methanogenic bacteria under obligate anaerobic conditions with a low soil Eh. Alam et al. [87] and Bacenetti et al. [88] estimated that CH4 was the main hotspot and contributed approximately 60% of total GHG emissions of rice production. In our study, the farmers of both farms preferred to grow rice under continuously flooded conditions because this practice prevents weed growth and water stress conditions in paddy fields. Higher CH4 emission was found in OF than in CVF, but lower N2O emissions were seen along with lower GHG emissions from herbicide and pesticide usage (Table 4). Kanter and Searchinger [89] analyzed metadata and reported that enhanced-efficiency fertilizers, using nitrification inhibitors and polymer coatings, could reduce N2O emissions and nitrogen leaching by approximately 25–60%. Meanwhile, Fan et al. [90], suggested that reducing pesticide application by adopting the use of biological control could reduce GHG emissions.
The intensities of CF in OF and CVF were significantly different, with values of 1.17 and 0.93 kg CO2eq kg−1 rice yield, respectively. There was a remarkably higher CF intensity in OF than in CVF due to the lower yield (Table 4). Compared with another study in Thailand, Arunrat et al. [12] used a similar calculation method to that in the present study and found that the CF intensities of organic rice and conventional rice farming in the Phichit province, lower Northern Thailand, were −0.13 and 0.82 kg CO2eq kg−1 rice yield, respectively. Arunrat and Pumijumnong [91] reported that the CF values of rice production in the Roi-Et province, Northeast Thailand, ranged from 0.31 to 1.68 kg CO2eq kg−1 rice yield. Champrasert et al. [92] estimated the CF of upland rice production in the Chiang Mai province, Northern Thailand, by including aboveground carbon and SOC stock. They found 0.13 and 0.19 kg CO2eq kg−1 rice yield (unmilled rice) for the Karen and Lawa tribes, respectively. The differences in CF values compared to the present study were due to the different amounts of agricultural inputs and SOC stocks that varied in different soil textures and climate conditions.
In addition, Thanawong et al. [93] found a rice yield of 2.97 kg CO2eq kg−1 for the CF of conventional rice production of rainfed areas in the rainy season, Northeast Thailand, while irrigated areas in the dry and rainy seasons had 4.87 and 5.55 kg CO2eq kg−1rice yield, respectively. Arunrat et al. [6] revealed that the CF of conventional rice production in the Phichit province, lower Northern Thailand, varied from 1.81 to 2.87 and 1.72 to 2.70 kg CO2eq kg−1 rice yield for irrigated and rainfed areas, respectively. Yodkhum et al. [94] estimated that the CF of organic rice production in the Chiang Mai province, Northern Thailand, was 0.58 kg CO2eq kg−1 rice yield. Yodkhum et al. [95] calculated the CF of conventional rice farming in the Maerim District, Chiang Mai province, Northern Thailand, and found 0.64 kg CO2eq kg−1 rice yield. Mungkung et al. [96] found that the CF of Hom Mali organic rice production in the Surin province, Northeast Thailand was 2.88 kg CO2eq kg−1 rice yield. When comparing the present study with the above studies, the different CF values are mainly due to the different amounts of agricultural inputs, methods, and parameters for the life cycle assessment (LCA) calculation, and none of the above studies considered SOC stocks.
Although reduction of the CF at production scale can be succeeded by an increase in crop yields, several studies [34,97,98,99,100] have stated that SOC sequestration is a key factor influencing CF and GHG emissions, as well as substantially increasing crop yields [101] and improving soil properties [102]. This is because any farming practices for crop production directly affect soil carbon increases or losses that have positive or negative impacts on environmental quality. Therefore, our study also suggested that the SOC sequestration should be taken into account for CF calculation in the LCA study, especially in crop production, which is critically important to estimate as to the net life cycle GHG emission.

3.4. Reactive Nitrogen Emissions and Nitrogen Footprints of OF and CVF

The total Nr emission in CVF was significantly higher than that in OF, with values of 63,422.5 and 950.9 kg Neq ha−1 year−1, respectively. Most of the NF was attributed to NH3 volatilization as well as NO3 and NH4+ leaching. These values were roughly 67 times higher in CVF than in OF. The Nr emissions in OF related to agricultural input and in the form of N2O were very little (0.014 and 2.11 kg Neq ha−1 year−1, respectively) compared with CVF (173.3 and 140.8 kg Neq ha−1 year−1, respectively; Table 5).
As shown in Table 5, the intensities of NF in OF and CVF were significantly different, with values of 0.34 and 11.94 kg Neq kg−1 rice yield, respectively. Due to the absence of studies on the NF of rice production in Thailand, comparisons with findings in other countries were discussed. Xue and Landis [103], used the LCA method to estimate the NF of cereal production in the Gulf of Mexico and found that the NF was around 2.65 g Neq kg−1 yield. Pierer et al. [104] applied an input–output analysis, indicating that the NF of grain production in Austria was around 21.9 g Neq kg−1 yield. Xue et al. [105], indicated that the NFs of the early, late, and double rice in Southern China were 10.47, 10.89, and 10.68 g Neq kg−1 yield, respectively. Chen et al. [22], using the LCA method, indicated that the NFs were 11.6, 13.4, and 15.4 g Neq kg−1 yield for double rice, rice–wheat, and wheat–maize, respectively. The NF of the present study (Table 5) was very low compared with that of the above studies. This is due to lower nitrogen material inputs, especially nitrogen fertilizers, than were used in the above studies. Chen et al. [106], mentioned that nitrogen application leads to NH3 volatilization, N2O emissions, and increased nitrogen leaching.

3.5. Water Footprint of OF and CVF

The total WF was higher in CVF (1470.1 m3 ton−1) than in OF (1216.3 m3 ton−1), but a significant difference was not found. The green and blue WFs in OF were 1117.1 and 82.0 m3 ton−1, respectively, while in CVF, they were 991.4 and 43.4 m3 ton−1, respectively. The difference in green WF between OF and CVF was due to the differences in planting dates and the growing periods of rice varieties until harvest. Notably, the gray water was significantly higher in CVF than in OF, with values of 435.3 and 17.2 m3 ton−1, respectively (Figure 3). This is mainly due to the use of chemical fertilizers, herbicides, and pesticides in CVF. The proportions of green, blue, and gray WFs in OF were 91.8, 6.7, and 1.4%, respectively, while accounting for 67.4, 3.0, and 29.6% for CVF, respectively (Figure 3). Globally, the averages of green and blue WFs of paddy rice were 618 and 720 m3 ton−1, respectively [107]. Johannes et al. [108] reported that the total WF of the organic rice commodity in Indonesia was 1145 m3 ton−1, consisting of 88.86% green WF, 9.00% blue WF, and 2.14% gray WF. Their results revealed that organic rice production could save around 52.8% of WF compared to conventional rice production. Although a significant difference in total WF between OF and CVF in our study was not found, it showed that OF contained around 17.3% of total WF lower than CVF (Table 4) due to the lower gray WF resulting from not applying any chemical fertilizers, which is also supported by the studies of Galloway and Cowling [109] and Benbi [110]. Thirkell et al. [111], stated that replacing chemical fertilizer with mycorrhizal fungi is an effective option for reducing gray WF. Therefore, it is of great value to switch from conventional rice production to organic rice production to reduce gray WF, which results in reductions in total nitrogen surplus accumulation in soils and releases to rivers and groundwater.

3.6. Economic Return and CF, NF, and WF per Net Return

OF can give higher net economic returns than CVF, gaining around 34,580 and 18,231 THB ha−1 year−1, respectively, which is due to lower production costs and higher rice prices. Concerning environmental indicators per net return, the CF, NF, and WF per net return values in OF were 0.09 kg CO2eq THB−1 year−1, 0.03 kg Neq THB−1 year−1, and 98.9 m3 THB−1 year−1, respectively. Meanwhile, the values of 0.27 kg CO2eq THB−1 year−1, 3.48 kg Neq THB−1 year−1, and 428.4 m3 THB−1 year−1 were generated in CVF for the CF, NF, and WF per net returns, respectively (Table 6). It is clear that OF generated much lower values than CVF, indicating that rice cultivation as organic rice has a lower impact on the environment when gaining a unit of net return. By considering the four key sustainability perspectives (productivity, environmental impact, economic viability, and social wellbeing) [10], relying on local resources or those inside the farm can greatly reduce the production costs, increase the farmer’s income, and reduce the impacts on the environment. To archive these sustainability perspectives, OF practices can be an effective choice. Moreover, the farmers, as water users, should be concerned about water-saving awareness regarding the water crisis in the future.

3.7. Limitations and Recommendations for Further Study

Although 4 years of rice cultivation were investigated in this study, the number of field studies is still limited due to the difficulty of exploring organic and conventional rice farms with similar environmental conditions. It allowed these two specific fields to be compared, whereas a generalized assessment of organic versus conventional rice production in Thailand needs a larger number of field studies and long-term monitoring to draw a wider conclusion. The challenges for future studies are (1) exploring field studies with a fair comparison, especially for soil texture; (2) reducing the uncertainty arising from agriculture inputs; (3) accessing the emission factors for the specific type of inputs to estimate the footprints.

4. Conclusions

Over the 4 years of the study (2018–2021), the SOC stocks in OF were significantly higher than those in CVF. The net GHG emissions in OF (3289.1 kg CO2eq ha−1 year−1) were significantly lower than in CVF (4921.7 kg CO2eq ha−1 year−1). There was a remarkably higher CF intensity in OF (1.17 kg CO2eq kg−1 rice yield) than in CVF (0.93 kg CO2eq kg−1 rice yield). The intensities of NF in OF and CVF were significantly different, with values of 0.34 and 11.94 kg Neq kg−1 rice yield, respectively. The total WF of CVF (1470.1 m3 ton−1) was higher than that in OF (1216.3 m3 ton−1). It is notable that the gray water in CVF was significantly higher than that in OF, with values of 435.3 and 17.2 m3 ton−1, respectively, which was mainly due to the use of chemical fertilizers, herbicides, and pesticides in CVF. Although the rice yield in OF was nearly two times lower than that in CVF, the economic return in OF was higher than that in CVF, gaining around 34,580 and 18,231 THB ha−1 year−1, respectively, which is due to lower production costs and higher rice prices. The CF, NF, and WF per net return values in OF were 0.09 kg CO2eq THB−1 year−1, 0.03 kg Neq THB−1 year−1, and 98.9 m3 THB−1 year−1, respectively. Meanwhile, the values of 0.27 kg CO2eq THB−1 year−1, 3.48 kg Neq THB−1 year−1, and 428.4 m3 THB−1 year−1 were generated in CVF for the CF, NF, and WF per net returns, respectively. Although our case study showed that OF generated lower values of CF, NF, and WF than in CVF, a larger number of field studies and long-term monitoring are needed for future studies.

Supplementary Materials

The following supporting information can be downloaded at: https://www.mdpi.com/article/10.3390/agronomy12020380/s1, S1: Greenhouse gas emission calculation; Table S1: Emissions factors used for calculation of GHG emissions from raw materials production phase; Table S2: Emissions factors used for calculation of GHG emissions from utilization phase.

Author Contributions

Conceptualization, N.A., S.S., W.C., C.W. and R.H.; methodology, N.A., S.S., W.C., C.W. and R.H.; investigation, N.A. and S.S.; writing—original draft preparation, N.A.; writing—review and editing, N.A.; supervision, W.C., C.W. and R.H. All authors have read and agreed to the published version of the manuscript.

Funding

This research project is supported by Mahidol University (Grant No. A14/2564).

Institutional Review Board Statement

The study was conducted according to the guidelines of the Declaration of Helsinki, and approved by the Institutional Review Board of Institute for Population and Social Research, Mahidol University (IPSR-IRB) (COA. No. 2021/01-001).

Informed Consent Statement

Not applicable.

Data Availability Statement

Not applicable.

Acknowledgments

The authors extend their appreciation to Mahidol University (Grant No. A14/2564) for supporting research project. Moreover, the authors would like to thank National Research Council of Thailand (NRCT) (KO-BO-NGO/2557-68), the Biodiversity-based Economy Development Office (Public Organization) (BEDO) and National Research Council of Thailand (NRCT) (Grant No. 36/2561), and National Research Council of Thailand (NRCT) (Grant No. 205/2561) for providing the recorded data in their research projects.

Conflicts of Interest

The authors declare no conflict of interest.

References

  1. Ciais, P.; Sabine, C.; Bala, G.; Bopp, L.; Brovkin, V.; Canadell, J.; Chhabra, A.; DeFries, R.; Galloway, J.; Heimann, M.; et al. Carbon and Other Biogeochemical Cycles. In Climate Change 2013: The Physical Science Basis; Stocker, T.F., Qin, D., Plattner, G.-K., Tignor, M., Allen, S.K., Boschung, J., Nauels, A., Xia, Y., Bex, V., Midgley, P.M., Eds.; Cambridge University Press: Cambridge, UK, 2013. [Google Scholar]
  2. Field, C.B.; Barros, V.R. (Eds.) Climate Change 2014: Impacts, Adaptation and Vulnerability; Cambridge University Press: Cambridge, UK, 2014; p. 1820. [Google Scholar]
  3. Office of Agricultural Economics (OAE). Agricultural Statistics of Thailand; Office of Agricultural Economics: Bangkok, Thailand, 2020; Available online: http://www.oae.go.th/assets/portals/1/files/jounal/2564/yearbook2563.pdf (accessed on 28 May 2021). (In Thai)
  4. Ding, Y.; Liu, Y.X.; Wu, W.X.; Shi, D.Z.; Yang, M.; Zhong, Z.K. Evaluation of biochar effects on nitrogen retention and leaching in multi-layered soil columns. Water Air Soil Pollut. 2010, 213, 47–55. [Google Scholar] [CrossRef]
  5. Pandey, D.; Agrawal, M. Carbon Footprint Estimation in the Agriculture Sector. In Assessment of Carbon Footprint in Different Industrial Sectors; Springer: Singapore, 2014; Volume 1, pp. 25–47. [Google Scholar]
  6. Arunrat, N.; Wang, C.; Pumijumnong, N. Alternative cropping systems for greenhouse gases mitigation in rice field: A case study in Phichit province of Thailand. J. Clean. Prod. 2016, 133, 657–671. [Google Scholar] [CrossRef]
  7. Maraseni, T.N.; Deo, R.C.; Qu, J.; Gentle, P.; Neupane, P.R. An international comparison of rice consumption behaviours and greenhouse gas emissions from rice production. J. Clean. Prod. 2018, 172, 2288–2300. [Google Scholar] [CrossRef]
  8. Scialabba, N.E.-H.; Müller-Lindenlauf, M. Organic agriculture and climate change. Renew. Agric. Food Syst. 2010, 25, 158–169. [Google Scholar] [CrossRef] [Green Version]
  9. Meena, A.L.; Pandey, R.N.; Kumar, D.; Dotaniya, M.L.; Sharma, V.K.; Singh, G.; Meena, B.P.; Kumar, A.; Bhanu, C. Impact of 12-year-long rice based organic farming on soil quality in terms of soil physical properties, available micronutrients and rice yield in a typic Ustochrept soil of India. Commun. Soil Sci. Plant Anal. 2020, 51(18), 2331–2348. [Google Scholar] [CrossRef]
  10. Reganold, J.P.; Wachter, J.M. Organic agriculture in the twenty-first century. Nat. Plants 2016, 2, 15221. [Google Scholar] [CrossRef]
  11. Meemken, E.M.; Qaim, M. Organic agriculture, food security, and the environment. Ann. Rev. Resour. Econ. 2018, 10, 39–63. [Google Scholar] [CrossRef] [Green Version]
  12. Arunrat, N.; Sereenonchai, S.; Wang, C. Carbon footprint and predicting the impact of climate change on carbon sequestration ecosystem services of organic rice farming and conventional rice farming: A case study in Phichit province, Thailand. J. Environ. Manag. 2021, 289, 112458. [Google Scholar] [CrossRef]
  13. Shahane, A.A.; Shivay, Y.S.; Prasanna, R.; Kumar, D. Improving water and nutrient use efficiency in rice by changing crop establishment methods, application of microbial inoculations, and Zn fertilization. Glob. Chall. 2019, 3, 1800005. [Google Scholar] [CrossRef]
  14. Wiedmann, T.; Minx, J. A Definition of Carbon Footprint. Ecol. Econ. Res. Trends 2008, 1, 1–11. [Google Scholar]
  15. Hoekstra, A.Y. 2003. Virtual Water Trade. In Proceedings of the International Expert Meeting on Virtual Water Trade, Delft, The Netherlands, 12–13 December 2002. [Google Scholar]
  16. Hoekstra, A.Y.; Chapagain, A.K. Water footprints of nations: Water use by people as a function of their consumption pattern. Water Resour. Manag. 2010, 21, 35–48. [Google Scholar] [CrossRef]
  17. Siebert, S.; Döll, P. Quantifying blue and green virtual water contents in global crop production as well as potential production losses without irrigation. J. Hydrol. 2010, 384, 198–207. [Google Scholar] [CrossRef]
  18. Hoekstra, A.Y.; Chapagain, A.K.; Aldaya, M.M.; Mekonnen, M.M. The Water Footprint Assessment Manual: Setting the Global Standard; Earthscan: London, UK, 2011. [Google Scholar]
  19. Hoekstra, A.Y.; Mekonnen, M.M. The water footprint of humanity. Proc. Natl. Acad. Sci. USA 2012, 109, 3232–3237. [Google Scholar] [CrossRef] [Green Version]
  20. Gan, Y.; Liang, C.; Hamel, C.; Cutforth, H.; Wang, H. Strategies for reducing the carbon footprint of field crops for semiarid areas. A review. Agron. Sustain. Dev. 2011, 31, 643–656. [Google Scholar] [CrossRef] [Green Version]
  21. Leach, A.M.; Galloway, J.N.; Bleeker, A.; Erisman, J.W.; Kohn, R.; Kitzes, J. A nitrogen Footprint model to help consumers understand their role in nitrogen losses to the environment. Environ. Dev. 2012, 1, 40–66. [Google Scholar] [CrossRef] [Green Version]
  22. Chen, Z.; Xu, C.; Ji, L.; Feng, J.; Li, F.; Zhou, X.; Fang, F. Effects of multi-cropping system on temporal and spatial distribution of carbon and nitrogen footprint of major crops in China. Glob. Ecol. Conserv. 2020, 22, e00895. [Google Scholar] [CrossRef]
  23. Lal, R. Soil carbon sequestration to mitigate climate change. Geoderma 2004, 123, 1–22. [Google Scholar] [CrossRef]
  24. Pan, G.; Li, L.; Wu, L.; Zhang, X. Storage and sequestration potential of topsoil organic carbon in China’s paddy soils. Global Chang. Biol. 2004, 10, 79–92. [Google Scholar] [CrossRef]
  25. Lu, F.; Wang, X.; Han, B.; Ouyang, Z.; Duan, X.; Zheng, H.; Miao, H. Soil carbon sequestrations by nitrogen fertilizer application, straw return and no-tillage in China’s cropland. Glob. Chang. Biol. 2009, 15, 281–305. [Google Scholar] [CrossRef]
  26. Buysse, P.; Roisin, C.; Aubinet, M. Fifty years of contrasted residue management of an agricultural crop: Impacts on the soil carbon budget and on soil heterotrophic respiration. Agri. Ecosyst. Environ. 2013, 167, 52–59. [Google Scholar] [CrossRef]
  27. Arunrat, N.; Pumijumnong, N.; Sereenonchai, S.; Chareonwong, U.; Wang, C. Assessment of climate change impact on rice yield and water footprint of large-scale and individual farming in Thailand. Sci. Total Environ. 2020, 726, 137864. [Google Scholar] [CrossRef] [PubMed]
  28. Wachter, J.M.; Reganold, J.P. Organic agricultural production: Plants. Encycl. Agr. Food Syst. 2014, 265–286. [Google Scholar]
  29. Willer, H.; Schlatter, B.; Trávníček, J.; Kemper, L.; Lernoud, J. The World of Organic Agriculture—Statistics and Emerging Trends 2020; Research Institute of Organic Agriculture (FiBL): Frick, Switzerland; IFOAM—Organics International: Bonn, Germany, 2020. [Google Scholar]
  30. Pongsrihadulchai, A. 2018. Thailand’s Rice Industry and Current Policies Towards High Value Rice Products. In Proceedings of the International Seminar on Promoting Rice Farmers’ Market Through Value-Adding Activities, Bangkok, Thailand, 6–7 June 2018; Food and Fertilizer Technology Center: Taipei, Taiwan. Available online: https://ap.fftc.org.tw/article/1297 (accessed on 20 August 2021).
  31. Ostle, N.J.; Levy, P.E.; Evans, C.D.; Smith, P. UK land use and soil carbon sequestration. Land Use Pol. 2009, 26, S274–S283. [Google Scholar] [CrossRef]
  32. Gan, Y.; Liang, C.; Chai, Q.; Lemke, R.L.; Campbell, C.A.; Zentner, R.P. Improving farming practices reduces the carbon footprint of spring wheat production. Nat. Commun. 2014, 5, 5012. [Google Scholar] [CrossRef] [PubMed] [Green Version]
  33. Adewale, C.; Reganold, J.P.; Higgins, S.; Evans, R.D.; Carpenter-Boggs, L. Improving carbon footprinting of agricultural systems: Boundaries, tiers, and organic farming. Environ. Impact Assess. Rev. 2018, 71, 41–48. [Google Scholar] [CrossRef]
  34. Alam, M.K.; Bell, R.W.; Biswas, W.K. Decreasing the carbon footprint of an intensive rice-based cropping system using conservation agriculture on the Eastern Gangetic Plains. J. Clean. Prod. 2019, 218, 259–272. [Google Scholar] [CrossRef]
  35. Richards, L.A. Diagnosis and Improvement of Saline and Alkali Soils. In Agriculture Handbook; United States Department of Agriculture: Washington, DC, USA, 1954. [Google Scholar]
  36. National Soil Survey Center. Soil Survey Laboratory Methods Manual. In Soil Survey Investigations Report No. 42, Version 3.0; Natural Conservation Service: Washington, DC, USA, 1996. [Google Scholar]
  37. Bray, R.A.; Kurtz, L.T. Determination of total organic and available form of phosphorus in soil. Soil Sci. 1945, 59, 39–45. [Google Scholar] [CrossRef]
  38. Thomas, G.W. Method of Soil Analysis, Part 3: Chemical Methods. In Soil pH and Soil Acidity; Sparks, D.L., Page, A.L., Helmke, P.A., Loeppert, R.H., Soltanpour, P.N., Tabatabai, M.A., Johnston, C.T., Sumner, M.E., Eds.; ASA Inc.: Madison, WI, USA, 1996; pp. 475–490. [Google Scholar]
  39. Walkley, A.; Black, J.A. An examination of the dichromate method for determining soil organic matter and a proposed modification of the chromic acid titration method. Soil Sci. 1934, 37, 29–38. [Google Scholar] [CrossRef]
  40. Ellert, B.H.; Bettany, J.R. Calculation of organic matter and nutrients stored in soils under contrasting management regimes. Can. J. Soil Sci. 1995, 75, 529–538. [Google Scholar] [CrossRef] [Green Version]
  41. IPCC (Intergovernmental Panel on Climate Change). 2019 Refinement to the 2006 IPCC Guidelines for National Greenhouse Gas Inventories; Calvo Buendia, E., Tanabe, K., Kranjc, A., Baasansuren, J., Fukuda, M., Ngarize, S., Osako, A., Pyrozhenko, Y., Shermanau, P., et al., Eds.; Intergovernmental Panel on Climate Change (IPCC): Geneva, Switzerland, 2019. [Google Scholar]
  42. IPCC. Climate Change 2013: The Physical Science Basic Contribution of Working Group 1 to the Fifth Assessment Report of the Intergovernmental Panel on Climate Change; Cambridge University Press: Cambridge, UK, 2013. [Google Scholar]
  43. The National Technical Committee on Product Carbon Footprinting. The National Guideline on Product Carbon Footprint, 3rd ed.; Amarin Publishing: Bangkok, Thailand, 2011. [Google Scholar]
  44. TGO (Thailand Greenhouse Gas Management Organization). Product Category Rules (PCRS) of Rice in Thailand. 2014. Available online: http://thaicarbonlabel.tgo.or.th/PCR/A4.pdf (accessed on 20 September 2018).
  45. EPA. Emission Factors for Greenhouse Gas Inventories; United States Environmental Protection Agency: Washington, DC, USA, 2014. Available online: https://www.epa.gov/sites/production/files/2015-07/documents/emission-factors_2014.pdf (accessed on 18 May 2016).
  46. The National Technical Committee on Product Carbon Footprinting. National Guideline on Product National Guideline on Product Carbon Footprint; Amarin Publishing: Bangkok, Thailand, 2015. [Google Scholar]
  47. Ecoinvent Centre. Ecoinvent Database v.3.2; Swiss Centre for Life Cycle Inventories: Duebendorf, Switzerland, 2015. Available online: http://www.ecoinvent.org/ (accessed on 25 June 2016).
  48. Maciel, V.G.; Zortea, R.B.; da Silva, W.M.; Cybis, L.F.A.; Einloft, S.; Seferin, M. Life Cycle Inventory for the agricultural stages of soybean production in the state of Rio Grande do Sul. Braz. J. Clean. Prod. 2015, 93, 65–74. [Google Scholar] [CrossRef]
  49. Gu, B.; Leach, A.M.; Ma, L.; Galloway, J.N.; Chang, S.X.; Ge, Y. Nitrogen footprint in China: Food, energy, and nonfood goods. Environ. Sci. Technol. 2013, 47, 9217–9224. [Google Scholar] [CrossRef] [PubMed]
  50. ISO 14044; Environmental Management e Life Cycle Assessment e Requirements and Guidelines; International Organization for Standardization: Geneva, Switzerland, 2006.
  51. Guinée, J.B.; Gorrée, M.; Heijungs, R.; Huppes, G.; Kleijn, R.; de Koning, A.; van Oers, L.; Wegener Sleeswijk, A.; Suh, S.; Udo de Haes, H.; et al. Life Cycle Assessment: An Operational Guide to the ISO Standards; Kluwer Academic Publishers: Dordrecht, The Netherlands, 2002. [Google Scholar]
  52. Allan, J.A. Virtual water: A strategic resource global solutions to regional deficits. Ground Water 1998, 36, 545–546. [Google Scholar] [CrossRef]
  53. Hoekstra, A.Y.; Hung, P.Q. Virtual water trade. A quantification of virtual water flows between nations in relation to international crop trade. Value Water Res. Rep. Ser. 2002, 11, 166. [Google Scholar]
  54. Hoekstra, A.Y.; Chapagain, A.K. Globalization of Water: Sharing the Planet’s Freshwater Resources; Blackwell Publishing: Oxford, UK, 2008. [Google Scholar]
  55. Mekonnen, M.M.; Hoekstra, A.Y. Global gray water footprint and water pollution levels related to anthropogenic nitrogen loads to fresh water. Environ. Sci. Technol. 2015, 49, 12860–12868. [Google Scholar] [CrossRef] [PubMed]
  56. Eggleston, H.S.; Buendia, L.; Miwa, K.; Ngara, T.; Tanabe, K. Agriculture, Forestry and Other Land Use. In IPCC Guidelines for National Greenhouse Gas Inventories; Institute for Global Environmental Strategies (IGES): Hayama, Japan, 2006. [Google Scholar]
  57. Pollution Control Department. The Quality of Surface Water Standard; Ministry of Natural Resources and Environment: Bangkok, Thailand, 1994. (In Thai). Available online: http://infofile.pcd.go.th/law/3_14_water.pdf (accessed on 7 September 2019).
  58. Yang, X.; Gao, W.; Zhang, M.; Chen, Y.; Sui, P. Reducing agricultural carbon footprint through diversified crop rotation systems in the North China Plain. J. Clean. Prod. 2014, 76, 131–139. [Google Scholar] [CrossRef]
  59. Wang, L.; Li, L.; Xie, J.; Luo, Z.; Zhang, R.; Cai, L.; Coulter, J.A.; Palta, J.A. Managing the trade-offs among yield, economic benefits and carbon and nitrogen footprints of wheat cropping in a semi-arid region of China. Sci. Total Environ. 2021, 768, 145280. [Google Scholar] [CrossRef]
  60. Bennett, M.; Franzell, S. Can organic and resource-conserving agriculture improve livelihood. Int. J. Agric. Sustain. 2013, 11, 193–215. [Google Scholar] [CrossRef]
  61. Sun, M.; Xiao, T.; Ning, Z.; Xiao, E.; Sun, W. Microbial community analysis in rice paddy soils irrigated by acid mine drainage contaminated water. Appl. Microbiol. Biotechnol. 2015, 99, 2911–2922. [Google Scholar] [CrossRef]
  62. Pahalvi, H.N.; Rafiya, L.; Rashid, S.; Nisar, B.; Kamili, A.N. Chemical Fertilizers and Their Impact on Soil Health. Microbiota Biofertil. 2021, 2, 1–20. [Google Scholar]
  63. Lin, W.; Lin, M.; Zhou, H.; Wu, H.; Li, Z.; Lin, W. The effects of chemical and organic fertilizer usage on rhizosphere soil in tea orchards. PLoS ONE 2019, 14, e0217018. [Google Scholar] [CrossRef]
  64. Rukshana, F.; Butterly, C.R.; Xu, J.-M.; Baldock, J.A.; Tang, C. Organic anion-to- acid ratio influences pH change of soils differing in initial pH. Int. J. Soil Sediment Water 2013, 14, 407–414. [Google Scholar] [CrossRef]
  65. Gathala, M.K.; Ladha, J.K.; Saharawat, Y.S.; Kumar, V.; Kumar, V.; Sharma, P.K. Effect of tillage and crop establishment methods on physical properties of a medium-textured soil under a seven-year Rice-Wheat rotation. Soil Sci. Soc. Am. J. 2011, 75, 1851–1862. [Google Scholar] [CrossRef]
  66. Gelybó, G.; Tóth, E.; Farkas, C.; Horel, A.; Kása, I.; Bakacsi, Z. Potential impacts of climate change on soil properties. Agrokem. Talajt. 2018, 67, 121–141. [Google Scholar] [CrossRef] [Green Version]
  67. Jat, H.S.; Datta, A.; Sharma, P.C.; Kumar, V.; Yadav, A.K.; Choudhary, M.; Choudhary, V.; Gathala, M.K.; Sharma, D.K.; Jat, M.L.; et al. Assessing soil properties and nutrient availability under conservation agriculture practices in a reclaimed sodic soil in cereal-based systems of North-West India. Arch. Agron. Soil Sci. 2018, 64, 531–545. [Google Scholar] [CrossRef] [PubMed]
  68. Dai, H.; Chen, Y.; Yang, X.; Cui, J.; Sui, P. The effect of different organic materials amendment on soil bacteria communities in barren sandy loam soil. Environ. Sci. Pollut. Res. 2017, 24, 24019–24028. [Google Scholar] [CrossRef]
  69. Hiederer, R.; Köchy, M. Global Soil Organic Carbon Estimates and the Harmonized World Soil Database; Publication Office of the European Union: Brussels, Belgium, 2011; Available online: https://esdac.jrc.ec.europa.eu/ESDB_Archive/eusoils_docs/Other/EUR25225.pdf (accessed on 2 July 2021).
  70. Zdruli, P.; Lal, R.; Cherlet, M.; Kapur, S. New World Atlas of Desertification and Issues of Carbon Sequestration, Organic Carbon Stocks, Nutrient Depletion and Implications for Food Security. In Carbon Management, Technologies, and Trends in Mediterranean Ecosystems; Erşahin, S., Kapur, S., Akça, E., Namlı, A., Erdoğan, H.E., Eds.; Springer: Cham, Switzerland, 2017; pp. 13–25. [Google Scholar]
  71. Adamu, H.; Umar, Y.A.; Akanang, H.; Sabo, A. Evaluation of Carbon Sequestration Potential of Soils―What Is Missing? J. Geosci. Environ. Prot. 2021, 9, 39–47. [Google Scholar] [CrossRef]
  72. Pan, G.; Xu, X.; Smith, P.; Pan, W.; Lal, R. An increase in topsoil SOC stock of China’s croplands between 1985 and 2006 revealed by soil monitoring. Agr. Ecosyst. Environ. 2010, 136, 133–138. [Google Scholar] [CrossRef]
  73. Freibauer, A.; Rounsevell, M.D.A.; Smith, P.; Verhagen, J. Carbon sequestration in agricultural soils of Europe. Geoderma 2004, 122, 1–23. [Google Scholar] [CrossRef]
  74. Knudsen, M.T.; Meyer-Aurich, A.; Olesen, J.E.; Chirinda, N.; Hermansen, J.E. Carbon footprints of crops from organic and conventional arable crop rotationse using a life cycle assessment approach. J. Clean. Prod. 2014, 64, 609–618. [Google Scholar] [CrossRef]
  75. Ghimire, R.; Lamichhane, S.; Acharya, B.S.; Bista, P.; Sainju, U.M. Tillage, crop residue, and nutrient management effects on soil organic carbon in rice-based cropping systems: A review. J. Integr. Agric. 2017, 16, 1–15. [Google Scholar] [CrossRef]
  76. Smith, P. Soil Organic Carbon Dynamics and Land-Use Change. In Land Use and Soil Resources; Braimoh, A.K., Vlek, P.L.G., Eds.; Springer: Dordrecht, The Netherlands, 2008; pp. 9–22. [Google Scholar]
  77. Paustian, K.; Andrén, O.; Janzen, H.H.; Lal, R.; Smith, P.; Tian, G.; Tiessen, H.; van Noordwijk, M.; Woomer, P.L. Agricultural soils as a sink to mitigate CO2 emissions. Soil Use Manag. 1997, 13, 229–244. [Google Scholar] [CrossRef]
  78. IPCC. Guidelines for National Greenhouse Gas Inventories: Workbook (Revised 1996); Intergovernmental Panel on Climate Change: Paris, France, 1997. [Google Scholar]
  79. Smith, P.; Powlson, D.S. Sustainability of soil management practices: A global perspective. In Soil Biological Fertility: A Key to Sustainable Land Use in Agriculture; Abbott, L.K., Murphy, D.V., Eds.; Kluwer Academic Publishers: Dodrecht, The Netherlands, 2003; pp. 241–254. [Google Scholar]
  80. Mohammadi, A.; Omid, M. Economical analysis and relation between energy inputs and yield of greenhouse cucumber production in Iran. Appl. Energy 2010, 87, 191–196. [Google Scholar] [CrossRef]
  81. Banaeian, N.; Namdari, M. Effect of ownership energy use efficiency in watermelon farms–A data envelopment analysis approach. Int. J. Renew. Energy Res. 2011, 1, 75–82. [Google Scholar]
  82. Khoshnevisan, B.; Rafiee, S.; Omid, M.; Mousazadeh, H. Reduction of CO2 emission by improving energy use efficiency of greenhouse cucumber production using DEA approach. Energy 2013, 55, 676–682. [Google Scholar] [CrossRef]
  83. Zhang, W.; Dou, Z.; He, P.; Ju, X.; Powlson, D.; Chadwick, D.; Norse, D.; Lu, Y.; Zhang, Y.; Wu, L. New technologies reduce greenhouse gas emissions from nitrogenous fertilizer in China. Proc. Natl. Acad. Sci. USA 2013, 110, 8375–8380. [Google Scholar] [CrossRef] [Green Version]
  84. Dubey, S.K. Methane emission and rice agriculture. Curr. Sci. 2001, 81, 345–346. [Google Scholar]
  85. Yu, K.; Böhme, F.; Rinklebe, J.; Neue, H.U.; Delaune, R.D. Major biogeochemical processes in soils-a microcosm incubation from reducing to oxidizing conditions. Soil Sci. Soc. Am. J. 2007, 71, 1406–1417. [Google Scholar] [CrossRef] [Green Version]
  86. Yan, X.; Akiyama, H.; Yagi, K.; Akimoto, H. Global estimations of the inventory and mitigation potential of methane emissions from rice cultivation conducted using the 2006 Intergovernmental Panel on Climate Change Guidelines. Glob. Biogeochem. Cycles 2009, 23, GB2002. [Google Scholar] [CrossRef]
  87. Alam, M.K.; Biswas, W.K.; Bell, R.W. Greenhouse gas implications of novel and conventional rice production technologies in the Eastern-Gangetic plains. J. Clean. Prod. 2016, 112, 3977–3987. [Google Scholar] [CrossRef]
  88. Bacenetti, J.; Fusi, A.; Negri, M.; Fiala, M. Impact of cropping system and soil tillage on environmental performance of cereal silage productions. J. Clean. Prod. 2015, 86, 49–59. [Google Scholar] [CrossRef]
  89. Kanter, D.R.; Searchinger, T.D. A technology-forcing approach to reduce nitrogen pollution. Nat. Sustain. 2018, 1, 544–552. [Google Scholar] [CrossRef]
  90. Fan, D.J.; Zhang, H.R.; Liu, T.Q.; Cougui, C.; Chengfeng, L. Control effects of Chelonus munakatae against Chilo suppressalis and impact on greenhouse gas emissions from paddy fields. Front. Plant Sci. 2020, 11, 228. [Google Scholar] [CrossRef] [PubMed] [Green Version]
  91. Arunrat, N.; Pumijumnong, N. Practices for reducing greenhouse gas emissions from rice production in Northeast Thailand. Agriculture 2017, 7, 4. [Google Scholar]
  92. Champrasert, P.; Sampattagul, S.; Yodkhum, S.; Wangpakapattanawong, P. Assessment of carbon footprint of upland rice production in Northern Thailand. CMU J. Nat. Sci. 2020, 19, 427–446. [Google Scholar] [CrossRef]
  93. Thanawong, K.; Perret, S.R.; Basset-Mens, C. Eco-efficiency of paddy rice production in Northeastern Thailand: A comparison of rain-fed and irrigated cropping systems. J. Clean. Prod. 2014, 73, 204–217. [Google Scholar] [CrossRef]
  94. Yodkhum, S.; Gheewala, S.H.; Sampattagul, S. Life cycle GHG evaluation of organic rice production in northern Thailand. J. Environ. Manag. 2017, 196, 217–223. [Google Scholar] [CrossRef]
  95. Yodkhum, S.; Sampattagul, S.; Gheewala, S.H. Energy and environmental impact analysis of rice cultivation and straw management in northern Thailand. Environ. Sci. Pollut. Res. 2018, 25, 17654–17664. [Google Scholar] [CrossRef]
  96. Mungkung, R.; Sitthikitpanya, S.; Dangsiri, S.; Gheewala, S.H. Life cycle assessment of Thai Hom Mali rice to support the policy decision on organic farming area expansion. Sustainability 2020, 12, 6003. [Google Scholar] [CrossRef]
  97. Petersen, B.M.; Knudsen, M.T.; Hermansen, J.E.; Halberg, N. An approach to include soil carbon changes in life cycle assessments. J. Clean. Prod. 2013, 52, 217–224. [Google Scholar] [CrossRef]
  98. Goglio, P.; Smith, W.N.; Grant, B.B.; Desjardins, R.L.; McConkey, B.G.; Campbell, C.A.; Nemecek, T. Accounting for soil carbon changes in agricultural life cycle assessment (LCA): A review. J. Clean. Prod. 2015, 104, 23–39. [Google Scholar] [CrossRef]
  99. Alam, M.K.; Bell, R.W.; Haque, M.E.; Kader, M.A. Minimal soil disturbance and increased residue retention increase soil carbon in rice-based cropping systems on the Eastern Gangetic Plain. Soil Till. Res. 2018, 183, 28–41. [Google Scholar] [CrossRef]
  100. Jiang, Z.H.; Zhong, Y.M.; Yang, J.P.; Wu, Y.X.Y.; Hui, L.; Zheng, L. Effect of nitrogen fertilizer rates on carbon footprint and ecosystem service of carbon sequestration in rice production. Sci. Total Environ. 2019, 670, 210–217. [Google Scholar] [CrossRef] [PubMed]
  101. Wang, X.H.; Yang, H.S.; Liu, J.; Wu, J.; Chen, W.; Wu, J.; Zhu, L.; Bian, X. Effects of ditch-buried straw return on soil organic carbon and rice yields in a rice-wheat rotation system. Catena 2015, 127, 56–63. [Google Scholar] [CrossRef]
  102. Zhang, J.; Bei, S.; Li, B.; Zhang, J.; Christie, P.; Li, X. Organic fertilizer, but not heavy liming, enhances banana biomass, increases soil organic carbon and modifies soil microbiota. Appl. Soil Ecol. 2019, 136, 67–79. [Google Scholar] [CrossRef]
  103. Xue, X.B.; Landis, A.E. Eutrophication potential of food consumption patterns. Environ. Sci. Technol. 2010, 44, 6450–6456. [Google Scholar] [CrossRef] [PubMed]
  104. Pierer, M.; Winiwarter, W.; Leach, A.M.; Galloway, J.N. The nitrogen footprint of food products and general consumption patterns in Austria. Food Policy 2014, 49, 128–136. [Google Scholar] [CrossRef]
  105. Xue, J.F.; Pu, C.; Liu, S.L. Carbon and nitrogen footprint of double rice production in Southern China. Ecol. Indicat. 2016, 64, 249–257. [Google Scholar] [CrossRef]
  106. Chen, X.; Cui, Z.; Fan, M.; Vitousek, P.; Zhao, M.; Ma, W.; Wang, Z.; Zhang, W.; Yan, X.; Yang, J. Producing more grain with lower environmental costs. Nature 2014, 514, 486–489. [Google Scholar] [CrossRef]
  107. Chapagain, A.K.; Hoekstra, A.Y. The Green, Blue and Grey Water Footprint of Rice from Both a Production and Consumption Perspective. In Value of Water Research Report Series No. 40; IHE Institute for Water Education: Delft, The Netherlands, 2010. [Google Scholar]
  108. Johannes, H.P.; Priadi, C.R.; Herdiansyah, H.; Novalia, I. Water Footprint Saving through Organic Rice Commodity; AIP Publishing: College Park, MD, USA, 2020. [Google Scholar]
  109. Galloway, J.N.; Cowling, E.B. Reactive nitrogen and the world: 200 years of change. Ambio 2002, 31, 64–71. [Google Scholar] [CrossRef]
  110. Benbi, D.K. Carbon footprint and agricultural sustainability nexus in an intensively cultivated region of Indo-Gangetic Plains. Sci. Total Environ. 2018, 644, 611–623. [Google Scholar] [CrossRef]
  111. Thirkell, T.J.; Charters, M.D.; Elliott, A.J.; Sait, S.M.; Field, K.J. Are mycorrhizal fungi our sustainable saviours? Considerations for achieving food security. J. Ecol. 2017, 105, 921–929. [Google Scholar] [CrossRef] [Green Version]
Figure 1. Study area of an organic rice farm (OF) and a conventional rice farm (CVF). The aerial image was taken from Google maps on 30 May 2021. The photos were taken on 29 August 2021 by Noppol Arunrat.
Agronomy 12 00380 g001
Figure 2. System boundaries for carbon, nitrogen, and water footprint assessment. * indicates that the materials were used in conventional rice farming but not applied in organic rice farming.
Agronomy 12 00380 g002
Figure 3. Comparison of water footprint.
Agronomy 12 00380 g003
Table 1. Agriculture input of organic rice farming and conventional rice farming during 2018–2021 (mean ± standard deviation).
InputUnitQuantity
Organic Rice FarmingConventional Rice Farming
Rice seedskg ha−1 crop−162.5 ± 31.3a93.8 ± 31.3b
GasolineL ha−1 crop−162.5 ± 18.8a125.0 ± 31.3b
DieselL ha−1 crop−1125.0 ± 31.3a156.3 ± 18.8a
Strawkg ha−1 crop−13375.0 ± 1250.0a3100.0 ± 1250.0a
Bio-fermented juice *kg ha−1 crop−1312.5 ± 125.0-
Fertilizer 16-20-0 kg ha−1 crop−1-156.3 ± 62.5
Fertilizer 46-0-0kg ha−1 crop−1-125.0 ± 31.3
Glyphosate 48% w/v SLL ha−1 crop−1-218.8 ± 31.3
(0.75 L (a.i) ha−1)
Alachlor 48% w/v ECL ha−1 crop−1-187.5 ± 31.3
(0.56 L (a.i) ha−1)
Acephate 75% SL ha−1 crop−1-406.3 ± 62.5
(0.41 kg (a.i) ha−1)
Chlorpyrifos 40% ECL ha−1 crop−1-375.0 ± 62.5
(0.75 L (a.i) ha−1)
Lowercase letters (a and b) represent a significant difference in material input between organic rice farming and conventional rice farming (p < 0.05). a.i. = active ingredient. * Bio-fermented juice refers to the bio-extract or biological fermentation from natural resources (e.g., lemon grass, neem leaves, fruits, and vegetables) and waste (e.g., molasses and dung) to dispose of insects or weeds and enhance soil nutrients instead of chemical inputs.
Table 2. Soil physical and chemical characteristics (0–30 cm) of organic rice farming and conventional rice farming during 2018–2021 (mean ± standard deviation).
Organic Rice FarmingConventional Rice Farming
20182019202020212018201920202021
pH (1:2.5)5.61 ± 0.31a5.38 ± 0.56a5.59 ± 0.54a5.65 ± 0.52a5.53 ± 0.42a5.03 ± 0.37a5.48 ± 0.61a5.54 ± 0.57a
BD (g cm−3)1.36 ± 0.28a1.36 ± 0.25a1.35 ± 0.41a1.36 ± 0.55a1.40 ± 0.32a1.37 ± 0.35a1.40 ± 0.46a1.38 ± 0.43a
OM (%)3.16 ± 0.14a3.18 ± 0.17a3.20 ± 0.16a3.20 ± 0.17a2.75 ± 0.15b2.80 ± 0.14b2.82 ± 0.15b2.81 ± 0.13b
ECe (dS m−1)0.49 ± 0.01a0.57 ± 0.01a0.25 ± 0.03a0.37 ± 0.02a0.36 ± 0.02b0.42 ± 0.03b0.30 ± 0.02a0.41 ± 0.02a
Avail. P (mg kg−1)13.01 ± 8.32a15.06 ± 12.10a17.57 ± 15.32a18.6 ± 10.51a11.69 ± 4.32a15.34 ± 17.54a18.96 ± 21.07a13.65 ± 9.65a
Avail. K (mg kg−1)142.98 ± 31.20a151.54 ± 12.63a184.97 ± 27.50a176.5 ± 19.54a164.96 ± 33.8a188.53 ± 15.07a107.96 ± 21.18b157.3 ± 25.01a
Avail. Ca (mg kg−1)1897.06 ± 613.5a1965.45 ±
498.3a
2872.59 ± 572.3a2373.34 ± 315.3a3770.40 ± 743.2b3653.13 ±
631.4b
1564.00 ± 287.56b2567.40 ±
267.4a
Avail. Mg (mg kg−1)138.14 ± 54.3a157.89 ± 48.6a178.93 ± 74.2a168.9 ± 39.6a216.38 ± 61.5b274.65 ± 71.3b100.31 ± 49.5b218.5 ± 55.2a
Sand (%)9.8a ± 3.75a10.1 ± 3.60a8.5 ± 3.11a9.61 ± 4.21a12.3 ± 4.07a15.3 ± 4.31a14.3 ± 4.25a16.3 ± 6.72a
Silt (%)44.9 ± 10.43a47.3 ± 9.11a46.2 ± 8.75a43.77 ± 7.85a44.6 ± 8.54a43.9 ± 9.23a44.2 ± 8.06a43.3 ± 7.91a
Clay (%)45.3 ± 6.21a42.6 ± 4.98a45.3 ± 7.61a46.62 ± 6.99a43.1 ± 5.55a40.8 ± 5.08a41.5 ± 9.43a40.4 ± 7.03a
Soil TextureSilty ClaySilty ClaySilty ClaySilty ClaySilty ClaySilty ClaySilty ClaySilty Clay
Lowercase letters (a and b) represent significant differences in soil properties between organic rice farming and conventional rice farming of each year (p < 0.05). BD = bulk density; OM = organic matter; ECe = electrical conductivity; Avail. P = available phosphorous; Avail. K = available potassium; Avail. Ca = available calcium; Avail. Mg = available magnesium.
Table 3. SOC stock and SOC sequestration rate from 2018 to 2021.
PracticeSOC 2018
(kg C ha−1)
SOC 2021
(kg C ha−1)
ΔSOCS
(kg C ha−1 year−1)
ΔSOCS
(kg CO2eq ha−1 year−1)
Organic rice farming74,784.2a75,226.0a147.3539.9
Conventional rice farming66,995.4a67,254.2a86.3316.3
Lowercase letter (a) represent significant differences in values between years 2018 and 2021 (p < 0.05).
Table 4. GHG emissions of organic rice farming and conventional rice farming during 2018–2021 (mean ± standard deviation).
Life Cycle StageOrganic Rice FarmingConventional Rice Farming
Raw material production (kg CO2eq ha−1 year−1)Seeds15.6 ± 0.3a23.5 ± 0.5b
Gasoline21.3 ± 0.7a42.6 ± 0.7b
Diesel48.3 ± 1.2a60.4 ± 1.9b
Bio-fermented juice79.8 ± 5.10
Chemical fertilizers0884.2 ± 221.1
Herbicides072.6 ± 9.5
Pesticides048.8 ± 9.8
Field emission (kg CO2eq ha−1 year−1)Gasoline144.9 ± 4.6a289.9 ± 4.6b
Diesel343.1 ± 8.2a428.8 ± 13.7b
Herbicides0100.6 ± 15.1
Pesticides031.9 ± 6.4
CH42932.2 ± 1570.0a2876.8 ± 1684.5a
direct N2O122.5 ± 17.9a256.8 ± 43.4b
Harvesting121.3 ± 15.2a121.3 ± 15.2a
Total GHG (kg CO2eq ha−1 year−1)3829.0 ± 1623.1a5238.0 ± 2026.1b
Net GHG emissions (kg CO2eq ha−1 year−1)3289.1 ± 1085.2a4921.7 ± 1254.8b
Yield (kg ha−1 year−1)2812.5 ± 625.0a5312.5 ± 750.0b
CF intensity (kg CO2eq kg−1 rice yield)1.17 ± 0.78a0.93 ± 0.64b
Lowercase letters (a and b) represent significant differences in GHG emissions between organic and conventional rice farming (p < 0.05).
Table 5. Nitrogen footprint of organic rice farming and conventional rice farming during 2018–2021 (mean ± standard deviation).
PracticeNitrogen Footprint (kg Neq ha−1 Year−1)Total
(kg Neq ha−1 Year−1)
NF Intensity
(kg Neq kg−1 Rice Yield)
Agricultural InputsN2ONH3NO3NH4+
Organic rice farming0.014 ± 0.010a2.11 ± 1.1a322.4 ± 167.8a303.2 ± 104.1a323.1 ± 112.0a950.9 ± 378.8a0.34 ± 0.21a
Conventional rice farming173.3 ± 25.2b140.8 ± 45.2b21,448.5 ± 2105.6b20,167.6 ± 1780.6b21,492.2 ± 1967.5b63,422.5 ± 7866.3b11.94 ± 5.3b
Lowercase letters (a and b) represent significant differences in values between organic rice farming and conventional rice farming (p < 0.05).
Table 6. Economic return and CF, NF, and WF per net return of organic rice farming and conventional rice farming (mean ± standard deviation).
PracticeTotal Cost
(THB ha−1 Year−1)
Total Revenue
(THB ha−1 Year−1)
Net Economic Return
(THB ha−1 Year−1)
CF Per Net Return
(kg CO2eq THB−1 Year−1)
NF Per Net Return
(kg Neq THB−1 Year−1)
WF Per Net Return
(m3 THB−1 Year−1)
Organic rice farming10,420.0 ± 8125.0a45,000.0 ± 9375.0a34,580 ± 9375.0a0.09 ± 0.03a0.03 ± 0.02a98.9 ± 41.34a
Conventional rice farming21,612.8 ± 13,625.0b39,843.8 ± 12,500.0b18,231 ± 12,500.0b0.27 ± 0.08b3.48 ± 1.88b428.4 ± 253.7b
Lowercase letters (a and b) represent significant differences in values between organic rice farming and conventional rice farming (p < 0.05). THB is the official currency of Thailand (Thai Baht). Organic rice prices were 15–18 THB kg−1. Conventional rice prices were 7.0–7.5 THB kg−1 (Data were obtained from the farm owners during 2018–2021).
Publisher’s Note: MDPI stays neutral with regard to jurisdictional claims in published maps and institutional affiliations.

