Article

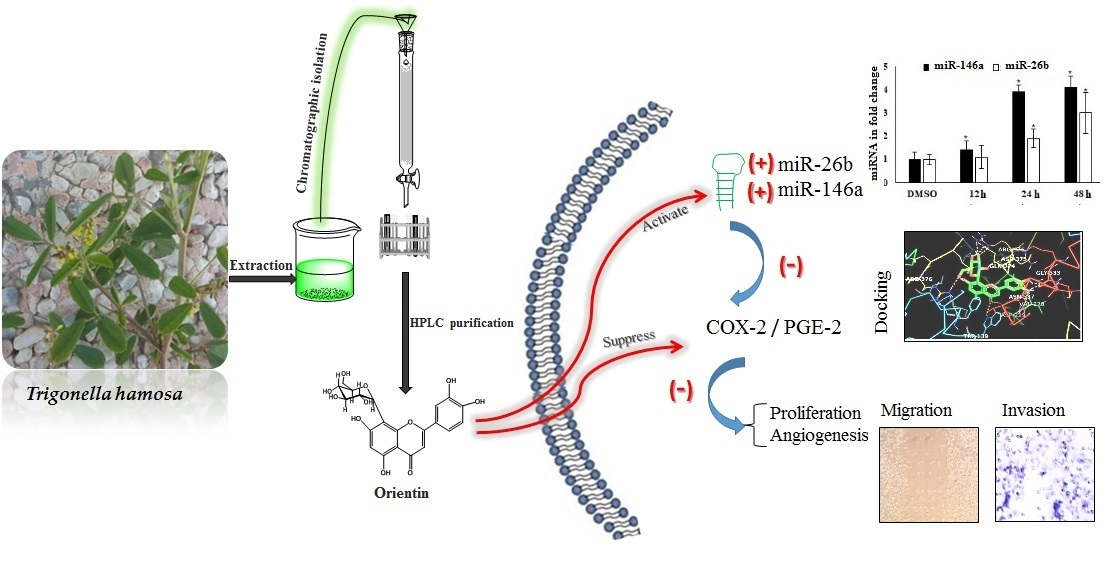
Orientin, a Bio-Flavonoid from Trigonella hamosa L., Regulates COX-2/PGE-2 in A549 Cell Lines via miR-26b and miR-146a

by
Hany Ezzat Khalil
1,2,*,
Hairul-Islam Mohamed Ibrahim
3,4,
Emad A. Ahmed
3,5,
Promise Madu Emeka
1 and
Ibrahim A. Alhaider
1,6
1
Department of Pharmaceutical Sciences, College of Clinical Pharmacy, King Faisal University, Al-Ahsa 31982, Saudi Arabia
2
Department of Pharmacognosy, Faculty of Pharmacy, Minia University, Minia 61519, Egypt
3
Department of Biological Sciences, College of Science, King Faisal University, Al-Ahsa 31982, Saudi Arabia
4
Department of System Biology, Pondicherry Center for Biological Science and Educational Trust, Kottakuppam 605104, India
5
Lab of Molecular Physiology, Department of Zoology, Faculty of Science, Assiut University, Assiut 71515, Egypt
6
Research and Development, Saudi Food and Drug Authority, Riyadh 13312, Saudi Arabia
*
Author to whom correspondence should be addressed.
Pharmaceuticals 2022, 15(2), 154; https://doi.org/10.3390/ph15020154
Submission received: 16 December 2021 / Revised: 16 January 2022 / Accepted: 23 January 2022 / Published: 27 January 2022

Abstract

:
Cancer is a severe health condition and considered one of the major healthcare issues and is in need of innovative strategy for a cure. The current study aimed to investigate the chemical profile of Trigonella hamosa L. and a potential molecular approach to explain its regulation in cancer progression through an inflammatory mediator (COX-2) in A549 non-small lung cancer cell lines via in silico, mechanistic and molecular aspects. T. hamosa was extracted and then subjected to a CCK-8 cell viability assay in different cancer cell lines including MDA-MB-231, A549 and HCT-116. Total extract was subjected to several chromatographic techniques to yield orientin (OT); the structure was elucidated by inspection of NMR spectroscopic data. To achieve anticancer effects of OT, a cell viability assay using a CCK-8 kit, immunoprecipitation by Western blot, cell migration using a wound healing assay, cell invasion using a Matrigel-Transwell assay, apoptosis by AO/EB dual staining, flow cytometric analysis and DAPI staining, a silenced COX-2 model to determine PGE-2 production and real-time PCR and Western blot of BCL-2, CYP-1A1, iNOS and COX-2 markers were carried out. The results demonstrated that OT decreased the cell proliferation and controlled cell migration and invasive properties. OT destabilized the COX-2 mRNA and downregulated its expression in A549 cell lines. Virtual binding showed interaction (binding energy −10.43) between OT and COX-2 protein compared to the selective COX-2 inhibitor celecoxib (CLX) (binding energy −9.4). The OT-CLX combination showed a superior anticancer effect. The synergistic effect of OT-CLX combination was noticed in controlling the migration and invasion of A549 cell lines. OT-CLX downregulated the expression of BCL-2, iNOS and COX-2 and activated the proapoptotic gene CYP-1A1. OT mitigated the COX-2 expression via upregulation of miR-26b and miR-146a. Interestingly, COX-2-silenced transfected A549 cells exhibited reduced expression of miR-26b and miR-146a. The findings confirmed the direct interaction of OT with COX-2 protein. PGE-2 expression was quantified in both naïve and COX-2-silenced A549 cells. OT downregulated the release of PGE-2 in both tested conditions. These results confirmed the regulatory effect of OT on A549 cell growth in a COX-2-dependent manner. OT activated apoptosis via activation of CYP-1A1 expression in an independent manner. These results revealed that the OT-CLX combination could serve as a potential synergistic treatment for effective inflammatory-mediated anticancer strategies.

Graphical Abstract

1. Introduction

In spite of the recent approaches in the field of synthetized pharmaceutical candidates, plants and plant-derived products remain the pivotal reservoir of bioactive, eco-friendly and unique molecules which play crucial therapeutic roles. Recently, many plant-derived natural products have been reported as anticancer agents. Almost 50% of the anticancer drugs under clinical trials are from natural sources or their derivatives [1]. Saudi Arabia has a rich diversity of plants; the flora comprises about 2250 plants distributed throughout the kingdom [2]. Numerous plants have been used by the local communities for the treatment of various ailments [3,4,5]. The genus Trigonella belongs to the family Fabaceae. This genus comprises annual or perennial herbs, often with fragrant, trifoliate compound leaves. Six species from this genus are found in Saudi flora and especially in Eastern Province [6]. Plants belonging to this genus are widely used in ethnomedicine for a variety of illnesses with anti-inflammatory, antipyretic, antidiabetic, antioxidant and anticancer effects [7,8,9,10,11,12,13]. Recent studies reported the role of Trigonella foenum graecum L. and Trigonella gharuensis in downregulation of COX-2 expression and reduction in PGE-2 levels [14,15].
Trigonella hamosa L. (T. hamosa) as an example of this genus is a wild and ornamental plant, which is found in both natural desert conditions and/or cultivated landscapes. T. hamosa is known as Hasawi gardener and it is reported that Bedouins used to eat it fresh and uncooked as a refreshment herb in salad [6]. T. hamosa was reported to contain volatile oils and only two saponin compounds which showed antidiabetic activity as well as antimicrobial and antioxidant activities [16,17,18,19,20]. The current study led to the isolation of a c-type flavone glycoside named orientin (OT). Flavonoids are a group of natural products which are important for human health [21]. Flavonoids exhibited anti-inflammatory properties through regulation of inducible nitric oxide synthase (iNOS), cyclooxygenase-2 (COX-2) and other inflammatory-related factors [22,23,24]. OT has been extracted from various medicinal plants. Previous studies showed that OT suppresses the proliferation of cancer cells and increases in vitro apoptosis in various cell lines, including hepatoma cell lines [25], esophageal carcinoma cells [13,26], T24 human bladder carcinoma cells [27] and breast cancer cells [28]. In addition, it also inhibits migratory cells and tumor invasion [29]. These activities could be applied as a possible therapeutic agent for the treatment of cancer metastasis. Antiproliferation, proapoptotic and antimetastatic effects of OT have been attributed to its involvement in dysregulation of various signaling pathways. For instance, OT was found to suppress the transcription nuclear factor-kappa B (NF-κB) in T24 human bladder carcinoma cells and colorectal cancer [27], and it also inhibits NF-κB signaling pathways [30]. Epidemiological and preclinical studies have demonstrated a role for non-steroidal anti-inflammatory drugs (NSAIDs) in the prevention of human cancers. Some of these drugs block endogenous prostaglandin synthesis through inhibition of cyclooxygenase-2 (COX-2) enzymatic activity. The contribution of COX-2 was explored for cancer progression through various mechanisms such as induction of prostaglandins, inhibition of apoptosis, promotion of angiogenesis and increasing tumor cell invasiveness [31,32,33]. COX-2 is overexpressed in several cancers, including cancer of the colon, breast, pancreas and lung [34,35]. Recently, preclinical studies demonstrated that OT significantly modulates the overexpression of inflammatory inducible enzymes including inducible nitric oxide synthase (iNOS) and COX-2 [36,37]. COX-2 is regulated by various epigenetic factors such as microRNAs (miRNAs), which play a major role in cancer management. These miRNAs are small non-coding nucleotides regulating post-transcription of mRNA in various biological processes including cancer [38]. COX-2 and its targeting miR-146a expression levels were considered as prognostic biomarkers for survival in various cancers including lung, breast, pancreatic, esophageal and gastric cancer [39,40,41,42]. miR-146a is an endogenous dual inhibitor of arachidonic acid metabolism in lung cancer and COX-2 mediated prostaglandin production [43]. In addition, miR-26b suppresses tumor cell proliferation, migration and invasion by directly targeting COX-2 in lung cancer cells [44,45]. Despite the role of OT in anti-inflammatory mediators, its regulation of miRNA-26b and 146a in inflammation and lung cancer are unexplored. On the other hand, there is no further chemical or biological data on this plant, which encouraged us to investigate the chemical profile and its biological effects on cancer progression through inflammatory mediators (COX-2). In the present study, various chromatographic procedures were applied and led to isolation of OT. The isolated OT was investigated for its anticancer activity on the A549 lung cancer cell line. The action of OT was compared with the selective inhibitor celecoxib (CLX). Meanwhile, this study also assessed regulation of OT in COX-2-silenced A549 cancer cells and its substrate prostoglandin-2 (PGE-2) levels. The current approach explains the regulatory effect of OT on COX-2 expression in A549 cell lines via in silico, mechanistic and molecular aspects.

2. Results

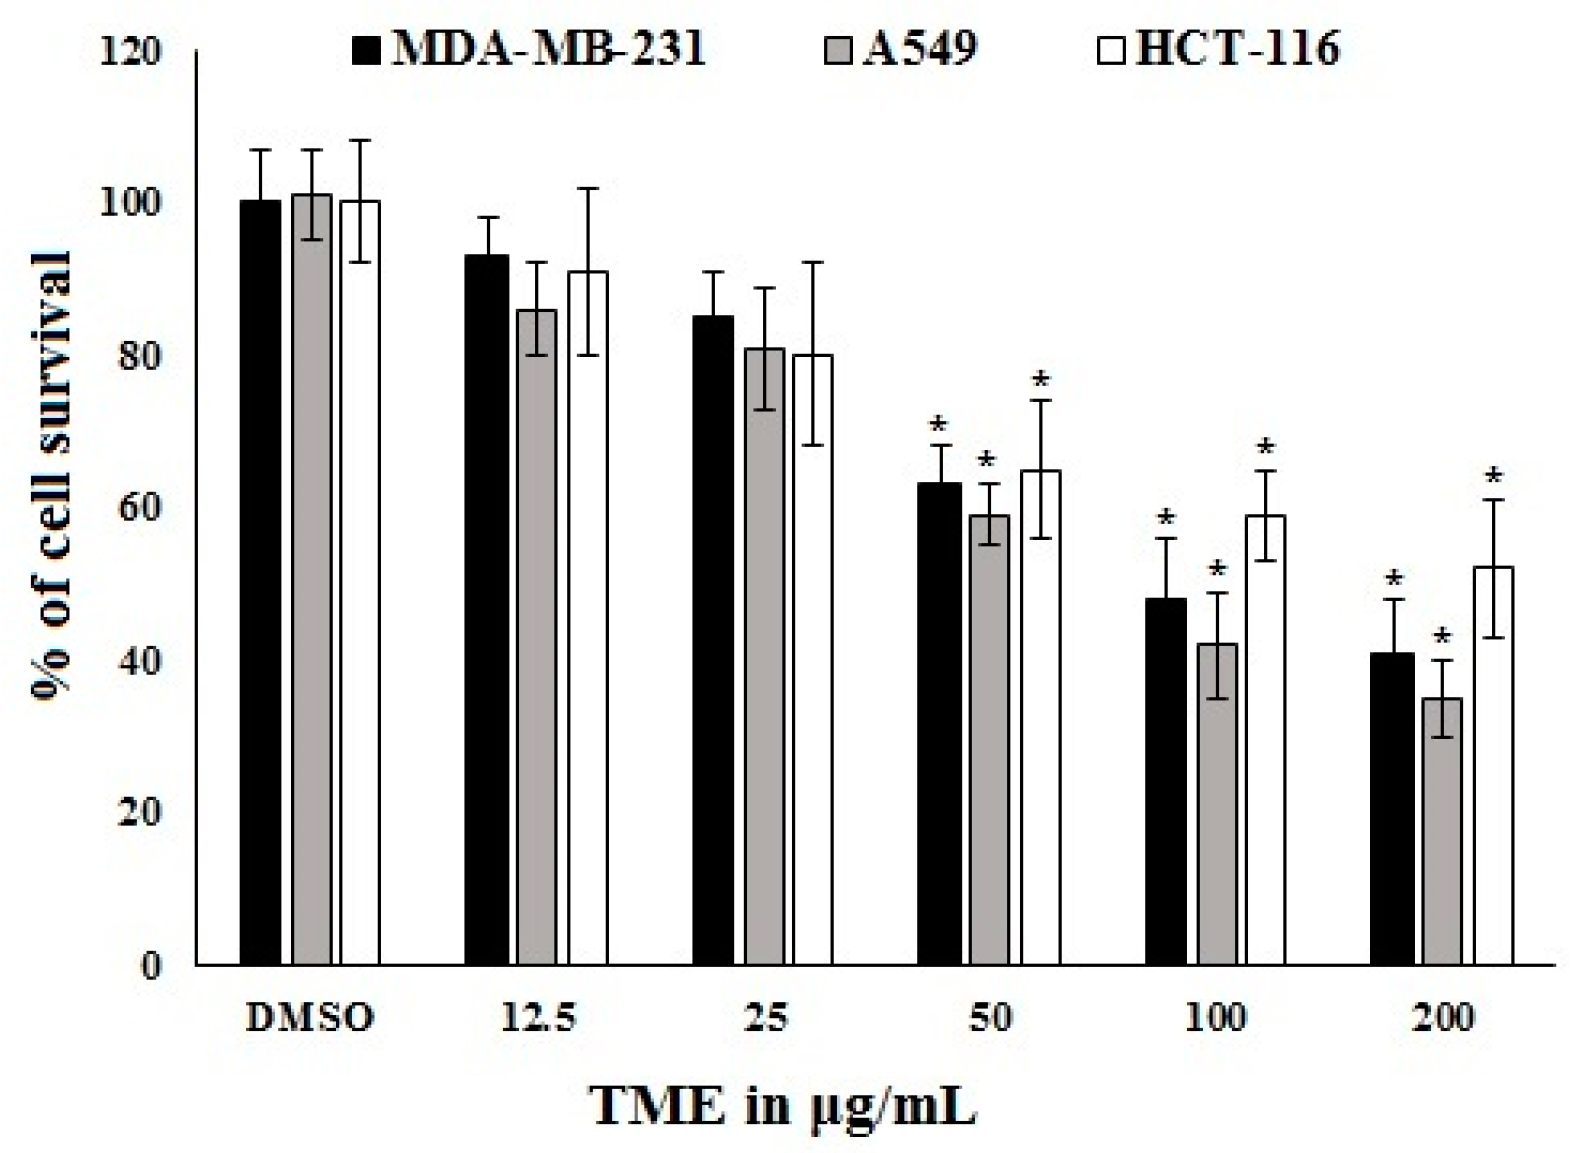
2.1. Bioassay-Guided Investigation

The bioassay-guided investigation of total methanol extract (TME) was performed on different cancer cell lines including MDA-MB-231, A549 and HCT-116 using a cell viability assay (CCK-8 kit). The TME concentrations were tested from 12.5 to 200 μg/mL. Results showed potent inhibition of cell survival and viability of tested cancer cell lines at a concentration of 100 and 200 μg/mL (Figure 1).

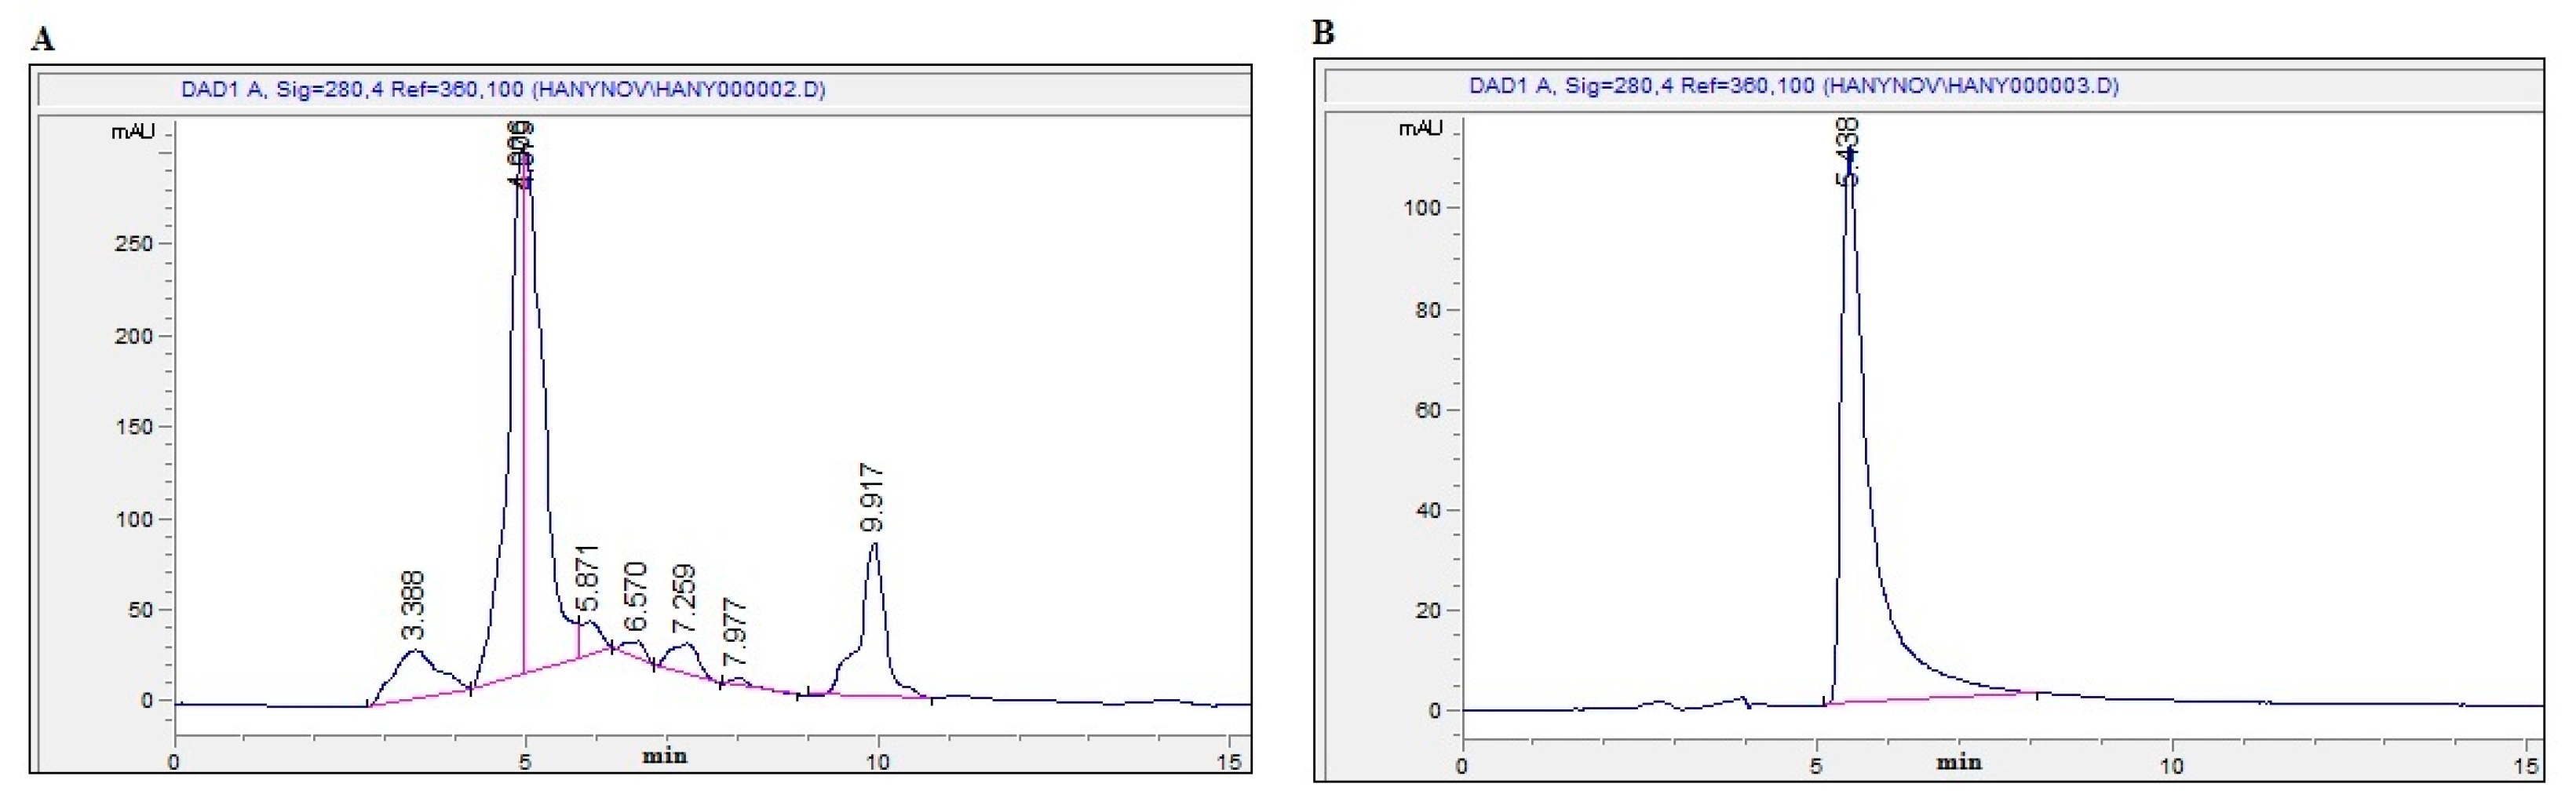
2.2. Isolation and Identification of OT

The TME of air-dried aerial parts of T. hamosa (30 g) was subjected to several and repeated chromatographic techniques to give the pure flavonoid compound OT (12 mg) (Figure 2A,B). The structure was elucidated by inspection of 1D- and 2D-NMR spectroscopic data (Supplementary File S1) and compared with literature values [46]. This study represents the first report on the isolation of OT from T. hamosa. OT: 1H-NMR (400 MHz, DMSO-d6) δ: 12.93 (1H, s), 7.48 (1H, d, J = 8.88 Hz, H-6`), 7.42 (1H, S, H-2`), 6.89 (1H, d, J = 8.44 Hz, H-5`), 6.62 (1H, s, H-3), 6.27 (1H, s, H-6), 4.71 (1H, d, J = 9.88 Hz, H-1``); 13C-NMR (100 MHz, DMSO-d6) δ: 164.3 (C-2), 102.3 (C-3), 182.1 (C-4), 160.2 (C-5), 98.2 (C-6), 162.5 (C-7), 104.0 (C-8), 155.9 (C-9), 103.9 (C-10), 121.9 (C-1`), 113.7 (C-2`), 145.4 (C-3`), 149.4 (C-4`), 115.8 (C-5`), 119.7 (C-6`), 73.1 (C-1``), 70.8 (C-2``), 78.2 (C-3``), 70.4 (C-4`), 81.1 (C-5``), 61.3 (C-6``).

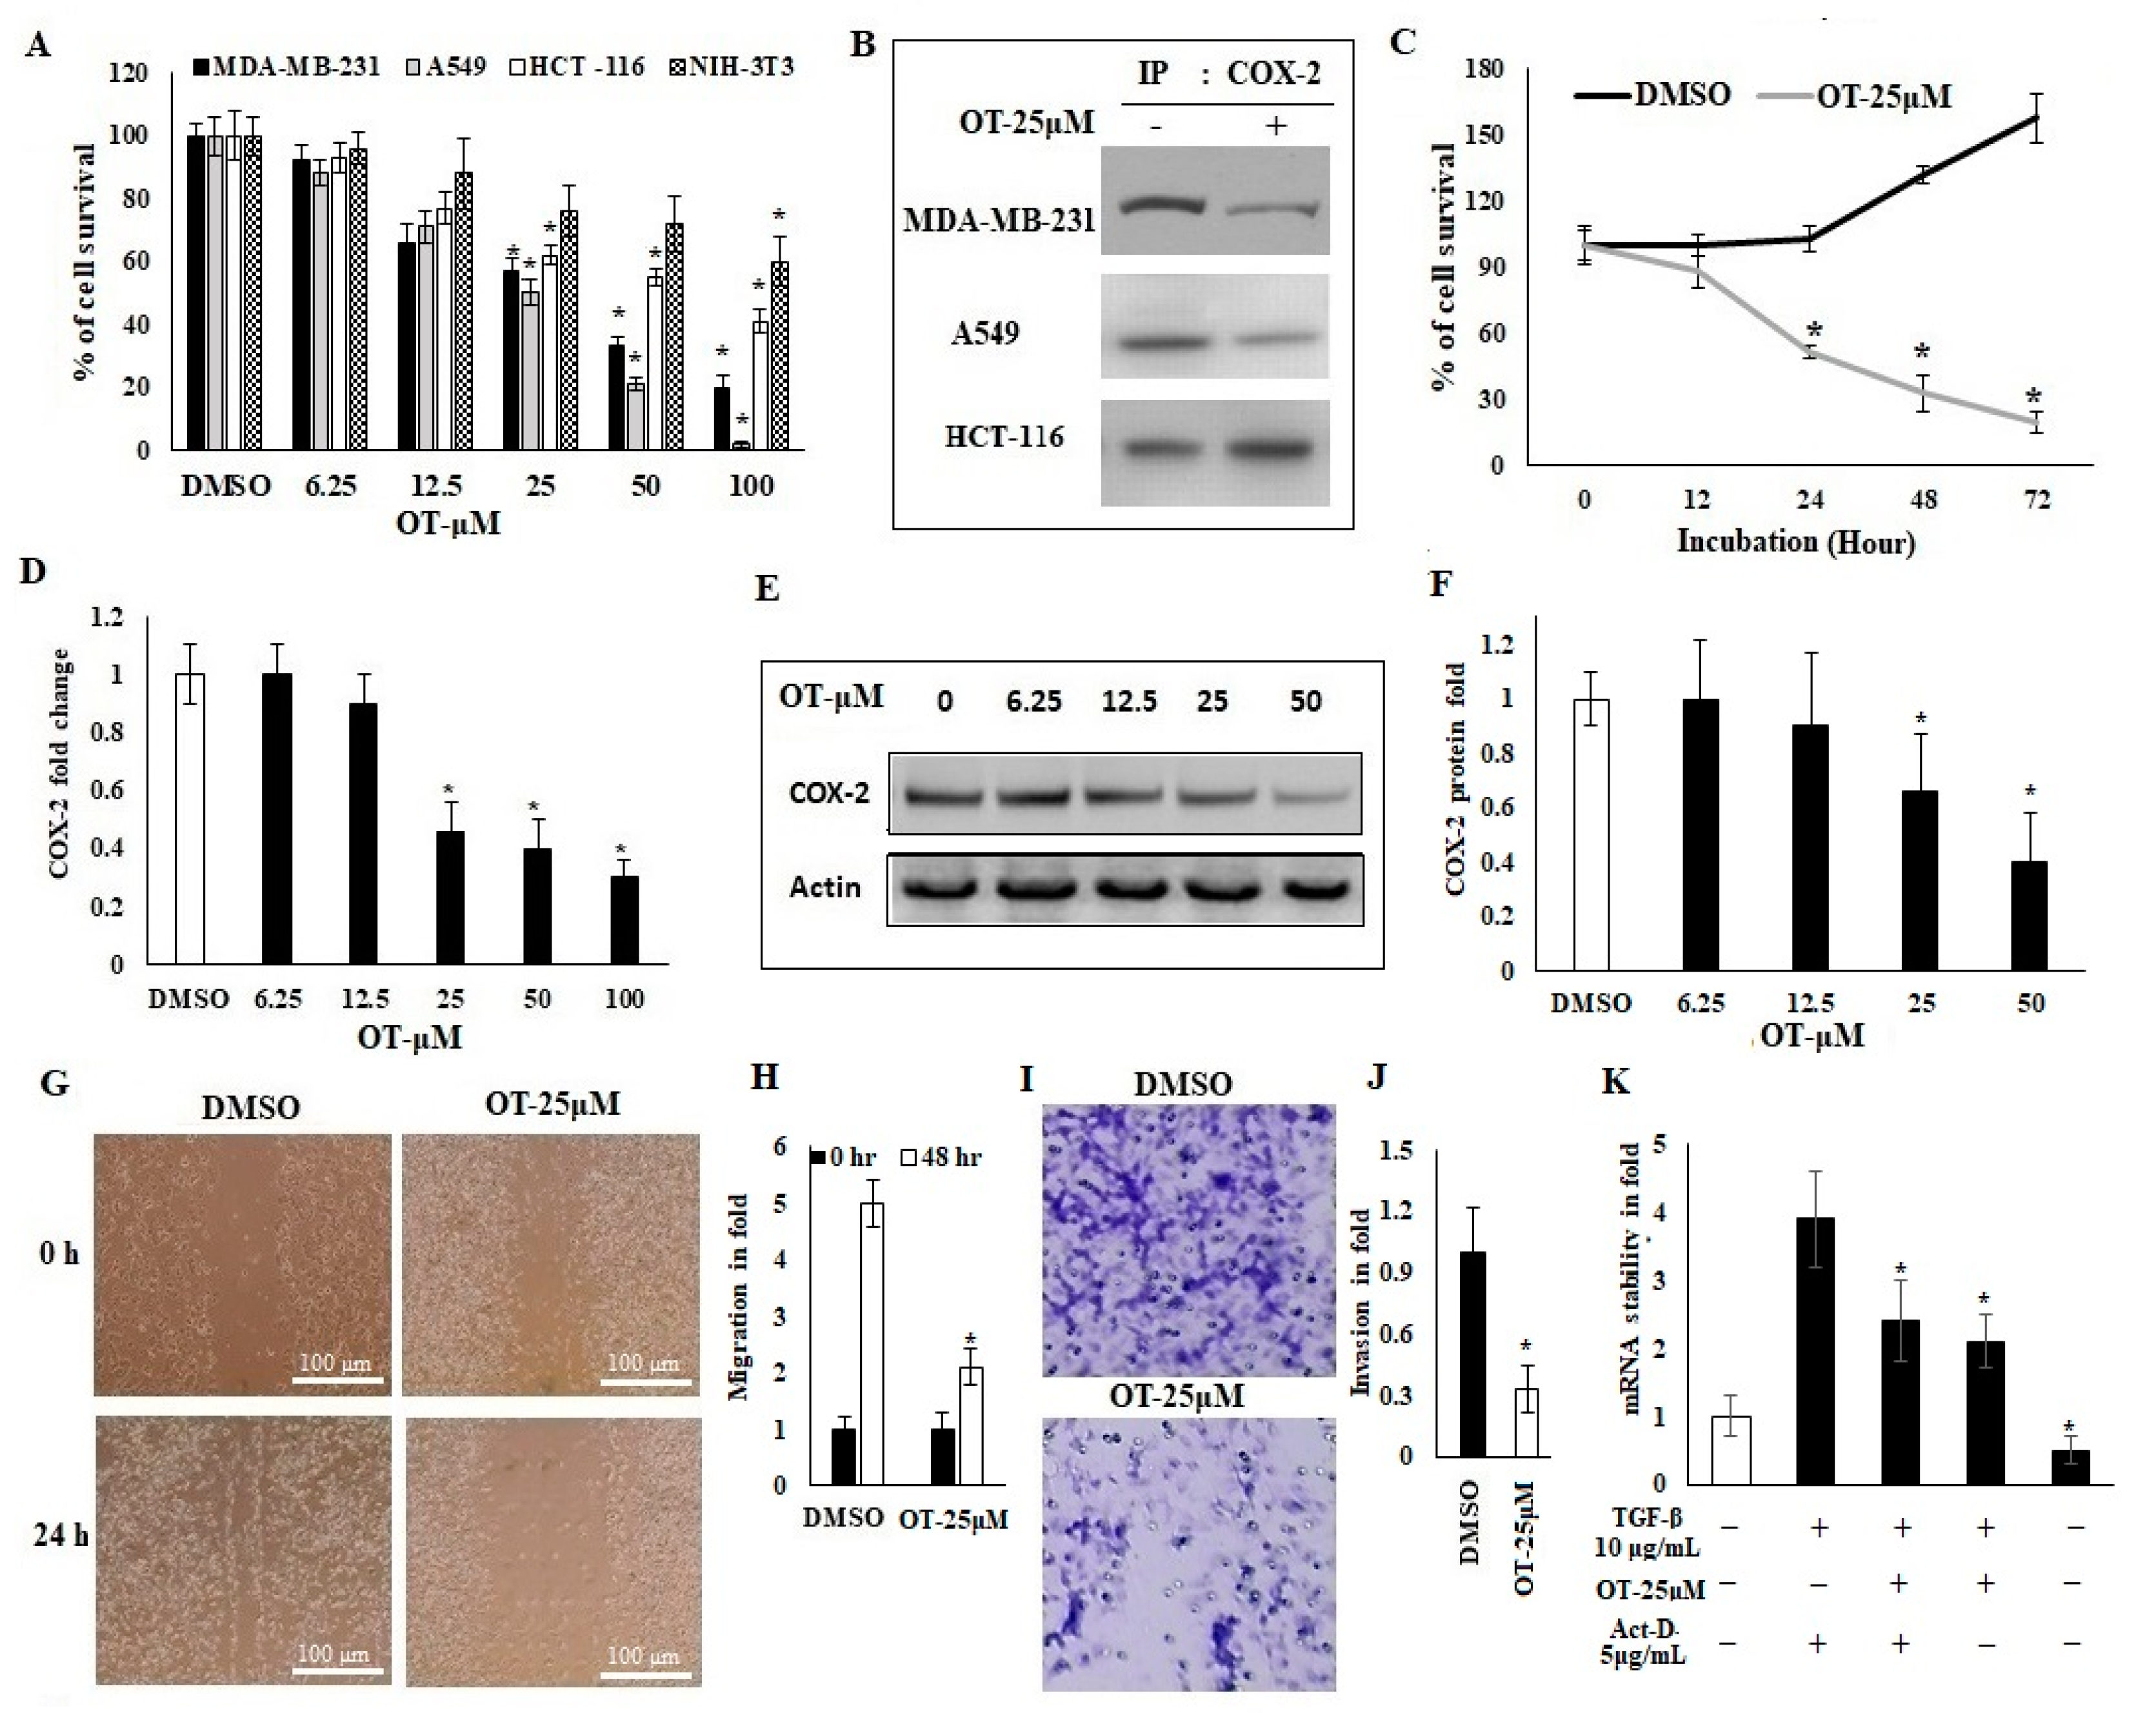
2.3. Antiproliferative Activity of OT and Its Effect on COX-2 Expression in A549 Cell Lines

Based on the bioassay-guided results, the current study included a series of experiments to assess the effect of OT on cell viability using a CCK-8 kit assay, migration using a wound healing assay and invasive properties using a Matrigel–Transwell assay on different cancer cell lines and normal fibroblast cell lines (NIH-3T3). The results revealed that OT isolated from TME inhibits the MDA-MB-231, A549 and HCT-116 cancer cell lines at different inhibitory concentrations. The IC50 values of OT towards MDA-MB-231, A549, HCT-116 and NIH-3T3 were 28.9 μM, 21.2 μM, 59.1 μM and >100 μM, respectively (Figure 3A, Supplementary File S2). Cell viability results showed that A549 is more sensitive than the other tested cell lines in this study. Regarding biocompatibility examination of OT, normal NIH-3T3 fibroblast cell lines showed ≥75% cell viability up to 50 μM of OT. The mechanistic interaction between the OT and COX-2 protein was quantified using an immunoprecipitation method. The results showed potent polarized interactions towards A549 COX-2 protein compared to MDA-MB-231 and HCT-116. These results confirmed that OT was directly involved in COX-2 regulation in cellular transcription (Figure 3B). Based on the above results, the A549 cell line was selected for further anticancer studies. A time-dependent study of OT against A549 cell lines was conducted. The results showed 48% cell survival inhibition at 24 h but 80% inhibition at 72 h of OT treatment (25 μM) (Figure 3C). Moreover, OT inhibits the expression of COX-2 in A549 cells. The mRNA and protein expressions of COX-2 were gradually reduced, dependent on the dose of OT (Figure 3D–F). The migrative and invasive properties of A549 cell lines were also studied. OT inhibits significant migrative properties after 48 h. OT 25 μM treatments showed only 25% migration compared to untreated cells (Figure 3G,H). Cancer cell invasion is a key factor for recurrence and failure of conventional therapies. Therefore, the current study was focused on verifying the anti-invasive properties of OT by using A549 cell lines. The results showed that the invasion of A549 was inhibited up to 72% compared to the control untreated cells (Figure 3I,J). From the observed findings, the study was directed towards the effect of OT on COX-2 inhibition, virtual docking and challenge models using the standard positive inhibitor CLX of COX-2.

2.4. OT Destabilized the COX-2 mRNA in A549 Cell Lines

Based on the effect of OT on COX-2 mRNA expression, a COX-2 mRNA stability experiment was performed to demonstrate the possible mechanism of involvement of OT in the COX-2 transcriptome. The results quantified COX-2 mRNA stability in the presence or absence of OT 25 µM, TGF-β and actinomycin D (Act-D) in A549 cell lines. Quantification of COX-2 mRNA revealed a decrease in mRNA expression with OT, OT with TGF-β stimulated cell groups compared to those treated with TGF-β and stimulated overexpression conditions with Act-D. The results demonstrated a significant reduction in COX-2 mRNA expression with OT-treated cells (Figure 3K).

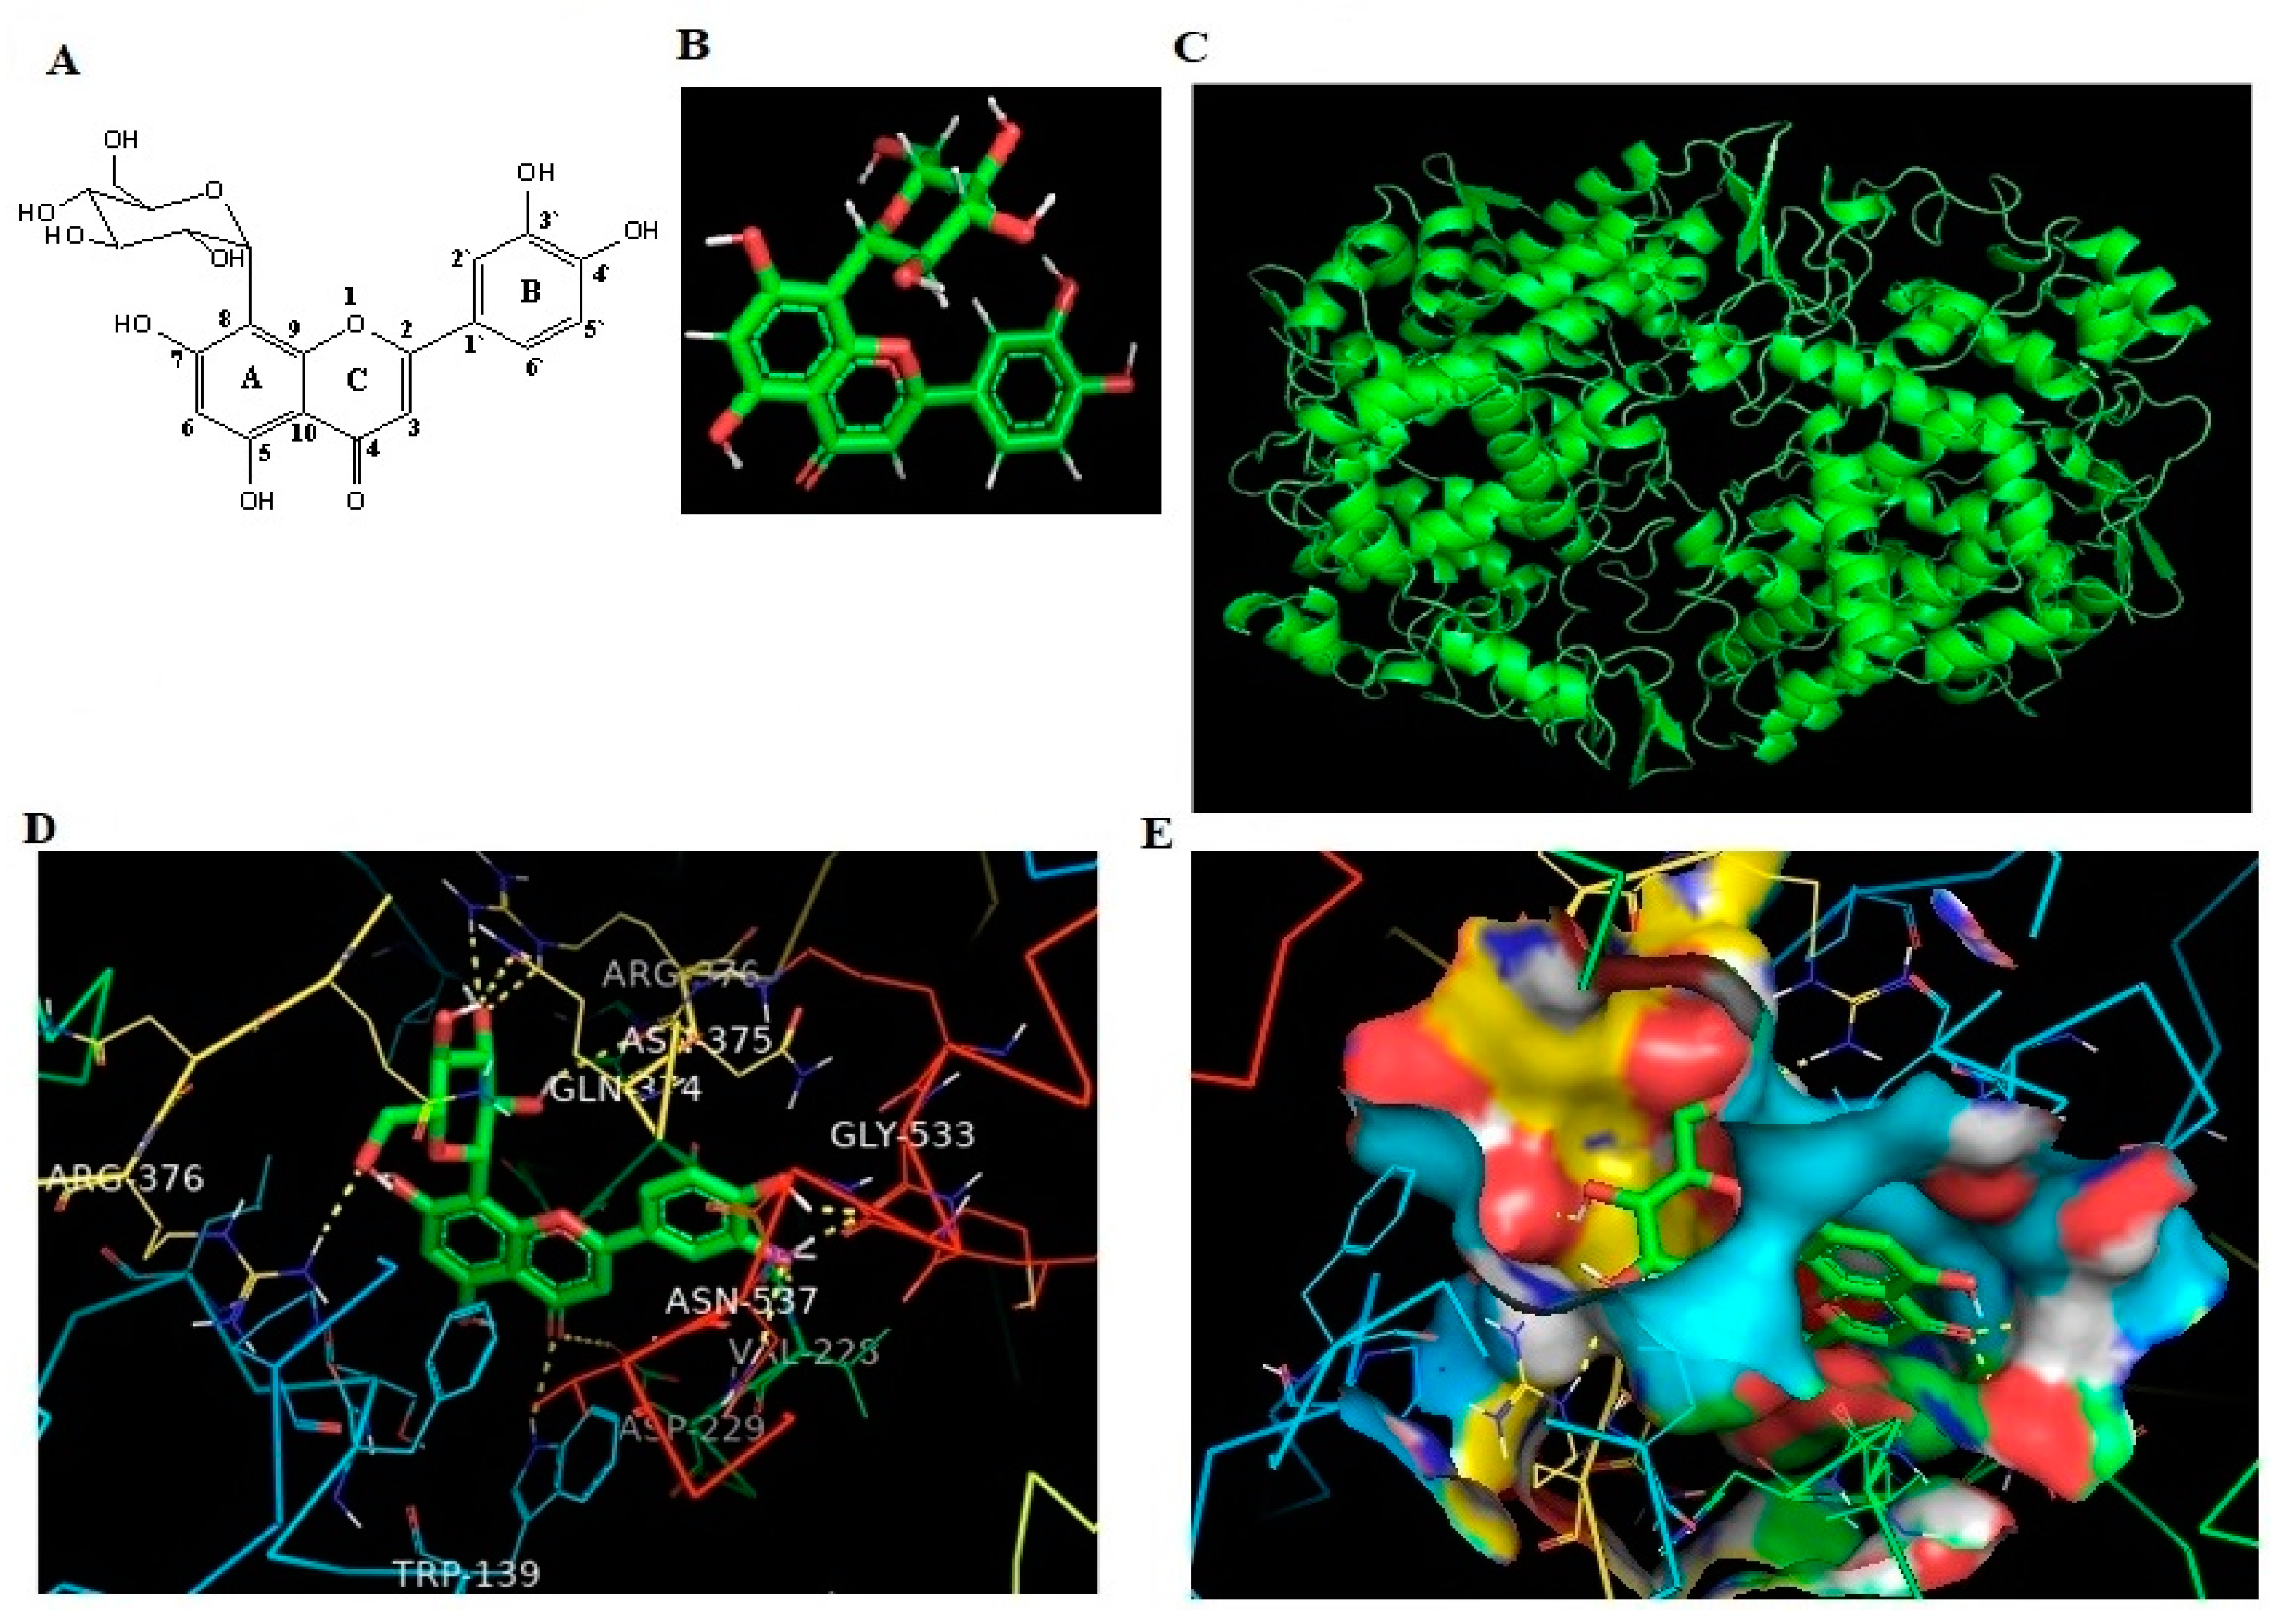
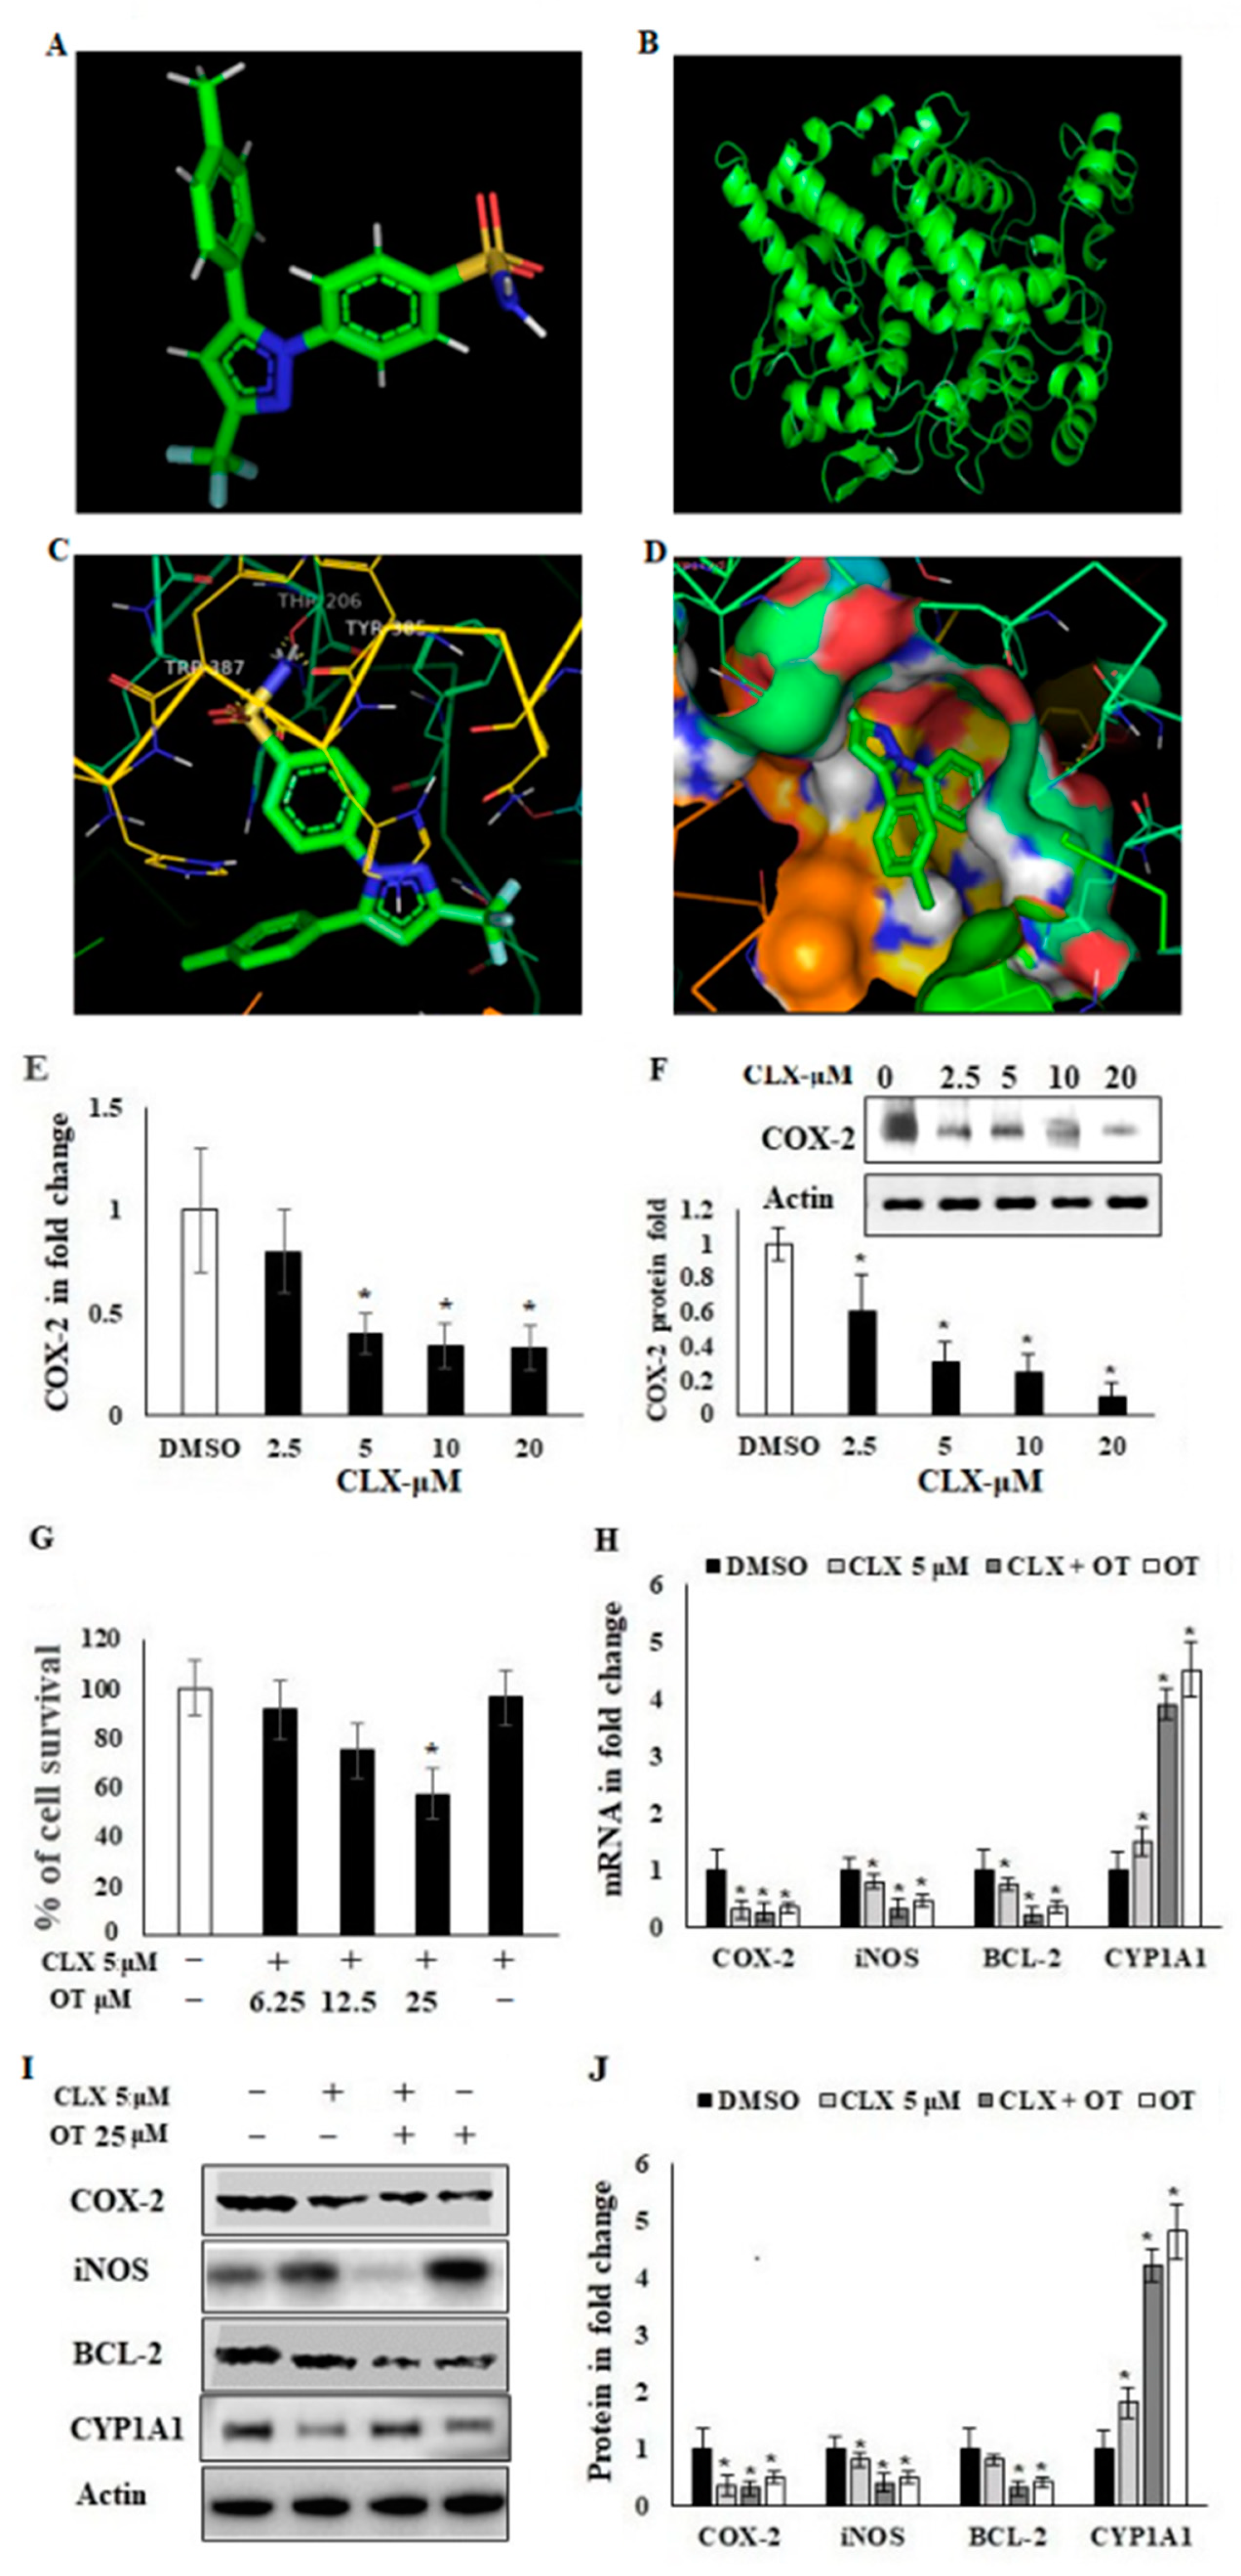
2.5. In Silico Binding of OT against Human COX-2 Protein

The findings of the above cellular inhibition assays led to continued computational interactions. In silico docking of ligand (OT) and protein (human COX-2) analysis was carried out using AutoDock computational software. The 2D and 3D structures of OT with carbon arrangements were examined using the PDB and pymol tool and we found 21 carbon atoms with three ring structures (Figure 4A,B). The 3D structure of human COX-2 (PDB ID: 5kir) was taken from the PDB and we found two domains and four linked chains (Figure 4C). The active site of the COX-2 enzyme was predicted using Q-site finder and was assessed for further confirmation. The interaction of OT with human COX-2 protein showed significant binding energy (−10.43) and intermol energy (−10.37). The binding pocket of OT with COX-2 protein in chain B and C showed an electronegative affinity nature (Figure 4D,E). This chain B is important for COX-2 drug selectivity due to the amino acid residues of VAL-228 and ASP-229. The ARG at amino acid residue position 376 changes the chemical environment and ligand interactions. OT docked with the ARG-376 amino acid residue of COX-2 and was confirmed by bond formations (Figure 4D). These significant bindings take place in both chain A and B (Table 1), which are necessary sites for the peptide binding and excision site of PGE-2, which caused competitive inhibition in the COX-2 protein with OT, and this was confirmed by an immunoprecipitation experiment (Figure 3B).

2.6. Effect of OT on Apoptotic Markers and DNA Damage Using CLX-Induced A549 Cells

To elucidate the potential effect of CLX against A549 cancer inhibition, docking and apoptotic molecular markers were assessed. The in silico docking of CLX (CID-2662) showed that it binds at an analogical position of the amino acid residue of COX-2 with a binding energy (−9.4) comparatively less than the intermol energy of OT (−10.37) (Figure 5A–D, Table 2). CLX is a standard selective COX-2 inhibitor. CLX 5 μM significantly reduced the COX-2 mRNA expression in A549 cell lines (Figure 5E). It also significantly reduced the COX-2 protein expression in A549 and it was confirmed that the COX-2 level was regulated in a CLX-dependent manner (Figure 5F). OT possibly changes cell viability of CLX-induced cells. Further, A549 cells were pretreated with CLX 5 μM, and the cell migration and invasion were significantly inhibited (Supplementary File S3), whereas the cell viability of CLX-challenged cells was potentially inhibited up to 54% by OT (25 μM) (Figure 5G). The inhibition of COX-2 mRNA and protein expression level were downregulated by OT treatment at a concentration of 25 μM (Figure 5H,J). OT also regulates migration and apoptotic markers such as iNOS, BCL-2 and CYP-1A1. iNOS and BCL-2 mRNA and protein expression were significantly downregulated in CLX-challenged OT-treated cells. The metabolic regulator CYP-1A1 was upregulated by a treatment combination of CLX (5 μM) and OT (25 μM), which was significant compared to cells treated with OT alone (Figure 5H,J). These results revealed that OT (25 μM) treatment alone regulates positive function against COX-2, iNOS and BCL-2 markers, but it has a synergistic function with CLX to regulate CYP-1A1.
The regulation of OT (25 μM) on the apoptotic cellular markers was confirmed using dual acridine orange/ethidium bromide (AO/EB) staining. The number of apoptotic A549 cancer cells was significantly increased with CLX (5 μM) with OT (25 μM) treatment as well as OT (25 μM) alone. The yellow-orange nuclei cells resemble early apoptotic cells and red nuclei cells resemble late apoptotic cells (Figure 6A). Further confirmation was carried out to find whether OT regulates nuclear degradation through apoptosis of A549 cell lines. Cells were pretreated with CLX, incubated with and without OT (25 μM) for 12 h and stained by the nuclear dye DAPI. Chromatin degradation and condensation were characterized by bluish white fluorescence staining (Figure 6B). The results revealed that OT potentially induced chromatin modification in CLX-challenged cells; CLX alone showed negative fluorescence and OT alone showed significant chromatin condensation but less than those of combined CLX-OT treatments.

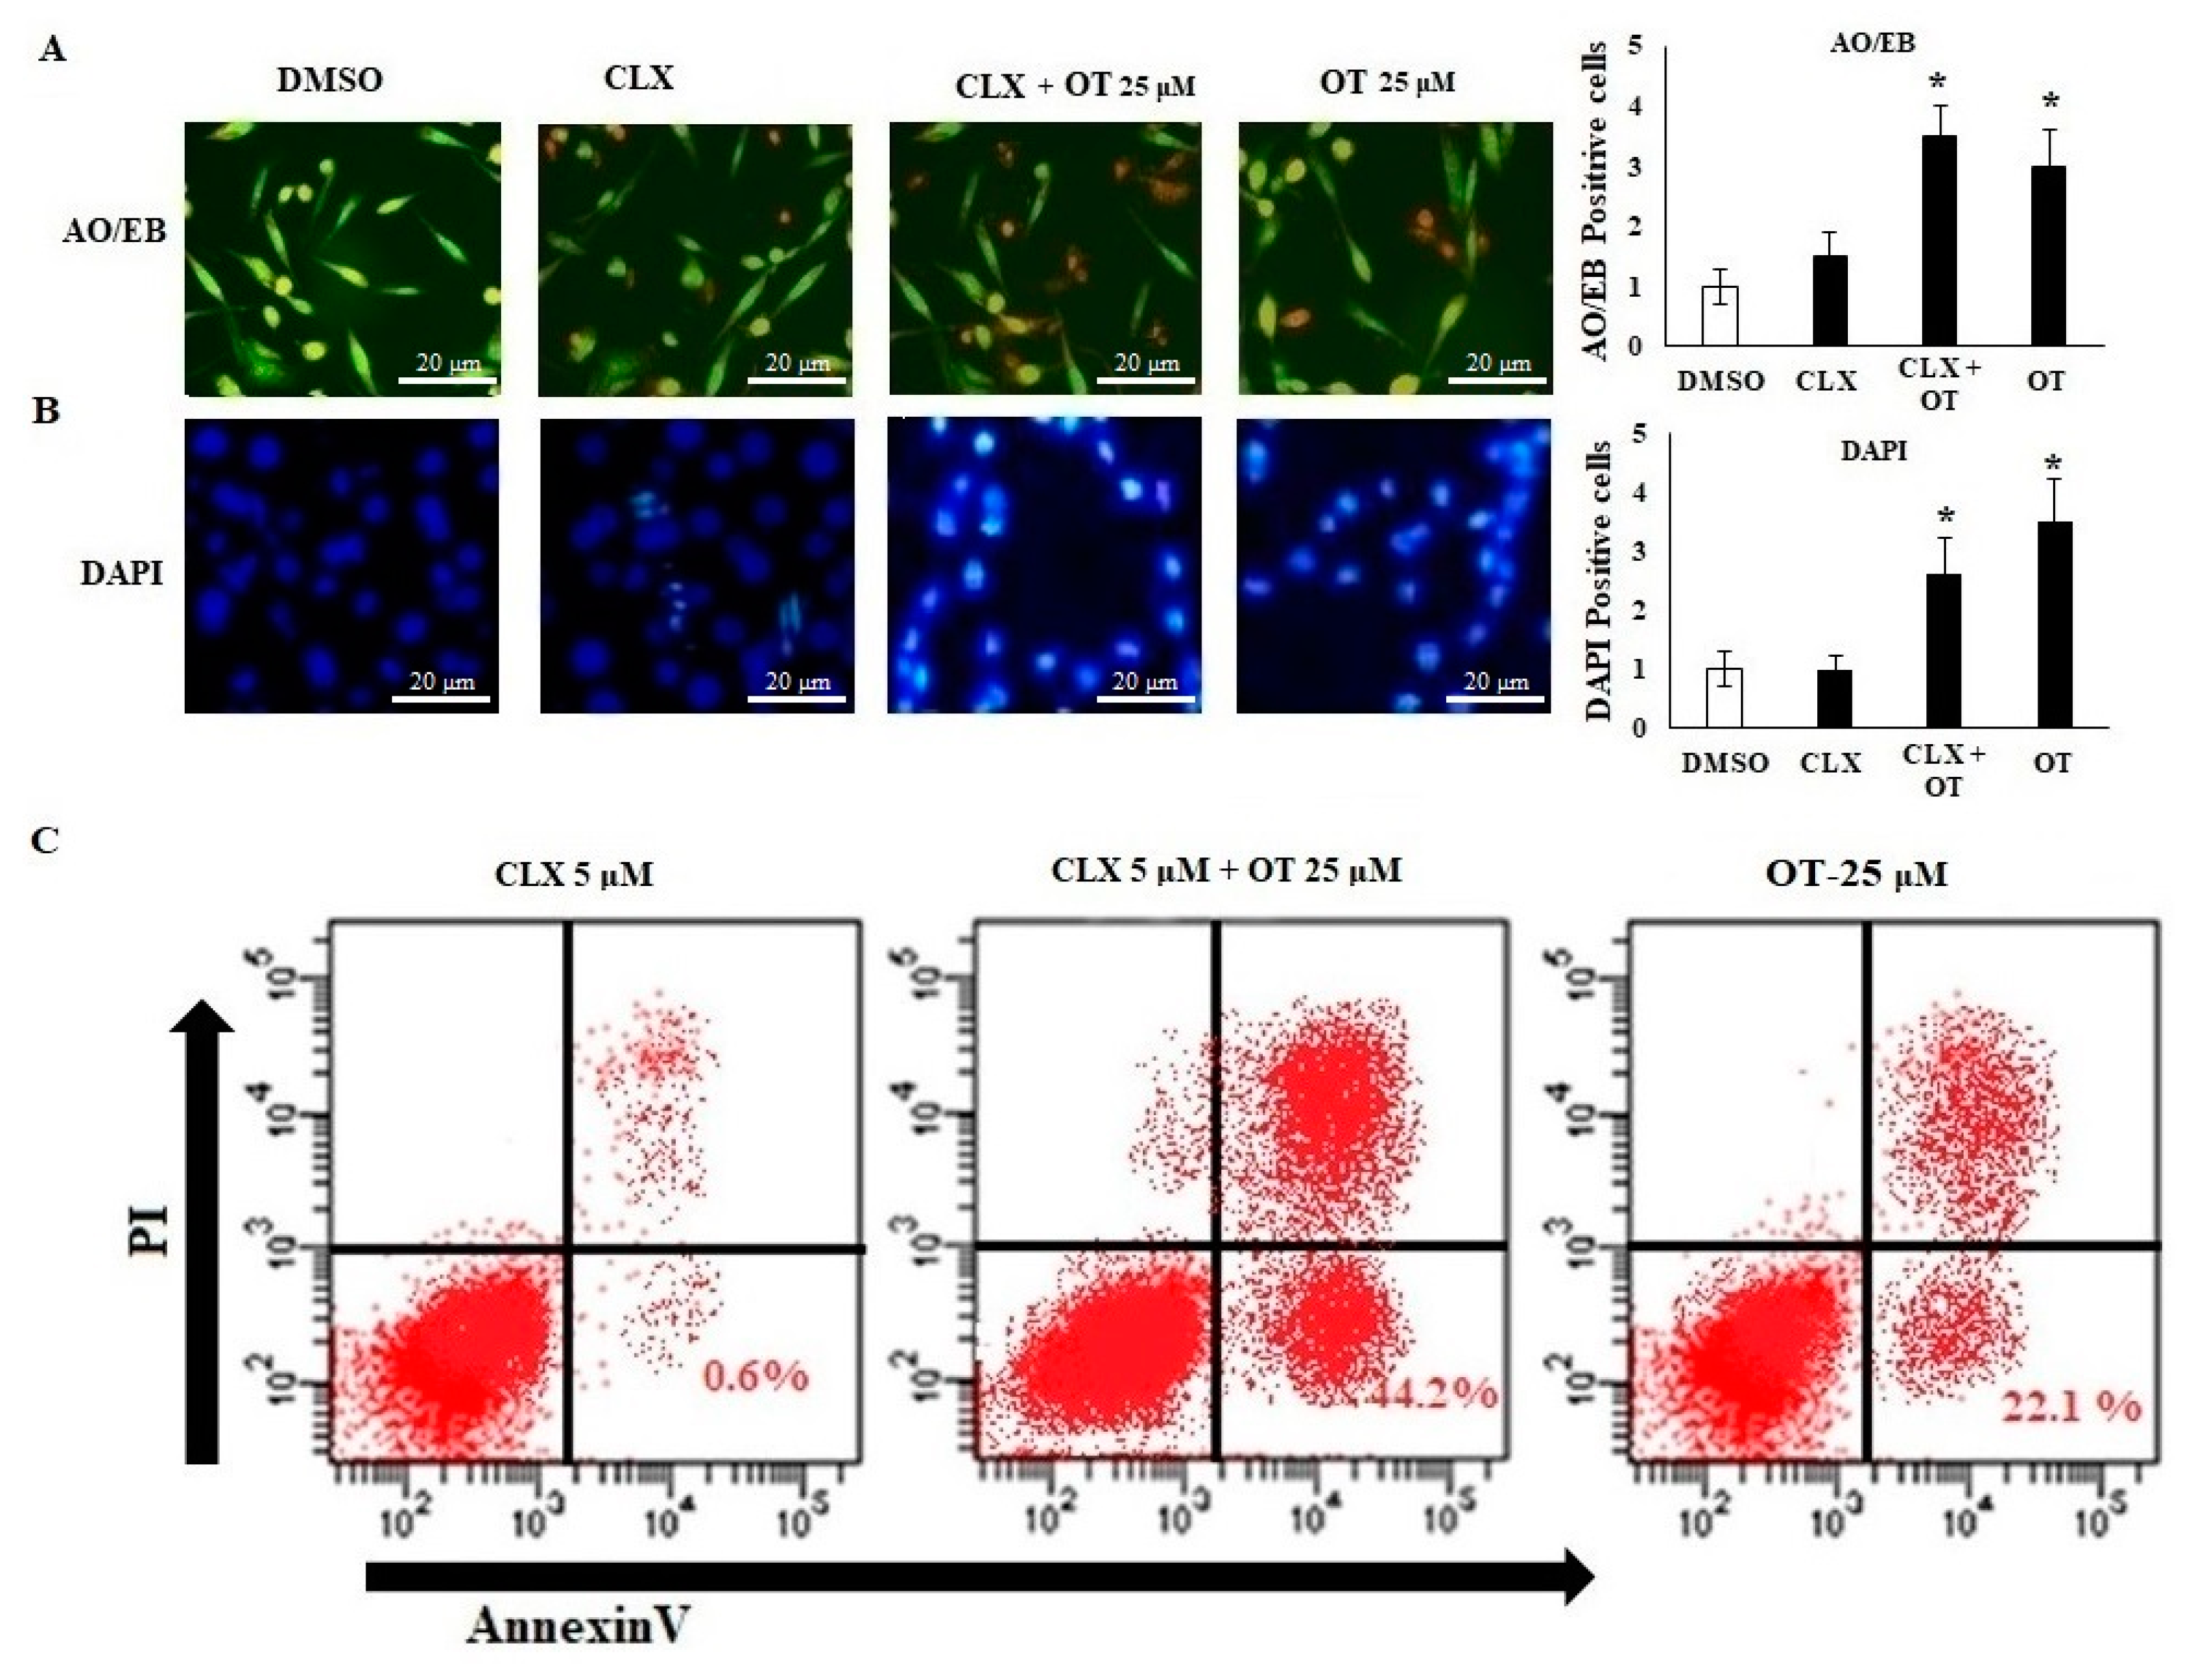
2.7. Effect of OT on Apoptotic Cell Modifications in A549 Cell Lines

An analysis of necrosis and apoptosis in A549 cell lines using a flow cytometry method was carried out. The annexin-V with PI staining explores the cellular modifications and cell viability. In this study, CLX-challenged A549 cells were treated with OT (25 µM), and showed cell differentiation and modifications (Figure 6C). The induction of apoptosis was significant in combined CLX-OT-treated cells compared to cells treated with OT and CLX alone. The apoptotic induction was 44.2% in combination-treated cells whereas only 22.1% was observed in cells treated with OT alone (Figure 6C). A549 cells treated with CLX alone did not show significant (0.6%) apoptotic modifications. These data highlight the synergistic effect of CLX-OT dual treatment to modify the cellular structures in A549 cancer cell lines.

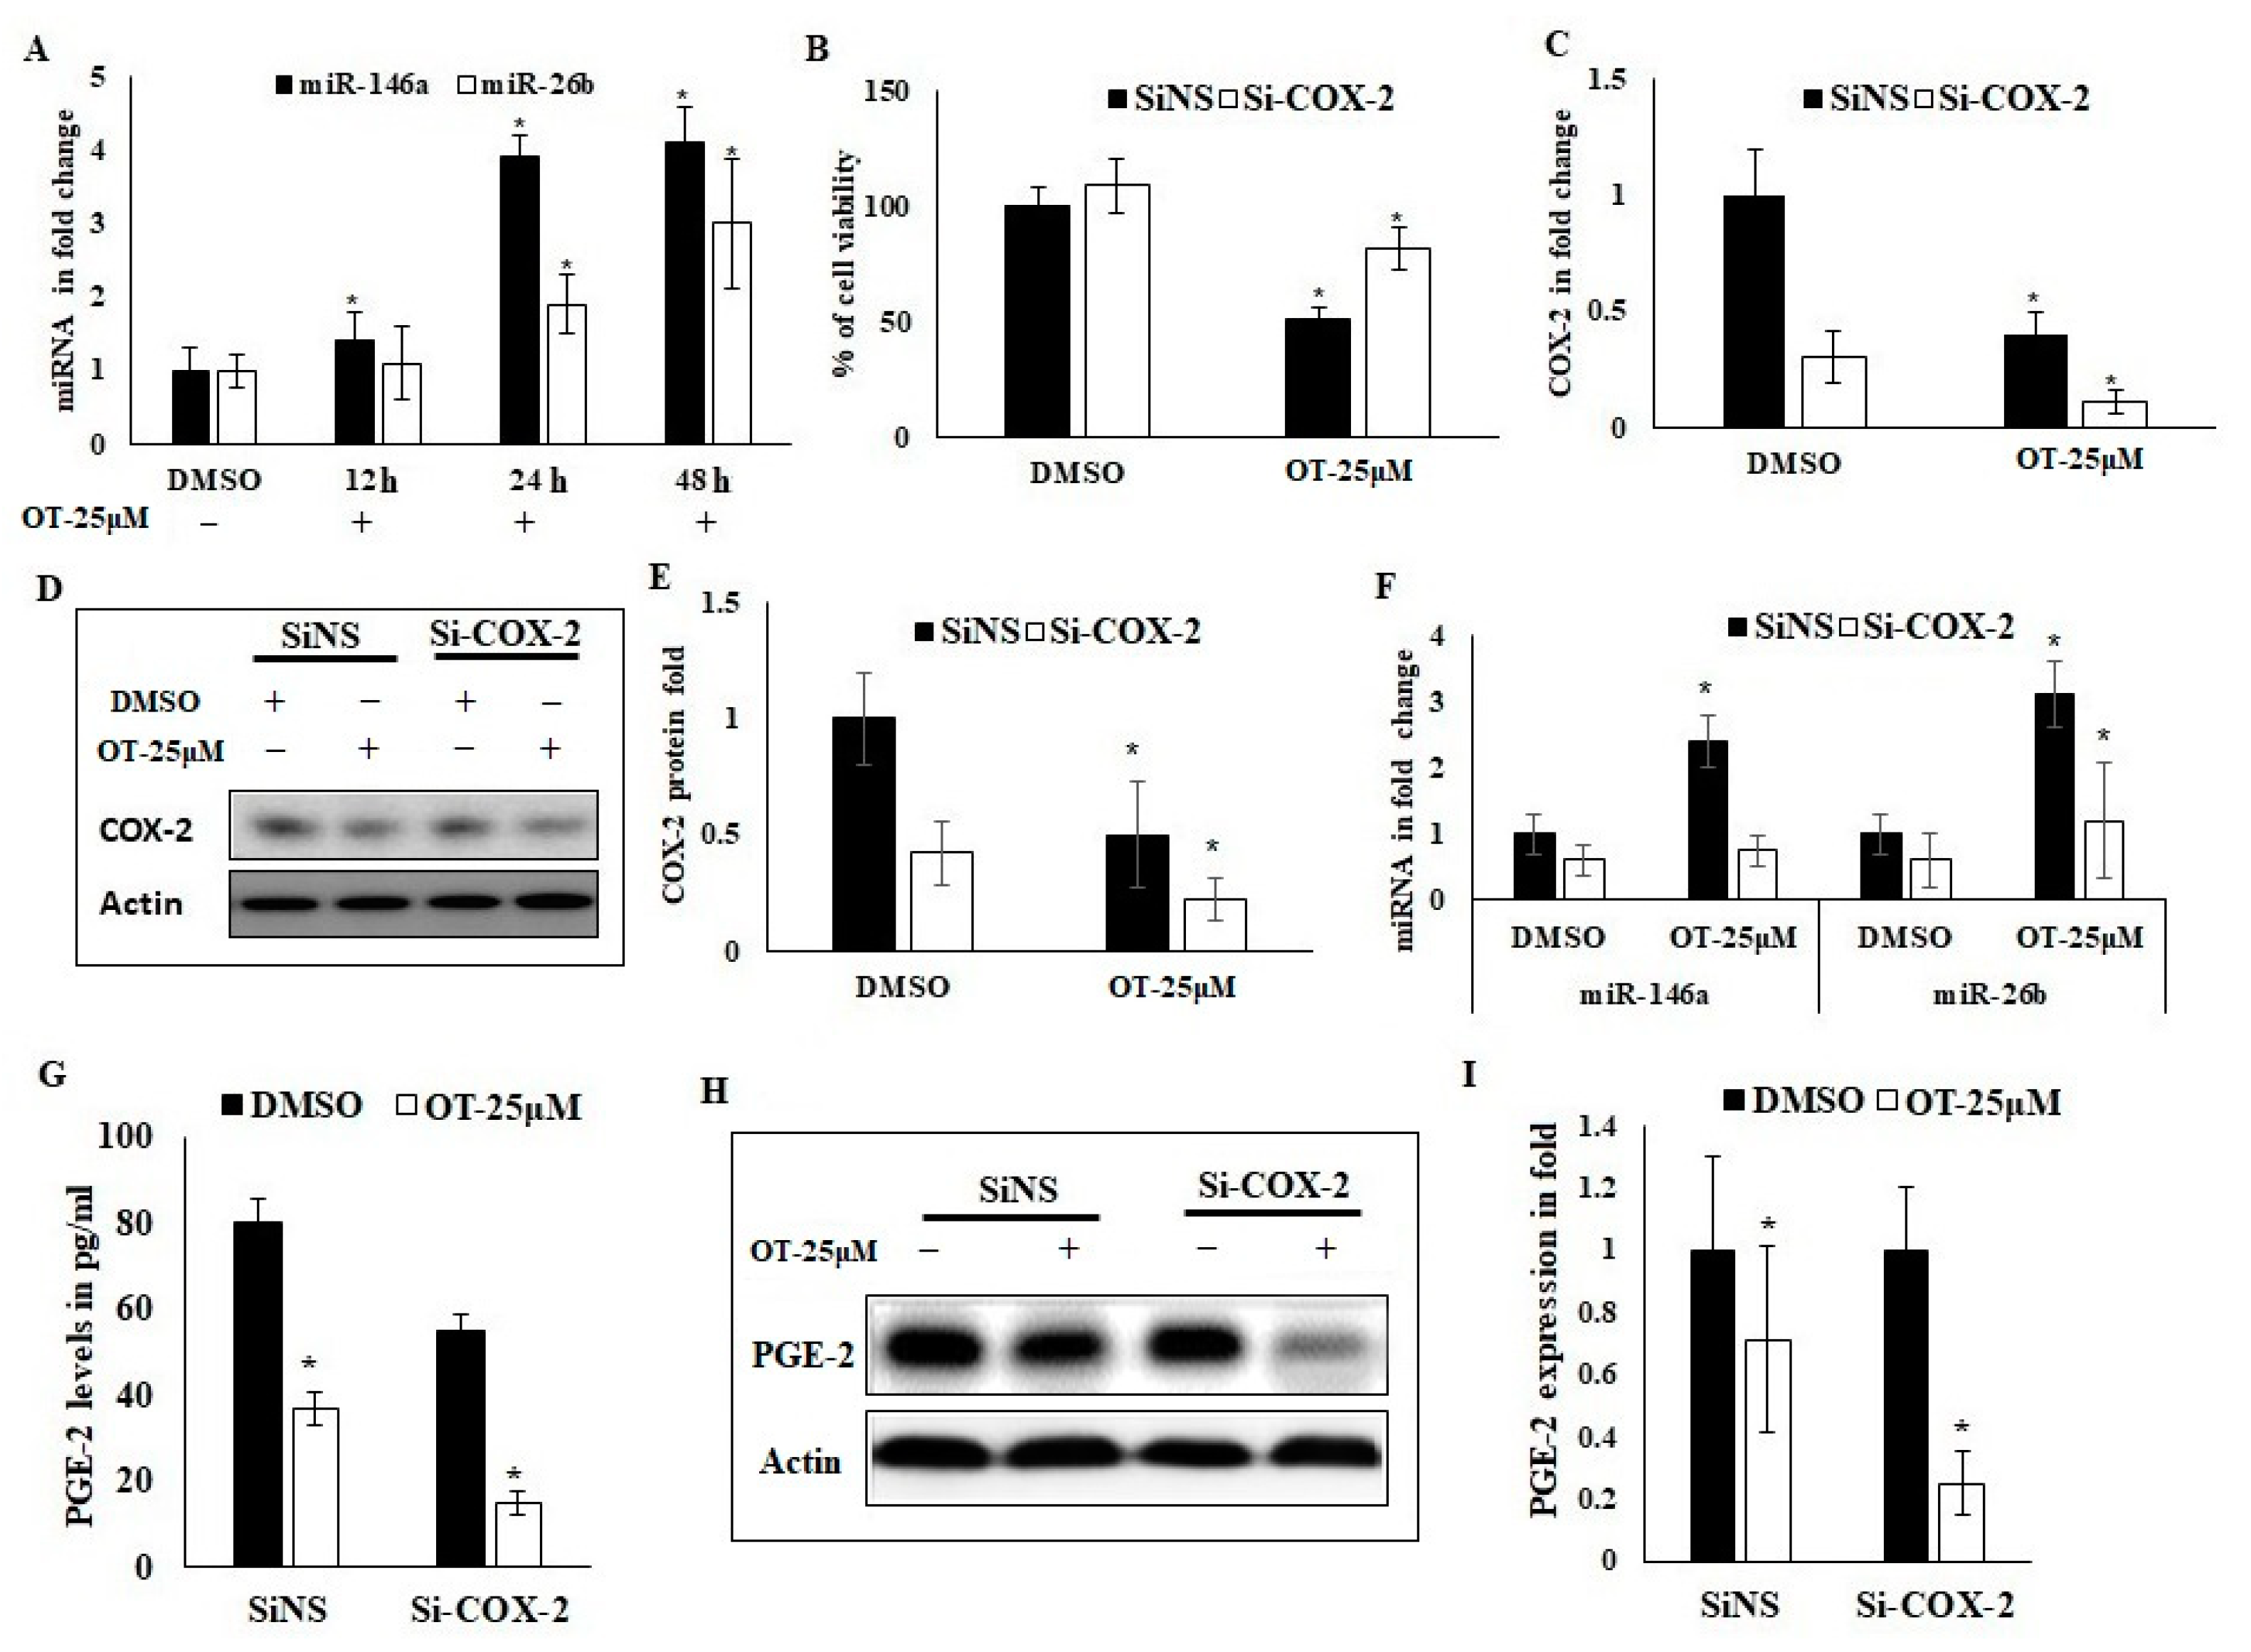
2.8. Interaction of OT with COX-2 via miR-26b and miR-146a

The effect of OT on COX-2 interactions and its downstream mediators were assessed. The regulation of OT on epigenetic factors could play a major role in migration and nuclear degradation, via regulation of COX-2-targeting miR-26b and miR-146a in A549 cancer cell lines. In this study, OT treatment upregulates the miR-26b and miR-146a expressions in a significant manner during 24 h and 48 h incubation time periods in A549 cell lines (Figure 7A). The silencing model of COX-2 mRNA is used to indicate whether the ligand regulates tumorigenesis in a dependent or independent manner. In this study, COX-2 was silenced using silencer COX-2 (Si-COX-2) factor and compared to a silencer negative strand (SiNS) internal control. The Si-COX-2-transfected A549 cells treated with our ligand (OT 25 µM) showed a significant increase in cell viability and proliferation. The OT-treated SiNS cells showed cell viability (48%) whereas treated Si-COX-2 cells reached 69% (Figure 7B). These data conversely showed inhibition of COX-2 restored the cell viability and simplified OT activity against A549 cell lines through COX-2 reciprocal expressions of mRNA and protein markers (Figure 7C–E). The SiNS-transfected cells showed polarized COX-2 mRNA expression and parallel changes in protein regulations. The Si-COX-2-transfected A549 cells showed more sensitive COX-2 protein expression than SiNS-transfected cells against OT treatment (Figure 7D,E). Further, the reciprocal expression was observed in COX-2-targeting miR-146a and miR-26b. However, Si-COX-2-transfected cells showed significant upregulated miR-26b and comparatively less expression was observed for miR-146a (Figure 7F). The enzymatic expression of PGE-2 plays a key role in the development of cancer progression. In this study, OT downregulates the PGE-2 expression from 80 pg/mL to 38 pg/mL in SiNS-transfected cells and from 51 pg/mL to 14 pg/mL in Si-COX-2-transfected A549 cells (Figure 7G). This study was extended to explore the protein expression of PGE-2. In the OT-treated Si-COX-2 cells, the PGE-2 level and expression were reduced from 1.0- to 0.23-fold (p ≤ 0.05). On the other hand, SiNS-transfected cells showed a reduction from 1.0- to 0.68-fold (p ≤ 0.05) (Figure 7H,I). These changes indicated that OT reduced the PGE-2 level in a COX-2-dependent fashion.

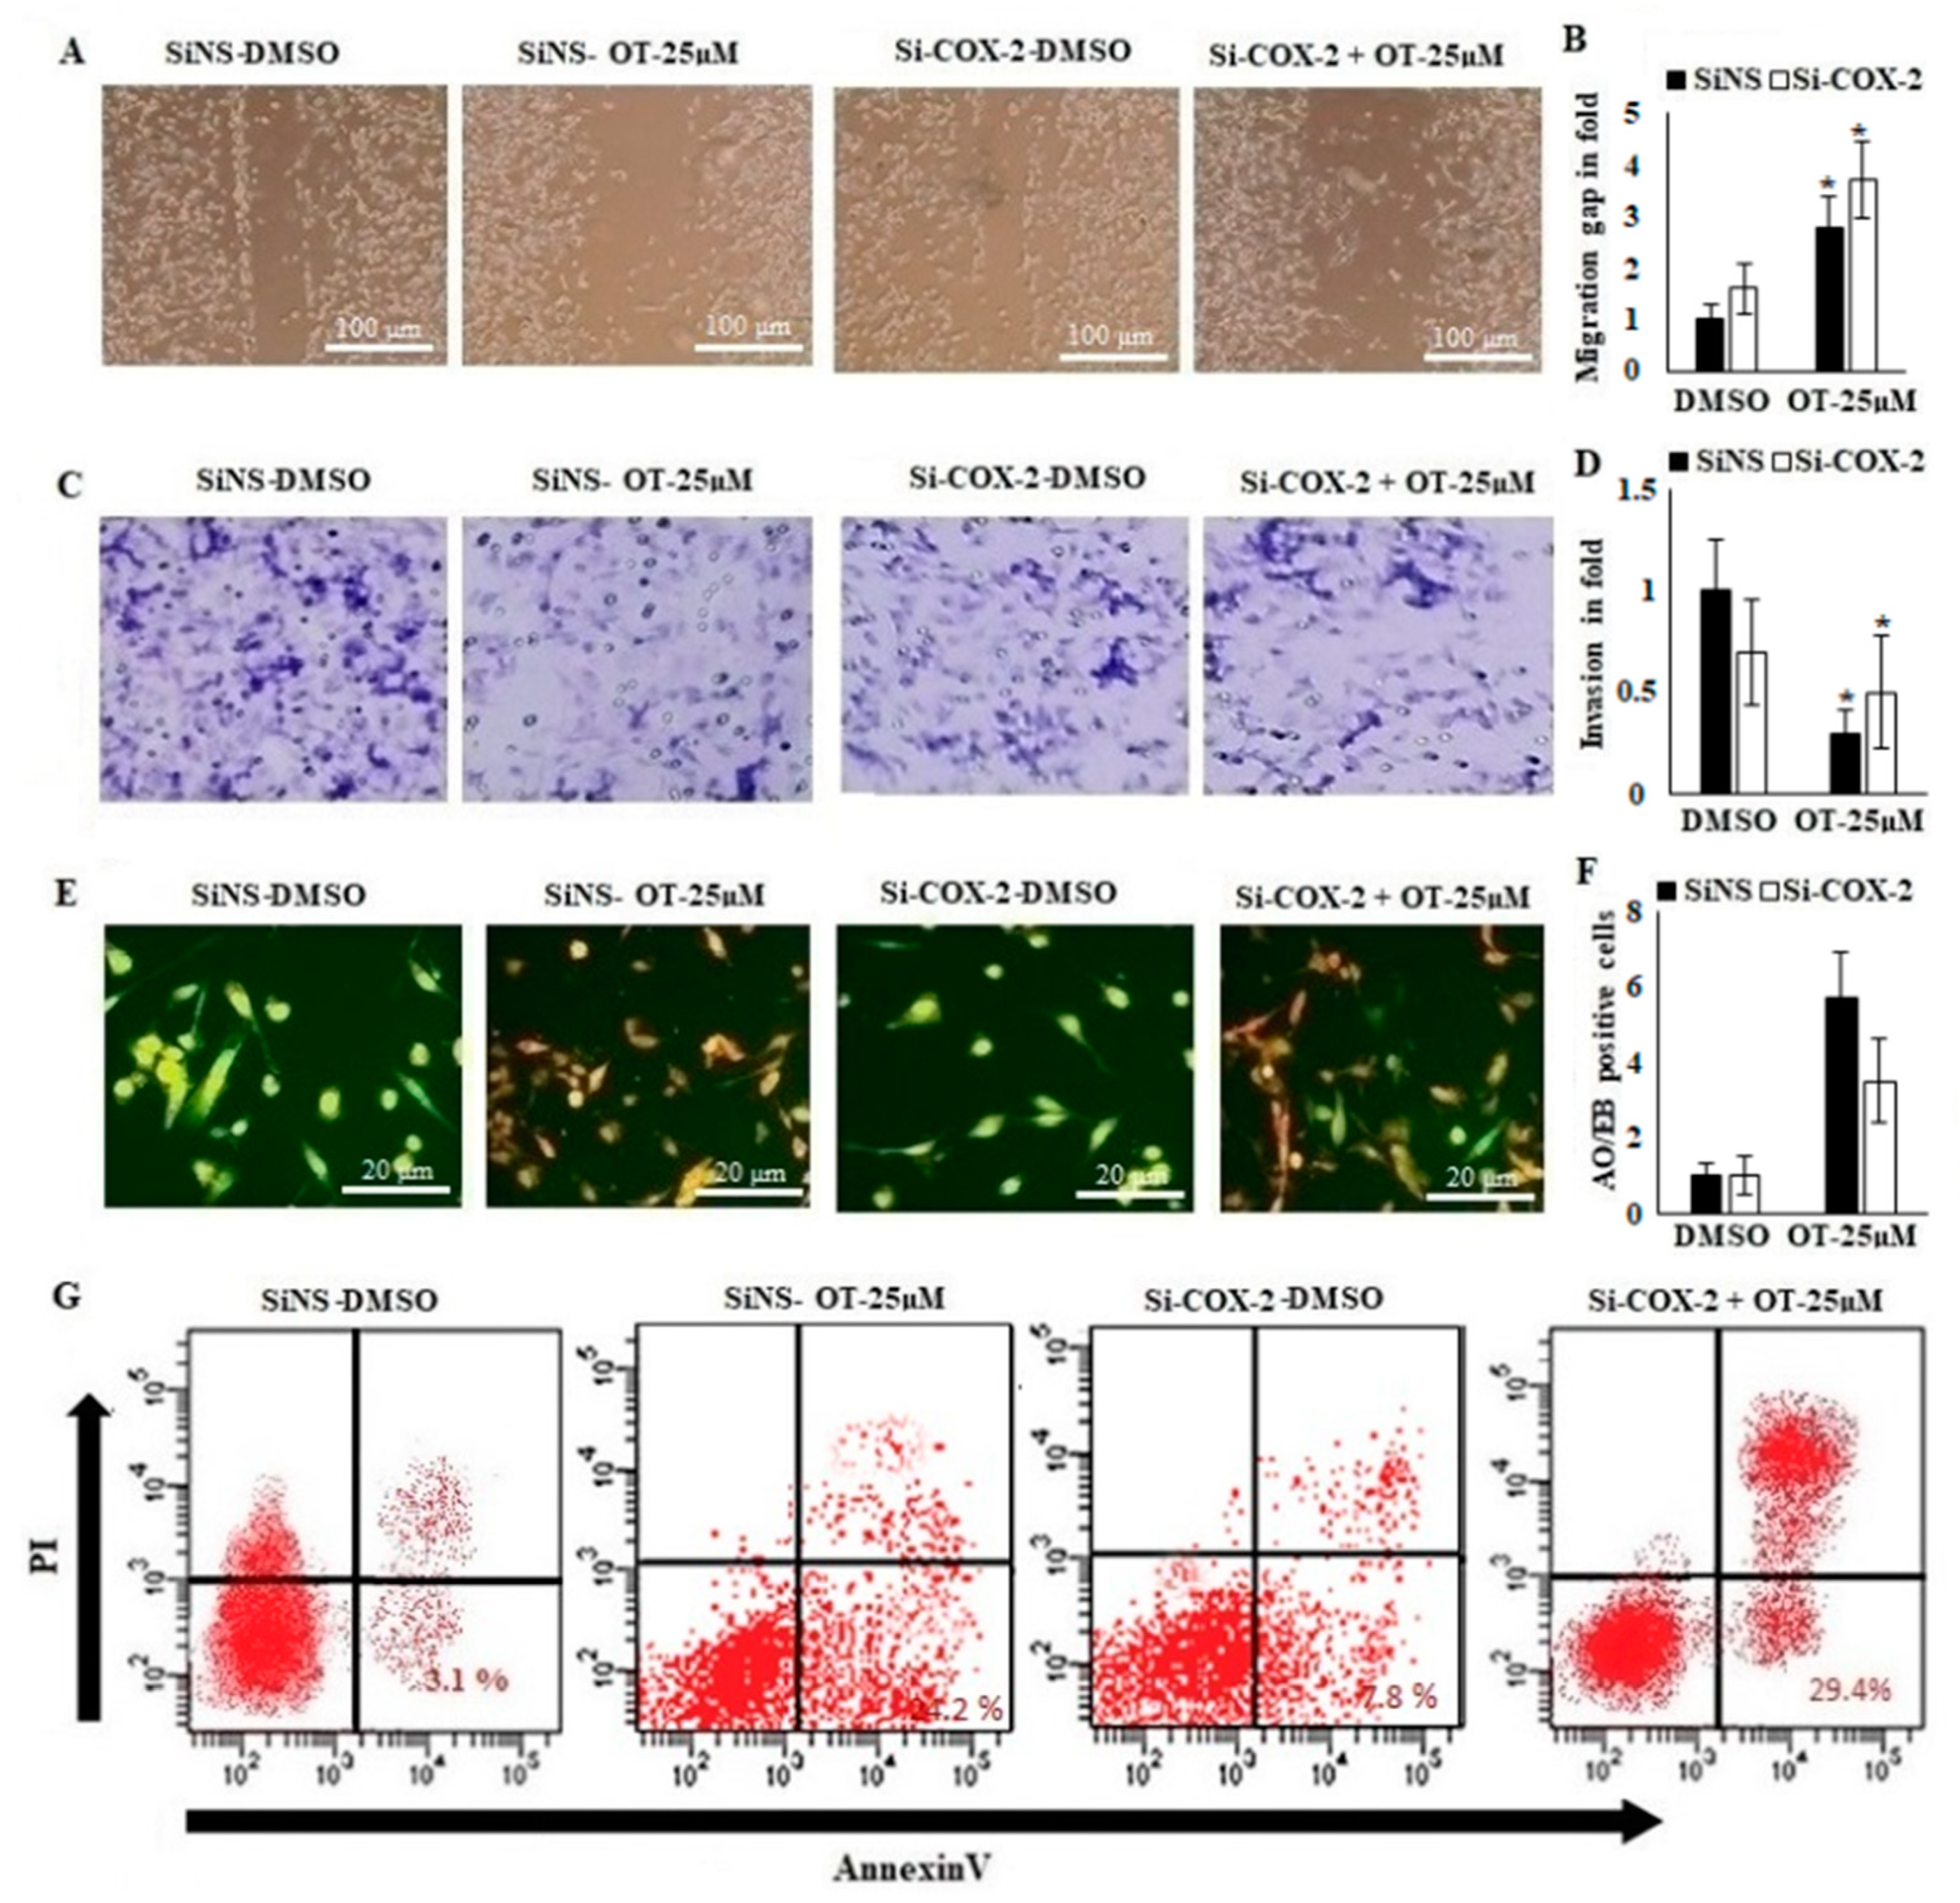
2.9. Effect of OT on Migration, Invasion and Apoptotic Modifications in COX-2-Silenced A549 Cells

In addition, to confirm the role of OT in COX-2 regulation in A549 cells, SiNS- and Si-COX-2-transfected cells were treated with OT (25 μM) and the migration and invasion properties were evaluated. The results revealed that the migrative properties are greatly influenced by OT treatment. Si-COX-2-transfected cells with OT treatment showed a significant increase in migration distance (3.91-fold) in comparison to those of SiNS-transfected cells (2.83-fold) (Figure 8A,B). In parallel studies with invasion analysis, OT (25 μM) showed increased invasion (0.58-fold) compared to SiNS-mediated OT-treated cells (0.37-fold) (Figure 8C,D). The apoptotic modifications led to adverse nuclei damage and formation of late apoptotic chromatin changes in cancer cells. OT-treated (25 μM) Si-COX-2-transfected cells showed less nuclear modification and chromatin condensation compared to OT-treated SiNS-transfected cells (Figure 8E,F). These results revealed that OT obstructs the migration and invasion and is dependent on COX-2, whereas apoptotic induction occurred in an independent way. The flow cytometric analysis reveals that the apoptotic changes were significant in OT-treated (25 μM) Si-COX-2-transfected cells compared to SiNS-transfected cells. There are relatively fewer live and necrotic cells among SiNS-transfected cells compared with Si-COX-2-transfected cells. The apoptotic induction was 29.4% in Si-COX-2-mediated OT-treated cells whereas it was only 3.1% in SiNS-transfected cells (Figure 8G).

3. Discussion

Various species of Trigonella expressed anticancer activity [45,46]. Fenugreek is well explored in pharmacological studies, and saponoins from fenugreek called diosgenin showed anticancer activity and induced apoptosis in different cancer cell lines [47,48]. T. hamosa as a member of the Trigonella genus, and has not been assessed previously regarding its anticancer activity. This finding provoked us to explore the potential activity of T. hamosa constituents against cancer cell lines. In this study, the molecular machinery of possible constituents from T. hamosa was assessed using cell proliferation, migration, invasion, metabolic and apoptotic markers through in vitro studies against A549 non-small lung cancer cell lines. A bioactivity-guided assay indicated that TME showed significant inhibitory effects on MDA-MB-231 and A549 cancer cell lines. Interestingly, TME is insignificant against HCT-116 colon cancer cell lines (Figure 1). Therefore, there is a possibility that the TME contains bioactive molecules responsible for the potential bioactivity. This bioactive extract was further subjected to a refining process using chromatographic techniques (Figure 2A,B) to yield the pure flavonoid named orientin (OT). Structurally, OT was elucidated by inspection of 1H, 13C, DEPT, HSQC and HMBC spectroscopic data and compared with the literature values [49]. The current study represents the first report on the isolation of OT from T. hamosa.
The cytotoxicity studies revealed the biocompatibility of OT in normal fibroblast NIH-3T3 cell lines (Figure 3A). The results demonstrated a significant effect of OT on MDA-MB-231 and A549 cell lines and showed IC50 values ≤ 30 μM. Cancer cell metastasis is the primary factor for the failure of chemotherapy and cancer prognosis [50]. Natural flavonoids have diverse pharmacological activities [51]; various studies have shown antimigration and anti-invasion bioactivities of natural flavonoids [52]. The confirmation of direct interactions reveals the ligand–protein binding in cell lysates. We speculate that the binding of COX-2 causes stabilization of the protein by ubiquitin-dependent phosphorylation [53]. In this study, a mechanistic approach was conducted to assess the physical interaction of OT with migrative marker COX-2. The findings expressed potent interaction of OT towards A549 COX-2 protein compared to MDA-MB-231 and HCT-116, explaining the direct interaction of OT with COX-2 in cellular regulation (Figure 3B). The cell viability effect of OT 25 μM on A549 cells lines was significantly inhibited in a time-dependent manner after 48 h and 72 h of treatment (Figure 3C). Furthermore, the result of the mechanistic influence of OT on COX-2 mRNA and protein expression of A549 cell lines was potentially inhibited and this reconfirms the abovementioned interaction studies (Figure 3D–F).
The cancer cell migration and invasion properties guide relapse and failure in chemotherapy [53]. Therefore, the current study was performed to explore antimigrative and the anti-invasive properties of OT in A549 cell lines. The potent inhibition of cell migration and invasion was observed at 24 h of OT treatment (Figure 3G–J). Inhibition of COX-2 activity leads to a reduction in cancer progression through various pathways such as downregulation of tumor cell invasiveness, angiogenesis and secretion of prostaglandins as well as activation of apoptosis [44,53]. To explore the degradation of mRNA stability by OT, a COX-2 mRNA stability assessment was conducted using an Act-D model in which Act-D is a transcription inhibitor which forms a stable complex with host DNA and inhibits new mRNA synthesis [54]. The results of the COX-2 mRNA profile showed that the rate of degradation of COX-2 mRNA was higher in cells treated with OT compared to the overexpressed TGF-β group (Figure 3K). The results suggested that OT is able to reduce the COX-2 mRNA and this leads to a reduction in its bioavailability, hence diminishing functional mRNA for translation and the subsequent release of PGE-2. The docking position of active sites is an independent function based on the ligand and COX-2 interactions. This binding leads to the regulation of agonists or antagonists of protein function in cellular metabolism [55]. The in silico binding of OT showed prominent virtual binding towards COX-2 protein (Figure 4A–C). Interestingly in the current study, OT was docked to an amino acid residue position in the active site of COX-2. The results showed that OT binds with COX-2 protein in the positions of VAL-228, ASP-229 and ARG-376 amino acid residues. These binding positions are considered necessary sites for the ligand binding and caused competitive inhibition against substrate interactions. In parallel, a docking study of CLX showed binding to the adjacent site of COX-2 with a binding energy of −9.4, which is less than the intermol energy of the OT ligand (−10.37) (Figure 5A–D).
The upstream regulation of COX-2-regulated markers such as BCL-2, iNOS and CYP-1A1 leads to cancer progression and prognostic development. BCL-2 is an apoptotic marker for tumorigenesis, activation of proto-oncogenes and neoplastic functions. Hence, BCL-2 is considered as a potential drug target for management of anticancer therapy [56,57,58,59]. COX-2 activation leads to oxidative stress, which is regulated by nitric oxide synthase (iNOS). It is highly activated during the process of infection and different cancer progressions [60]. Some flavonoids control the expression of iNOS and could be used as anticancer agents [61]. In the current study, the action of OT was compared with that of the selective inhibitor of COX-2, called CLX. A number of clinical trials using COX-2 inhibitors indicated its important role in cancer suppression. CLX is a potential COX-2 inhibitor and non-cytotoxic [62]. OT possibly changes cell viability in CLX-induced cells. CLX-challenged cells downregulated the expression of COX-2, iNOS and BCL-2. Moreover, OT-supplemented cells showed a highly significant suppression effect on the expression of the same markers (Figure 5E–J).
During cancer progression, CYP-1A1 is activated as a defensive tool to detoxify the cancer-causing agents and activate the apoptotic pathways [63]. In the current study, CLX-challenged OT-treated A549 cells activated the CYP-1A1 expression better than individually supplemented CLX and OT (Figure 5H–J). This synergistic role also leads to control of the cancer pathogenesis through metabolic regulators. Mechanistically, these findings facilitate the regulation of BCL-2, iNOS and COX-2 influenced by combined drug treatment in an additive-dependent manner. However, the metabolic marker CYP-1A1 was regulated in an OT-independent fashion to control A549 cancer cell lines. Therapeutic selectivity is important in anticancer protocols. Several combinations of molecules are reported to control breast, lung and colon cancer cells [62,64,65,66]. Some previous records stated that COX-2 inhibitors significantly decreased breast cancer growth in in vitro experiments [64]. CLX as a member of the COX-2 inhibitors showed the promotion of apoptosis in epithelial lung cancer and other cancer cells [67]. Nuclear damage and apoptosis via activation of the apoptotic responsive factors led to alteration of genetic structures and influenced the cancer growth process [56]. In the present study, the combination of CLX with OT treatment induced early and late apoptosis in A549 cancer cells and activated nuclear damage (Figure 6A,B). In the combination treatment, the results demonstrated an increase in cell apoptosis by 3.6-fold compared to control. However, the antitumor effect of the CLX and OT combination treatment was more significant in the A549 cells compared to treatment with either OT or CLX alone (3.2-fold and 1.4-fold, respectively). The necrotic and apoptotic cell ratio was significantly increased in the combination treatment of CLX and OT compared to individual treatment with OT or CLX (Figure 6A–C). These results provided the impression that usage of the CLX with OT combination treatment will provide a better therapeutic strategy to control lung cancer than treatment with CLX alone and evidenced that synergistic therapy is more beneficial than independent therapies.
Apart from genetic factors, the epigenetic short RNAs called miRNAs have been focused upon in this decade. These miRNAs are identified as biological targets of cancer-causing genes and are considered as tumor suppressors and regulators of oncogenes of cancer growth [41,68]. In this study, OT treatment upregulated the miR-26b and 146a expression in A549 cells after 12 h of treatment. This confirmed our abovementioned data where OT treatment showed reciprocal regulatory effects between miR-26b and 146a on COX-2 expression levels. OT showed evidence consistent with the previous reports [44] in which miR-26b suppressed tumor cell proliferation, migration and invasion by directly targeting COX-2 in lung cancer. A549 cells treated with OT showed increased miR-146a expression and reduced COX-2 protein expression (Figure 7A). In this context, miR-146a downregulated COX-2 translation, resulting in a reduction in PGE2 release. This affected the lung cells’ viability and invasive capacity (Figure 7B–I). Meanwhile, this was explained based on the role of miR-146a as an endogenous dual inhibitor of arachidonic acid metabolism in lung cancer by regulating prostaglandins due to its action on the COX-2/miR-146a axis [41]. In the silencing model of COX-2 in A549 cell lines, apoptotic modifications were observed with adverse nuclei damage and formation of late apoptotic changes. These results revealed that OT inhibited the migration and invasion dependent on COX-2 and apoptotic induction in an independent way (Figure 8A–F). The necrotic and apoptotic cell population of OT-treated Si-COX-2-transfected cells was comparatively increased compared to SiNS-transfected cells (Figure 8G). These results confirmed the apoptotic changes triggered by OT through an independent mechanism away from COX-2-mediated nuclear damage. Therefore, our current study explored the targeting of COX-2 by OT from T. hamosa and the results describe a detailed mechanistic molecular regulatory influence in A549 lung cancer cell lines.

4. Materials and Methods

4.1. General Experimental Procedures and Chemicals

1H, 13C and 2D-NMR spectra were measured on an Avance 400 NMR spectrometer (1H-NMR: 400 MHz and 13C-NMR: 100 MHz, Bruker, Uster, Switzerland). Silica gel column chromatography (SCC) was performed on silica gel 60 (Sigma-Aldrich, Darmstadt Germany; 230–400 mesh). Reversed phase column chromatography (RPCC) was performed on C18-reversed phase silica gel for column chromatography (Sigma-Aldrich, Darmstadt, Germany). Diaion HP-20 stationary phase (Sigma-Aldrich, Darmstadt, Germany). Pre-coated silica gel 60 F254 plates (0.25 mm and 1000 μm in thickness, Sigma-Aldrich, Darmstadt, Germany) were used for thin layer chromatography (TLC), with 10% vanillin in ethanol spray reagent as a visualizing agent with a hotplate (150 °C). High-performance liquid chromatography (HPLC) apparatus (Agilent, 1200 series, Waldbronn, Germany) equipped with a degasser, autosampler, quaternary pump and PDA detector and Discovery® C18 (5 cm × 4.6 mm × 5 μm) column (Supelco, Bellefonte, Pennsylvania, USA) were used. An isocratic mode elution equipped with an acetonitrile:water blend (75:25 v/v) with a flow rate of 1 mL/min was used. The injection volume was 10 μL (from 60 mg/mL, sample in methanol). The chromatogram was monitored using Agilent Chemstation software (Version B.2.4.1). Analytical grade chemicals and reagents were used.

4.2. Plant Material

Aerial parts of T. hamosa were carefully collected at the experimental station of King Faisal University, KSA (September 2015) and were identified by Dr. Mamdouh Shokry, ex-director of El-Zohria Botanical Garden, Giza, Egypt. A voucher specimen (15-Sept-TH) was kept at the College of Clinical Pharmacy, King Faisal University, KSA.

4.3. Extraction and Isolation

The extraction of air-dried aerial parts of T. hamosa (1 kg) was carried out by cold maceration three times with 70% methanol (10 L). The compiled methanol extract was concentrated using a rotary evaporator and lyophilized to give a solvent-free extract weighing 91 g. Total methanol extract (TME) was suspended in distilled water and further partitioned with n-hexane (10 L) to give the hexane fraction (61 g) and the remaining fraction was concentrated to give a weight of 30 g defatted extract. Then, the defatted extract (30 g) was column chromatographed using a Diaion HP-20 (1 kg) as stationary phase, then eluted successively with water, 50% and 100% MeOH to obtain the fractions of water (8 g), 50% MeOH (namely, DMF1) (7 g) and 100% MeOH (namely, DMF2) (10 g). Based on the TLC patterns, the DMF1 fraction (7 g) was selected for further work. DMF1 was exposed to SCC (200 g, using 4 L of CHCl3: MeOH: H2O (15:6:1) as mobile phase) followed by 2 L of 100% MeOH to wash. The process yielded five main sub-fractions (DMF1-1 to 5). Sub-fraction DMF1-3 (1.8 g) was subjected to RPCC (125 g, applying gradient elution using MeOH: H2O as solvent system) to give six subtractions (DMF1-3-1 (150.5 mg), SubFr. 1-3-2 (29.3 mg), SubFr. 1-3-3 (171.4 mg), SubFr. 1-3-4 (210.3 mg), SubFr. 1-3-5 (49.1 mg) and SubFr. 1-3-6 (250.1 mg)). DMF1-3-4 (210.3 mg) was further purified using preparative RPTLC followed by HPLC to give a pure compound, OT (12 mg).

4.4. Ligand Preparation and In Silico Docking Analysis

Potential computational binding of OT and CLX with COX-2 was investigated using molecular docking analysis. The docking analysis was carried out using the Autodock v4.2 program and AutoDockTools (ADT) v1.5.4 (http://www.scripps.edu/mb/olson/doc/autodock, accessed on 24 June 2021). The three-dimensional structure for human COX-2 (PDB ID: 5kir) was retrieved from the RCSB database (https://www.rcsb.org/, accessed on 23 June 2021). Chemical structure of the ligand (OT; PubChem ID: 5281675, CLX; PubChem ID: 2662) was retrieved as SDF format and PDB format from the PubChem compound database, (http://www.ncbi.nlm.nih.gov/search, accessed on 23 June 2021). The chemical structures of OT and CLX were converted and saved as PDB format using the pymol tool. The Q-site finder was used to identify the protein active site regions. The docked ligand acted as a rigid body and the protein was a flexible factor. Results obtained from AutoDockTools were evaluated and scored based on ligand efficiency, binding energy, intermol energy, amino acid residue interaction and bond formations [69].

4.5. Cell Culture

A human breast cancer cell line (MDA-MB-231-Passage 11) (King Faisal Speciality Hospital and Research Centre, Riyadh, Saudi Arabia), human lung cancer cell line (A549-Passage-9) (NCCS, Pune, India), human colon cancer cell line (HCT-116-Passage-15) (King Fahad Speciality Hospital, Dammam, Saudi Arabia) and normal fibroblast murine cell line (NIH-3T3) (NCCS, Pune, India) were obtained. During trypsinization, cancer cells were aliquoted three times for storage and for further cell studies. Dulbecco’s modified Eagle medium (DMEM) (Sigma-Aldrich, Taufkirchen, Germany) was used to culture the cell line. Culture medium was supplemented with antibiotic solution and active FCS (10%) (Applied Biosystems, Waltham, MA, USA) and incubated in 5% CO2, 37 °C, 95% humidity conditions. TME and OT (12.5 to 200 μg/mL and 6.25 to 100 μM, dissolved in 1% dimethyl sulfoxide (DMSO), respectively) were used to screen for cytotoxic effects on different cancer cell lines. Control cells were treated with 1% DMSO and standard culture medium. Afterwards, specific incubation cells were harvested and counted using a Bio-Rad TC20 automated cell counter (Bio-Rad, Hercules, CA, USA) [46,70].

4.6. Cell Proliferation and CCK-8 Assay

A colorimetric cell counting kit-8 (CCK-8) assay was used to evaluate the cytotoxic effects of TME and OT on the proliferation rate of cancer cell lines. CCK-8 reagent detects polar soluble salt to quantify viable cells by producing an orange formazan dye using a specific optical density. Briefly, cancer cells were seeded 1 × 10⁴ cells/well in 96-well cell culture plates and left to grow to confluence. Then TME and OT treatment was applied on cultured cell lines as described above. Afterwards, specific incubation was carried out and CCK-8 reagent (10 μL) was added and incubated for 1h. The cell viability was calculated by the absorbance at 450 nm in a Bio-Rad ELISA reader [38].

4.7. Immunoprecipitation

The physical binding of OT with COX-2 of the different tested cell lines was assessed [71]. Briefly, MDA-MB-231, A549 and HCT-116 cancer cell lines were seeded 1 × 10⁵ cells/well in 6-well sterile cell culture plates and OT 25 μM was applied for 24 h, then OT-treated cells were lysed using SC-lysis buffer (Santa Cruz, Paso Robles, CA, USA). Physical binding of COX-2 proteins in the cell lysates was quantified by a protein exclusion magnetic bead method using COX-2 rabbit polyclonal antibodies (Biorybt, Segrate (Milano), Italy) (1:500) and goat antirabbit horseradish peroxidase (HRP)-conjugated secondary antibodies (1:2000).

4.8. Cell Transfection of Short Interference COX-2 in A549 Cancer Cell Lines

The A549 lung cancer cells were nucleofected with oligonucleotides using a 4D-nucleofector X unit device and cell-specific transfection kits (Lonza, Walkersville, MD, USA), following the manufacturer’s instructions. The cells were transfected with COX-2 (Si-COX-2; 50 nmol) (AM16708, Hs.196384) and control (SiNS; 50 n mol), which were from Ambion (Dallas, TX, USA). After 4 h of cell incubation for recovery, the nucleofector medium (serum-free DMEM with 1% glutamine) was changed to a 10% serum DMEM containing DMSO or OT 25 μM. The transfected cells were further analyzed for cell proliferation, migration, invasion and COX-2 expression using real-time PCR and Western blot techniques [72].

4.9. Cell Migration Assay (Wound Healing Assay)

A549 cells were seeded in 24-well plates (8 × 10⁴ cells/well) in the DMEM complete culture medium. A549 cells attained a 75% monolayer, which was followed by rinsing and aspiration with phosphate-buffered saline (PBS) and serum-free DMEM. A scratch wound was created by using a sterile 50 µL micropipette tip, then wells were washed with serum-free media to remove suspending and floating cell debris. OT 25 µM was used to treat the A549 cells and they were incubated for up to 48 h. Images were recorded with an inverted microscope at different time points (0 and 48 h) [38]. To monitor cell migration into the scratch wound gap region, photographs of the gap distance of the scratch were obtained by an Optika microscope (magnification: ×200), and the area of the wounded region in each image was calculated using ImageJ software v1.8.

4.10. Cell Invasion Assay (Matrigel–Transwell Assay)

Cell invasion was estimated using Transwell cell culture Boyden chambers according to the manufacturer’s protocol. Briefly, L-lysine-coated cell culture inserts (BD Biosciences, San Jose, CA, USA) with a membrane (8 µm porosity) were used to coat a Matrigel matrix in basement membrane (100 µg/cm2; BD) [38]. The inserts were dried at 37 °C for 3 h. A549 cells were seeded in 12-well plates (8 × 10⁴ cells/well) in the serum DMEM. The cells were then treated with DMSO and OT 25 µM and incubated for 16 h. The uninvaded cells were removed using a cotton swab. The chamber the top chamber was disassembled and set aside. The remaining medium was carefully aspirated and the cells were fixed using 10% formaldehyde. Methanol was used for cell permeabilization and 1% Giemsa stain was used to locate the invaded cells. The cells attached to the lower side of the Transwell were counted in 4 microscopic fields using EVOS XL core imaging (Life Technologies, Austin, TX, USA).

4.11. Acridine Orange/Ethidium Bromide (AO/EB) Dual Staining

We examined the appearance of apoptotic cellular modifications. Early and late apoptosis in OT-treated A549 cells were estimated using a dual acridine orange/ethidium bromide (AO/EB) staining method [73]. Cells were incubated with DMSO, OT 25 µM and CLX 5 µM for 24 h and were fluorescently stained with AO/EB. The stained cells were incubated for 10 min followed by a PBS wash and the cell morphology was examined using a Leica 3000 fluorescence microscope.

4.12. 4′,6-Diamidino-2-phenylindole Dihydrochloride (DAPI) Staining

The DNA damage reveals the nuclear modification in apoptosis and it was examined by a DAPI DNA binding assay [74]. A549 cells (1.5 × 10⁵ cells/well) were pretreated with CLX 5 µM or not and incubated with and without OT 25 µM for 12 h. After incubation, treated cells were fixed in formaldehyde (4%) in PBS for 10 min. This was followed by aspiration twice with PBS and subsequent DAPI staining (5 μg/mL) for 15 min at 37 °C. Cells from each treatment were examined and photographed using a Leica 3000 fluorescence microscope using magnification power of 200×.

4.13. Flow Cytometric Analysis

The assessment of necrotic, apoptotic and live cell analysis for quantifying apoptotic induction was carried out using a flow cytometry method [75]. A549 cells were incubated with DMSO, OT 25 µM and CLX 5 µM for 24 h and were fluorescently stained with annexin-V with propidium iodide (PI) followed by analysis using flow cytometry (Merck-Millipore, Flowsight, Darmstadt, Germany).

4.14. Determination of PGE-2 Production

OT supplementing silenced COX-2- and SiNS-transfected A549 cells was assessed for estimation of PGE-2 using Cayman immune assay strips (Cayman Chemical Co., Ann Arbor, MI, USA) [47]. According to the manufacturer’s instructions, OT-treated cells were incubated for 24 h and washed with 200 μL of ice cold PBS. Sodium azide (0.1 μM) was used for cell lysis and cell lysate with supernatant was analyzed for PGE-2 ELISA quantification and stored (−80 °C) for further analysis. The standard PGE-2 well had 100 pg/mL.

4.15. Effect of OT on COX-2 mRNA Stability Using Act-D Model

To determine the effect of OT on COX-2 mRNA stability, an Act-D-mediated (Sigma-Aldrich, St. Louis, MI, USA) experiment was conducted. Act-D is a transcription inhibitor which forms a stable complex with host DNA and inhibits new mRNA synthesis. Briefly, the A549 cell line was stimulated by TGF-β (10 μg/mL) (recombinant human protein, Invitrogen, Faraday Ave Carlsbad, CA, USA) for 1 h and OT 25 μM was added and incubated for 4 h. Act-D 5 μg/mL was then added and incubated for 6 h in a cell culture incubator. These treated cells were harvested for COX-2 mRNA stability assessment using real-time PCR [54].

4.16. RNA Isolation and Quantitative Real-Time PCR

Human lung cancer A549 cells were treated with 1% DMSO, CLX, CLX-OT, OT alone, SiNS and Si-COX-2 and were used to identify the molecular gene target expression using the real-time PCR method. Treated cells were subjected to TRIzol reagent (Invitrogen, Faraday Ave Carlsbad, CA, USA) to extract total RNA. miRNAs and mRNA were reverse transcribed to cDNA using a multiscript reverse transcription kit (Applied Biosystems, Waltham, MA, USA). mRNA and miRNA expressions were analyzed using quantitative real-time PCR in VII 7A (Applied Biosystems, Waltham, MA, USA). The real-time PCR primers for mRNA and miRNA (Table 3) were prepared according to the manufacturer’s instructions (SYBR Green expression method, Takara, Shiga, Japan). RU6 was used as an internal control for miRNA expression analysis; β-actin was used as an internal control for quantification of mRNA analysis [7].

4.17. Western Blot Analysis

The control and treated cells were harvested after 24 h and then washed with PBS. Cells were lysed in RIPA lysis buffer (Santa Cruz, Paso Robles, CA, USA) and a 1× protease inhibitor cocktail. The lysate was prepared and preserved at −80 °C. Protein concentrations of cell lysate were estimated using a Bradford assay at 630 nm. The equivalent of 50 µg of protein extract was separated by SDS-PAGE and then transferred to polyvinylidene difluoride (PVDF) membranes (pore size: 0.45 µm, Bio-Rad, Hercules, CA, USA). Membranes were blocked using 5% non-fat dry milk in TBS buffer, followed by probing with the primary antibodies overnight at 4 °C, according to the manufacturer’s protocol. The primary antibodies COX-2 (rabbit monoclonal antibody 1:1000) (Biorybt-CB4 0WY, UK-orb621744), iNOS (rabbit polyclonal antibody 1:1000) (Biorybt, CB4 0WY, UK, orb126045), BCL-2 (rabbit polyclonal antibody 1:1000) (Invitrogen, USA, PA5-27094), CYP-1A1 (mouse monoclonal antibody 1:1000) (Invitrogen, USA, MA3-036), PGE-2 (rabbit polyclonal antibody 1:2000) (Biorybt, CB4 0WY, orb480392) and β-actin (rabbit polyclonal antibody 1:2000) (Cell Signaling Technology, Beverly, MA, USA, 4967S) were incubated overnight at 4 °C, and then washed with TBST. Washed blots were incubated with horseradish peroxidase-conjugated primary specific secondary antibody at room temperature for 1 h. The blots were visualized by an enhanced chemiluminescence (ECL) system (Pierce, Life Technologies, Austin, TX, USA) and scanned using a LICOR detection system and expressed bands were analyzed using ImageQuant software and quantified by densitometry using ImageJ software v1.8 [38].

4.18. Statistical Analysis

Data are expressed as mean ± SD. The significant difference between the DMSO-treated cells and OT-treated cells was analyzed by the Student’s t-test. The multiple analyses were carried out by one-way ANOVA using MS Excel. A value of p < 0.05 was considered to be statistically significant. Data represent at least three independent experiments.

5. Conclusions

The present study demonstrated chromatographic isolation of orientin (OT) from TME of T. hamosa. OT was identified by inspection of 1H, 13C, DEPT, HSQC and HMBC spectroscopic data. TME and OT provided a prospective inhibition of A549 cell viability and proliferation. The results proved that OT acted strongly on A549 cell lines, inhibiting their migration and invasion, altered COX-2, BCL-2, iNOS and CYP-1A1 expressions and reduced COX-2 expression via destabilizing its mRNA, with a consequent reduction in the functional availability for PGE-2 release. In silico studies showed significant interaction between OT and human COX-2 protein in comparison to CLX. OT synergistically interacted with CLX to control A549 cancer angiogenic properties compared to individual treatments. Molecular gene target expression studies were used to confirm the synergistic effect. OT–CLX suppressed invasive genes and activated proapoptotic genes. Furthermore, a silenced COX-2 in vitro model was used to confirm that OT inhibits the migration and invasion of A549 cancer cell lines via COX-2, in a dependent manner, whereas apoptosis was modulated through an independent pathway. The results showed that OT functionally inhibited angiogenic properties in a dependent manner (COX-2, iNOS) and apoptotic properties in an independent manner (CYP-1A1). OT successfully upregulated the cancer suppressor epigenetic factors (miR-26b and miR-146a) involved in post-transcription of COX-2. OT negatively regulated PGE-2 in both naïve and silenced COX-2-transfected A549 cells. These results revealed that the OT–CLX combination treatment could be used as a unique synergistic strategy in inflammatory-mediated therapies. Finally, our findings recommend carrying out further in vivo investigations of the OT–CLX combination.

Supplementary Materials

The following are available online at https://www.mdpi.com/article/10.3390/ph15020154/s1, Supplementary File S1: The 1D- and 2D-NMR spectroscopic data, Supplementary File S2: Photos of MDA-MB-231, A549 and HCT-116 cancer cell lines and normal cell line NIH-3T3 at different concentrations of TME, Supplementary File S3: Photos of A549 cells pretreated with CLX, showing cell migration and invasion, Supplementary File S4: QC file of RT-PCR and quantitative analysis of flow cytometry.

Author Contributions

H.E.K.: Conceptualization, funding acquisition, methodology, writing—review and editing, writing—original draft preparation and supervision; H.-I.M.I.: formal analysis, methodology, validation, software, writing—review and editing, writing—original draft preparation; E.A.A.: validation, writing—review and editing; P.M.E.: conceptualization, writing—review and editing; I.A.A.: conceptualization, validation, writing—review and editing. All authors have read and agreed to the published version of the manuscript.

Funding

This research was funded by the Deanship of Scientific Research (DSR), King Faisal University, Saudi Arabia, basic and applied research projects, Grant number 180010.

Institutional Review Board Statement

Not applicable.

Informed Consent Statement

Not applicable.

Data Availability Statement

The data are contained within the article and Supplementary Materials.

Acknowledgments

The authors thank the Deanship of Scientific Research (DSR), King Faisal University, Saudi Arabia for funding this research project, grant number 180010, and the College of Clinical Pharmacy, King Faisal University.

Conflicts of Interest

The authors declare that there are no conflict of interest.

References

  1. Khalil, H.E.; Mohamed, M.E.; Morsy, M.A.; Kandeel, M. Flavonoid and phenolic compounds from Carissa macrocarpa: Molecular docking and cytotoxicity studies. Pharmacogn. Mag. 2018, 14, 304. [Google Scholar] [CrossRef]
  2. Migahid, A. Flora of Saudi Arabia; King Saud University Press: Riyadh, Saudi Arabia, 1987. [Google Scholar]
  3. AI-Said, M.S. Traditional medicinal plants of Saudi Arabia. Am. J. Chin. Med. 1993, 21, 291–298. [Google Scholar] [CrossRef]
  4. Al-Asmari, A.K.; Al-Elaiwi, A.M.; Athar, M.T.; Tariq, M.; Al Eid, A.; Al-Asmary, S.M. A review of hepatoprotective plants used in Saudi traditional medicine. Evid.-Based Complement. Alternat. Med. 2014, 2014, 890842. [Google Scholar]
  5. Youssef, S. Medicinal and non-medicinal uses of some plants found in the middle region of Saudi Arabia. J. Med. Plant Res. 2013, 7, 2501–2517. [Google Scholar]
  6. Mandaville, J.P. Flora of Eastern Saudi Arabia; Routledge: London, UK, 2013. [Google Scholar]
  7. Ibrahim, H.-I.M.; Darrag, H.M.; Alhajhoj, M.R.; Khalil, H.E. Biomolecule from Trigonella stellata from Saudi Flora to Suppress Osteoporosis via Osteostromal Regulations. Plants 2020, 9, 1610. [Google Scholar] [CrossRef] [PubMed]
  8. Mandegary, A.; Pournamdari, M.; Sharififar, F.; Pournourmohammadi, S.; Fardiar, R.; Shooli, S. Alkaloid and flavonoid rich fractions of fenugreek seeds (Trigonella foenum-graecum L.) with antinociceptive and anti-inflammatory effects. Food Chem. Toxicol. 2012, 50, 2503–2507. [Google Scholar] [CrossRef]
  9. Kosta, S.; Tiwari, A. Screening and assessment of anti-diabetic and reactive oxygen scavenging (ros), effects of herbs in streptozotacin induced mice. Pharmacol. Online 2009, 3, 695–704. [Google Scholar]
  10. Kenny, O.; Smyth, T.; Hewage, C.; Brunton, N. Antioxidant properties and quantitative UPLC-MS analysis of phenolic compounds from extracts of fenugreek (Trigonella foenum-graecum) seeds and bitter melon (Momordica charantia) fruit. Food Chem. 2013, 141, 4295–4302. [Google Scholar] [CrossRef]
  11. Ahmadiani, A.; Javan, M.; Semnanian, S.; Barat, E.; Kamalinejad, M. Anti-inflammatory and antipyretic effects of Trigonella foenum-graecum leaves extract in the rat. J. Ethnopharmacol. 2001, 75, 283–286. [Google Scholar] [CrossRef]
  12. Khole, S.; Chatterjee, S.; Variyar, P.; Sharma, A.; Devasagayam, T.; Ghaskadbi, S. Bioactive constituents of germinated fenugreek seeds with strong antioxidant potential. J. Funct. Foods 2014, 6, 270–279. [Google Scholar] [CrossRef]
  13. Raju, J.; Bird, R. Alleviation of hepatic steatosis accompanied by modulation of plasma and liver TNF-α levels by Trigonella foenum graecum (fenugreek) seeds in Zucker obese (fa/fa) rats. Int. J. Obes. 2006, 30, 1298–1307. [Google Scholar] [CrossRef] [PubMed] [Green Version]
  14. Sindhu, G.; Shyni, G.; Pushpan, C.K.; Nambisan, B.; Helen, A. Evaluation of anti-arthritic potential of Trigonella foenum graecum L. (Fenugreek) mucilage against rheumatoid arthritis. Prostaglandins Other Lipid Mediat. 2018, 138, 48–53. [Google Scholar]
  15. Mobashar, A.; Shabbir, A.; Shahzad, M. Evaluation of Immunomodulatory and Antiarthritic Potential of Trigonella gharuensis Extracts. Evid.-Based Complement. Altern. Med. 2020, 2020, 8836080. [Google Scholar] [CrossRef] [PubMed]
  16. Hamed, A.I. Steroidal saponins from the seeds of Trigonella hamosa L. Nat. Prod. Commun. 2007, 2, 1934578X0700200207. [Google Scholar] [CrossRef]
  17. Salah-Eldin, A.-E.; Mahalel, U.A.; Hamed, A.I. Protective role of trigonella hamosa saponins against diabetic perturbations and complications in rats. Nat. Prod. Commun. 2007, 2, 1934578X0700200805. [Google Scholar] [CrossRef] [Green Version]
  18. Al-Mazroa, S.; Al-Wahaibi, L.; Mousa, A.; Al-Khathlan, H. Essential oil of some seasonal flowering plants grown in Saudi Arabia. Arab. J. Chem. 2015, 8, 212–217. [Google Scholar] [CrossRef] [Green Version]
  19. Qari, S.H.; Fahmy, N.M. Evaluation of some biological activities of Trigonella hamosa aerial parts. J. Pharmacogn. Phytother. 2017, 9, 165–172. [Google Scholar]
  20. Shahat, A.A.; Ibrahim, A.Y.; Alsaid, M.S. Antioxidant capacity and polyphenolic content of seven Saudi Arabian medicinal herbs traditionally used in Saudi Arabia. Indian J. Tradit. Knowl. 2015, 1, 28–35. [Google Scholar]
  21. Gonzalez-Gallego, J.; Sánchez-Campos, S.; Tunon, M. Anti-inflammatory properties of dietary flavonoids. Nutr. Hosp. 2007, 22, 287–293. [Google Scholar]
  22. Ullah, A.; Munir, S.; Badshah, S.L.; Khan, N.; Ghani, L.; Poulson, B.G.; Emwas, A.-H.; Jaremko, M. Important flavonoids and their role as a therapeutic agent. Molecules 2020, 25, 5243. [Google Scholar] [CrossRef]
  23. Ginwala, R.; Bhavsar, R.; Chigbu, D.G.I.; Jain, P.; Khan, Z.K. Potential role of flavonoids in treating chronic inflammatory diseases with a special focus on the anti-inflammatory activity of apigenin. Antioxidants 2019, 8, 35. [Google Scholar] [CrossRef] [PubMed] [Green Version]
  24. Raso, G.M.; Meli, R.; Di Carlo, G.; Pacilio, M.; Di Carlo, R. Inhibition of inducible nitric oxide synthase and cyclooxygenase-2 expression by flavonoids in macrophage J774A. 1. Life Sci. 2001, 68, 921–931. [Google Scholar] [CrossRef]
  25. Sharma, P.; Prakash, O.; Shukla, A.; Singh Rajpurohit, C.; Vasudev, P.G.; Luqman, S.; Kumar Srivastava, S.; Bhushan Pant, A.; Khan, F. Structure-activity relationship studies on holy basil (Ocimum sanctum L.) based flavonoid orientin and its analogue for cytotoxic activity in liver cancer cell line HepG2. Comb. Chem. High. Throughput Screen. 2016, 19, 656–666. [Google Scholar] [CrossRef] [PubMed]
  26. An, F.; Wang, S.; Tian, Q.; Zhu, D. Effects of orientin and vitexin from Trollius chinensis on the growth and apoptosis of esophageal cancer EC-109 cells. Oncol. Lett. 2015, 10, 2627–2633. [Google Scholar] [CrossRef] [Green Version]
  27. Tian, R.; Gachechiladze, M.A.; Ludwig, C.H.; Laurie, M.T.; Hong, J.Y.; Nathaniel, D.; Prabhu, A.V.; Fernandopulle, M.S.; Patel, R.; Abshari, M. CRISPR interference-based platform for multimodal genetic screens in human iPSC-derived neurons. Neuron 2019, 104, 239–255.e212. [Google Scholar] [CrossRef]
  28. Czemplik, M.; Mierziak, J.; Szopa, J.; Kulma, A. Flavonoid C-glucosides derived from flax straw extracts reduce human breast cancer cell growth in vitro and induce apoptosis. Front. Pharmacol. 2016, 7, 282. [Google Scholar] [CrossRef] [Green Version]
  29. Kim, S.-J.; Pham, T.-H.; Bak, Y.; Ryu, H.-W.; Oh, S.-R.; Yoon, D.-Y. Orientin inhibits invasion by suppressing MMP-9 and IL-8 expression via the PKCα/ERK/AP-1/STAT3-mediated signaling pathways in TPA-treated MCF-7 breast cancer cells. Phytomedicine 2018, 50, 35–42. [Google Scholar] [CrossRef]
  30. Thangaraj, K.; Vaiyapuri, M. Orientin, a C-glycosyl dietary flavone, suppresses colonic cell proliferation and mitigates NF-κB mediated inflammatory response in 1, 2-dimethylhydrazine induced colorectal carcinogenesis. Biomed. Pharmacother. 2017, 96, 1253–1266. [Google Scholar] [CrossRef]
  31. Fanelli, M.F.; Chinen, L.T.D.; Begnami, M.D.; Costa, W.L., Jr.; Fregnami, J.H.T.; Soares, F.A.; Montagnini, A.L. The influence of transforming growth factor-α, cyclooxygenase-2, matrix metalloproteinase (MMP)-7, MMP-9 and CXCR4 proteins involved in epithelial–mesenchymal transition on overall survival of patients with gastric cancer. Histopathology 2012, 61, 153–161. [Google Scholar] [CrossRef]
  32. Ma, X.; Holt, D.; Kundu, N.; Reader, J.; Goloubeva, O.; Take, Y.; Fulton, A.M. A prostaglandin E (PGE) receptor EP4 antagonist protects natural killer cells from PGE2-mediated immunosuppression and inhibits breast cancer metastasis. Oncoimmunology 2013, 2, e22647. [Google Scholar] [CrossRef] [Green Version]
  33. Watanabe, Y.; Imanishi, Y.; Ozawa, H.; Sakamoto, K.; Fujii, R.; Shigetomi, S.; Habu, N.; Otsuka, K.; Sato, Y.; Sekimizu, M. Selective EP2 and Cox-2 inhibition suppresses cell migration by reversing epithelial-to-mesenchymal transition and Cox-2 overexpression and E-cadherin downregulation are implicated in neck metastasis of hypopharyngeal cancer. Am. J. Transl. Res. 2020, 12, 1096. [Google Scholar]
  34. Peddareddigari, V.G.; Wang, D.; DuBois, R.N. The tumor microenvironment in colorectal carcinogenesis. Cancer Microenviron. 2010, 3, 149–166. [Google Scholar] [CrossRef] [PubMed] [Green Version]
  35. Young, L.E.; Dixon, D.A. Posttranscriptional regulation of cyclooxygenase 2 expression in colorectal cancer. Curr. Colorectal. Cancer Rep. 2010, 6, 60–67. [Google Scholar] [CrossRef] [PubMed] [Green Version]
  36. Ye, T.; Su, J.; Huang, C.; Yu, D.; Dai, S.; Huang, X.; Chen, B.; Zhou, M. Isoorientin induces apoptosis, decreases invasiveness, and downregulates VEGF secretion by activating AMPK signaling in pancreatic cancer cells. OncoTargets Ther. 2016, 9, 7481. [Google Scholar] [CrossRef] [PubMed] [Green Version]
  37. Xiao, Q.; Qu, Z.; Zhao, Y.; Yang, L.; Gao, P. Orientin ameliorates LPS-induced inflammatory responses through the inhibitory of the NF-κB pathway and NLRP3 inflammasome. Evid.-Based Complement. Alternat. Med. 2017, 2017, 2495496. [Google Scholar] [CrossRef] [Green Version]
  38. Ibrahim, H.-I.M.; Ismail, M.B.; Ammar, R.B.; Ahmed, E.A. Thidiazuron suppresses breast cancer via targeting miR-132 and dysregulation of the PI3K–Akt signaling pathway mediated by the miR-202-5p–PTEN axis. Biochem. Cell Biol. 2021, 99, 374–384. [Google Scholar] [CrossRef]
  39. Cornett, A.L.; Lutz, C.S. Regulation of COX-2 expression by miR-146a in lung cancer cells. RNA 2014, 20, 1419–1430. [Google Scholar] [CrossRef] [Green Version]
  40. Kumaraswamy, E.; Wendt, K.L.; Augustine, L.A.; Stecklein, S.R.; Sibala, E.C.; Li, D.; Gunewardena, S.; Jensen, R.A. BRCA1 regulation of epidermal growth factor receptor (EGFR) expression in human breast cancer cells involves microRNA-146a and is critical for its tumor suppressor function. Oncogene 2015, 34, 4333–4346. [Google Scholar] [CrossRef] [Green Version]
  41. Zhang, W.; Xiao, J.; Lu, X.; Liu, T.; Jin, X.; Xiao, Y.; He, X. PVT1 (rs13281615) and miR-146a (rs2910164) polymorphisms affect the prognosis of colon cancer by regulating COX2 expression and cell apoptosis. J. Cell. Physiol. 2019, 234, 17538–17548. [Google Scholar] [CrossRef]
  42. Poli, M.S.S.; Khajeniazi, S.; Behnampour, N.; Kalani, M.R.; Moradi, A.; Marjani, A. MicroRNA-146a as a prognostic biomarker for esophageal squamous cell carcinoma. Cancer Manag. Res. 2020, 12, 973. [Google Scholar] [CrossRef] [Green Version]
  43. Iacona, J.R.; Monteleone, N.J.; Lutz, C.S. miR-146a suppresses 5-lipoxygenase activating protein (FLAP) expression and Leukotriene B4 production in lung cancer cells. Oncotarget 2018, 9, 26751. [Google Scholar] [CrossRef] [PubMed]
  44. Xia, M.; Duan, M.; Tong, J.; Xu, J. MiR-26b suppresses tumor cell proliferation, migration and invasion by directly targeting COX-2 in lung cancer. Eur. Rev. Med. Pharmacol. Sci. 2015, 19, 4728–4737. [Google Scholar] [PubMed]
  45. Rahmati-Yamchi, M.; Ghareghomi, S.; Haddadchi, G.; Milani, M.; Aghazadeh, M.; Daroushnejad, H. Fenugreek extract diosgenin and pure diosgenin inhibit the hTERT gene expression in A549 lung cancer cell line. Mol. Biol. Rep. 2014, 41, 6247–6252. [Google Scholar] [CrossRef]
  46. El Bairi, K.; Ouzir, M.; Agnieszka, N.; Khalki, L. Anticancer potential of Trigonella foenum graecum: Cellular and molecular targets. Biomed. Pharmacother. 2017, 90, 479–491. [Google Scholar] [CrossRef] [PubMed]
  47. Lewandowska, A.M.; Rudzki, M.; Rudzki, S.; Lewandowski, T.; Laskowska, B. Environmental risk factors for cancer-review paper. Ann. Agric. Environ. Med. 2019, 26, 1–7. [Google Scholar] [CrossRef]
  48. Yadav, U.C.; Baquer, N.Z. Pharmacological effects of Trigonella foenum-graecum L. in health and disease. Pharm. Biol. 2014, 52, 243–254. [Google Scholar] [CrossRef] [PubMed] [Green Version]
  49. Zhang, J.; Chu, C.-J.; Li, X.-L.; Yao, S.; Yan, B.; Ren, H.-L.; Xu, N.-Y.; Liang, Z.-T.; Zhao, Z.-Z. Isolation and identification of antioxidant compounds in Vaccinium bracteatum Thunb. by UHPLC-Q-TOF LC/MS and their kidney damage protection. J. Funct. Foods 2014, 11, 62–70. [Google Scholar] [CrossRef]
  50. Siegel, R.L.; Miller, K.D.; Jemal, A. Cancer statistics, 2015. Cancer J. Clin. 2015, 65, 5–29. [Google Scholar] [CrossRef]
  51. Nijveldt, R.J.; Van Nood, E.; Van Hoorn, D.E.; Boelens, P.G.; Van Norren, K.; Van Leeuwen, P.A. Flavonoids: A review of probable mechanisms of action and potential applications. Am. J. Clin. Nutr. 2001, 74, 418–425. [Google Scholar] [CrossRef]
  52. Shi, Q.; Jiang, Z.; Yang, J.; Cheng, Y.; Pang, Y.; Zheng, N.; Chen, J.; Chen, W.; Jia, L. A flavonoid glycoside compound from Murraya paniculata (L.) interrupts metastatic characteristics of A549 cells by regulating STAT3/NF-κB/COX-2 and EGFR signaling pathways. AAPS J. 2017, 19, 1779–1790. [Google Scholar] [CrossRef]
  53. Neuss, H.; Huang, X.; Hetfeld, B.K.; Deva, R.; Henklein, P.; Nigam, S.; Mall, J.W.; Schwenk, W.; Dubiel, W. The ubiquitin-and proteasome-dependent degradation of COX-2 is regulated by the COP9 signalosome and differentially influenced by coxibs. J. Mol. Med. 2007, 85, 961–970. [Google Scholar] [CrossRef] [PubMed]
  54. Saha, C.; Hegde, P.; Friboulet, A.; Bayry, J.; Kaveri, S.V. Viscum album-mediated COX-2 inhibition implicates destabilization of COX-2 mRNA. PLoS ONE 2015, 10, e0114965. [Google Scholar] [CrossRef] [Green Version]
  55. Świątek, P.; Gębczak, K.; Gębarowski, T.; Urniaz, R. Biological evaluation and molecular docking studies of dimethylpyridine derivatives. Molecules 2019, 24, 1093. [Google Scholar] [CrossRef] [PubMed] [Green Version]
  56. Sambandam, B.; Islam, V.I.H.; Raman, P.; Bhattacharjee, M.; Balasubramanian, A.; Thiyagarajan, D. Coal fly ash nanoparticles induced cytotoxicity and oxidative DNA damage and apoptosis in Chang liver cells. Afr. J. Pharm. Pharmacol. 2014, 8, 801–808. [Google Scholar]
  57. Hata, A.N.; Engelman, J.A.; Faber, A.C. The BCL2 family: Key mediators of the apoptotic response to targeted anticancer therapeutics. Cancer Discov. 2015, 5, 475–487. [Google Scholar] [CrossRef] [Green Version]
  58. Maji, S.; Panda, S.; Samal, S.K.; Shriwas, O.; Rath, R.; Pellecchia, M.; Emdad, L.; Das, S.K.; Fisher, P.B.; Dash, R. Bcl-2 antiapoptotic family proteins and chemoresistance in cancer. Adv. Cancer Res. 2018, 137, 37–75. [Google Scholar]
  59. Kumar, V.S.; Kumaresan, S.; Tamizh, M.M.; Islam, M.I.H.; Thirugnanasambantham, K. Anticancer potential of NF-κB targeting apoptotic molecule “flavipin” isolated from endophytic Chaetomium globosum. Phytomedicine 2019, 61, 152830. [Google Scholar] [CrossRef]
  60. Moita, E.; Gil-Izquierdo, A.; Sousa, C.; Ferreres, F.; Silva, L.R.; Valentao, P.; Dominguez-Perles, R.; Baenas, N.; Andrade, P.B. Integrated analysis of COX-2 and iNOS derived inflammatory mediators in LPS-stimulated RAW macrophages pre-exposed to Echium plantagineum L. bee pollen extract. PLoS ONE 2013, 8, e59131. [Google Scholar] [CrossRef] [Green Version]
  61. Kim, J.-Y.; Park, S.J.; Yun, K.-J.; Cho, Y.-W.; Park, H.-J.; Lee, K.-T. Isoliquiritigenin isolated from the roots of Glycyrrhiza uralensis inhibits LPS-induced iNOS and COX-2 expression via the attenuation of NF-κB in RAW 264.7 macrophages. Eur. J. Pharmacol. 2008, 584, 175–184. [Google Scholar] [CrossRef]
  62. Park, J.S.; Jun, H.J.; Cho, M.J.; Cho, K.H.; Lee, J.S.; Zo, J.I.; Pyo, H. Radiosensitivity enhancement by combined treatment of celecoxib and gefitinib on human lung cancer cells. Clin. Cancer Res. 2006, 12, 4989–4999. [Google Scholar] [CrossRef] [Green Version]
  63. Androutsopoulos, V.P.; Tsatsakis, A.M.; Spandidos, D.A. Cytochrome P450 CYP1A1: Wider roles in cancer progression and prevention. BMC Cancer 2009, 9, 1–17. [Google Scholar] [CrossRef] [PubMed] [Green Version]
  64. Ngo, Q.A.; Thi, T.H.N.; Pham, M.Q.; Delfino, D.; Do, T.T. Antiproliferative and antiinflammatory coxib–combretastatin hybrids suppress cell cycle progression and induce apoptosis of MCF7 breast cancer cells. Mol. Divers. 2021, 25, 2307–2319. [Google Scholar] [CrossRef] [PubMed]
  65. Guruswamy, S.; Rao, C.V. Synergistic effects of lovastatin and celecoxib on caveolin-1 and its down-stream signaling molecules: Implications for colon cancer prevention. Int. J. Oncol. 2009, 35, 1037–1043. [Google Scholar] [PubMed] [Green Version]
  66. Jeon, Y.-W.; Suh, Y.J. Synergistic apoptotic effect of celecoxib and luteolin on breast cancer cells. Oncol. Rep. 2013, 29, 819–825. [Google Scholar] [CrossRef] [Green Version]
  67. Qiu, R.; Chen, J.; Sima, J.; Shen, X.; Liu, D.; Shen, J. NS398 induces apoptosis in non-small cell lung cancer cells. J. Cancer Res. Clin. Oncol. 2012, 138, 119–124. [Google Scholar] [CrossRef]
  68. Ji, Y.; He, Y.; Liu, L.; Zhong, X. MiRNA-26b regulates the expression of cyclooxygenase-2 in desferrioxamine-treated CNE cells. FEBS Lett. 2010, 584, 961–967. [Google Scholar] [CrossRef] [Green Version]
  69. Thirugnanasambantham, K.; Muralidaran, S.; Mandal, A.K.A. Molecular cloning, computational and expression analysis of anthocyanidin reductase in tea (Camellia sinensis). Appl. Biochem. Biotechnol. 2014, 174, 130–145. [Google Scholar] [CrossRef]
  70. Khalil, H.E.; Alqahtani, N.K.; Darrag, H.M.; Ibrahim, H.-I.M.; Emeka, P.M.; Badger-Emeka, L.I.; Matsunami, K.; Shehata, T.M.; Elsewedy, H.S. Date Palm Extract (Phoenix dactylifera) PEGylated Nanoemulsion: Development, Optimization and Cytotoxicity Evaluation. Plants 2021, 10, 735. [Google Scholar] [CrossRef]
  71. Abdullah, A.; Maged, M.; Hairul-Islam, M.I.; Osama, I.A.; Maha, H.; Manal, A.; Hamza, H. Activation of aryl hydrocarbon receptor signaling by a novel agonist ameliorates autoimmune encephalomyelitis. PLoS ONE 2019, 14, e0215981. [Google Scholar] [CrossRef]
  72. Hanieh, H.; Ibrahim, H.-I.M.; Mohammed, M.; Alwassil, O.I.; Abukhalil, M.H.; Farhan, M. Activation of aryl hydrocarbon receptor signaling by gallic acid suppresses progression of human breast cancer in vitro and in vivo. Phytomedicine 2021, 96, 153817. [Google Scholar] [CrossRef]
  73. Yi, Q.-Y.; Zhang, W.-Y.; He, M.; Du, F.; Wang, X.-Z.; Wang, Y.-J.; Gu, Y.-Y.; Bai, L.; Liu, Y.-J. Anticancer and antibacterial activity in vitro evaluation of iridium (III) polypyridyl complexes. J. Biol. Inorg. Chem. 2019, 24, 151–169. [Google Scholar] [CrossRef] [PubMed]
  74. Kazakova, O.; Șoica, C.; Babaev, M.; Petrova, A.; Khusnutdinova, E.; Poptsov, A.; Macașoi, I.; Drăghici, G.; Avram, Ș.; Vlaia, L. 3-Pyridinylidene Derivatives of Chemically Modified Lupane and Ursane Triterpenes as Promising Anticancer Agents by Targeting Apoptosis. Int. J. Mol. Sci. 2021, 22, 10695. [Google Scholar] [CrossRef] [PubMed]
  75. Uversky, V.N.; El-Fakharany, E.M.; Abu-Serie, M.M.; Almehdar, H.A.; Redwan, E.M. Divergent anticancer activity of free and formulated camel milk α-lactalbumin. Cancer Investig. 2017, 35, 610–623. [Google Scholar] [CrossRef] [PubMed]
Figure 1. The cell viability assay (CCK-8 kit) of TME against MDA-MB-231, A549 and HCT-116. Values represent the mean ± SD of triple experiments. * p < 0.05, treated groups were compared with the DMSO group.
Pharmaceuticals 15 00154 g001
Figure 2. HPLC chromatograms of SubFr.DMF1-3-4 (A), HPLC chromatogram of collected pure OT (B).
Pharmaceuticals 15 00154 g002
Figure 3. Effect of orientin on different cancer cell lines. Cytotoxicity of OT in different concentrations from 6.25 μM to 100 μM. The cell lines used for CCK-8 are MDA-MB-231, A549 and HCT-116 cell lines. IC50 concentration of OT was determined, found to be 25 μM, and this was chosen for further analysis (A). Cellular interaction of OT and COX-2 in different tested cell lines (MDA-MB-231, A549 and HCT-116 cell lines) using immunoprecipitation (B). OT 25 μM for different periods was used to measure A549 cell viability (C). mRNA expression of COX-2 with OT treatment was studied using real-time PCR (D). The effect of OT on protein expression of COX-2 in A549 cells (E,F). OT abrogated wound healing (migration) effect of A549 and it was compared with 0 h and 24 h time points (G,H). Invasion–Matrigel analysis was used to test OT in A549 invading capacity using gelatin-coated insert well method (I,J). A549 cells were stimulated with TGF-β (10 μg/mL) with supplemented OT 25 μM for 4 h in cell culture incubator. After incubation, stimulated cells were blocked with actinomycin D (5 μg/mL) (Act-D). Cells were harvested after 6 h and COX-2 mRNA stability expression was analyzed using RT-PCR. The estimation of COX-2 expression was relative compared with and without OT treatment with TGF-β induction (K). Values represent the mean ± SD of triplicate experiments. * p < 0.05, OT-treated groups compared with the DMSO group.
Pharmaceuticals 15 00154 g003
Figure 4. In silico docking of ligand (OT) and COX-2 protein binding analysis. Computational binding of OT (CID: 5281675) and human COX-2 (PDB-ID-5kir) using AutoDock software. Structure of OT with carbon arrangements (A). The 3D structure of OT in PDB format (B). The 3D structure of human COX-2 from PDB (C). Binding of OT with human COX-2 protein (D). Binding pocket of OT with COX-2 protein (E).
Pharmaceuticals 15 00154 g004
Figure 5. The effect of COX-2 inhibitor CLX on A549 cancer cell lines. The 3D structure of celecoxib using pymol software tool (A). The 3D structure of COX-2 derived from protein data bank PDB-RSCB (B). In silico binding of CLX with COX-2 protein and three prominent bindings in threonine and tyrosine amino acids (C). Binding pocket of CLX with COX-2 protein using AutoDock software (D). COX-2 mRNA expression level in CLX-treated A549 lung cancer cell lines (E). COX-2 protein expression of CLX-treated A549 cancer cell lines (F). Cytotoxic effect of CLX against OT in A549 cell lines (OT concentration was from 6.5 μM to 25 μM) (G). CLX-challenged OT treatment inhibits mRNA and protein expression level, tested groups included control, CLX, CLX + OT (25 μM) and OT (25 μM) alone (HJ). Values represent the mean ± SD of triplicate experiments. * p < 0.05, compared with the DMSO group.
Pharmaceuticals 15 00154 g005
Figure 6. The effect of OT on apoptotic modifications in A549 lung cancer cell lines. OT concentration of 25 μM was used in CLX-challenged A549 cells and cells were harvested after 24 h for microscopic and flow cytometry examination. AO/EB dual staining of CLX-challenged (5 μM) OT-treated (25 μM) A549 cell lines for detection of early and late apoptosis (A). DAPI staining of CLX-challenged OT treatment in A549 cell lines for detection of nuclear DNA damage (B). CLX-challenged A549 cells were treated with OT (25 μM) for 24 h, stained by annexin-V-FITC and PI and analyzed by flow cytometry gates (C). Each column represents the mean ± SEM of triplicate experiments. * p < 0.05, treated groups compared with the DMSO group.
Pharmaceuticals 15 00154 g006
Figure 7. Silencing model of COX-2 abrogates the cancer conditions in A549 cancer cell lines. COX-2-coding miRNA targets such as miR-146a, miR-26b expression levels were compared with U6 control miRNA for DMSO, OT with three time points (12 h, 24 h and 48 h) (A). The inhibition of A549 cell proliferation with OT (25 μM) was mitigated with Si-COX-2 after 24 h treatment. The cells were transfected with Si-COX-2 or SiNS by nucleofector. Cell proliferation was quantified colorimetrically at 450 nm using CCK-8 kit (B). The response of COX-2 mRNA and protein expression in Si-COX-2-transfected cells treated with OT (25 μM) (CE). The expression of miR-146a and miR-26b in silenced model of Si-COX-2 with treatment of OT (25 μM) (F). Downstream of COX-2-mediated prostaglandin-2 (PGE-2) level was quantified in OT-treated (25 μM) A549 cells. Briefly, Si-COX-2-transfected cells were treated with OT and whole cell lysate was prepared with 0.1 M phosphate buffer. This cell lysate was used to quantify PGE-2 level and expressed in pg/mL using ELISA method (G). PGE-2 protein level was quantified in OT-treated A549 cells using Western blot (H,I). Data are shown as mean ± SD from representative experiment studied in triplicate. * p < 0.05, OT treatment groups were compared with the DMSO group.
Pharmaceuticals 15 00154 g007
Figure 8. COX-2 abrogates tumorigenic properties. Depletion of COX-2 abrogated the inhibitory effects of OT (25 μM) on migration of A549 lung cancer cells (A,B). Si-COX-2 mitigated the inhibitory effects of OT (25 μM) on invasion of A549 cells. Invasiveness of cancer cells was studied using Boyden chamber insert well model. The invaded cells were stained with Giemsa and counted in 4 different microscopic fields (C,D). The DNA damage and formation linear strand was excited and showed yellow-orange fluorescence. Si-COX-2 reduced the inhibitory effects of OT (25 μM) on DNA damage of A549 cells (E,F). Si-COX-2-transfected A549 cells were treated with OT (25 μM) for 24 h, nuclear stained by annexin-V-FITC and PI and analyzed by flow cytometry gates (G). COX-2 does not obstruct OT-induced apoptosis. Data are shown as mean ± SD from representative experiment studied in triplicate. * p < 0.05, treated groups were compared with the DMSO group.
Pharmaceuticals 15 00154 g008
Table 1. Interface residues for protein ligand complex formed by COX-2 and OT.
ProteinLigandBinding
Energy
Ligand
Efficiency
Intermole
Energy
Ligand Atoms (Ring)Docked Amino
Acid Residue (Bond Length)
COX-2OT−10.43−0.33−10.37C-3 OH (B)Chain B GLY`533/O (1.7 Å)
C-4 OH (B)Chain B GLY`533/O (1.8 Å)
C-4 O (B)Chain B VAL`228/HN (1.8 Å)
C-4 O (B)Chain B ASN`537/2HD2 (2.4 Å)
C-4 O (C)Chain B ASP`229/OD2 (3.3 Å)
C-4 O (C)Chain A TRP`139/HE1 (2.5 Å)
C-2` OH (C)Chain B ASN`375/O (2.4 Å)
C-3` O (C)Chain B ARG`376/HE (2.5 Å)
C-3` O (C)Chain B ARG`376/2HH2 (2.3 Å)
C-4` OH (C)Chain B GLN`374/OE1 (2.2 Å)
C-6` O (C)Chain A ARG`376/1HH2 (2.2 Å)
ARG, Arginine; ASN, Asparagine; ASP, Aspartic acid; GLY, Glycine; TRP, Tryptophan; GLN, Glutamine; VAL, Valine.
Table 2. Interface residues for protein ligand complex formed by COX-2 and CLX.
ProteinLigandBinding
Energy
Ligand
Efficiency
Intermole
Energy
Ligand Atoms (Ring)Docked Amino
Acid Residue (Bond Length)
COX-2CLX−9.4−0.18−8.5C-4 O (B)Chain B THR387/HE (1.9 Å)
C-4 O (C)Chain B THR385/HH2 (2.1 Å)
C-2 O (C)Chain B THR206/HN (2.0 Å)
C-3-OH (B)Chain A ARG 376/OE1 (1.9 Å)
C-3 O (C)Chain B GLY 535/O (1.8 Å)
ARG, Arginine; GLY, Glycine; THR, Threonine.
Table 3. Real-time PCR primer details.
Primer
Name
Forward
Sequence
Reverse
Sequence
Product
Size
COX-2TGTATGCTACCATCTGGCTTCGGGTTTGGAACAGTCGCTCGTCATC190
BCL-2TGTGGATGACTGACTACCTGAACCCAGCCAGGAGAAATCAAACAGAGG186
iNOSACAACAGGAACCTACCAGCTCAGATGTTGTAGCGCTGTGTGTCA190
CYP-1A1GGCCACTTTGACCCTTACAACAGGTAACGGAGGACAGGAA236
β-actinAAGATCCTGACCGAGCGTGGCAGCACTGTGTTGGCATAGAGG225
Publisher’s Note: MDPI stays neutral with regard to jurisdictional claims in published maps and institutional affiliations.

