Article

Integrative Analysis Prioritizes CRIP2 as a Candidate Associated with Myocardial Copper-Handling Responses After Myocardial Infarction

1
Department of Applied Psychology, School of Health Management, Guangzhou Medical University, Guangzhou 510182, China
2
Guangdong Engineering Technology Research Center for Translational Medicine of Mental Disorders, Guangzhou Medical University, Guangzhou 510260, China
*
Author to whom correspondence should be addressed.
These authors contributed equally to this work.
Curr. Issues Mol. Biol. 2026, 48(8), 767; https://doi.org/10.3390/cimb48080767
Submission received: 23 June 2026 / Revised: 23 July 2026 / Accepted: 26 July 2026 / Published: 28 July 2026

Abstract

Post-myocardial infarction (MI) remodeling is accompanied by metabolic stress, but the myocardial genes associated with copper handling are poorly defined. We sought to prioritize a tissue-derived candidate rather than establish a copper-dependent mechanism. Regional MI transcriptomes and an in-house left anterior descending coronary artery ligation mouse RNA-sequencing cohort were integrated with protein quantitative trait locus-based Mendelian randomization (MR). Follow-up comprised local and external tissue validation, cardiac single-cell RNA sequencing, Genotype-Tissue Expression co-expression, computational perturbation, and CRIP2 knockdown or overexpression in H9c2 cells exposed to hypoxia/reoxygenation (H/R). CRIP2 showed a nominal protective-direction MR association (odds ratio 0.831, 95% confidence interval 0.735–0.939; p = 0.0031), but did not pass the Bonferroni threshold. Crip2 was lower in the local MI model (p = 0.0168; n = 5 per group) and in an independent dataset. A prespecified lipoylated-tricarboxylic-acid module was negatively enriched after MI (normalized enrichment score −1.63; false discovery rate 0.012), whereas the broader copper-homeostasis set was not significant. Single-cell data localized Crip2 mainly to cardiomyocytes, but were not adequately replicated for condition-level inference. Under H/R, Atp7a was the only copper-handling transcript whose knockdown-by-oxygen interaction remained significant after adjustment (q = 0.0405). CRIP2 overexpression was associated with higher Cell Counting Kit-8 metabolic activity during H/R (interaction p = 0.00551), whereas the knockdown interaction was not significant. Copper abundance, mitochondrial function, and cuproptosis markers were not measured. The data prioritize CRIP2 for mechanistic study, but do not show that it regulates copper flux or post-MI remodeling.

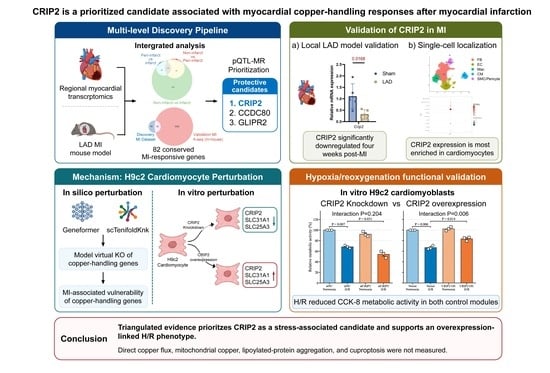
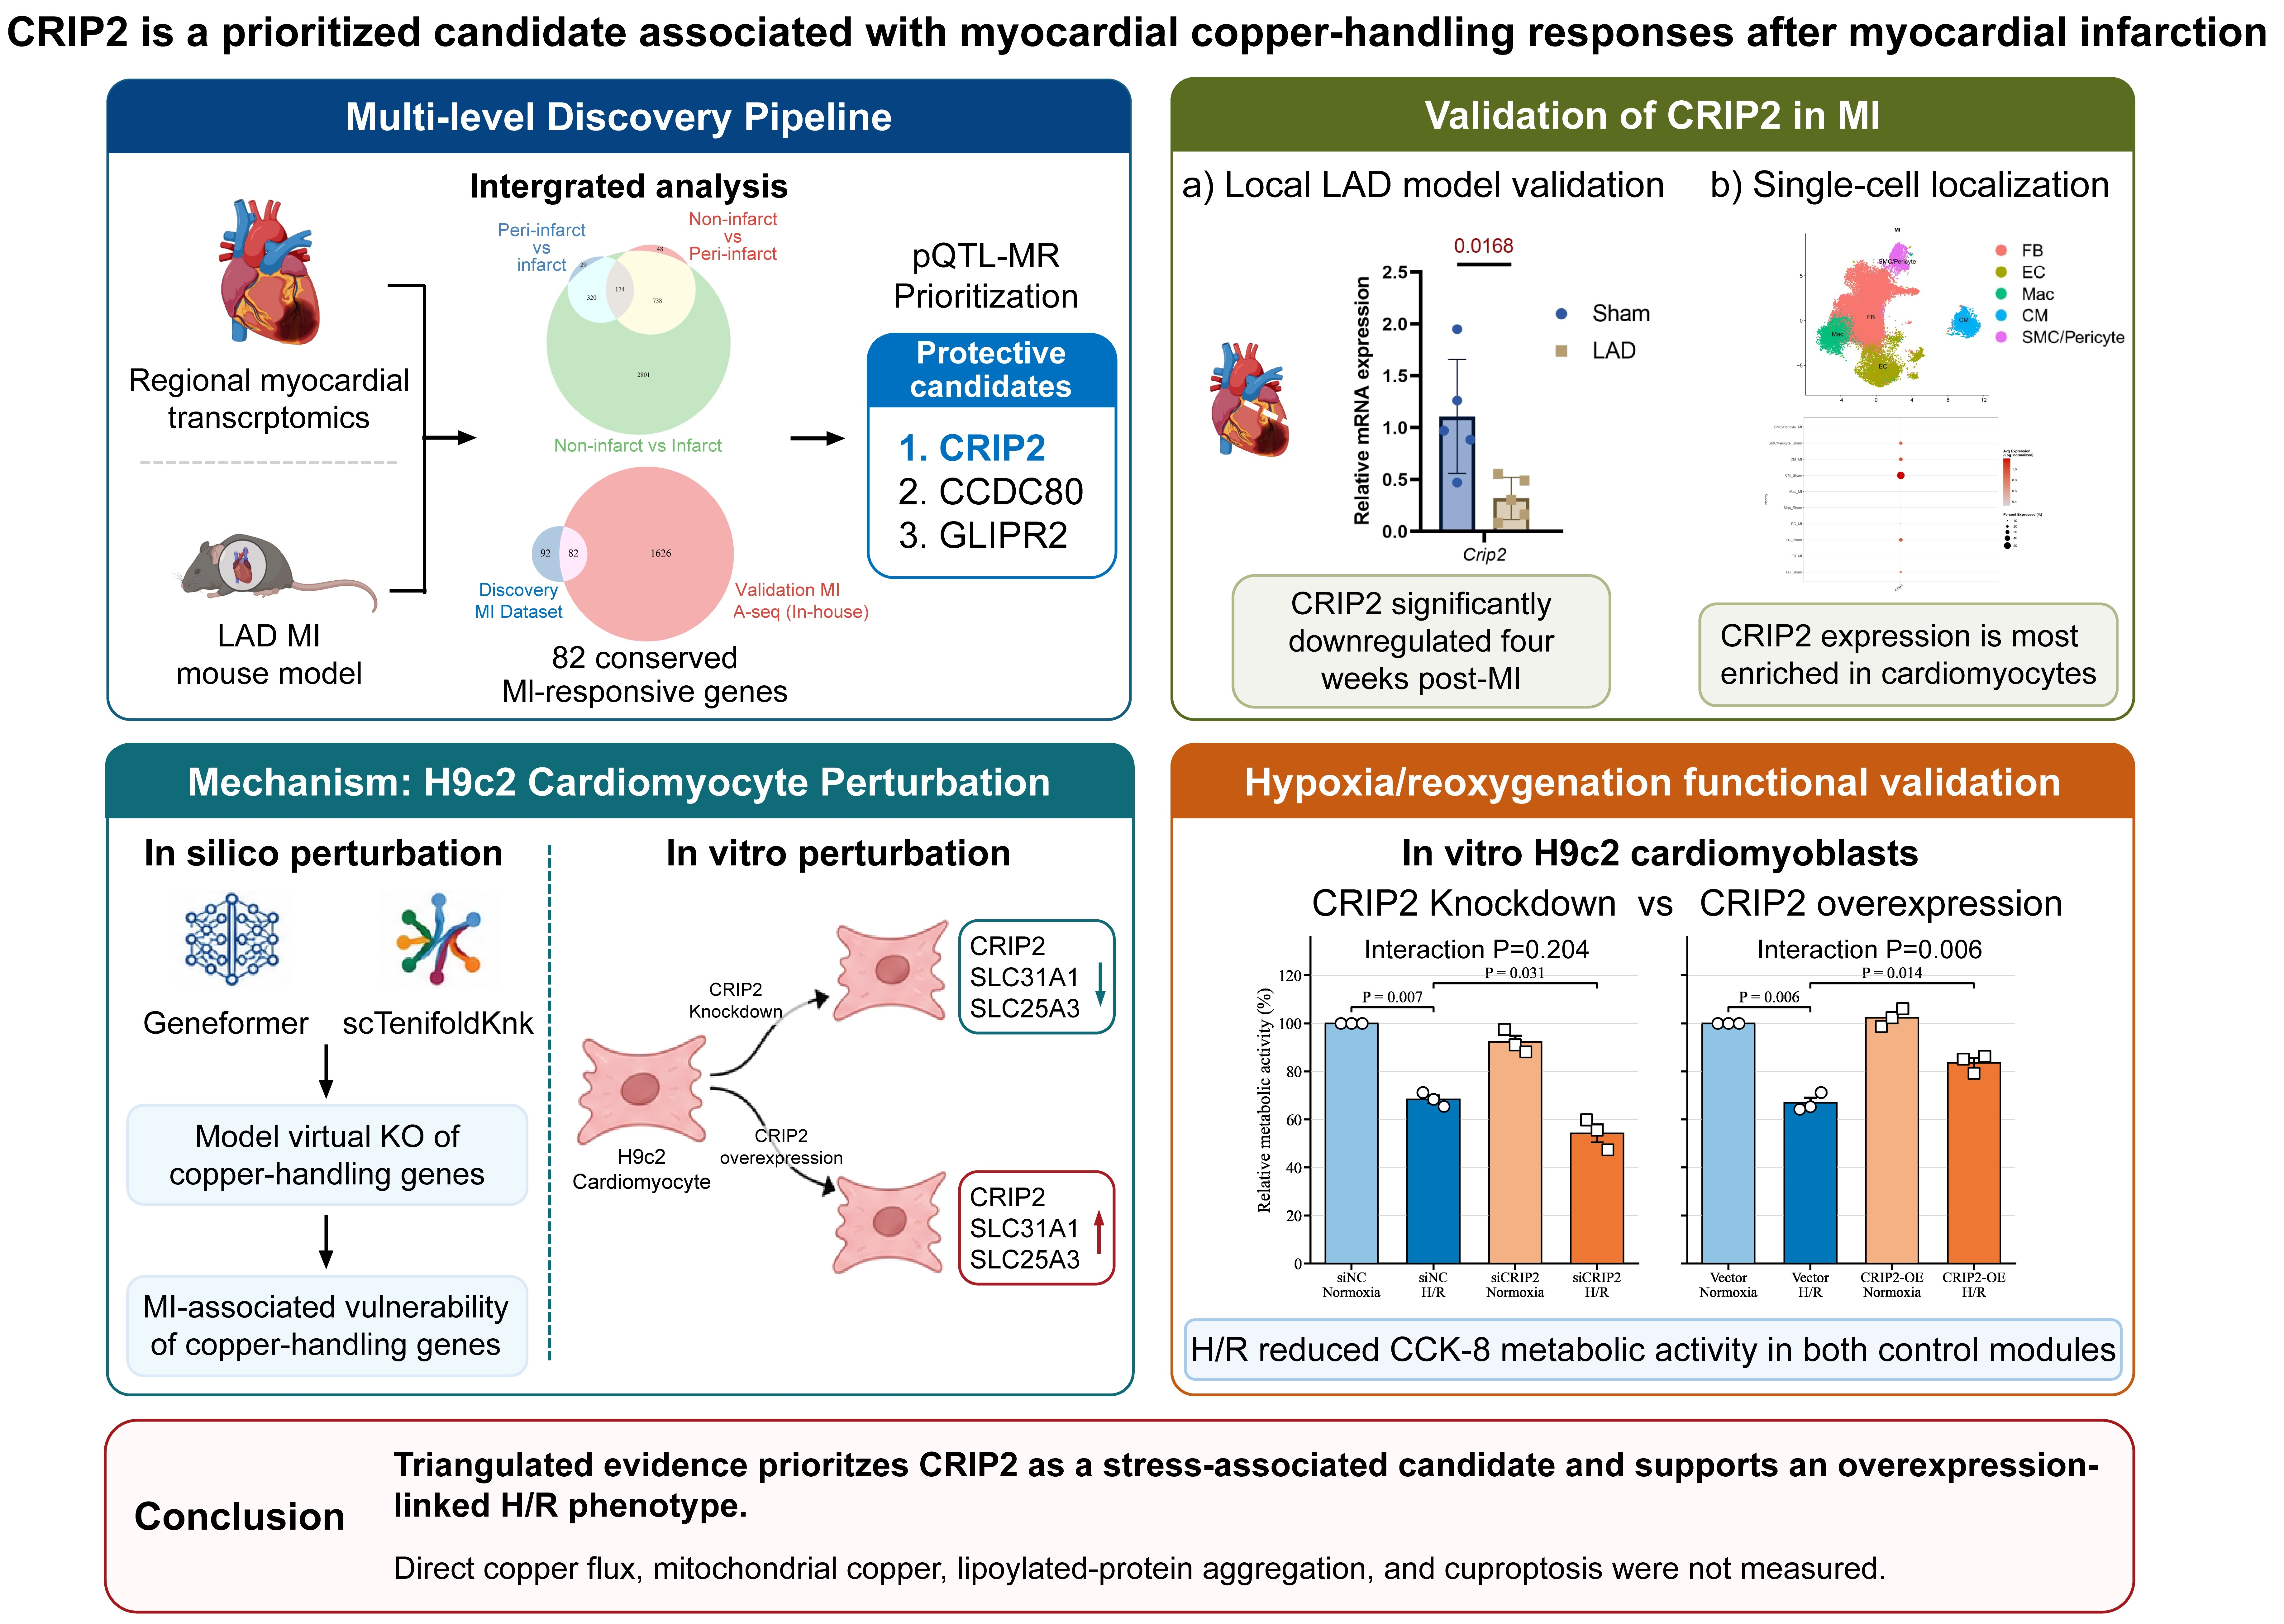
Graphical Abstract

1. Introduction

Ischemic heart disease remained the leading cause of age-standardized disability-adjusted life years in 2022 [1]. Survival after acute myocardial infarction (MI) has improved, yet long-term studies show persistent cardiovascular and noncardiovascular risk [2,3]. In a cohort of 433,361 people with MI, 38% died within nine years, nearly one-third developed heart or renal failure, and 7% had recurrent MI [4]. These outcomes motivate work on chronic repair, in addition to acute care and secondary prevention [5,6,7]. Cardiomyocyte loss, inflammation, and fibroblast-driven matrix remodeling contribute to adverse ventricular remodeling [8,9,10]. Copper homeostasis is one candidate metabolic axis [11]: copper supports mitochondrial respiration and antioxidant defense through enzymes including cytochrome c oxidase and SOD1 [12,13], whereas excess copper can disrupt electron transport, increase reactive oxygen species, and trigger cuproptosis through lipoylated-protein aggregation [14].
Experimental studies link copper excess to mitochondrial injury and cardiomyocyte death [15]. SIRT3-dependent signaling [16] and copper-handling proteins such as COX17 and ATP7A/B [17] have also been implicated in cardiac copper responses. These observations justify examining copper-related pathways in the infarcted heart, while leaving open which myocardial genes are relevant in vivo.
Most cardiac copper studies emphasize systemic measures or single experimental models, which cannot resolve region- and cell-type-specific responses within the injured myocardium [18]. CRIP2 was not selected a priori; it emerged from our tissue-anchored screen. The protein contains LIM and cysteine-rich domains and has been implicated in vascular development [19]. It has also been identified as a nuclear copper-binding partner of ATOX1, with copper-dependent effects on reactive oxygen species and autophagy [20]. This literature made CRIP2 a plausible follow-up candidate, but did not establish a role in MI.
The objective of this study was to identify a reproducible myocardial candidate, determine its cardiac cell-type distribution, and ask whether genetic, computational, and cell-based data supported further mechanistic testing. Protein quantitative trait locus MR was used for prioritization [21]; single-cell and in silico analyses were treated as complementary, hypothesis-generating evidence [22,23,24], not as proof of causality.

2. Results

2.1. Integrated MI Transcriptomics and pQTL-MR Nominally Prioritize CRIP2

Pairwise differential-expression analyses across infarcted myocardium (IM), the peri-infarct zone (PZ), and non-infarcted myocardium (NI) in GSE775 identified a 174-gene triple overlap (Figure 1A). Intersection with our in-house mouse LAD/MI RNA-sequencing cohort yielded 82 shared genes (Figure 1B). Among approximately 32 proteins screened by pQTL-MR, three had nominal protective-direction IVW estimates: CRIP2 (12 variants; OR 0.831, 95% CI 0.735–0.939, p = 0.00306), CCDC80 (19 variants; OR 0.798, 95% CI 0.677–0.940, p = 0.00702), and GLIPR2 (20 variants; OR 0.916, 95% CI 0.840–0.999, p = 0.0461; Figure 1C). None met the Bonferroni threshold of p < 0.00156. CRIP2 was prioritized for follow-up because all instruments were strong (minimum F = 20.96; mean F = 41.96), with no marked heterogeneity (IVW Cochran Q p = 0.900), directional pleiotropy (MR-Egger intercept p = 0.357), or MR-PRESSO global evidence of horizontal pleiotropy (p = 0.902). Directionally consistent sensitivity estimates were obtained by weighted median (OR 0.837, p = 0.0331) and MR-Egger (OR 0.751, p = 0.0413). The stringent three-SNP IVW model remained directionally consistent (OR 0.815, 95% CI 0.689–0.963, p = 0.0165), and leave-one-out estimates ranged from OR 0.814 to 0.844 (maximum p = 0.0140; Figure S1). In contrast, the only available cis-window candidate, rs4983411, was null (Wald-ratio OR 0.937, 95% CI 0.545–1.610, p = 0.814), reinforcing that the MR finding is supportive, rather than definitive, causal evidence. In the local LAD-ligation MI model, Crip2 mRNA was reduced four weeks after MI (p = 0.0168; n = 5 per group), whereas Ccdc80 and Glipr2 did not reach statistical significance (Figure 1D). Independent GSE236374 analysis confirmed marked Crip2 downregulation at MI day 7 versus sham (log2 fold change = −1.810; adjusted p = 4.23 × 10−84) [25] (Figure S2). The seven-gene cuproptosis-permissive/lipoylated-TCA core module was negatively enriched (NES = −1.633; nominal p = 0.00457; FDR = 0.0121), whereas the broader 14-gene copper-homeostasis set was not significant (NES = −1.295; FDR = 0.236). This pattern is compatible with coordinated transcriptional suppression and candidate prioritization; it is not evidence of cuproptotic cell death or causality.

2.2. Single-Cell Profiling Localizes Crip2 to Cardiomyocytes After MI

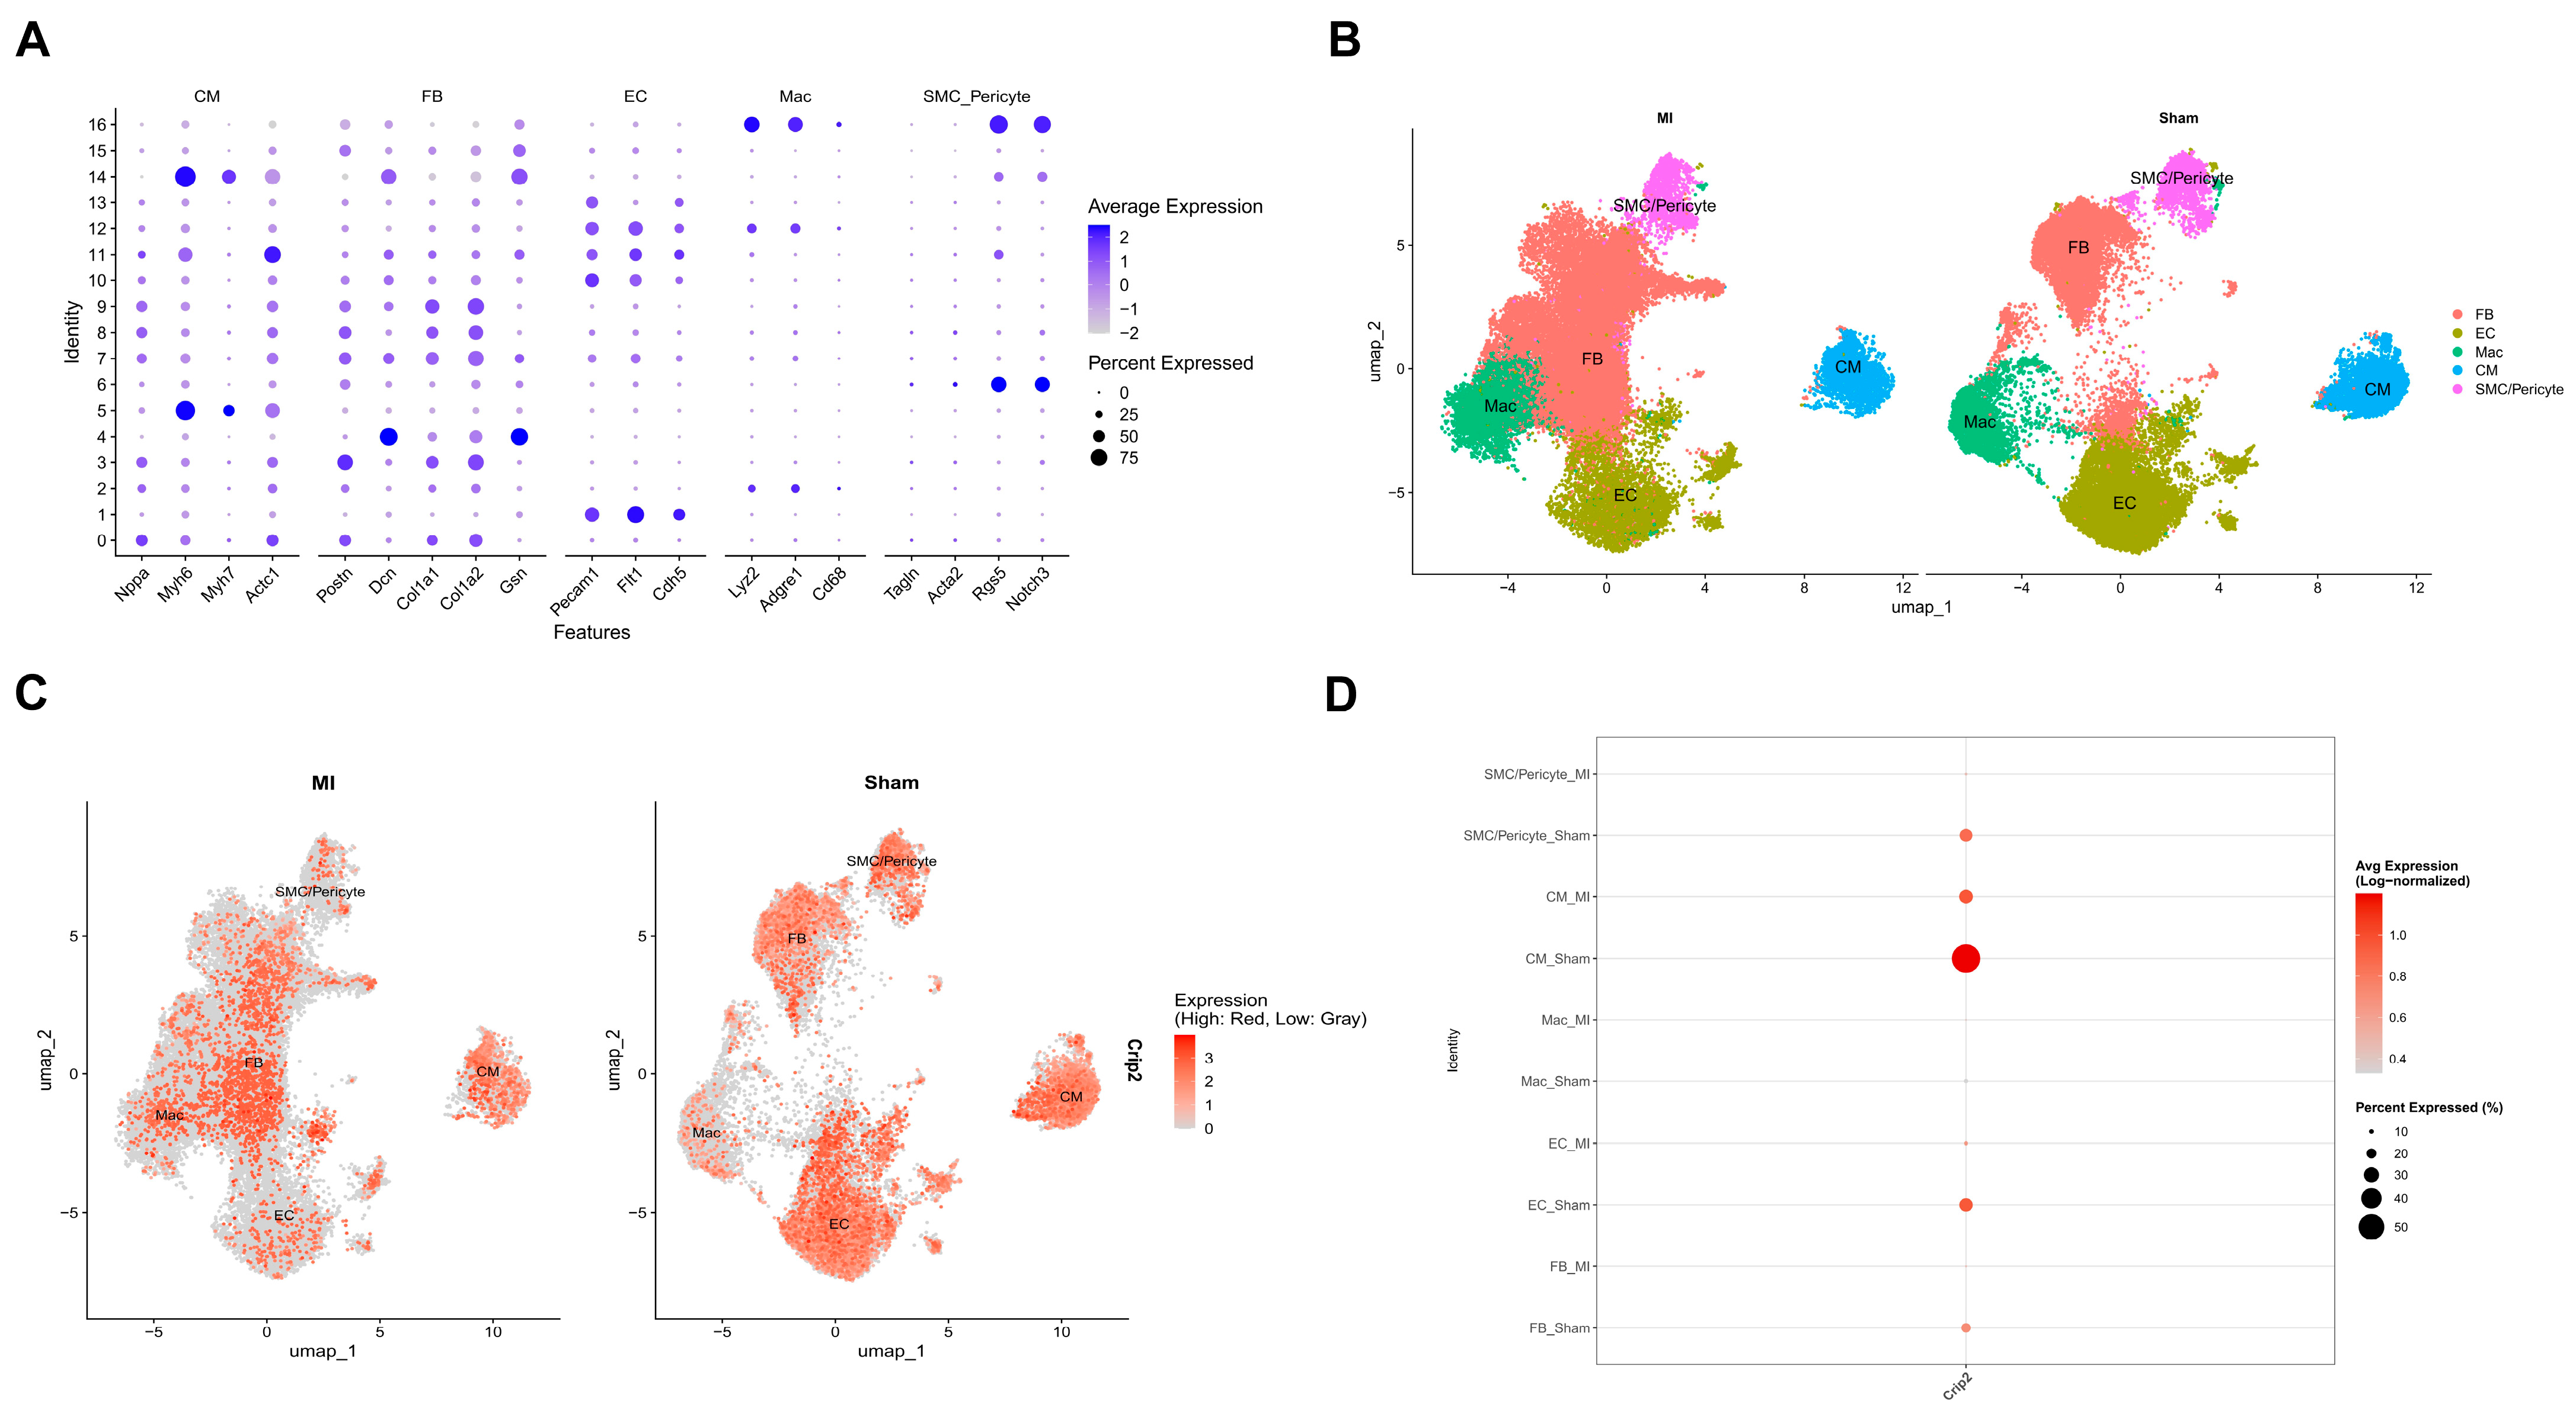
The originally processed GSE214611 atlas resolved five major populations using canonical markers: cardiomyocytes, fibroblasts, endothelial cells, macrophages, and smooth muscle cells/pericytes (Figure 2A,B). Crip2 expression was broad but descriptively highest in cardiomyocytes under sham conditions, with reduced expressing-cell proportions in MI across cardiomyocytes and several stromal/vascular populations (Figure 2C,D). However, raw-file integrity auditing showed that the nominal MI accessions GSM6613074_snd7_1 and GSM6613075_snd7_2 were byte-identical at the matrix, feature, and barcode levels. Unique-heart pseudobulk sensitivity analysis therefore comprised three sham and two unique MI hearts. The MI-minus-sham differences were −0.498 log2 counts per million for Crip2 (exact permutation p = 0.40), −1.329 for the seven-gene core-module score (p = 0.10), and +0.091 for the 14-gene copper-homeostasis module (p = 0.90). Accordingly, the single-cell results are used for descriptive cell-type localization only, and do not provide adequately replicated condition-level inference.

2.3. Exploratory Computational Models Yield Non-Concordant CRIP2 Perturbation Signals

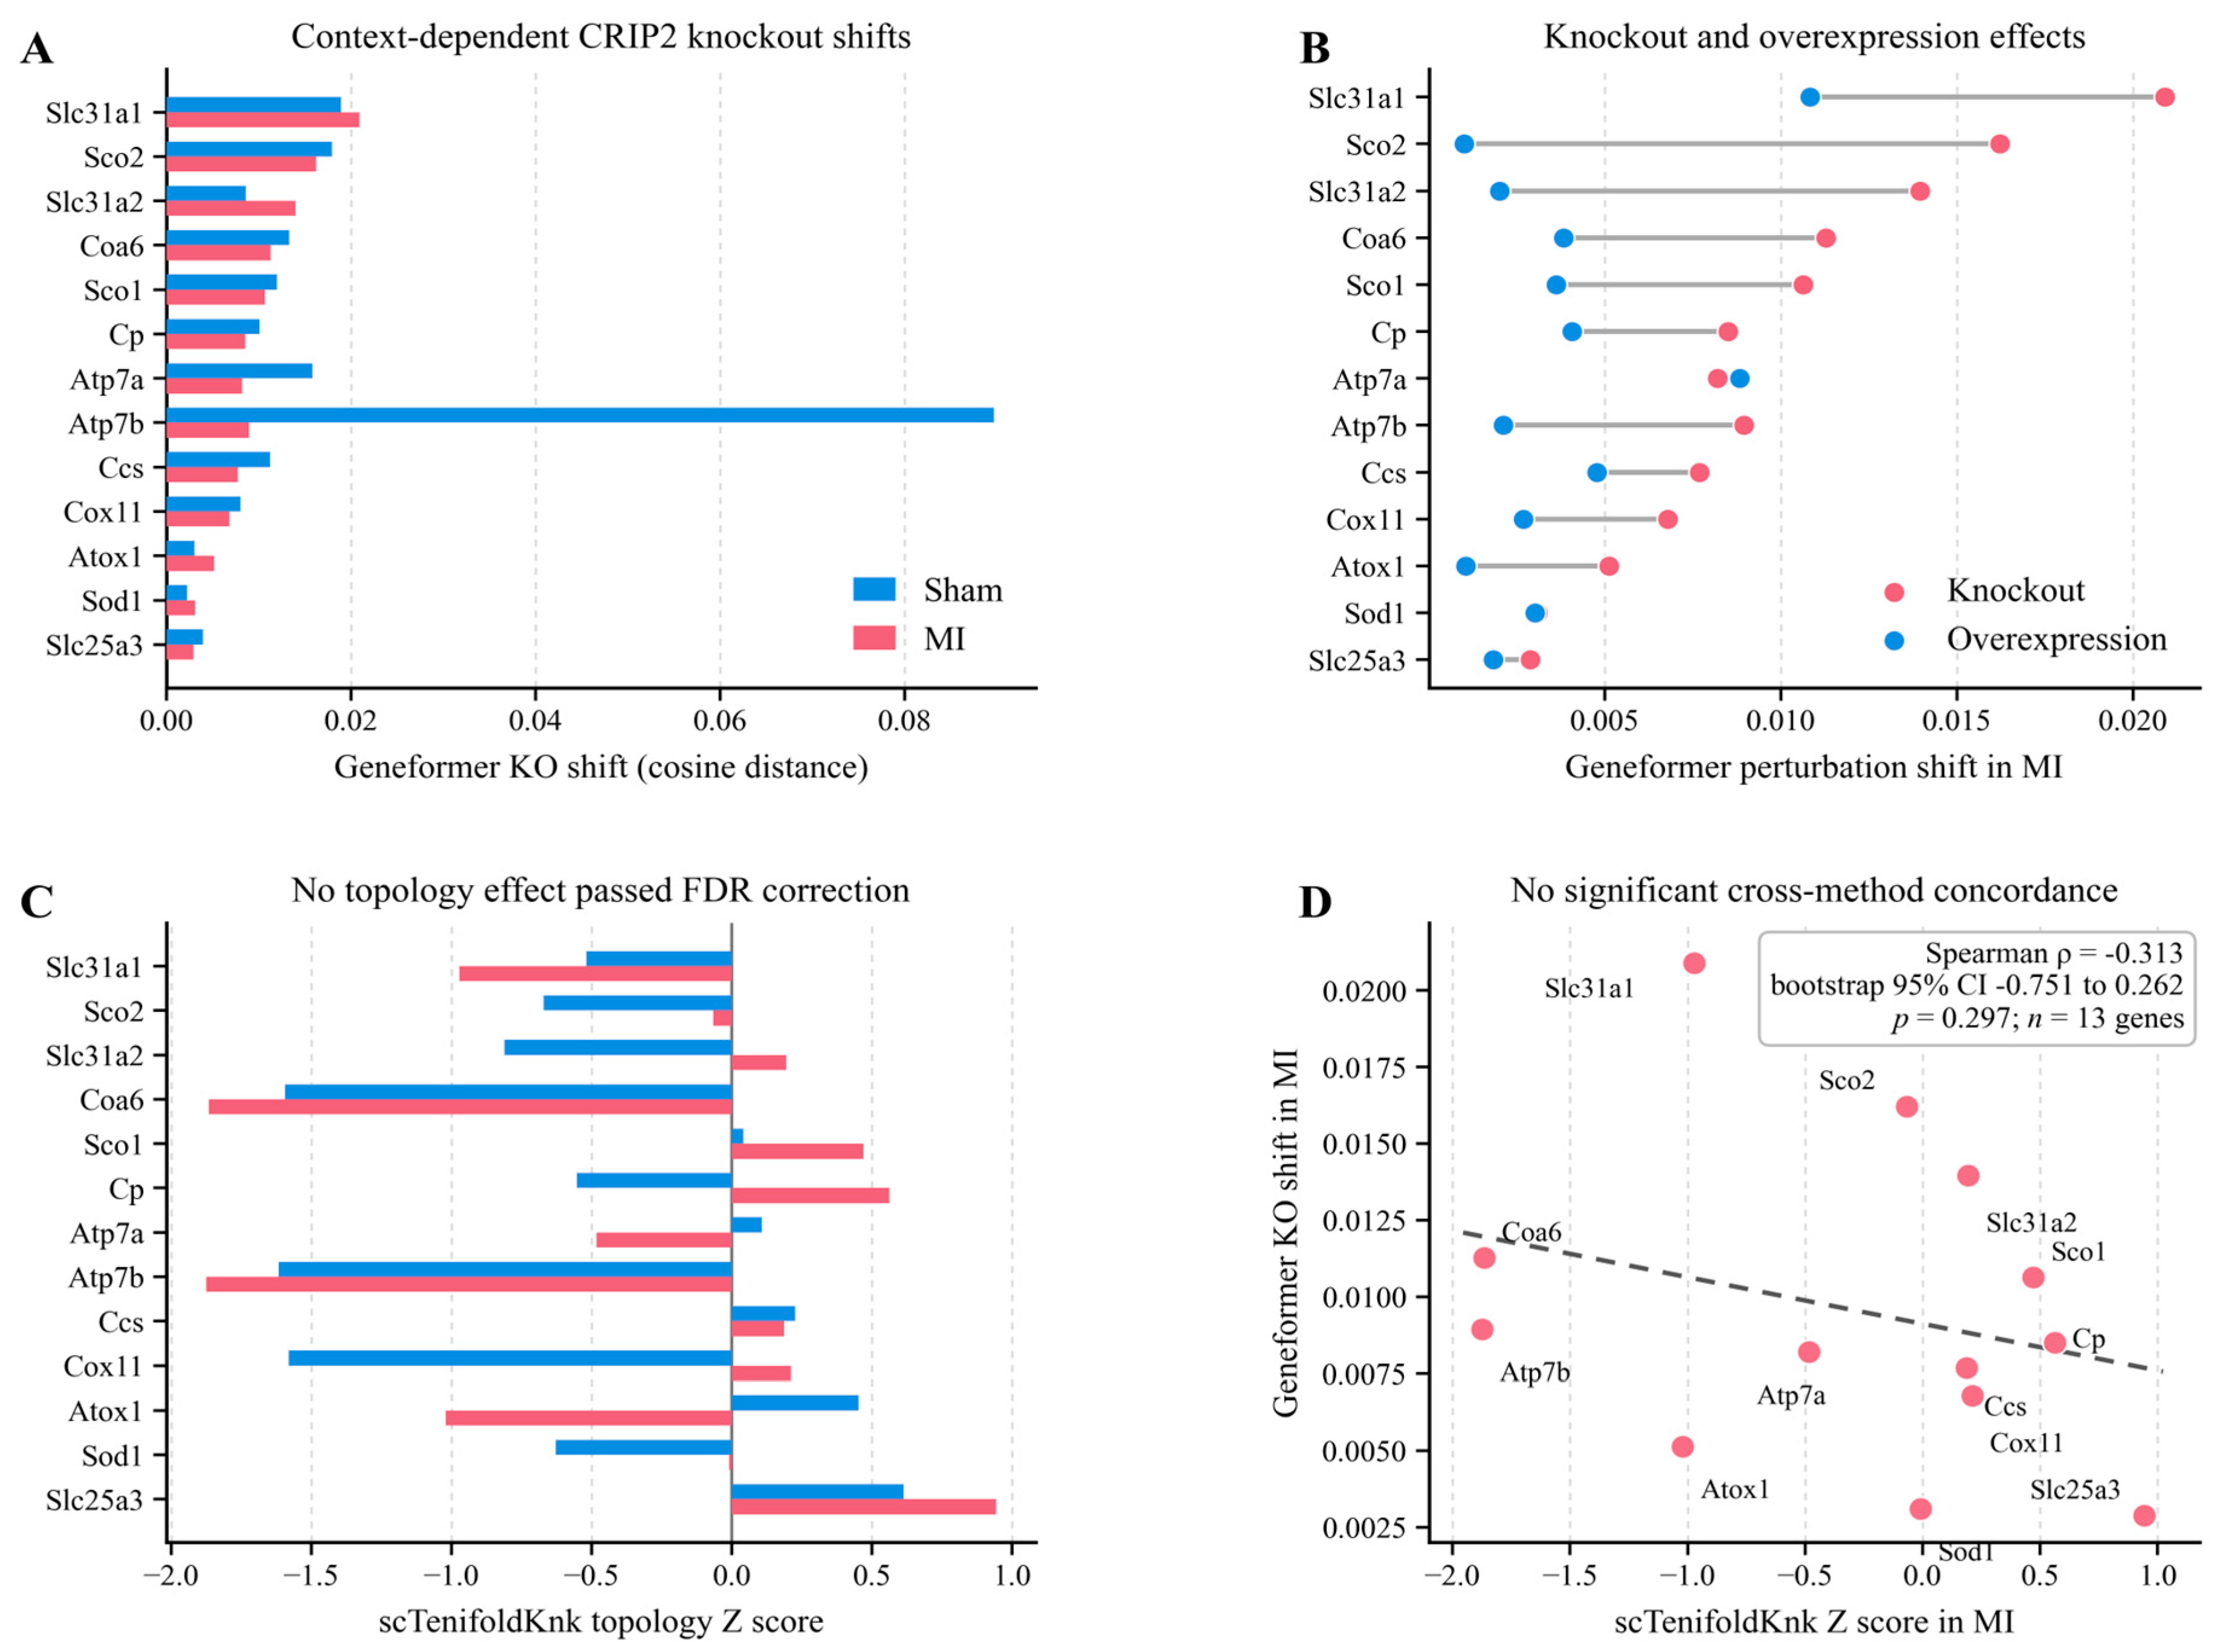
Virtual CRIP2 knockout and overexpression were modeled in MI and sham single-cell contexts, with downstream changes summarized across 13 copper-handling and mitochondrial respiratory genes (Figure 3A,B). Geneformer embedding shifts differed by gene and condition; knockout shifts were often, but not consistently, larger than overexpression shifts. scTenifoldKnk yielded descriptive topology Z-scores, but no gene-level effect remained significant after adjustment (Figure 3C). The Geneformer and scTenifoldKnk outputs were not significantly correlated (Spearman rho = −0.313, 95% bootstrap confidence interval −0.751 to 0.262, p = 0.297; n = 13; Figure 3D). The models therefore generated distinct exploratory signals, rather than convergent evidence of network disruption.

2.4. Selected Transcripts Change After CRIP2 Perturbation in H9c2 Cells

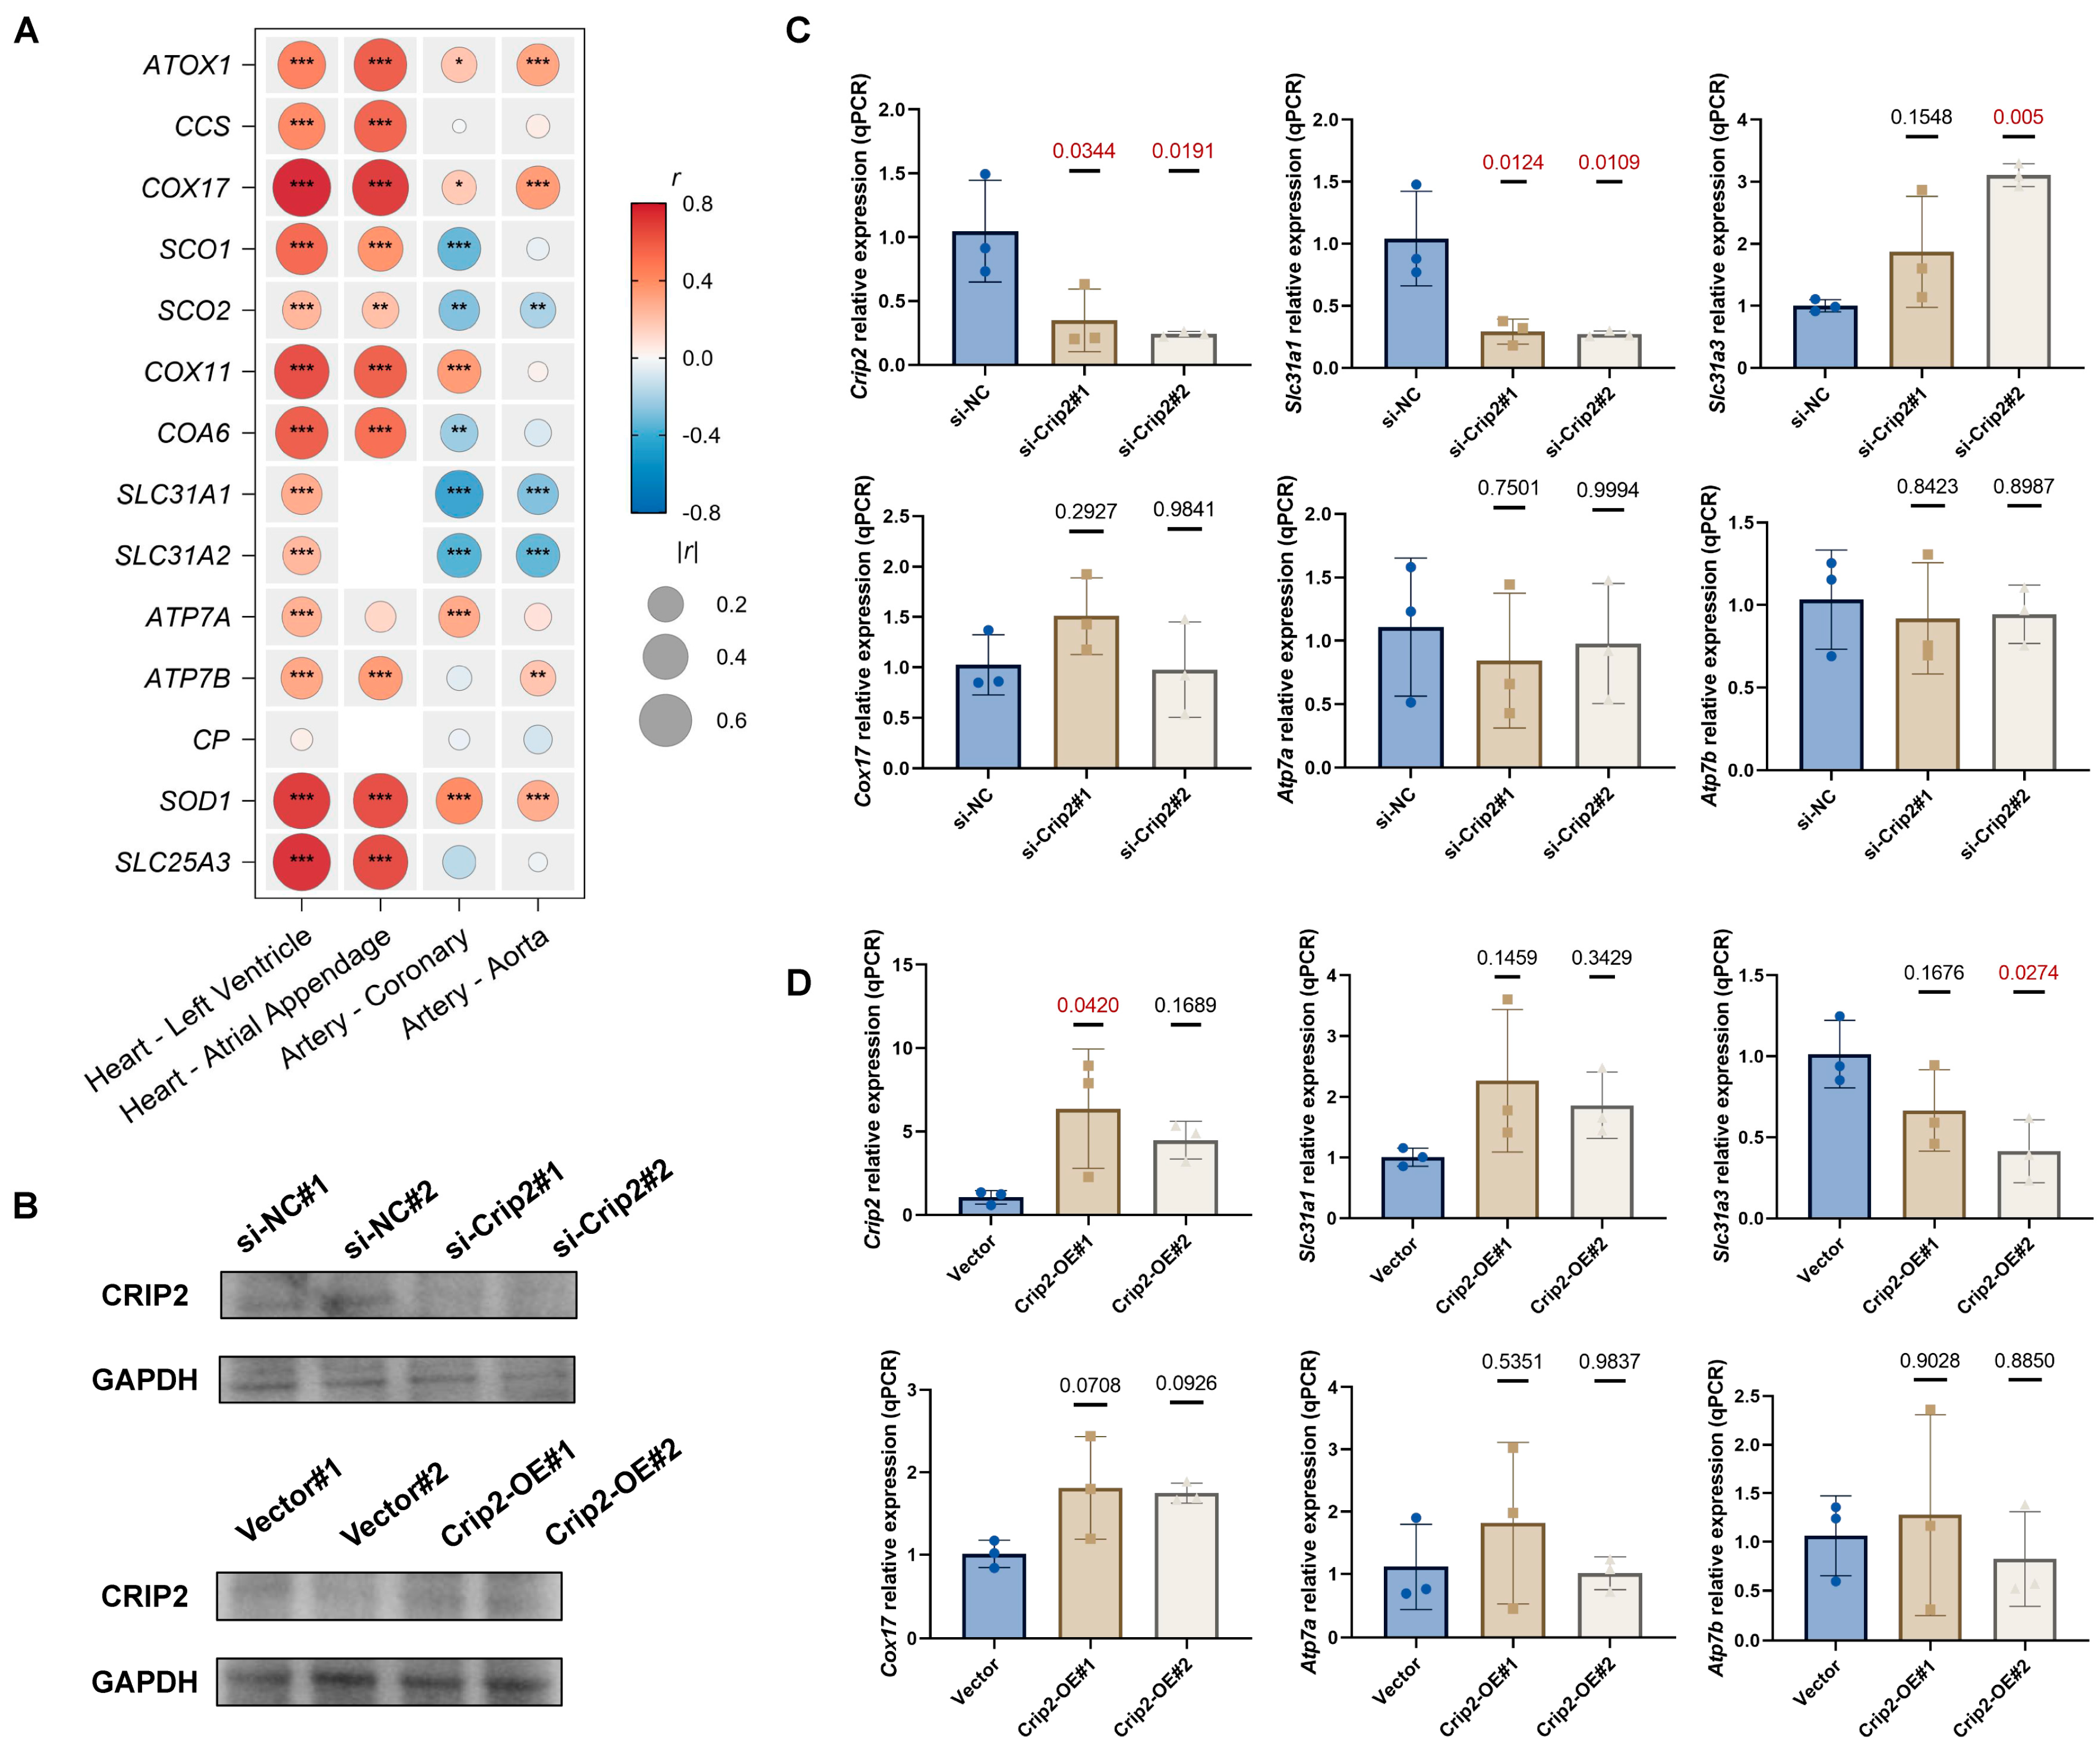
Across GTEx cardiovascular tissues, CRIP2 expression correlated with several copper-handling genes (Figure 4A). In the focused left-ventricle panel, 13 of 14 correlations remained significant after Benjamini–Hochberg adjustment; ceruloplasmin was the exception (Spearman r = 0.039; adjusted p = 0.580). Western blotting confirmed CRIP2 knockdown with two siRNAs and overexpression with two plasmids in H9c2 cells (Figure 4B, Figures S3 and S4). Crip2 knockdown was accompanied by lower Slc31a1 and higher Slc25a3, while Cox17, Atp7a, and Atp7b changed little or not significantly (Figure 4C). After overexpression, Slc25a3 was lower with CRIP2-OE#2, but not consistently across both constructs (Figure 4D). These transcript-level associations do not establish intracellular copper changes, mitochondrial copper delivery, cuproptosis, or direct transcriptional regulation.

2.5. CRIP2 Overexpression Is Associated with Higher Metabolic Activity During Hypoxia/Reoxygenation

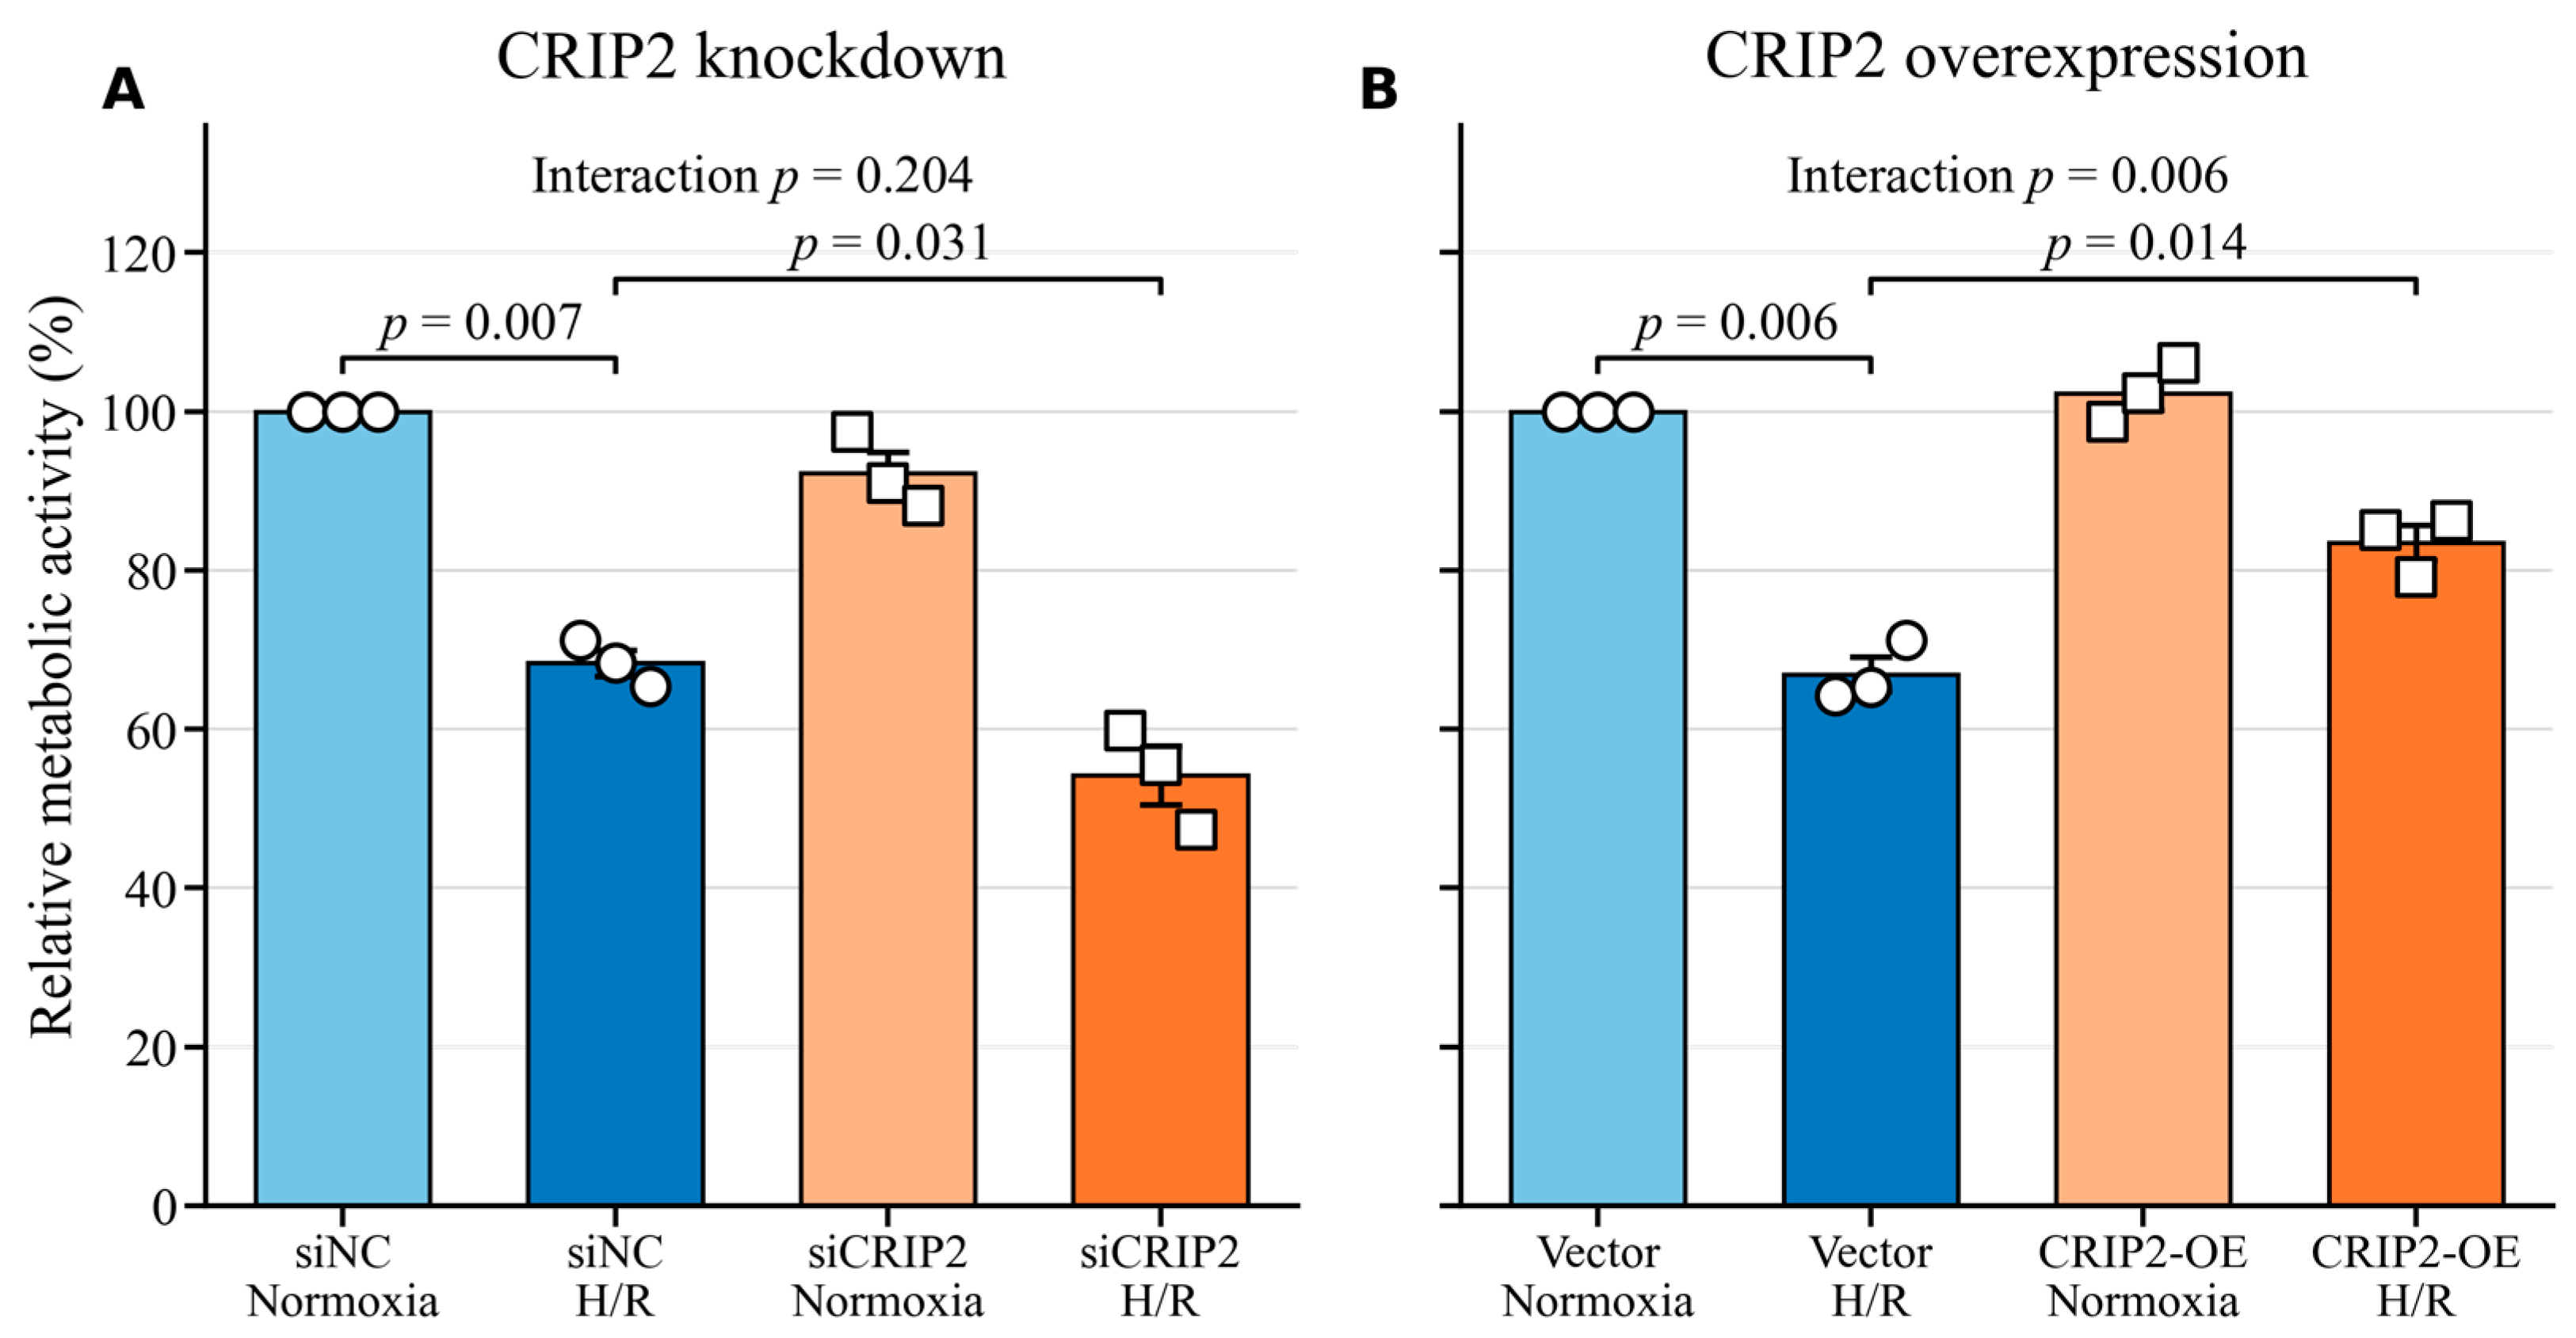
All 24 condition-by-experiment technical-replicate groups had coefficients of variation of 10% or less, and all raw wells were retained. H/R lowered relative metabolic activity in both control groups (siNC: 68.3 ± 1.7% versus 100.0%, p = 0.0070; vector: 66.9 ± 2.2% versus 100.0%, p = 0.0061; Figure 5). In the knockdown module, siCRIP2 values were 92.2 ± 2.7% under normoxia (p = 0.115 versus siNC) and 54.2 ± 3.7% under H/R (p = 0.031 versus siNC under H/R). Treatment and oxygen main effects were significant, but their interaction was not (p = 0.204); the data therefore do not show a knockdown-specific increase in H/R susceptibility. In the overexpression module, CRIP2-OE values were 102.3 ± 2.1% under normoxia (p = 0.380 versus vector) and 83.5 ± 2.2% under H/R (p = 0.014 versus vector under H/R). The treatment-by-oxygen interaction was significant (p = 0.00551), indicating an overexpression-associated difference in CCK-8 metabolic activity during H/R.

2.6. H/R qPCR Identifies an Atp7a Interaction That Remains Significant After Correction

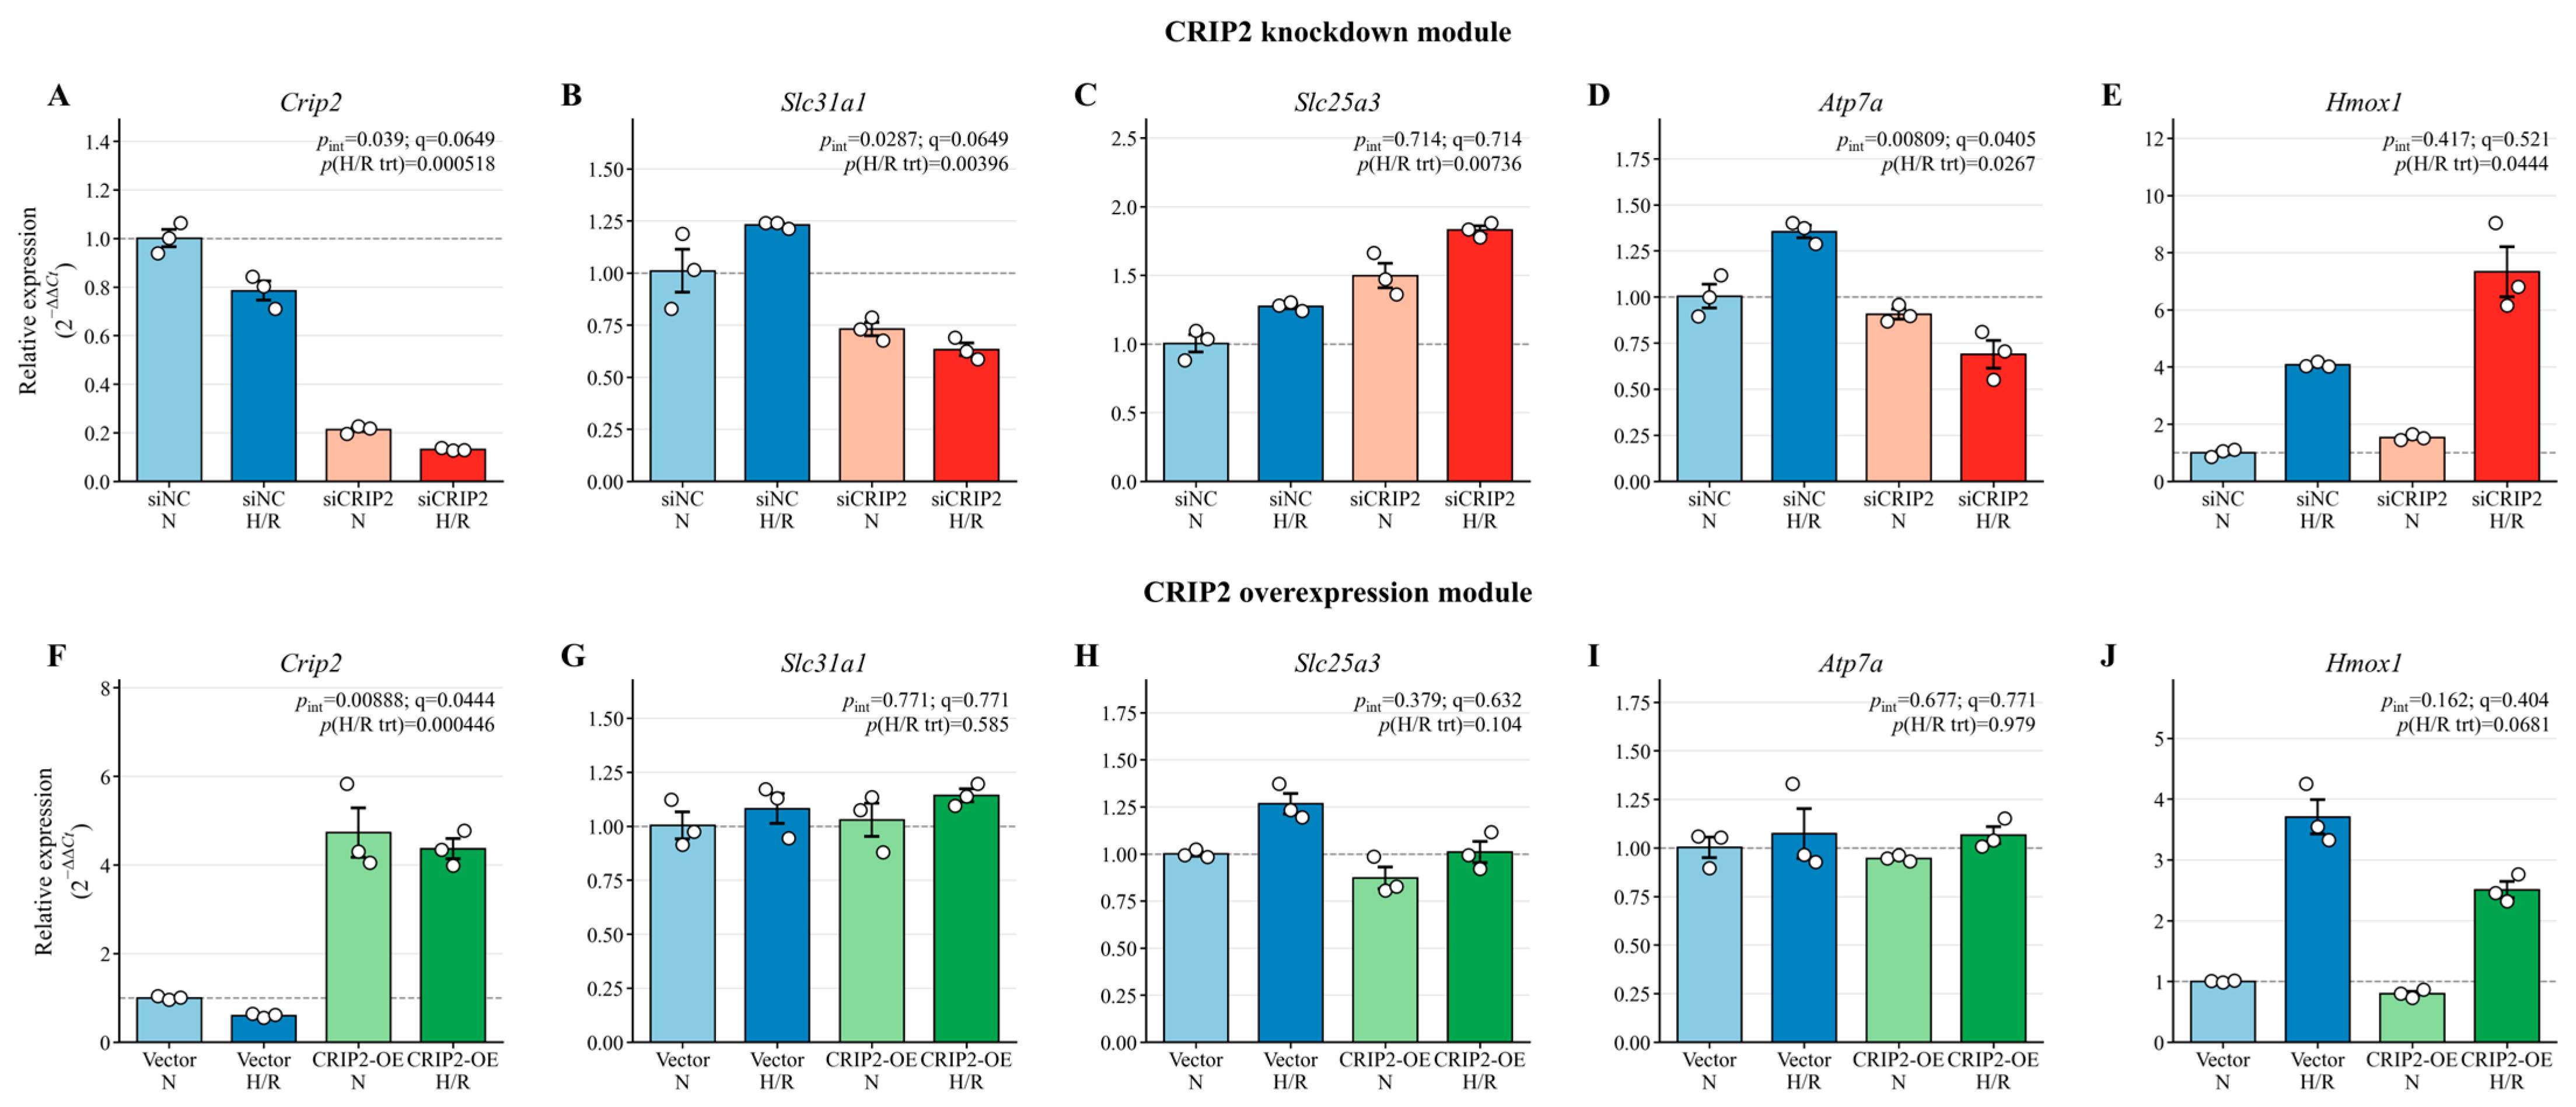
All 144 sample-by-gene technical triplicates had Ct standard deviations of 0.5 or less; no well was excluded. Gapdh Ct values showed no significant treatment, oxygen, or interaction effect. Crip2 expression confirmed knockdown (0.214-fold under normoxia; 0.131-fold under H/R) and overexpression (4.730-fold under normoxia; 4.368-fold under H/R; Figure 6). Under H/R, siCRIP2 cells had lower Slc31a1 (0.633-fold versus 1.231-fold in siNC; paired p = 0.00396) and Atp7a (0.689-fold versus 1.355-fold; p = 0.0267), and higher Slc25a3 (1.830-fold versus 1.275-fold; p = 0.00736) and Hmox1 (7.330-fold versus 4.078-fold; p = 0.0444). Only the Atp7a treatment-by-oxygen interaction survived Benjamini–Hochberg correction across the five targets (q = 0.0405); the Crip2 and Slc31a1 interactions were nominal, and the Slc25a3 and Hmox1 interactions were not significant. In the overexpression module, Slc31a1, Slc25a3, and Atp7a were not significantly different between CRIP2-OE and vector under H/R. Hmox1 was lower with CRIP2-OE (2.511-fold versus 3.709-fold), but the paired comparison (p = 0.0681) and interaction (q = 0.404) were not significant. The response was therefore gene- and context-specific, not a uniform normalization of the panel.

3. Discussion

The most reproducible observation was lower myocardial Crip2 after MI: it appeared in the local LAD-ligation cohort and in an independent bulk-tissue time course. The latter dataset also showed negative enrichment of a prespecified lipoylated-tricarboxylic-acid module. The broader copper-homeostasis set was not enriched, however, and no copper-dependent death endpoint was measured. The enrichment result therefore describes a transcriptional state compatible with reduced lipoylated-TCA activity, not cuproptosis itself. The MR estimate for CRIP2 was directionally consistent across sensitivity analyses and was based on strong instruments, but it remained nominal, relied mainly on trans-pQTLs, and was not supported by the single available cis-window candidate. We use it only to help prioritize CRIP2, not to infer causality.
CRIP2 had a reasonable biological basis for follow-up. Proteomic and biochemical work identified it as a nuclear copper-binding partner of ATOX1 and linked copper-dependent CRIP2 turnover to reactive oxygen species and autophagy [20]. Crip2 deletion in skeletal muscle cells was subsequently associated with copper accumulation and impaired differentiation [26]. Separately, vascular studies implicated CRIP2 in endothelial aggregation, migration, proliferation, and angiogenesis [19]. This literature connects CRIP2 to copper handling and cardiovascular cell biology, but it does not show that the same mechanism operates in infarcted myocardium.
Circulating copper has been studied as a systemic cardiovascular measure [18], and ceruloplasmin has also been evaluated in cardiovascular cohorts [27]. Our analyses addressed a different question: regional myocardial expression and cardiac cell-type localization. Blood measurements cannot identify the myocardial compartment from which a signal arises, while tissue data do not establish a useful circulating biomarker. Post-MI remodeling is spatially organized across inflammatory, fibrotic, vascular, and metabolic programs [28]. Because myocardial CRIP2, circulating CRIP2, copper, and ceruloplasmin were not measured in the same subjects, their relationship and comparative diagnostic value remain unknown.
The perturbation experiments provide a narrower signal than a copper-regulation claim. Slc31a1 encodes a high-affinity copper importer [29], and Slc25a3 contributes to mitochondrial copper delivery for cytochrome c oxidase assembly [30]. CRIP2 has reported transcriptional effects [31], and Crip2 deficiency alters cellular copper handling in skeletal muscle cells [26], so changes in these transcripts are biologically plausible. Even so, transcript abundance cannot reveal the direction or magnitude of copper flux. A model in which CRIP2 shifts copper uptake or mitochondrial allocation remains testable, but would require direct measurements of labile and mitochondrial copper, respiration, lipoylated-protein aggregation, iron–sulfur protein loss, and copper-dependent death [32]. Until those data exist, CRIP2 is a candidate for mechanistic study, rather than a validated copper regulator or therapeutic target [33].
The H/R qPCR data reinforce this restricted interpretation. Atp7a was the only copper-handling transcript with an interaction that remained significant after correction in the knockdown module. Lower Slc31a1 and higher Slc25a3 and Hmox1 under H/R were supported by descriptive pairwise comparisons, but their interactions did not survive correction. Overexpression did not significantly normalize Slc31a1, Slc25a3, or Atp7a, and the lower Hmox1 value under H/R was a non-significant trend. The pattern is consistent with context-dependent transcriptional responses, not coordinated pathway rescue.
CCK-8 added a limited functional phenotype. H/R reduced tetrazolium-reducing activity in both control modules. Knockdown was associated with lower activity, but the non-significant interaction does not support selective sensitization to H/R. Overexpression was associated with higher activity during H/R and a significant interaction. With three independent experiments, this is preliminary evidence of an overexpression-linked metabolic phenotype. It cannot distinguish cell number from metabolic state, identify a death pathway, or connect the phenotype to intracellular copper.
Current cardiovascular literature places cuproptosis within wider mitochondrial quality-control and metabolic-stress networks [34,35]. Our gene-set result fits that context, but the study did not measure lipoylated-protein aggregation, iron–sulfur protein loss, respiration, or copper-dependent cell death [32]. We therefore treat the proposed CRIP2–copper–cuproptosis link as a hypothesis, not as an observed pathway.
Any clinical implication remains speculative. The data do not support CRIP2 as a standalone biomarker or treatment target. A useful next step would be to determine whether myocardial or circulating CRIP2 adds information beyond infarct size, ventricular function, copper, and ceruloplasmin, and whether blood CRIP2 reflects myocardial expression. Such questions require prospective cohorts with paired blood and tissue measurements before CRIP2-directed stratification or intervention can be considered.
The evidence is constrained at several levels. Public and local datasets differ in platform, species, and processing. The MR screen used a suggestive threshold and mainly trans-pQTLs; no protein passed Bonferroni correction, the single cis-window candidate was null, and the available exposure data did not permit Steiger testing or colocalization. The local animal comparison included five mice per group, limiting precision. Two nominal MI single-cell matrices were byte-identical, leaving three sham and two unique MI hearts for pseudobulk sensitivity analysis; the atlas therefore supports localization, not replicated condition-level inference. Geneformer and scTenifoldKnk were exploratory, were not significantly concordant, and no topology effect remained significant after adjustment. H9c2 cardiomyoblasts also have limited resemblance to adult cardiomyocytes [36].

4. Materials and Methods

4.1. Myocardial Datasets

We analyzed expression profiles from the infarcted myocardium (IM), peri-infarct zone (PZ), and non-infarcted myocardium (NI) using the mouse MI dataset GSE775 [37]. Sample inclusion followed the original annotations. The accession details and sample characteristics are summarized in Tables S1 and S2. Differentially expressed genes (DEGs) from these regional MI contrasts were intersected with DEGs identified in our in-house mouse MI RNA-seq cohort, generated after LAD coronary artery ligation.
For independent bulk-tissue validation, we reanalyzed GSE236374, comprising three sham, three MI day-7, and three MI day-28 adult male C57BL/6JR hearts [25]. Raw gene counts were converted to log2 counts per million for sample-level visualization. The archived DESeq2 MI day-7-versus-sham Wald statistics were used for gene-level inference. A prespecified seven-gene cuproptosis-permissive/lipoylated-tricarboxylic-acid core module (Fdx1, Lias, Lipt1, Dld, Dlat, Pdha1, and Pdhb), a 14-gene copper-homeostasis set, and three negative regulators were tested by preranked gene set enrichment analysis with 10,000 phenotype-independent gene-set permutations and a fixed random seed. Gene-wise z scores were averaged only for descriptive sample-level module plots; formal inference was based on DESeq2 and preranked enrichment statistics.
Tissue expression matrices were obtained from the Genotype-Tissue Expression (GTEx) project. Pairwise Spearman correlations between CRIP2 and curated copper-handling genes were computed across the left ventricle, atrial appendage, coronary artery, and aorta, and visualized as bubble heatmaps. For the focused left-ventricle 14-gene panel, p values were additionally adjusted by the Benjamini–Hochberg procedure. Mouse cardiac single-cell RNA-sequencing data (GSE214611; GEO metadata nominally listed three sham and three MI accessions) were processed using Seurat. Cells with fewer than 200 or more than 5000 detected genes, or with mitochondrial transcripts exceeding 15%, were excluded, yielding 96,288 cells (34,959 sham and 61,329 MI). Counts were normalized and log-transformed, highly variable genes were selected, and reciprocal principal-component analysis was used for integration. Principal-component analysis and Uniform Manifold Approximation and Projection used dimensions 1–30, with clustering resolution 0.5. Clusters were manually annotated using canonical markers for cardiomyocytes, fibroblasts, endothelial cells, macrophages, and smooth muscle cells/pericytes [38]. Before biological-replicate inference, the downloaded matrix, feature, and barcode files were compared by SHA-256 checksum. GSM6613074_snd7_1 and GSM6613075_snd7_2 were byte-identical for all three file types; consequently, unique-heart pseudobulk sensitivity analysis used three sham and two unique MI matrices, with exact two-sided permutation p values. Cell-level atlas summaries were retained only as descriptive localization evidence.

4.2. In Silico Perturbation and Network Vulnerability Analyses

Geneformer was used to model virtual CRIP2 knockout and overexpression in MI and sham single-cell contexts. For each CRIP2 perturbation, downstream shifts among curated copper-handling and mitochondrial respiratory genes were summarized by embedding cosine distance. Orthogonal topology analysis with scTenifoldKnk estimated CRIP2-knockout-derived network vulnerability Z-scores in the same contexts. Across 13 genes, the Spearman association between the Geneformer knockout embedding shift in MI and the scTenifoldKnk MI topology Z-score was used as an exploratory cross-method comparison; a two-sided p value and a percentile 95% confidence interval from 100,000 bootstrap resamples were reported. This analysis was not prespecified as evidence of mechanistic concordance.

4.3. Local LAD Coronary Ligation Model and Tissue Collection

Male mice were subjected to LAD coronary artery ligation under isoflurane anesthesia, to induce MI. The sham controls underwent the same surgical exposure without coronary ligation. Hearts were harvested four weeks after surgery, rinsed in cold buffer, and dissected for RNA extraction and qPCR validation. All animal experiments were conducted in accordance with institutional guidelines and approved by the Institutional Animal Care and Use Committee of Guangzhou Medical University (approval no. N2025-02004).

4.4. RNA Extraction, Library Preparation, and Bulk RNA-Seq

Total RNA was isolated, treated with DNase, and assessed for its integrity. Poly(A) libraries were sequenced on an Illumina platform (Illumina, Inc., San Diego, CA, USA) using paired-end reads. Adapters and low-quality bases were trimmed, reads were aligned to the appropriate reference genome using STAR, and gene-level counts were obtained using feature counts. Normalization was performed using the median-of-ratios method, and low-abundance genes were filtered prior to statistical testing (Table S3).

4.5. Differential Expression and Cross-Model Integration

DEGs were computed for IM versus NI and PZ versus NI in the regional MI dataset, and for LAD/MI versus sham in the in-house mouse RNA-seq cohort, using DESeq2 with Benjamini–Hochberg adjustment. To derive tissue-anchored candidates, MI regional DEGs were intersected with LAD/MI DEGs, retaining genes with consistent ischemic injury responsiveness across datasets. Functional enrichment was performed using Gene Ontology and Kyoto Encyclopedia of Genes and Genomes libraries using clusterProfiler. Enrichment outputs were displayed as Venn diagrams, forest plots, dot plots, bar plots, and related figure panels, as appropriate.

4.6. Protein QTL Instruments and MI Outcome GWAS for Mendelian Randomization

pQTL summary statistics were obtained from the deCODE study, which profiled 35,559 Icelandic participants using SomaScan and reported associations for approximately 4907 circulating proteins. Instruments were constructed for proteins encoded by the intersecting differentially expressed genes when independent pQTLs were available at the suggestive threshold (p < 5 × 10⁻⁶) [39]. These instruments were not restricted to cis-pQTLs; for CRIP2, most selected variants were trans-pQTLs. The analysis is therefore interpreted as protein-level genetic prioritization, rather than direct cis-protein causal evidence. MI outcome data were obtained from the IEU Open GWAS resource (ebi-a-GCST011364), corresponding to Hartiala et al. and comprising 14,825 MI cases and 380,970 controls of European ancestry [40].

4.7. Two-Sample Mendelian Randomization

Two-sample Mendelian randomization (MR) used pQTLs as instruments for circulating protein levels and MI as the outcome. Instruments were selected at p < 5 × 10⁻⁶, clumped at r2 < 0.001 within a 10,000 kb window, and harmonized by effect allele. The inverse-variance weighted (IVW) estimator was primary, with weighted-median and MR-Egger estimates as sensitivity analyses. Instrument strength was assessed using F statistics. Heterogeneity was quantified using Cochran’s Q; directional pleiotropy was evaluated using the MR-Egger intercept; and leave-one-out and MR-PRESSO global/outlier analyses assessed influential variants and horizontal pleiotropy. Nominal p < 0.05 was used for candidate prioritization. Because approximately 32 proteins were screened, p < 0.00156 was additionally considered a Bonferroni sensitivity threshold; no candidate met this corrected threshold. For CRIP2, we also repeated IVW analysis at the conventional exposure threshold p < 5 × 10⁻⁸, and evaluated the only available ±1 Mb cis-window candidate by a Wald ratio. Formal Steiger directionality testing could not be estimated because exposure-effect allele frequencies and exposure sample size were unavailable; full cis-window summary statistics were also unavailable for colocalization. Analyses were implemented in R using TwoSampleMR and MR-PRESSO, and the instrument lists, harmonization logs, and MR outputs are provided in Table S4.

4.8. Cell Culture and Treatments

H9c2 cardiomyoblasts were maintained in high-glucose Dulbecco’s modified Eagle medium (DMEM) supplemented with 10% fetal bovine serum and antibiotics at 37 degrees C in 5% CO2. Cells were transfected under matched culture conditions for CRIP2 knockdown or overexpression experiments, with non-targeting small interfering RNA (siRNA) or empty vector controls run in parallel.

4.9. CRIP2 Perturbations

For loss of function, two independent non-overlapping small interfering RNAs (siRNAs) targeting Crip2 and a non-targeting control siRNA were transfected with a lipid-based reagent at standard working concentrations. For gain of function, two CRIP2 expression plasmids and empty-vector controls were transfected under matched conditions. Knockdown and overexpression efficiencies were verified by Western blotting and qPCR. Exact siRNA sequences and plasmid details are listed in Table S5.

4.10. Quantitative PCR

RNA was reverse-transcribed and quantified using SYBR Green qPCR. Glyceraldehyde-3-phosphate dehydrogenase (Gapdh) served as the internal reference. For in vivo validation, Crip2, Ccdc80, and Glipr2 were quantified in LAD and sham hearts. For the baseline H9c2 perturbation experiments, Crip2 and copper-handling genes, including Slc31a1, Slc25a3, Cox17, Atp7a, and Atp7b, were quantified. For the H/R experiments, Crip2, Slc31a1, Slc25a3, Atp7a, and Hmox1 were measured in the two parallel knockdown and overexpression modules. Each biological sample was measured in three technical wells; the technical Ct values were averaged before biological-level analysis. ΔCt was calculated as Ct(target) − Ct(Gapdh), and relative expression was calculated using the 2−ΔΔCt method with the corresponding module-specific normoxic control mean as calibrator. Primer sequences and species are detailed in Table S6A,B.

4.11. Western Blotting

Cells were lysed in radioimmunoprecipitation assay (RIPA) buffer supplemented with protease and phosphatase inhibitors. Equal protein amounts were separated by sodium dodecyl sulfate–polyacrylamide gel electrophoresis (SDS-PAGE) and transferred to polyvinylidene difluoride (PVDF) membranes. Membranes were blocked and incubated with primary antibodies against CRIP2 and GAPDH, followed by horseradish peroxidase (HRP)-conjugated secondary antibodies and chemiluminescence detection. Representative blots were used to confirm the knockdown and overexpression efficiency in H9c2 cells. GAPDH served as the loading control.

4.12. Hypoxia/Reoxygenation and CCK-8 Assay

H9c2 cells were evaluated in two parallel 2 × 2 modules: siNC or siCRIP2 under normoxia or H/R, and empty vector or CRIP2 overexpression (CRIP2-OE) under normoxia or H/R. Cells were seeded at 5000 cells per well in 96-well plates (100 μL per well). Approximately 24 h after transfection, H/R plates were exposed to 1% O2 for 12 h followed by 6 h of reoxygenation under normoxia; paired control plates remained under normoxia for the same 18 h interval. Cell Counting Kit-8 reagent (Beyotime Biotechnology, Shanghai, China, catalog no. S1075S; 10 μL per well) was then added, and absorbance at 450 nm was measured after 2 h at 37 °C. Each condition contained three technical wells, and the complete experiment was performed in three independent biological replicates. Cell-free wells containing medium and CCK-8 served as plate-specific blanks. The mean blank absorbance was subtracted from each well, technical wells were averaged, and values were normalized within each experiment to the corresponding module-specific normoxic control. The CCK-8 readout was interpreted as relative tetrazolium-reducing metabolic activity/viability, rather than as a direct measure of cell death.

4.13. Statistical Analysis

Data are presented as mean ± standard error of the mean (SEM) for animal qPCR validation and as mean ± standard deviation (SD) for cell culture qPCR experiments, as indicated in the figure legends. Two-group comparisons were performed using two-tailed unpaired Student’s t-test. Multiple-group comparisons were performed using one-way analysis of variance (ANOVA) followed by Tukey’s or Dunnett’s post hoc test, as appropriate. Exact p values are shown in the figures, and statistical significance was set at p < 0.05. For CCK-8 analysis, the knockdown and overexpression modules were evaluated separately. Blank-corrected technical wells were averaged to yield one value per condition in each independent experiment. A blocked two-factor linear model included CRIP2 treatment, oxygen condition, their interaction, and an experimental batch as a block. Prespecified within-batch comparisons were assessed using two-sided paired t-tests on blank-corrected mean OD450 values and treated as descriptive, without multiplicity adjustment. Relative values were used for visualization, and technical wells were not treated as independent biological replicates. For the H/R qPCR analysis, knockdown and overexpression modules were analyzed separately. Inferential tests were performed on ΔCt values using a blocked two-factor linear model containing CRIP2 treatment, oxygen condition, their interaction, and a biological batch as a block. Interaction p values were adjusted by the Benjamini–Hochberg procedure across the five target genes within each module. Prespecified within-batch comparisons were assessed using two-sided paired t-tests on ΔCt values and are reported descriptively, without multiplicity adjustment. Relative 2−ΔΔCt values were used for visualization, and technical wells were not treated as independent replicates.

5. Conclusions

CRIP2 emerged as a reproducible tissue-derived candidate associated with myocardial copper-handling responses after MI. H/R experiments identified one adjusted-significant Atp7a interaction after knockdown and an overexpression-associated CCK-8 phenotype, but did not establish altered copper flux, cuproptosis, or myocardial remodeling. Direct copper and mitochondrial measurements, orthogonal cell-death assays, adult or human cardiomyocyte models, and myocardium-specific in vivo perturbation are needed to test the proposed mechanism.

Supplementary Materials

The following supporting information can be downloaded at: https://www.mdpi.com/article/10.3390/cimb48080767/s1.

Author Contributions

Conceptualization, Z.Q. and X.Z.; methodology, Z.Q. and X.Z.; formal analysis, Z.Q.; investigation, Z.Q.; data curation, Z.Q.; visualization, Z.Q. and X.L.; writing—original draft preparation, Z.Q.; writing—review and editing, X.L. and X.Z.; supervision, X.Z. All authors have read and agreed to the published version of the manuscript.

Funding

This study was financially supported by Guangdong Key Clinical Specialty (Clinical Medical Research Institute), and Guangzhou Science and Technology Program City-University-Enterprise Jointly Funded Project (Grant No. 2024A03J0296, 13 March 2025).

Institutional Review Board Statement

The animal study protocol was approved by the Institutional Animal Care and Use Committee of Guangzhou Medical University (approval no. N2025-02004, 13 March 2025).

Informed Consent Statement

Not applicable.

Data Availability Statement

The data supporting the findings of this study are available from the corresponding author upon reasonable request.

Conflicts of Interest

The authors declare no conflicts of interest.

Abbreviations

The following abbreviations are used in this manuscript:
ATOX1Antioxidant 1 Copper Chaperone
CMCardiomyocytes
CRIP2/Crip2Cysteine-rich intestinal protein 2
CCDC80Coiled-coil domain containing 80
CCK-8Cell Counting Kit-8
COX17Cytochrome c oxidase copper chaperone COX17
DALYsDisability-adjusted life years
DEG(s)Differentially expressed gene(s)
ECEndothelial cells
FBFibroblasts
GAPDHGlyceraldehyde-3-phosphate dehydrogenase
GLIPR2GLI pathogenesis-related 2
GTExGenotype-Tissue Expression
H/RHypoxia/reoxygenation
GWASGenome-wide association study
H9c2Rat embryonic cardiomyoblast cell line
IHDIschemic heart disease
IMInfarcted myocardium
KOKnockout
LADLeft anterior descending (coronary artery)
MacMacrophages
MIMyocardial infarction
MRMendelian randomization
NINon-infarcted myocardium
OEOverexpression
pQTLProtein quantitative trait locus
PZPeri-infarct zone
qPCRQuantitative polymerase chain reaction
ROSReactive oxygen species
scRNA-seqSingle-cell RNA sequencing
SLC25A3/Slc25a3Solute carrier family 25 member 3
SLC31A1/Slc31a1Solute carrier family 31 member 1
SMC/PericyteSmooth muscle cells/Pericytes
SOD1Superoxide dismutase 1
UMAPUniform Manifold Approximation and Projection
ANOVAAnalysis of variance
CIConfidence interval
DMEMDulbecco’s modified Eagle medium
HRPHorseradish peroxidase
IVWInverse-variance weighted
MR-PRESSOMendelian Randomization Pleiotropy RESidual Sum and Outlier
PVDFPolyvinylidene difluoride
SDStandard deviation
SDS-PAGESodium dodecyl sulfate–polyacrylamide gel electrophoresis
SEMStandard error of the mean
siRNASmall interfering RNA
BHBenjamini–Hochberg
GSEAGene set enrichment analysis
TCATricarboxylic acid

References

  1. Mensah, G.A.; Fuster, V.; Murray, C.J.L.; Roth, G.A. Global Burden of Cardiovascular Diseases and Risks, 1990–2022. J. Am. Coll. Cardiol. 2023, 82, 2350–2473. [Google Scholar] [CrossRef] [Scilit] [PubMed]
  2. Danchin, N. Improved long-term survival after acute myocardial infarction: The success of comprehensive care from the acute stage to the long term. Eur. Heart J. 2023, 44, 499–501. [Google Scholar] [CrossRef] [Scilit] [PubMed]
  3. Christensen, D.M.; Schjerning, A.M.; Smedegaard, L.; Charlot, M.G.; Ravn, P.B.; Ruwald, A.C.; Fosbøl, E.; Køber, L.; Torp-Pedersen, C.; Schou, M.; et al. Long-term mortality, cardiovascular events, and bleeding in stable patients 1 year after myocardial infarction: A Danish nationwide study. Eur. Heart J. 2023, 44, 488–498. [Google Scholar] [CrossRef] [Scilit] [PubMed]
  4. Hall, M.; Smith, L.; Wu, J.; Hayward, C.; Batty, J.A.; Lambert, P.C.; Hemingway, H.; Gale, C.P. Health outcomes after myocardial infarction: A population study of 56 million people in England. PLoS Med. 2024, 21, e1004343. [Google Scholar] [CrossRef] [Scilit] [PubMed]
  5. Christensen, D.M.; Strange, J.E.; El-Chouli, M.; Falkentoft, A.C.; Malmborg, M.; Nouhravesh, N.; Gislason, G.; Schou, M.; Torp-Pedersen, C.; Sehested, T.S.G. Temporal Trends in Noncardiovascular Morbidity and Mortality Following Acute Myocardial Infarction. J. Am. Coll. Cardiol. 2023, 82, 971–981. [Google Scholar] [CrossRef] [Scilit] [PubMed]
  6. Liu, T.; Hao, Y.; Zhang, Z.; Zhou, H.; Peng, S.; Zhang, D.; Li, K.; Chen, Y.; Chen, M. Advanced Cardiac Patches for the Treatment of Myocardial Infarction. Circulation 2024, 149, 2002–2020. [Google Scholar] [CrossRef] [Scilit] [PubMed]
  7. Hilgendorf, I.; Frantz, S.; Frangogiannis, N.G. Repair of the Infarcted Heart: Cellular Effectors, Molecular Mechanisms and Therapeutic Opportunities. Circ. Res. 2024, 134, 1718–1751. [Google Scholar] [CrossRef] [Scilit] [PubMed]
  8. Kamal, N.H.; Heikal, L.A.; Abdallah, O.Y. The future of cardiac repair: A review on cell-free nanotherapies for regenerative myocardial infarction. Drug Deliv. Transl. Res. 2025, 15, 2253–2271. [Google Scholar] [CrossRef] [Scilit] [PubMed]
  9. Hunkler, H.J.; Groß, S.; Thum, T.; Bär, C. Non-coding RNAs: Key regulators of reprogramming, pluripotency, and cardiac cell specification with therapeutic perspective for heart regeneration. Cardiovasc. Res. 2022, 118, 3071–3084. [Google Scholar] [CrossRef] [Scilit] [PubMed]
  10. Wang, X.; Mu, X.; Li, X.; Yang, C.; Cai, Y.; Liu, C.; Liu, Z.; He, Z. Construction of a deep learning model and identification of the pivotal characteristics of FGF7- and MGST1- positive fibroblasts in heart failure post-myocardial infarction. Int. J. Biol. Macromol. 2025, 310, 143171. [Google Scholar] [CrossRef] [Scilit] [PubMed]
  11. Parsanathan, R. Copper’s dual role: Unravelling the link between copper homeostasis, cuproptosis, and cardiovascular diseases. Hypertens. Res. 2024, 47, 1440–1442. [Google Scholar] [CrossRef] [Scilit] [PubMed]
  12. Garza, N.M.; Swaminathan, A.B.; Maremanda, K.P.; Zulkifli, M.; Gohil, V.M. Mitochondrial copper in human genetic disorders. Trends Endocrinol. Metab. 2023, 34, 21–33. [Google Scholar] [CrossRef] [Scilit] [PubMed]
  13. Tian, Z.; Jiang, S.; Zhou, J.; Zhang, W. Copper homeostasis and cuproptosis in mitochondria. Life Sci. 2023, 334, 122223. [Google Scholar] [CrossRef] [Scilit] [PubMed]
  14. Chen, L.; Min, J.; Wang, F. Copper homeostasis and cuproptosis in health and disease. Signal Transduct. Target. Ther. 2022, 7, 378. [Google Scholar] [CrossRef] [Scilit] [PubMed]
  15. Pan, M.; Cheng, Z.W.; Huang, C.G.; Ye, Z.Q.; Sun, L.J.; Chen, H.; Fu, B.B.; Zhou, K.; Fang, Z.R.; Wang, Z.J.; et al. Long-term exposure to copper induces mitochondria-mediated apoptosis in mouse hearts. Ecotoxicol. Environ. Saf. 2022, 234, 113329. [Google Scholar] [CrossRef] [Scilit] [PubMed]
  16. Kong, B.; Zheng, X.; Hu, Y.; Zhao, Y.; Hai, J.; Ti, Y.; Bu, P. Sirtuin3 attenuates pressure overload-induced pathological myocardial remodeling by inhibiting cardiomyocyte cuproptosis. Pharmacol. Res. 2025, 216, 107739. [Google Scholar] [CrossRef] [Scilit] [PubMed]
  17. Chen, X.; Cai, Q.; Liang, R.; Zhang, D.; Liu, X.; Zhang, M.; Xiong, Y.; Xu, M.; Liu, Q.; Li, P.; et al. Copper homeostasis and copper-induced cell death in the pathogenesis of cardiovascular disease and therapeutic strategies. Cell Death Dis. 2023, 14, 105. [Google Scholar] [CrossRef] [Scilit] [PubMed]
  18. Liu, Y.; Miao, J. An Emerging Role of Defective Copper Metabolism in Heart Disease. Nutrients 2022, 14, 700. [Google Scholar] [CrossRef] [Scilit] [PubMed]
  19. Yang, S.; Zhang, X.; Li, X.; Li, H. Crip2 affects vascular development by fine-tuning endothelial cell aggregation and proliferation. Cell. Mol. Life Sci. 2025, 82, 110. [Google Scholar] [CrossRef] [Scilit] [PubMed]
  20. Chen, L.; Li, N.; Zhang, M.; Sun, M.; Bian, J.; Yang, B.; Li, Z.; Wang, J.; Li, F.; Shi, X.; et al. APEX2-based Proximity Labeling of Atox1 Identifies CRIP2 as a Nuclear Copper-binding Protein that Regulates Autophagy Activation. Angew. Chem. (Int. Ed. Engl.) 2021, 60, 25346–25355. [Google Scholar] [CrossRef] [Scilit] [PubMed]
  21. Yao, C.; Chen, G.; Song, C.; Keefe, J.; Mendelson, M.; Huan, T.; Sun, B.B.; Laser, A.; Maranville, J.C.; Wu, H.; et al. Genome-wide mapping of plasma protein QTLs identifies putatively causal genes and pathways for cardiovascular disease. Nat. Commun. 2018, 9, 3268, Correction in Nat. Commun. 2018, 9, 3853. [Google Scholar] [CrossRef] [Scilit] [PubMed]
  22. Farbehi, N.; Patrick, R.; Dorison, A.; Xaymardan, M.; Janbandhu, V.; Wystub-Lis, K.; Ho, J.W.; Nordon, R.E.; Harvey, R.P. Single-cell expression profiling reveals dynamic flux of cardiac stromal, vascular and immune cells in health and injury. eLife 2019, 8, e43882. [Google Scholar] [CrossRef] [Scilit] [PubMed]
  23. Hao, M.; Gong, J.; Zeng, X.; Liu, C.; Guo, Y.; Cheng, X.; Wang, T.; Ma, J.; Zhang, X.; Song, L. Large-scale foundation model on single-cell transcriptomics. Nat. Methods 2024, 21, 1481–1491. [Google Scholar] [CrossRef] [Scilit] [PubMed]
  24. Osorio, D.; Zhong, Y.; Li, G.; Xu, Q.; Yang, Y.; Tian, Y.; Chapkin, R.S.; Huang, J.Z.; Cai, J.J. scTenifoldKnk: An efficient virtual knockout tool for gene function predictions via single-cell gene regulatory network perturbation. Patterns 2022, 3, 100434. [Google Scholar] [CrossRef] [Scilit] [PubMed]
  25. Yu, P.; Song, S.; Zhang, X.; Cui, S.; Wei, G.; Huang, Z.; Zeng, L.; Ni, T.; Sun, A. Downregulation of apoptotic repressor AVEN exacerbates cardiac injury after myocardial infarction. Proc. Natl. Acad. Sci. USA 2023, 120, e2302482120. [Google Scholar] [CrossRef] [Scilit] [PubMed]
  26. Verdejo-Torres, O.; Klein, D.C.; Novoa-Aponte, L.; Carrazco-Carrillo, J.; Bonilla-Pinto, D.; Rivera, A.; Bakhshian, A.; Fitisemanu, F.M.; Jiménez-González, M.L.; Flinn, L.; et al. Cysteine Rich Intestinal Protein 2 is a copper-responsive regulator of skeletal muscle differentiation and metal homeostasis. PLoS Genet. 2024, 20, e1011495. [Google Scholar] [CrossRef] [Scilit] [PubMed]
  27. Smyła-Gruca, W.; Szczurek-Wasilewicz, W.; Skrzypek, M.; Karmański, A.; Romuk, E.; Jurkiewicz, M.; Gąsior, M.; Szyguła-Jurkiewicz, B. Ceruloplasmin, Catalase and Creatinine Concentrations Are Independently Associated with All-Cause Mortality in Patients with Advanced Heart Failure. Biomedicines 2024, 12, 662. [Google Scholar] [CrossRef] [Scilit] [PubMed]
  28. Yong, J.; Tao, J.; Wang, K.; Li, X.; Yang, Y. Post-myocardial Infarction Cardiac Remodeling: Multidimensional Mechanisms and Clinical Prospects of Stem Cell Therapy. Stem Cell Rev. Rep. 2025, 21, 1369–1427. [Google Scholar] [CrossRef] [Scilit] [PubMed]
  29. Huo, S.; Wang, Q.; Shi, W.; Peng, L.; Jiang, Y.; Zhu, M.; Guo, J.; Peng, D.; Wang, M.; Men, L.; et al. ATF3/SPI1/SLC31A1 Signaling Promotes Cuproptosis Induced by Advanced Glycosylation End Products in Diabetic Myocardial Injury. Int. J. Mol. Sci. 2023, 24, 1667. [Google Scholar] [CrossRef] [Scilit] [PubMed]
  30. Cobine, P.A.; Moore, S.A.; Leary, S.C. Getting out what you put in: Copper in mitochondria and its impacts on human disease. Biochim. Biophys. Acta (BBA)-Mol. Cell Res. 2021, 1868, 118867. [Google Scholar] [CrossRef] [Scilit] [PubMed]
  31. Cheung, A.K.; Ko, J.M.; Lung, H.L.; Chan, K.W.; Stanbridge, E.J.; Zabarovsky, E.; Tokino, T.; Kashima, L.; Suzuki, T.; Kwong, D.L.; et al. Cysteine-rich intestinal protein 2 (CRIP2) acts as a repressor of NF-kappaB-mediated proangiogenic cytokine transcription to suppress tumorigenesis and angiogenesis. Proc. Natl. Acad. Sci. USA 2011, 108, 8390–8395. [Google Scholar] [CrossRef] [Scilit] [PubMed]
  32. Tsvetkov, P.; Coy, S.; Petrova, B.; Dreishpoon, M.; Verma, A.; Abdusamad, M.; Rossen, J.; Joesch-Cohen, L.; Humeidi, R.; Spangler, R.D.; et al. Copper induces cell death by targeting lipoylated TCA cycle proteins. Science 2022, 375, 1254–1261, Erratum in Science 2022, 376, eabq4855. [Google Scholar] [CrossRef] [Scilit] [PubMed]
  33. Sharma, V.A.; Frishman, W.H. Copper Dysregulation and Cardiovascular Disease: A Review of Underlying Mechanisms and Therapeutic Targets. Cardiol. Rev. 2025; ahead of print. [CrossRef] [Scilit] [PubMed]
  34. Huang, X.; Wang, L.; Liu, H.; Lu, R.; Li, L. Cuproptosis and Its Impact on Cardiovascular Health: Mechanisms and Therapeutic Opportunities. Cardiovasc. Toxicol. 2026, 26, 21. [Google Scholar] [CrossRef] [Scilit] [PubMed]
  35. Li, M.; Zhang, Y.; Hu, Y.; Qin, Y.; Zheng, Y.; Lv, S.; Zhang, J. Mitochondrial homeostasis meets novel programmed cell death: Crosstalk mechanisms underlying cardiovascular diseases progression. Cell Commun. Signal. 2026, 24, 100. [Google Scholar] [CrossRef] [Scilit] [PubMed]
  36. Onódi, Z.; Visnovitz, T.; Kiss, B.; Hambalkó, S.; Koncz, A.; Ágg, B.; Váradi, B.; Tóth, V.É.; Nagy, R.N.; Gergely, T.G.; et al. Systematic transcriptomic and phenotypic characterization of human and murine cardiac myocyte cell lines and primary cardiomyocytes reveals serious limitations and low resemblances to adult cardiac phenotype. J. Mol. Cell. Cardiol. 2022, 165, 19–30. [Google Scholar] [CrossRef] [Scilit] [PubMed]
  37. Tarnavski, O.; McMullen, J.R.; Schinke, M.; Nie, Q.; Kong, S.; Izumo, S. Mouse cardiac surgery: Comprehensive techniques for the generation of mouse models of human diseases and their application for genomic studies. Physiol. Genom. 2004, 16, 349–360. [Google Scholar] [CrossRef] [Scilit] [PubMed]
  38. Gardner, R.S.; Tucker, N.R.; Amancherla, K. Leveraging Single-Cell Technologies to Advance Understanding of Myocardial Disease. Circ. Res. 2026, 138, e326002. [Google Scholar] [CrossRef] [Scilit] [PubMed]
  39. Ferkingstad, E.; Sulem, P.; Atlason, B.A.; Sveinbjornsson, G.; Magnusson, M.I.; Styrmisdottir, E.L.; Gunnarsdottir, K.; Helgason, A.; Oddsson, A.; Halldorsson, B.V.; et al. Large-scale integration of the plasma proteome with genetics and disease. Nat. Genet. 2021, 53, 1712–1721. [Google Scholar] [CrossRef] [Scilit] [PubMed]
  40. Hartiala, J.A.; Han, Y.; Jia, Q.; Hilser, J.R.; Huang, P.; Gukasyan, J.; Schwartzman, W.S.; Cai, Z.; Biswas, S.; Trégouët, D.A.; et al. Genome-wide analysis identifies novel susceptibility loci for myocardial infarction. Eur. Heart J. 2021, 42, 919–933. [Google Scholar] [CrossRef] [Scilit] [PubMed]
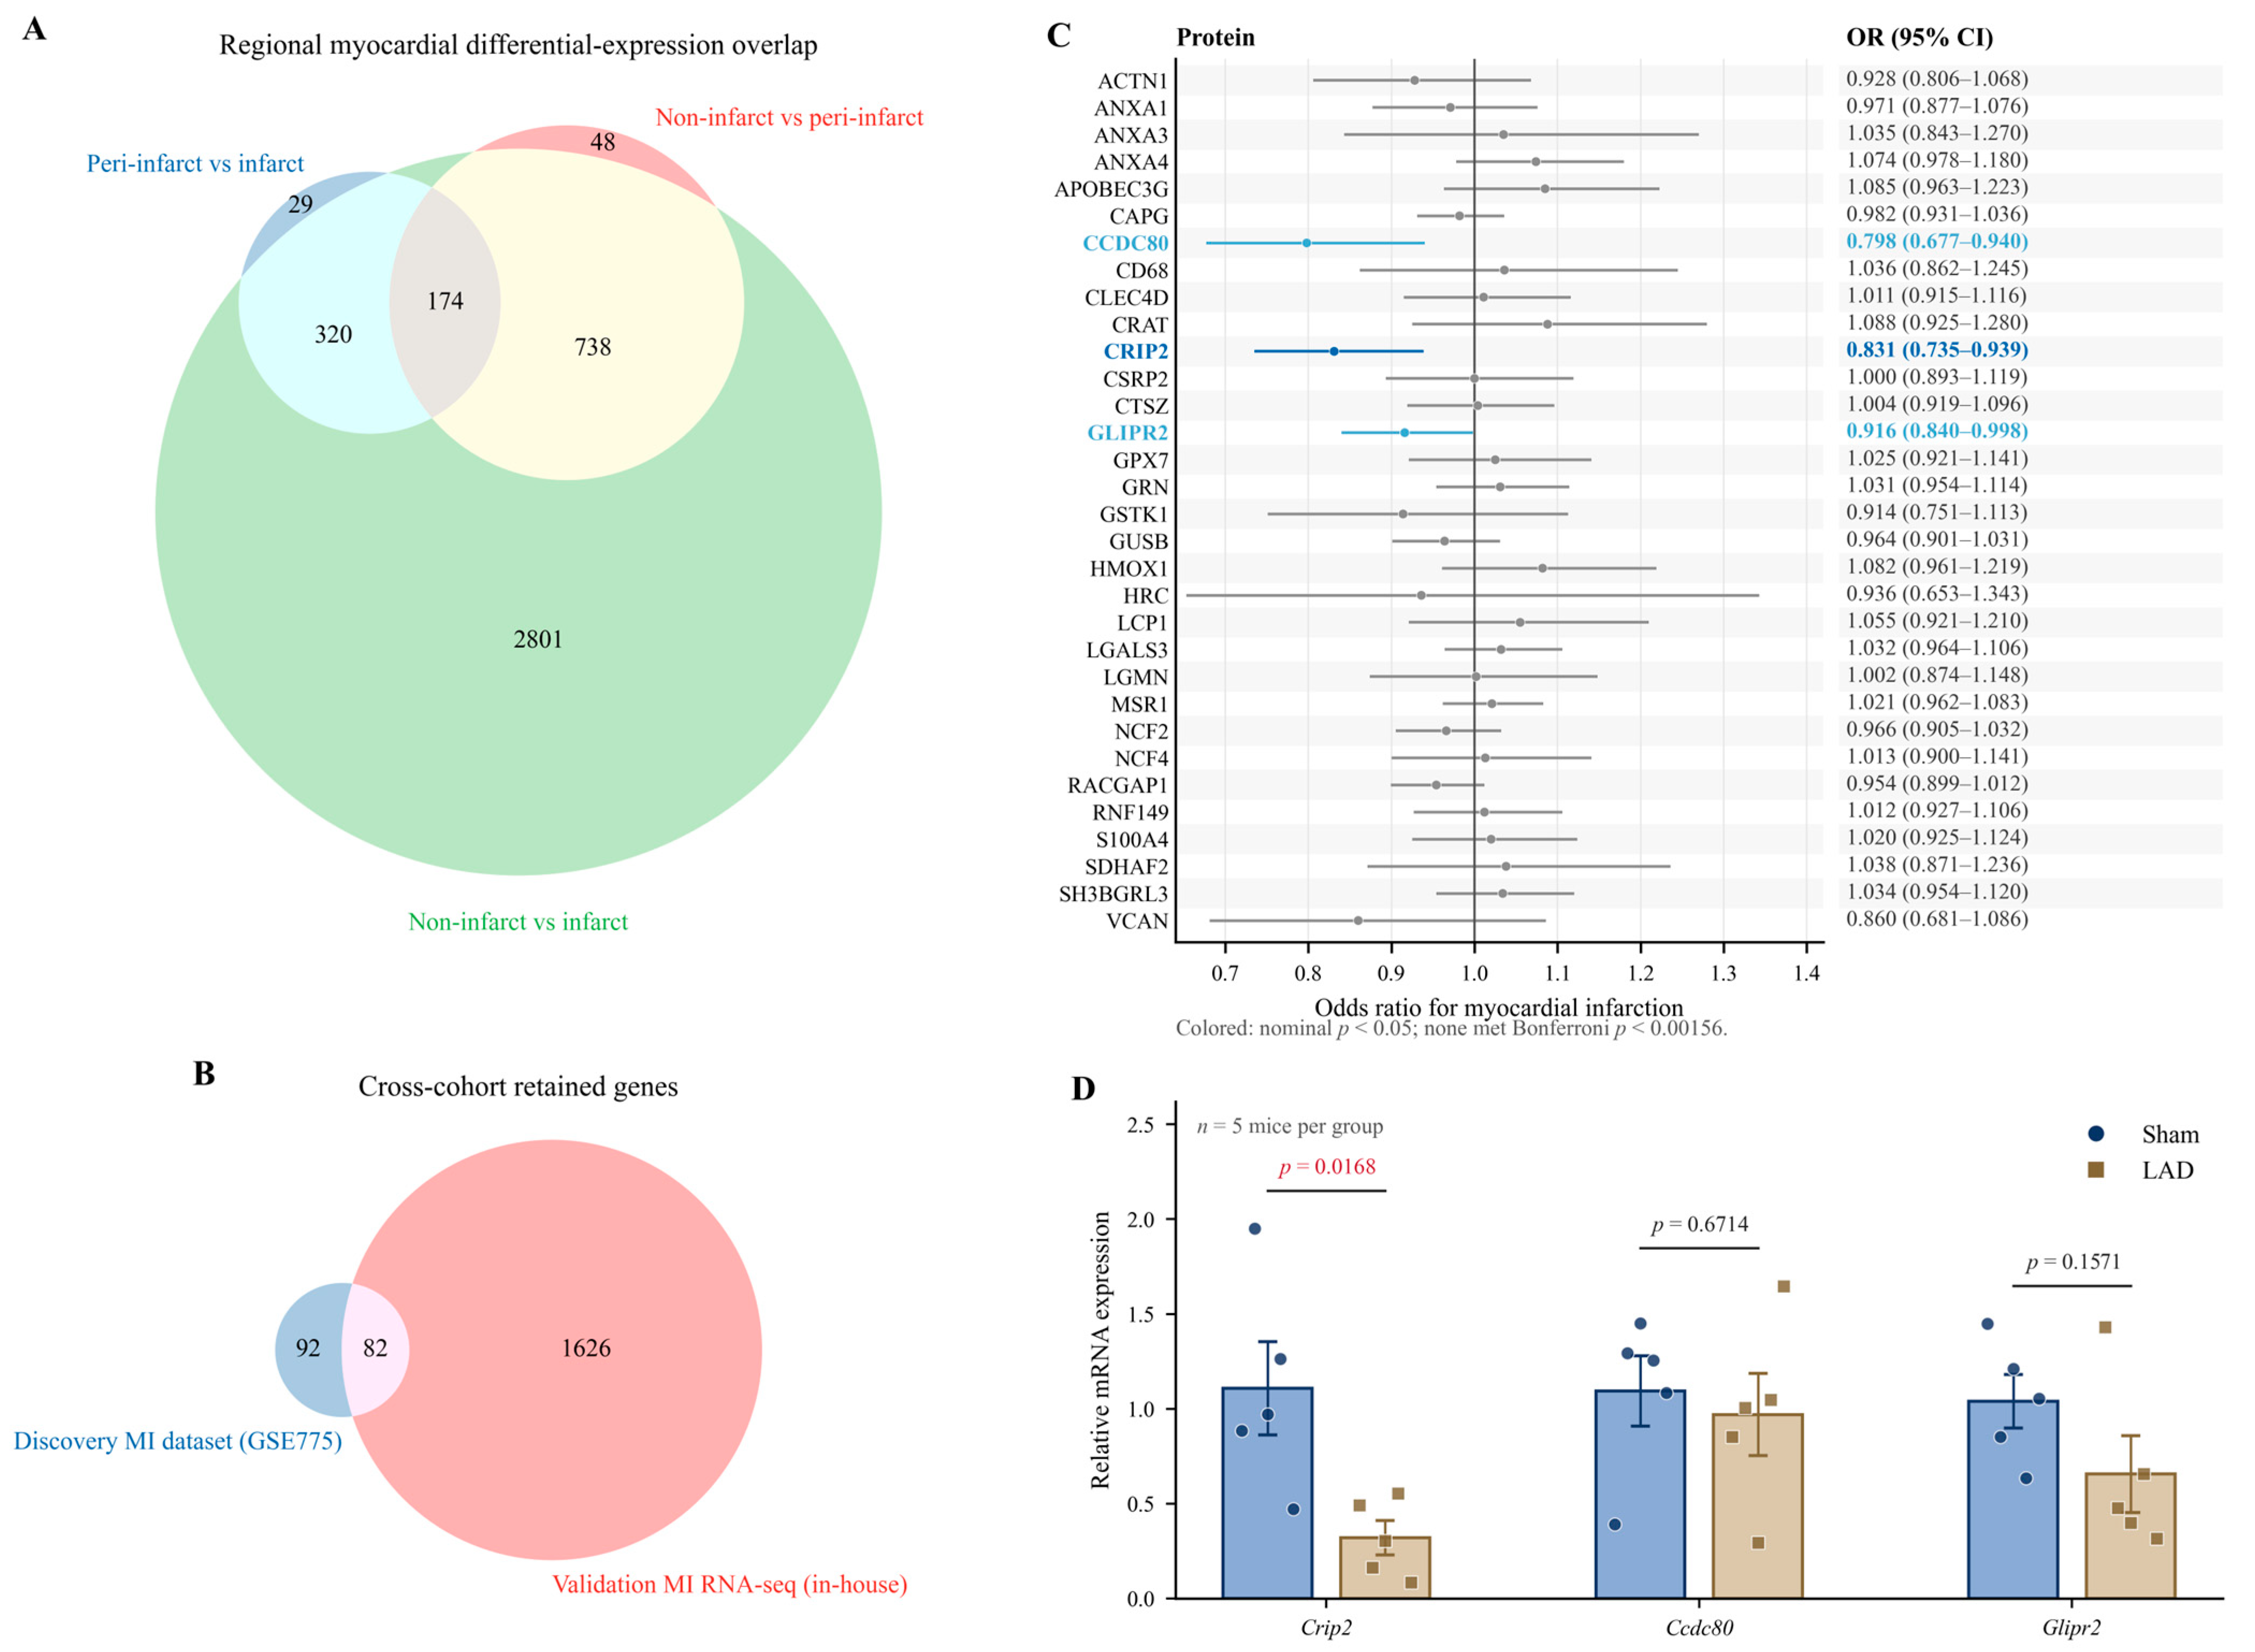
Figure 1. Multi-cohort transcriptomic integration and proteomic Mendelian randomization nominally prioritize CRIP2 as a candidate downregulated in myocardial infarction. (A) Intersection of differentially expressed genes across infarcted myocardium (IM), peri-infarct zone (PZ), and non-infarcted myocardium (NI) in GSE775, yielding 174 shared genes. (B) Intersection of the 174 GSE775 genes with the in-house mouse MI RNA-sequencing cohort, yielding 82 shared genes. (C) Two-sample MR estimates for circulating candidate protein levels and MI risk. IVW estimates were CRIP2: OR 0.831 (95% CI 0.735–0.939), p = 0.00306, 12 variants; CCDC80: OR 0.798 (95% CI 0.677–0.940), p = 0.00702, 19 variants; and GLIPR2: OR 0.916 (95% CI 0.840–0.999), p = 0.0461, 20 variants. These associations were nominal (p < 0.05), and none met the Bonferroni threshold (p < 0.00156). (D) Quantitative real-time PCR validation in the local mouse LAD-ligation MI model at four weeks after MI. Data are mean ± SEM (n = 5 mice per group for each gene; exact p values are displayed; two-tailed unpaired Student’s t-test). Panel colors and symbols are defined as follows: colors in (A,B) correspond to the labeled comparisons or datasets; blue estimates identify the three nominally associated candidates and gray estimates show the remaining screened proteins in (C); blue circles/bars denote sham and tan squares/bars denote left anterior descending (LAD) coronary artery ligation in (D). Abbreviations: MR, Mendelian randomization; IVW, inverse-variance weighted; OR, odds ratio.
Cimb 48 00767 g001
Figure 2. Single-cell transcriptomic profiling maps Crip2 expression across cardiac cell populations after myocardial infarction. (A) Dot plot of canonical marker genes used to annotate five major cardiac cell populations: cardiomyocytes (CM), fibroblasts (FB), endothelial cells (EC), macrophages (Mac), and smooth muscle cells/pericytes (SMC/Pericyte). Dot size and color indicate the percentage of expressing cells and average expression level, respectively. (B) UMAP visualization of cardiac single-cell transcriptomes split by condition (MI vs. Sham). (C) Feature plots map Crip2 expression density and show a descriptively lower signal after MI. (D) Dot plot comparing Crip2 expression across cell populations and conditions. Because two nominal MI raw matrices were byte-identical, the unique-heart pseudobulk sensitivity analysis included three sham and two MI hearts, and did not detect a significant condition-level Crip2 difference (exact permutation p = 0.40); the atlas is therefore interpreted as cell-type localization evidence, rather than replicated proof of post-MI downregulation. In (B), colors denote annotated cell types; in (C), red and gray indicate higher and lower Crip2 expression, respectively; and in (D), color intensity and dot size indicate mean expression and the percentage of expressing cells. UMAP, Uniform Manifold Approximation and Projection.
Cimb 48 00767 g002
Figure 3. Exploratory in silico modeling of CRIP2 perturbation and downstream copper-handling network responses after myocardial infarction. (A) Geneformer embedding shifts (cosine distance) among copper-handling and mitochondrial respiratory genes after virtual CRIP2 perturbation in MI and sham contexts. (B) Comparison of virtual CRIP2 knockout (KO) and overexpression (OE) effects; KO effects were often, but not invariably, larger than OE effects. (C) scTenifoldKnk topology Z-scores after virtual CRIP2 knockout in MI and sham contexts; no adjusted-significant topology effects were identified. (D) Exploratory comparison of Geneformer KO_MI embedding shifts with scTenifoldKnk Z_MI scores across 13 genes (Spearman ρ = −0.313, 95% bootstrap CI −0.751 to 0.262, p = 0.297; 100,000 resamples). The non-significant association does not support cross-method concordance. Cox17 was not included because it did not pass the Geneformer top-2048-gene input threshold. Blue and red denote sham and MI in (A,C), whereas blue and red denote overexpression and knockout in (B). Red points in (D) represent individual genes, and the dashed line is the fitted trend. FDR, false discovery rate.
Cimb 48 00767 g003
Figure 4. CRIP2 perturbation alters selected copper-handling transcripts in H9c2 cardiomyoblasts. (A) Bubble heatmap of GTEx co-expression correlations between CRIP2 and 14 copper-handling genes across human cardiovascular tissues; circle size represents |r|. * p < 0.05, ** p < 0.01, *** p < 0.001. (B) Western blots confirming CRIP2 knockdown and overexpression; GAPDH was the loading control. (C,D) Quantitative PCR analysis after Crip2 knockdown (C) and overexpression (D). Knockdown reduced Slc31a1 and increased Slc25a3, whereas reduced Slc25a3 after overexpression was observed in the Crip2-OE#2 condition. Data are mean ± SD from three independent biological experiments (n = 3; one-way ANOVA with Dunnett’s post hoc test). These assays quantify transcript abundance, and do not directly measure copper flux or cuproptosis. In (A), red and blue indicate positive and negative correlations, respectively; color intensity reflects correlation magnitude, and |r| is the absolute Spearman correlation coefficient. In (C,D), blue, tan, and gray identify the control and two perturbation groups, and points denote independent biological experiments. Abbreviations: GTEx, Genotype-Tissue Expression; qPCR, quantitative PCR; GAPDH, glyceraldehyde-3-phosphate dehydrogenase.
Cimb 48 00767 g004
Figure 5. CRIP2 perturbation is associated with relative metabolic activity during hypoxia/reoxygenation in H9c2 cardiomyoblasts. (A) Knockdown module: siNC and siCRIP2 under normoxia or hypoxia/reoxygenation (H/R). (B) Overexpression module: empty vector and CRIP2-OE under normoxia or H/R. Bars show mean ± SEM, and open symbols show three independent biological experiments (n = 3); three technical wells were averaged within each experiment. Values were normalized within each experiment to the corresponding module-specific normoxic control. Displayed pairwise p values are from two-sided paired t-tests on blank-corrected mean OD450 values. Interaction p values are from blocked two-factor linear models containing CRIP2 treatment, oxygen condition, their interaction, and experimental batch as a block; knockdown and overexpression modules were analyzed separately. CCK-8 measures tetrazolium-reducing metabolic activity/relative viability, and does not directly measure cell death or cuproptosis. Blue and orange denote the module-specific control and CRIP2 perturbation, respectively; light and dark shades denote normoxia and H/R. CCK-8, Cell Counting Kit-8.
Cimb 48 00767 g005
Figure 6. CRIP2 perturbation is associated with context-dependent copper-handling and oxidative-stress transcriptional responses during hypoxia/reoxygenation in H9c2 cardiomyoblasts. (AE) Knockdown module: siNC and siCRIP2 under normoxia (N) or hypoxia/reoxygenation (H/R). (FJ) Overexpression module: empty vector and CRIP2-OE under normoxia or H/R. Crip2, Slc31a1, Slc25a3, Atp7a, and Hmox1 were quantified relative to Gapdh using the 2−ΔΔCt method. Bars show mean ± SEM, and open symbols show three independent biological experiments (n = 3); three technical wells were averaged within each experiment. Interaction p values are from blocked two-factor linear models on ΔCt values containing CRIP2 treatment, oxygen condition, their interaction, and biological batch as a block. Interaction q values are Benjamini–Hochberg-adjusted across five genes within each module. p(H/R treatment) denotes the descriptive two-sided paired comparison between CRIP2 perturbation and the corresponding control under H/R, and is not multiplicity-adjusted. Blue bars denote module-specific controls, red bars denote siCRIP2, and green bars denote CRIP2-OE; light and dark shades denote normoxia and H/R, respectively. Open circles show independent biological experiments.
Cimb 48 00767 g006
Disclaimer/Publisher’s Note: The statements, opinions and data contained in all publications are solely those of the individual author(s) and contributor(s) and not of MDPI and/or the editor(s). MDPI and/or the editor(s) disclaim responsibility for any injury to people or property resulting from any ideas, methods, instructions or products referred to in the content.