Article

Integrative Analysis Uncovers SETD5 as an Epigenetic Regulator of Transcriptional and Immune Tumor Programs Across Human Cancers


by
Ana Cristina Moura Gualberto
1,†,
Brunna Letícia de Oliveira Santana
1,†,
Mariana Braccialli de Loyola
1,
Yasmim Sampaio da Costa
2,3 and
Fábio Pittella-Silva
1,*
1
Laboratory of Molecular Pathology of Cancer, Faculty of Health Sciences, University of Brasilia, Brasilia 70910-900, Brazil
2
Laboratory on Thymus Research, Oswaldo Cruz Institute, Oswaldo Cruz Foundation, Rio de Janeiro 21040-900, Brazil
3
National Institute of Science and Technology on Neuroimmunomodulation, Oswaldo Cruz Institute, Oswaldo Cruz Foundation, Rio de Janeiro 21040-900, Brazil
*
Author to whom correspondence should be addressed.
These authors contributed equally to this work.
Curr. Issues Mol. Biol. 2026, 48(7), 742; https://doi.org/10.3390/cimb48070742
Submission received: 10 June 2026 / Revised: 16 July 2026 / Accepted: 20 July 2026 / Published: 21 July 2026

Abstract

SETD5 (SET domain-containing 5) is a chromatin-associated regulator increasingly recognized as dysregulated in human malignancies; however, its contribution to tumor biology and tumor–immune interactions remain undefined. We performed an integrative pan-cancer multi-omics analysis to define the landscape of SETD5 dysregulation across cancer types. Transcriptomic, genomic, and epigenetic datasets were integrated to evaluate SETD5 alterations and molecular associations. Protein interaction and pathway enrichment analyses were conducted using STRING, GO, and KEGG, and immunogenomic profiling was used to interrogate associations between SETD5 expression, immune infiltration, and checkpoint programs. SETD5 was overexpressed across multiple malignancies, with low mutation frequency but recurrent copy-number gains. Promoter hypomethylation was detected in a subset of tumors with increased SETD5 expression, suggesting a possible association with epigenetic regulation. Pathway analyses linked SETD5 to macromolecule methylation and transcriptional regulation. SETD5 expression correlated positively with infiltration of macrophages, neutrophils, and dendritic cells, whereas associations with CD8+ and CD4+ T cells varied by tumor type. Tumor type-specific correlations were observed between SETD5 and immune checkpoints genes, including PD-L1 and TIM-3, suggesting an association with immunoregulatory tumor states. These findings identify SETD5 as a recurrently deregulated epigenetic regulator and highlight its potential role in transcriptional control and tumor immune modulation.

1. Introduction

Epigenetic reprogramming is a hallmark of cancer, reshaping the transcriptional networks that sustain malignant characteristics. Alterations in chromatin-regulatory mechanisms can lead to significant changes in gene expression and hallmark features of tumor progression including uncontrolled proliferation, inactivation of suppressor genes, activation of oncogenes and immune escape [1,2]. Immune evasion has emerged as a central determinant of tumor persistence and treatment failure and is increasingly recognized as being influenced by epigenetic mechanisms operating both within cancer cells and in the surrounding microenvironment [3,4]. Chromatin modifiers, including lysine methyltransferases (KMTs), govern transcriptional states that shape cellular behavior, and increasing evidence suggests that their dysregulation contributes to the establishment of tumor-permissive immune landscapes [5].
Among KMTs, SETD5 (SET domain-containing protein 5) remains one of the least characterized, despite growing evidence implicating it in cancer-associated regulatory processes. Integrative analyses of transcriptomic datasets from patient cohorts, together with functional siRNA (small interfering RNA) and CRISPR (Clustered Regularly Interspaced Short Palindromic Repeats)-based screening studies, have identified SETD5 as a contributor to transcriptional programs associated with tumor progression. Elevated expression has been reported for multiple cancer types and is associated with adverse clinical features [6,7,8,9,10]. Notably, recent functional studies have demonstrated that SETD5 regulates glycolysis through the EP300/HIF-1α axis in breast cancer stem-like cells [9], promotes adaptive drug resistance in pancreatic cancer by scaffolding a co-repressor complex containing HDAC3 and G9a [10], and facilitates cancer stemness while repressing ferroptosis via m6A-mediated PKM2 stabilization in non-small cell lung cancer [11]. In addition, the structural similarity of SETD5 to other SET-domain methyltransferases, in conjunction with evidence of its integration into networks regulating chromatin, supports the hypothesis that SETD5 functions as an epigenetic modulator of oncogenic gene expression [12].
Epigenetic mechanisms, including promoter methylation, have been associated with changes in SETD5 expression [12]. Furthermore, non-coding RNAs, including microRNAs and long non-coding RNAs, have been postulated as post-transcriptional modulators of SETD5, thereby associating it with more extensive regulatory circuits involving RNA-mediated chromatin control [13,14]. These interdependent regulatory layers may collectively shape chromatin accessibility, transcriptional fidelity, and cellular adaptability. This suggests that dynamic control of SETD5 expression could contribute to tumor evolution.
Therefore, a comprehensive understanding of SETD5′s role in cancer is crucial for identifying epigenetic vulnerabilities that may be therapeutically actionable. Elucidation of the regulatory networks and functional dependencies in which SETD5 operates has the potential to reveal novel opportunities to target transcriptional programs that support malignancy. In consideration of the emerging evidence that indicates a correlation between chromatin modifiers and immune landscape remodeling, it is essential to investigate the relationship between SETD5 and tumor immune contexture. This investigation may yield critical insights into the mechanisms of immune evasion and therapeutic resistance. In this study, we investigated the role of SETD5 across multiple tumor types through a comprehensive in silico analysis encompassing expression profiles, genomic alterations, promoter methylation, protein interaction networks, and functional associations. This work provides a foundation for future research by examining SETD5 within these multidimensional datasets and by exploring the potential of SETD5 as an epigenetic regulator of tumor progression and immune modulation.

2. Materials and Methods

2.1. Database Analysis

The TIMER database (https://compbio.cn/timer2/, accessed on 7 May 2026) was used to analyze the expression of SETD5 across various tumor types, which provides RNA sequencing (RNA-seq) data derived from The Cancer Genome Atlas. The gene expression levels were assessed using the “Gene_DE” module and boxplots comparing tumor and adjacent normal tissues were obtained from the platform. The UALCAN database (http://ualcan.path.uab.edu, accessed on 20 May 2026) was employed to evaluate SETD5 expression in tumor tissues compared to normal tissues in the cancer types selected from TIMER. Statistical comparisons of SETD5 expression between tumor and adjacent normal tissues were performed internally by each platform (unpaired Student’s t-test for UALCAN; Wilcoxon rank-sum test for TIMER), with significance set at p < 0.05 for each cancer type independently. Data on mutation frequency and copy number alterations (CNAs) were obtained from the cBioPortal for Cancer Genomics (www.cbioportal.org, accessed on 22 May 2026). CNA data were generated using the GISTIC (Genomic Identification of Significant Targets in Cancer) algorithm, where a value of −2 indicates a homozygous deletion and a value of 2 indicates gene amplification.

2.2. Data Download

RNA-seq data from primary tumor samples were obtained from The Cancer Genome Atlas (TCGA) using the ‘TCGAbiolinks’ package in R (v.4.5.3). Raw counts were normalized to transcripts per million (TPM) and log2-transformed [log2(TPM + 1)]. Duplicate patient samples were removed prior to analysis. The numbers of tumor and normal samples included for each cancer type are summarized in Supplementary Tables S1–S5.

2.3. Promoter Methylation Levels

We analyzed the DNA methylation levels of the SETD5 promoter across multiple cancer types using publicly available data from TCGA). Methylation profiling was performed using the Illumina HumanMethylation450 BeadChip platform (Illumina Inc., San Diego, CA, USA),focusing specifically on the promoter-associated probe cg01564818, located within the promoter region of SETD5. Beta values were compared between primary tumor samples and normal tissues across a range of tumor types.
Methylation data were downloaded from the TCGA data portal and processed using R software version 4.3.1 (R Foundation for Statistical Computing, Vienna, Austria) for initial handling and quality control. Further data organization was conducted in Microsoft Excel. GraphPad Prism (8.0.2; GraphPad Software, San Diego, CA, USA) was used for statistical analyses and graphical representations. Differences in methylation levels between tumor and normal samples were assessed using either unpaired Student’s t-tests or Mann–Whitney U tests according to data distribution with significance set at p < 0.05.

2.4. Protein–Protein Interaction Network

A protein–protein interaction (PPI) network was constructed using the STRING database (version 12.0, https://string-db.org, accessed on 22 May 2026). In this network, nodes represent proteins, and edges represent a potential functional association between each protein based on multiple types of evidence, including curated databases, experimental data, gene neighborhood, gene fusions, co-occurrence, text mining, co-expression, and protein homology. A confidence score threshold of 0.4 (medium confidence) was applied. STRING interaction scores, which range from 0 to 1, were used to assess the confidence level of the predicted functional associations.

2.5. GO and KEGG Pathway Enrichment Analyses

To investigate the biological functions associated with SETD5-related genes, we performed a functional enrichment analysis using the Gene Ontology (GO) ontologies and the Kyoto Encyclopedia of Genes and Genomes (KEGG) pathway database. The selected genes were submitted to the enrichGO (for biological processes—BP) and enrichKEGG functions of the clusterProfiler package (v.4.x) in the R environment (R v.4.5.3; RStudio 2025.09.0+387) [15]. Terms with an adjusted FDR value of less than 0.05 were considered significantly enriched.

2.6. Infiltration Analysis of Immune Cells

Tumor purity was estimated using the ESTIMATE algorithm. Immune cell infiltration levels were inferred from TPM-normalized expression data using the TIMER algorithm implemented in the ‘immunedeconv’ package (v.2.1.0) in R (v.4.5.3).

2.7. Correlation Analysis Between SETD5 and Immune Cells

The association between SETD5 expression and immune cell infiltration was assessed using partial Spearman correlation analysis adjusted for tumor purity with the ppcor package (v.1.1). p-values were corrected for multiple testing using the Benjamini–Hochberg method, and adjusted p-values < 0.05 were considered statistically significant. Correlation heatmaps were generated using the ComplexHeatmap package (v.2.26.1). Non-significant correlations were represented as grey cells.

2.8. Correlation Analysis Between SETD5 and Immune Genes

Spearman correlation analysis was performed to evaluate the association between SETD5 and immune checkpoint genes (PDCD1, CD274, CTLA4, LAG3, and HAVCR2). Correlation matrices were visualized using the corrplot package (v.0.95).

2.9. Survival Analysis

Overall survival analysis was performed using clinical and transcriptomic data obtained using ‘TCGAbiolinks’ package in R (v.4.5.3). Patients were stratified into high- and low-expression groups according to the median SETD5 expression within each tumor cohort. Patients without death events were treated as censored observations. Survival analyses and graphical representations were performed in R using the packages survival package (v.3.8-6) and survminer package (v.0.5.2). Confidence intervals of 95% were displayed for all Kaplan–Meier curves, and risk tables indicating the number of patients at risk over time were included.

3. Results

3.1. SETD5 Is Widely Upregulated Across Multiple Human Cancers

SETD5 mRNA expression was evaluated between tumor and normal tissue from TIMER database. This global analysis showed upregulation of SETD5 in bladder urothelial carcinoma (BLCA), colon adenocarcinoma (COAD), esophageal carcinoma (ESCA), head and neck squamous cell carcinoma (HNSC), liver hepatocellular carcinoma (LIHC), lung adenocarcinoma (LUAD), lung squamous cell carcinoma (LUSC), rectum adenocarcinoma (READ) and stomach adenocarcinoma (STAD) (Supplementary Figure S1).
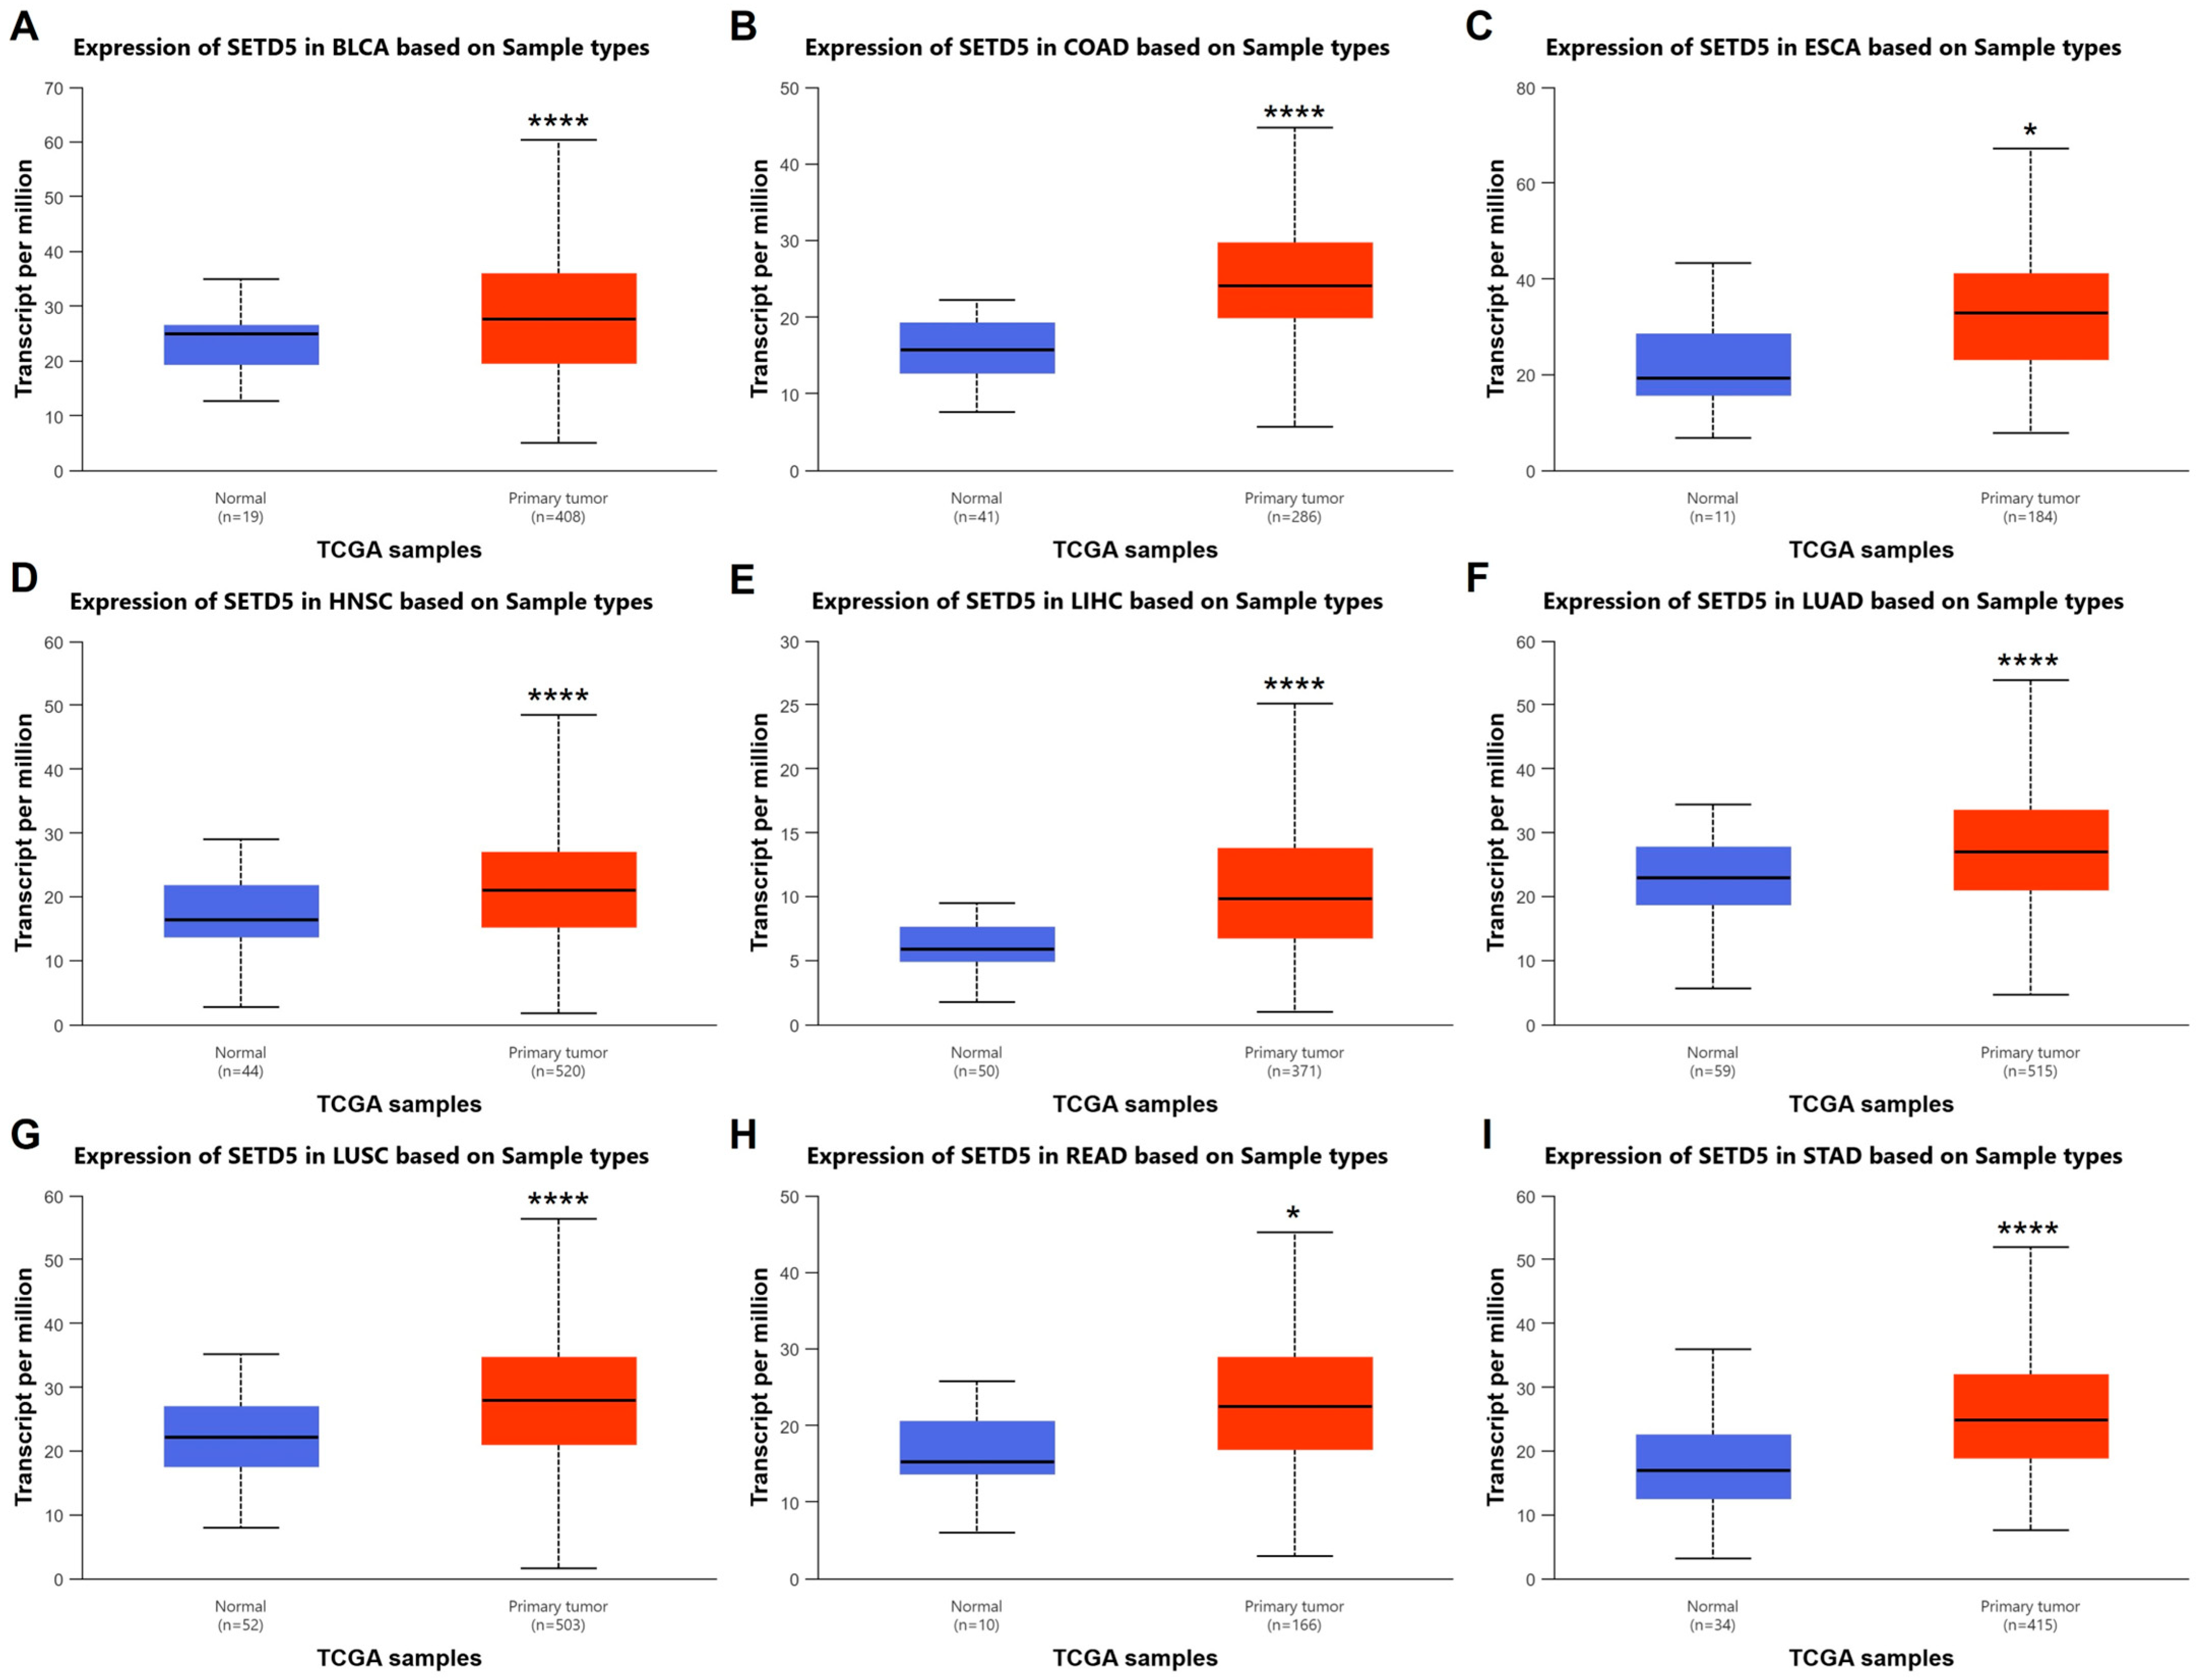
Subsequently, an individual analysis of these tumors was performed using the UALCAN database to confirm SETD5 expression differences in tumor and normal tissues. SETD5 expression was significantly higher in the following tumor types when compared to normal tissue: BLCA (p = 2.20 × 10⁻⁵), COAD (p = 1.62 × 10⁻¹²), ESCA (p = 2.32 × 10⁻²), HNSC (p = 5.10 × 10⁻⁷), LIHC (p < 1 × 10⁻¹²), LUAD (p = 1.28 × 10⁻⁹), LUSC (p = 8.81 × 10⁻¹¹), READ (p = 2.37 × 10⁻²) and STAD (p = 4.12 × 10⁻⁹) (Figure 1A–I).

3.2. Frequency of Mutations and Copy Number Alterations

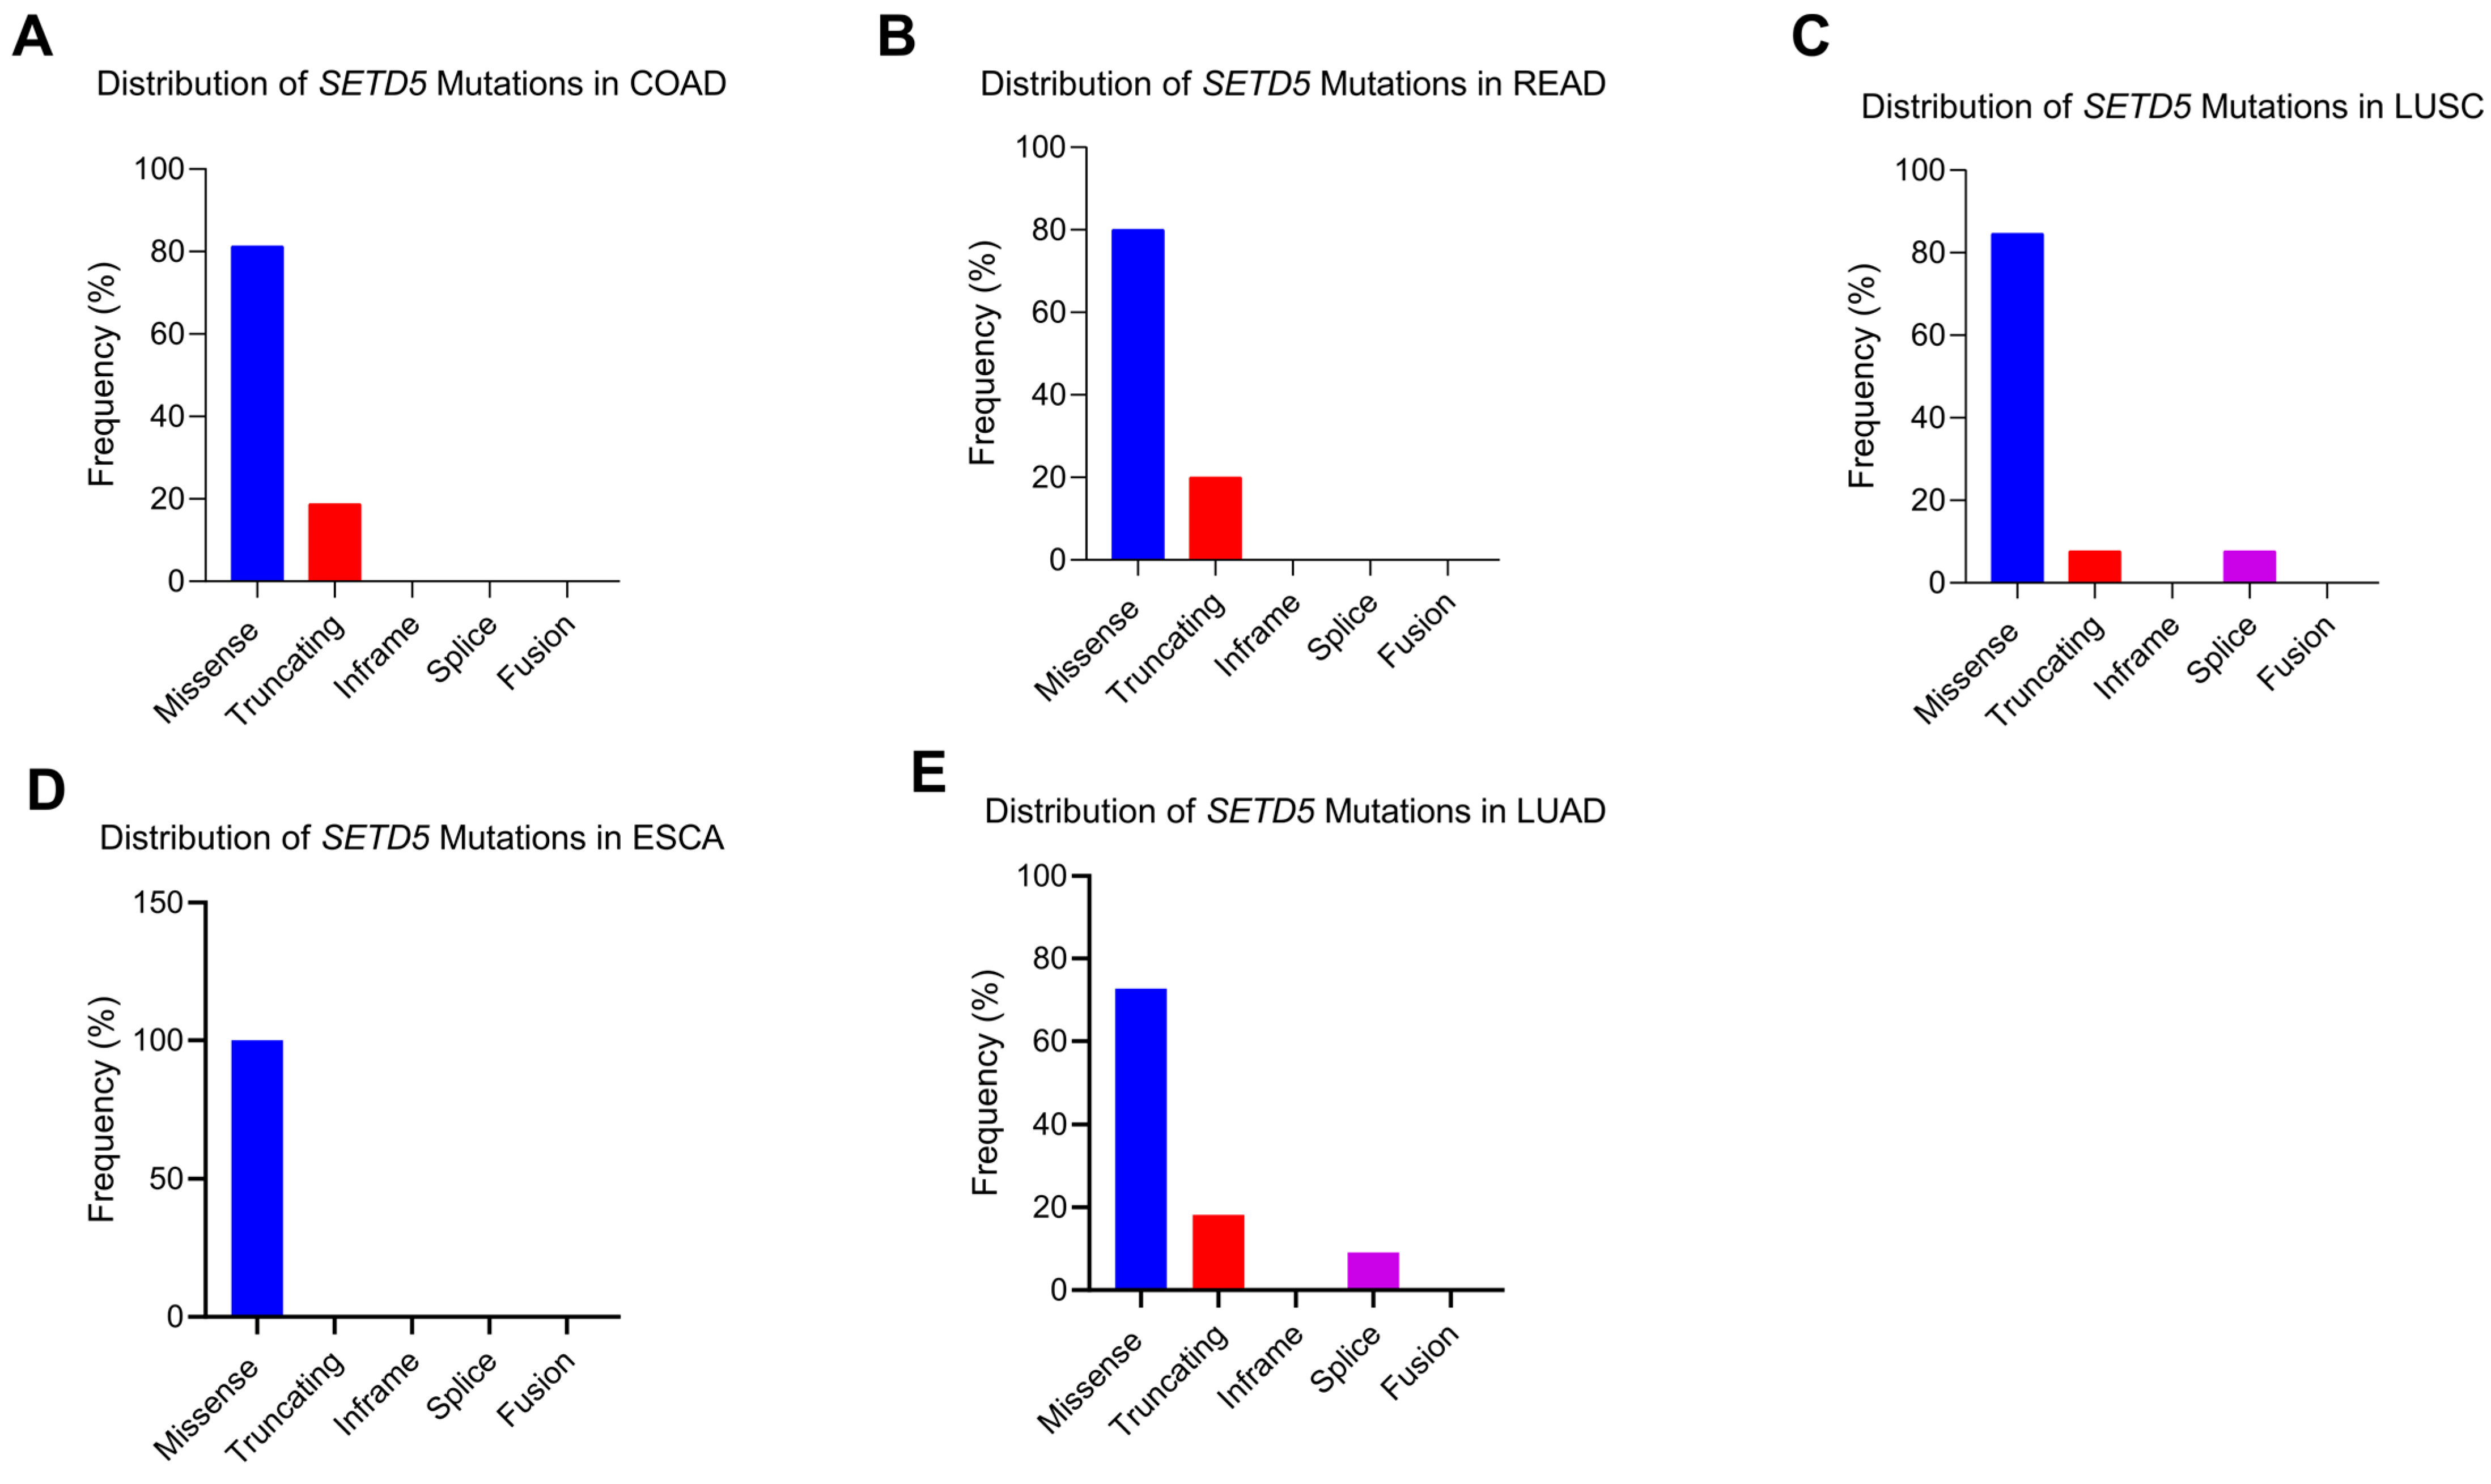
We used cohorts from the cBio Portal to analyze the frequency of mutations and copy number alterations (CNAs) (Table 1). The mutation frequency of SETD5 was generally low. However, colon adenocarcinoma (COAD), rectum adenocarcinoma (READ), lung adenocarcinoma (LUAD), lung squamous cell carcinoma (LUSC), liver hepatocellular carcinoma (LIHC) and esophageal carcinoma (ESCA) showed frequencies above 1.5%. Among these tumors, somatic SETD5 variants were detected in 3.9% of COAD cases and 4.7% of READ cases. Interestingly, both tumor types exhibited approximately 80% missense mutations and 20% truncating mutations. In LUSC, the mutation rate was 5.9%, with ~80% missense and ~10% truncating and splice mutations. In ESCA, SETD5 variants were found in 2% of cases, all of which were missense mutations (Figure 2A–E).
Regarding CNAs, the overall frequency of alterations was relatively low. Nevertheless, the highest amplification frequencies were observed in esophageal carcinoma (ESCA), and bladder urothelial carcinoma (BLCA): 2.6% and 7.5%, respectively (Table 1).

3.3. Promoter Methylation Levels in Cancer Tissue and Normal Tissue

To investigate the epigenetic regulation of SETD5 across different cancer types, we analyzed promoter methylation data from The Cancer Genome Atlas (TCGA). DNA methylation profiles were obtained using the Illumina HumanMethylation450 BeadChip platform, and the analysis focused on the promoter-associated probe cg01564818, located in the promoter region of SETD5. We compared methylation levels between primary tumor samples and normal tissues across multiple tumor types.
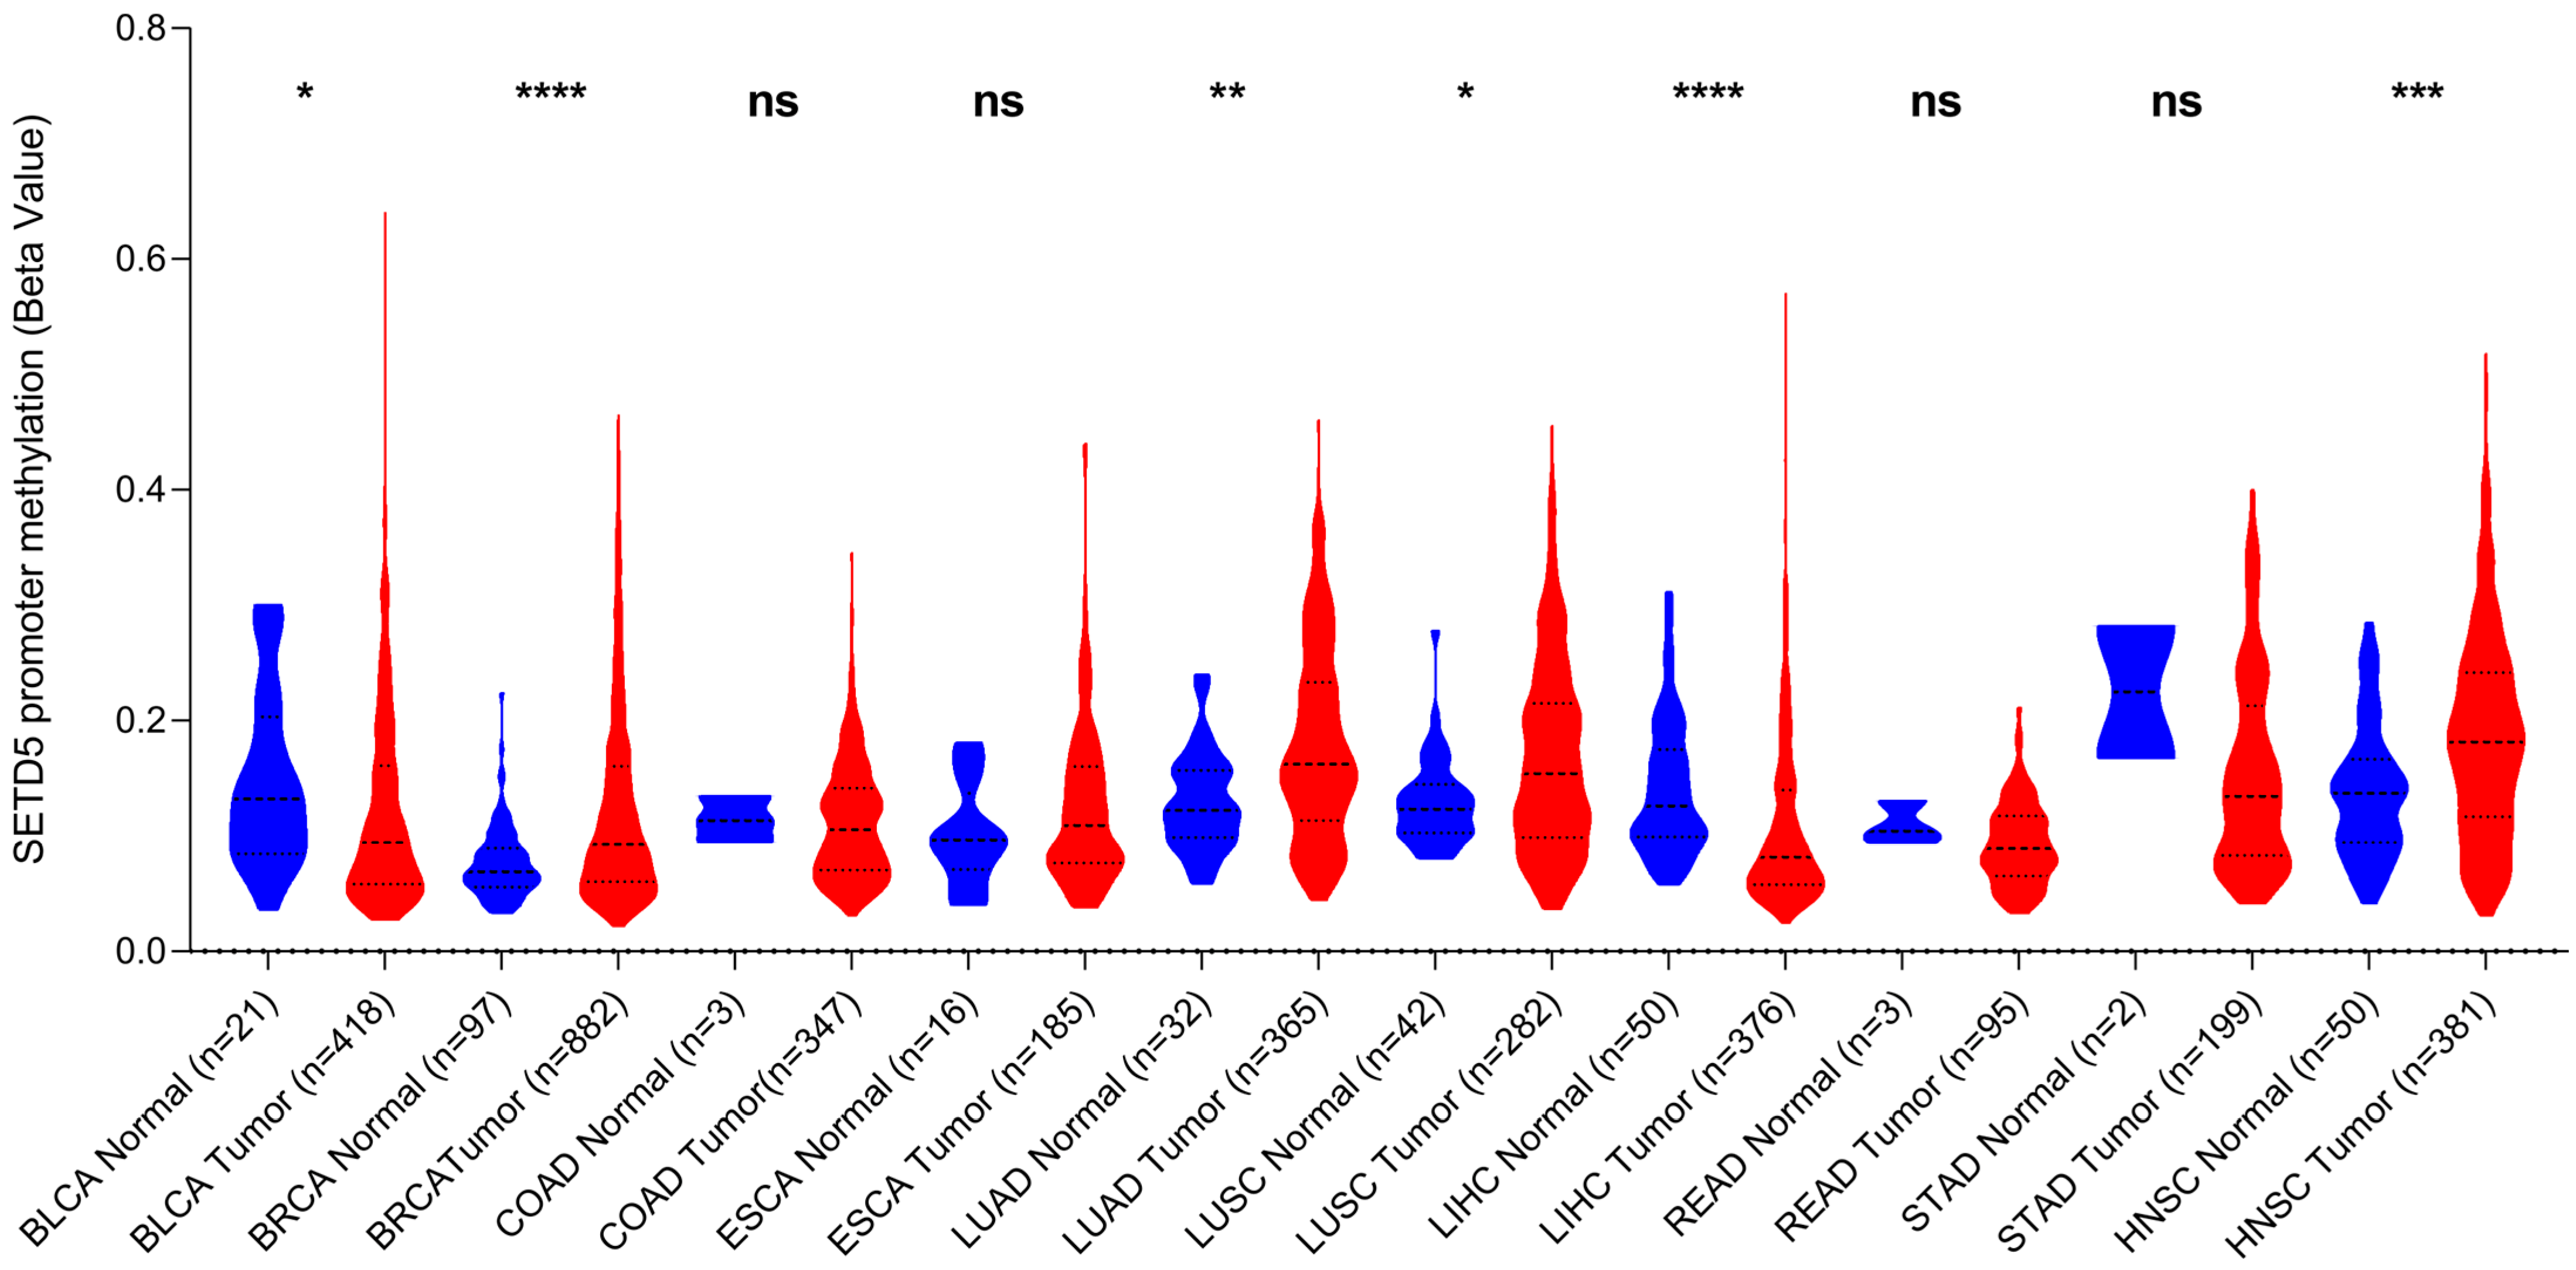
Significant differences in methylation patterns in the promoter region of SETD5 were identified in several cancers. In BLCA and LIHC, we observed significantly lower methylation levels in tumor samples compared to normal tissues (p < 0.05 and p < 0.0001, respectively, Figure 3). On the other hand, higher methylation levels in tumors were detected in HNSC, LUAD and LUSC (p < 0.001, p < 0.01 and p < 0.05, respectively). Although READ and colon adenocarcinoma COAD appeared to follow a similar trend of decreased methylation in tumor samples, these differences were not statistically significant, potentially due to the limited number of available normal samples in these cohorts.

3.4. SETD5 Interaction Network Indicates a Role in Chromatin Remodeling and Transcriptional Regulation

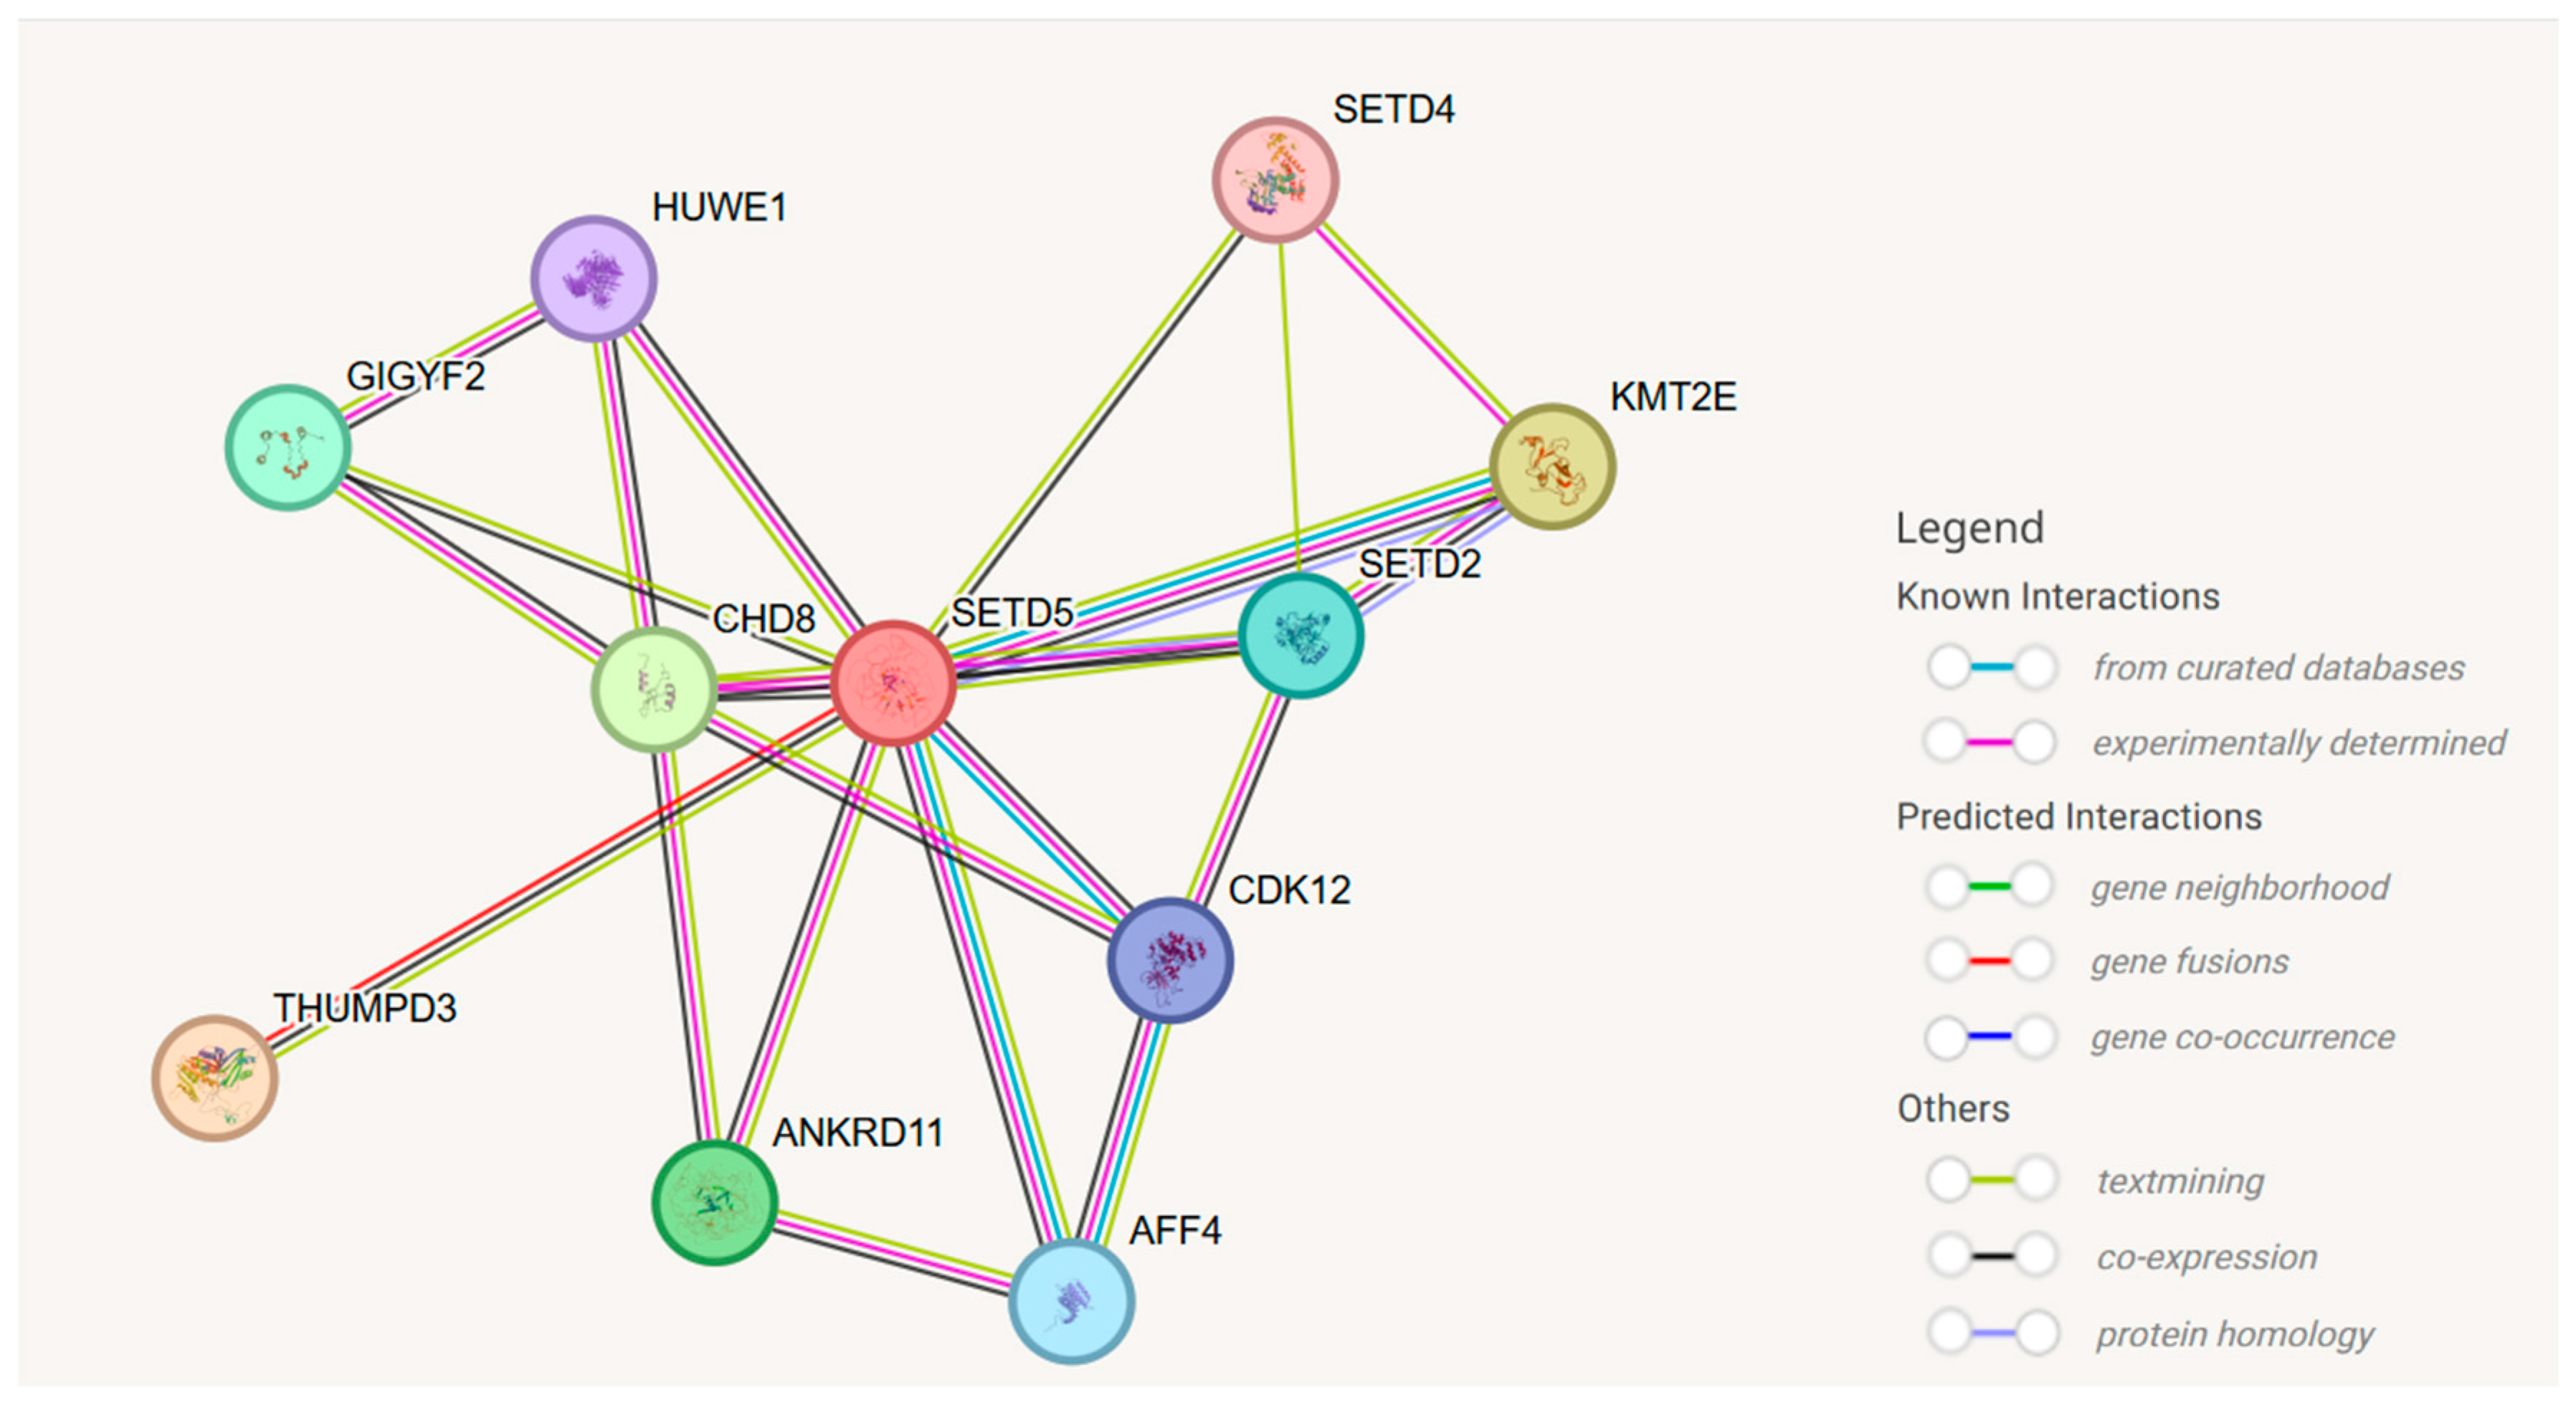
To explore the potential functional partners of SETD5, a protein–protein interaction (PPI) network was generated using the STRING database. The analysis included both known and predicted interactions (Figure 4). The network interaction scores were used to evaluate the confidence of predicted functional partners of SETD5. Among these, the ten highest-confidence interacting partners were selected for downstream functional analysis (Supplementary Table S6). The lysine methyltransferases KMT2E (0.702), SETD2 (0.599) and SETD4 (0.576) showed high and moderate interaction confidence (Supplementary Table S6). These findings suggest that SETD5 may participate in chromatin remodeling and transcriptional regulation through its interaction with these partners. Other partners, such as THUMPD3 (interaction score 0.732), were also retrieved; THUMPD3 is a tRNA-modifying enzyme that has additionally been implicated in alternative splicing regulation and lung cancer proliferation.

3.5. Analysis of Functional Enrichment

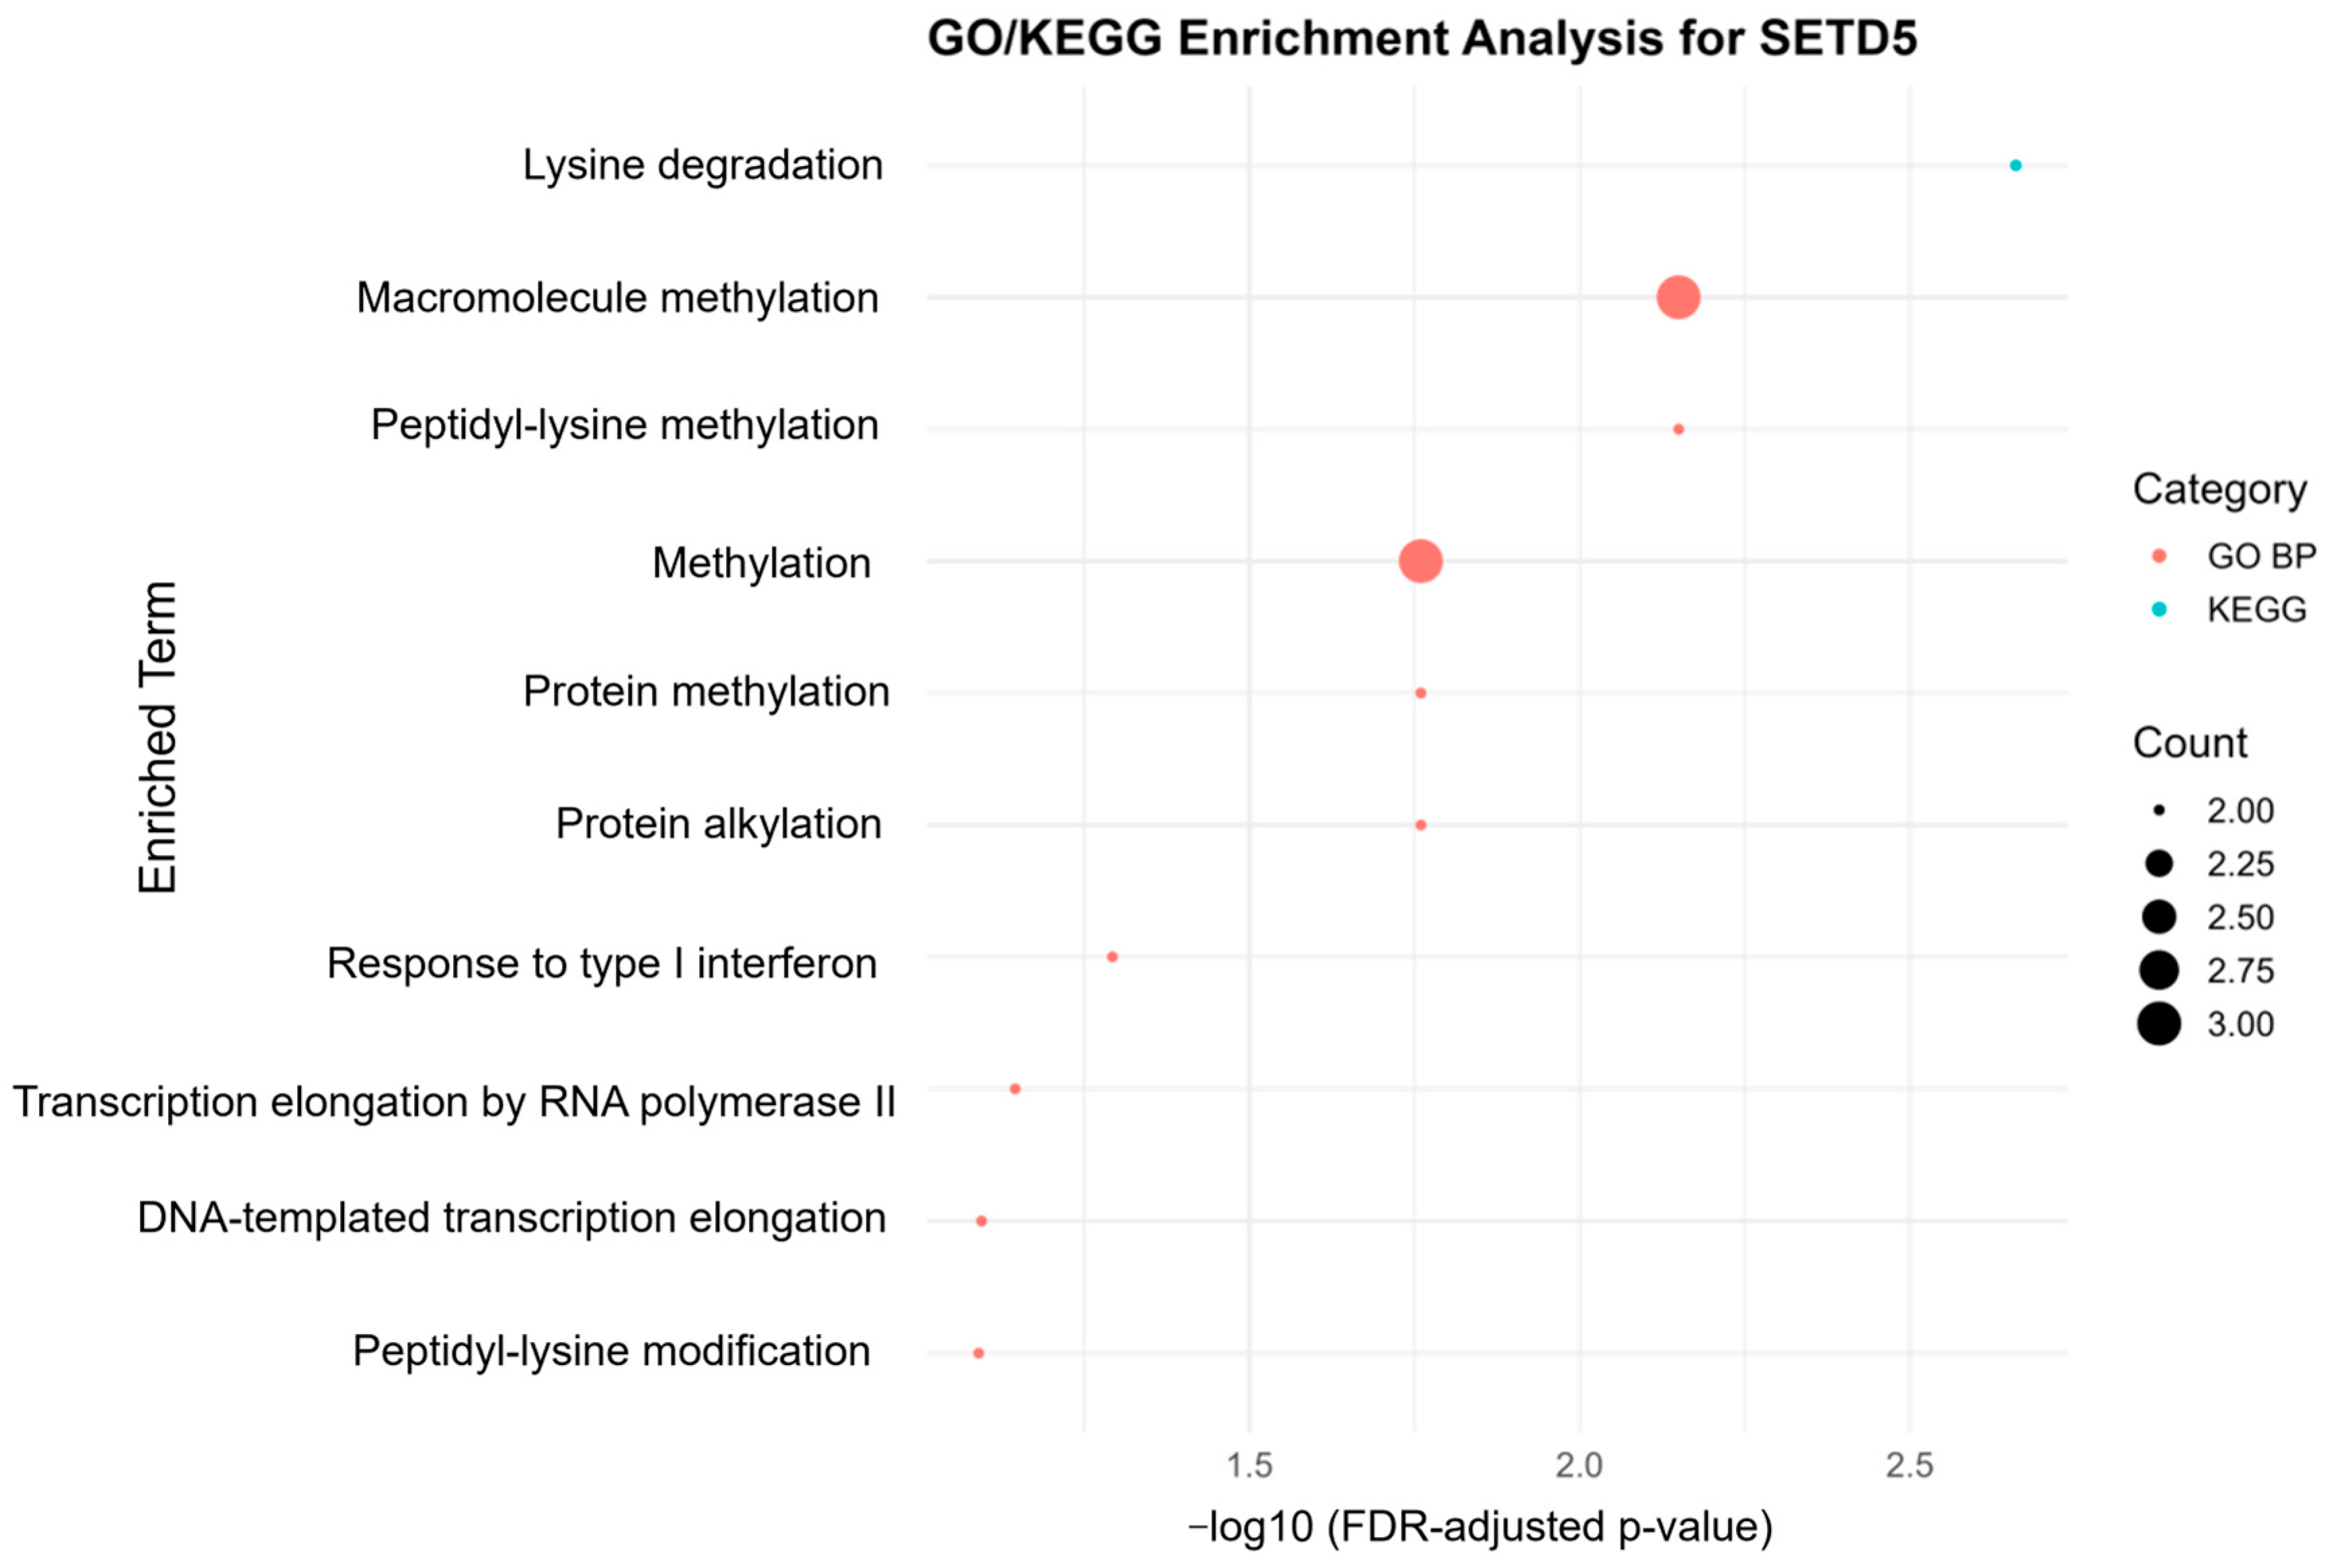
To explore the functional roles of the ten SETD5-associated genes identified through STRING analysis, we performed an enrichment analysis using Gene Ontology (GO) and KEGG pathways. The analysis showed an enrichment in biological pathways related to macromolecule methylation (GO:0043414), protein methylation (GO:0006479), and peptidyl-lysine methylation (GO:0018022), which indicates an association with epigenetic regulatory mechanisms. An enrichment in pathways related to transcriptional control was also observed, such as “transcription elongation by RNA polymerase II” (GO:0006368) and “DNA-templated transcription elongation” (GO:0006354). Notably, the KEGG pathway “Lysine degradation” (hsa00310) was enriched, highlighting a potential link between SETD5-associated genes and lysine metabolism (Figure 5). Taken together, these findings highlight the role of SETD5 as an epigenetic modifier. This data also suggests that SETD5 influences the process of gene expression at the transcriptional level.

3.6. SETD5 Correlates with Immune Infiltration Across Tumors

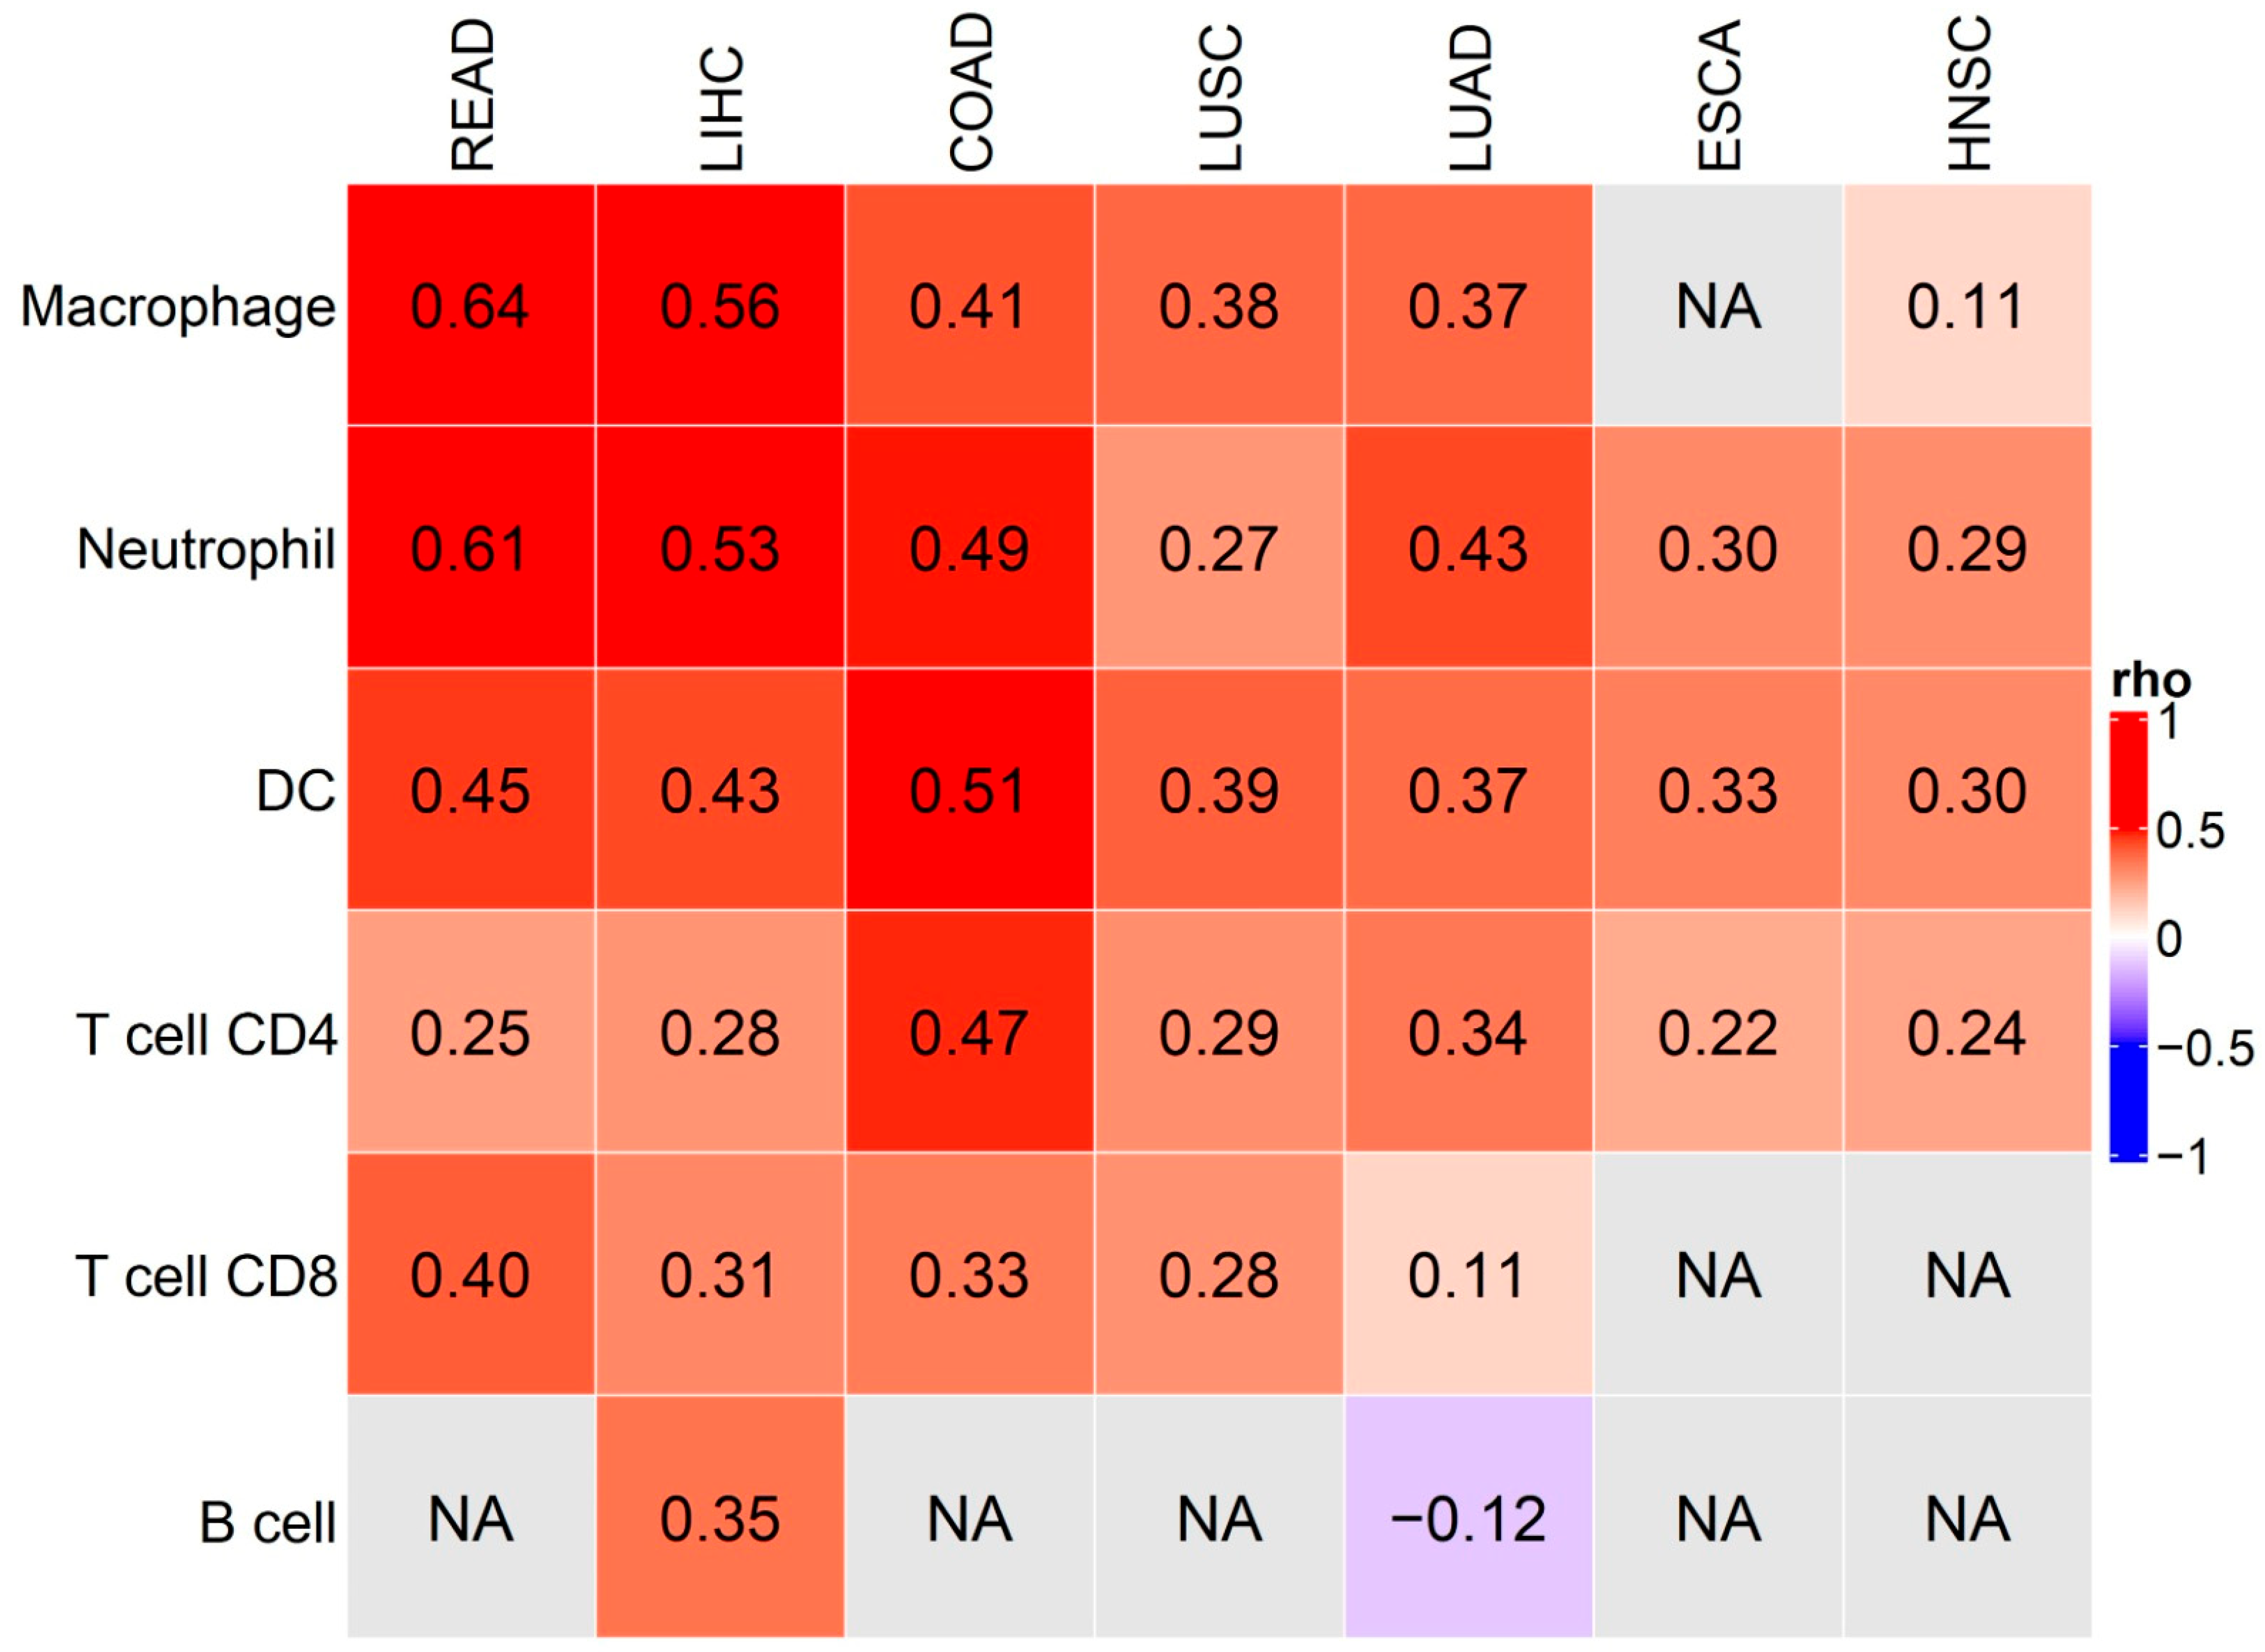
To assess the potential association between SETD5 expression and remodeling of the tumor immune microenvironment, we quantified its correlation with key immune cell populations across seven tumor types (Figure 6). SETD5 expression showed variable, tumor type-dependent positive correlations with multiple immune cell populations across the seven tumor cohorts analyzed, highlighting a context-specific relationship between SETD5 and immune infiltration patterns. The strongest and most consistent associations were observed for macrophages (ρ = 0.37–0.64), with the highest values in READ (ρ = 0.64) and LIHC (ρ = 0.56). Notably, SETD5 showed no detectable macrophage correlation in ESCA samples (NA). Neutrophils exhibited robust correlations (ρ = 0.27–0.61), with the highest values in READ (ρ = 0.61) and LIHC (ρ = 0.53), were among the strongest associations observed across all cell types. Dendritic cells showed moderate and consistent correlations across cohorts (ρ = 0.30–0.51), with the highest value in COAD (ρ = 0.51). CD4+ T cell correlations were modest (ρ = 0.22–0.47), with the strongest association in COAD (ρ = 0.47). CD8+ T cell correlations ranged from ρ = 0.11 in LUAD to ρ = 0.40 in READ, with no detectable association in ESCA and HNSC (NA). B cells showed detectable correlations only in LIHC (ρ = 0.35) and a slight negative correlation in LUAD (ρ = −0.12), with non-significant (NA) values in the remaining cohorts. Collectively, these findings indicate that SETD5 expression is most consistently associated with innate immune cell populations such as macrophages, neutrophils, and dendritic cells rather than cytotoxic lymphocytes, suggesting a preferential link between SETD5 and innate immune microenvironment remodeling across cancer types.

3.7. SETD5 Expression Is Associated with Immune Checkpoint Signatures Across Tumor Types

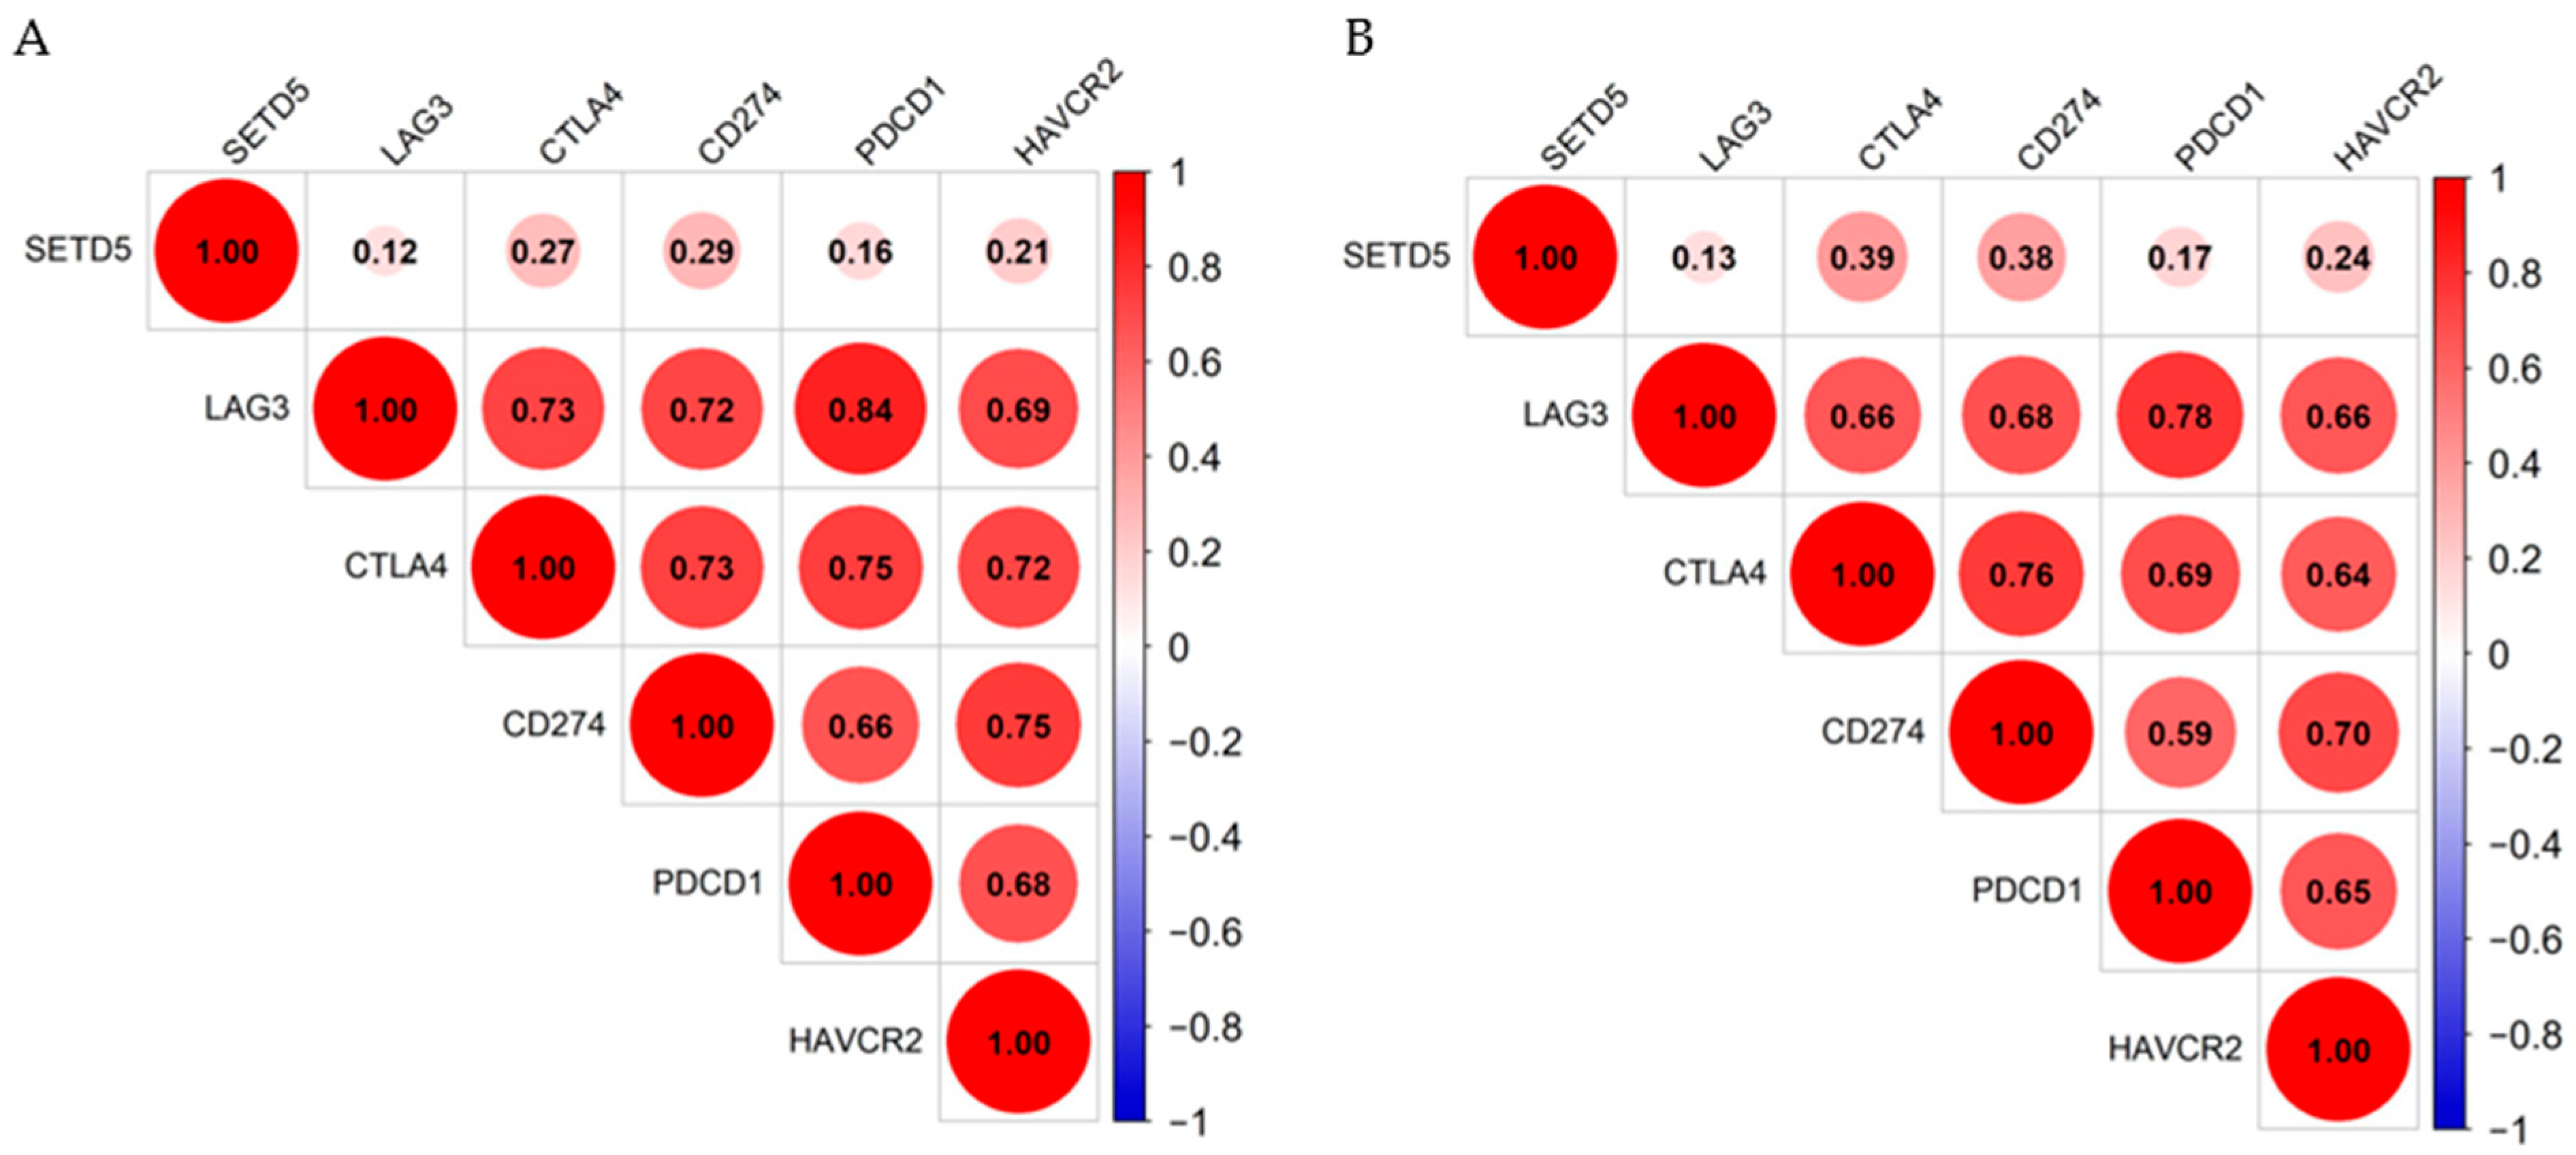
To determine whether SETD5 expression is associated with T-cell inhibitory networks, correlation analyses were performed between SETD5 and key immune checkpoint genes across six tumor types. Among these, COAD and READ exhibited the most consistent and pronounced correlation patterns and were therefore selected for presentation in the main figure (Figure 7).
Tumor type-specific correlations between SETD5 and immune checkpoint genes were observed. In COAD and READ, SETD5 showed modest positive correlations with all evaluated immune checkpoint genes, with the highest values observed for CD274 (PD-L1; ρ = 0.29 and ρ = 0.38, respectively) and CTLA4 (ρ = 0.27 and ρ = 0.39, respectively). Correlations with HAVCR2 (TIM-3; ρ = 0.21 and ρ = 0.24) and PDCD1 (PD-1; ρ = 0.16 and ρ = 0.17) were comparatively weaker. Notably, among the checkpoint molecules themselves, strong inter-checkpoint correlations were observed, particularly between LAG3 and PDCD1 (ρ = 0.84 in COAD; ρ = 0.78 in READ), and between CTLA4 and PDCD1 (ρ = 0.75 in COAD; ρ = 0.69 in READ), suggesting coordinated checkpoint co-expression in these tumor microenvironments. In contrast, LUSC, SETD5 showed near-zero or slightly negative correlations with CTLA4 (ρ = −0.03), PDCD1 (ρ = −0.02), and HAVCR2 (ρ = −0.08), indicating tumor-type specificity in the SETD5–checkpoint relationship. Correlation analyses for the remaining four tumor types are provided in Supplementary Figure S2A–D.

3.8. SETD5 Expression Shows Tumor-Specific Associations with Overall Survival

Survival analyses were performed to investigate the prognostic relevance of SETD5 expression across tumor types. Although most cancers did not exhibit statistically significant associations between SETD5 expression and overall survival, tumor-specific effects were observed in selected cohorts (Supplementary Figure S3). In LIHC, elevated SETD5 expression was associated with worse overall survival (HR = 1.61, 95% CI: 1.13–2.28, p = 0.073). In contrast, in READ, higher SETD5 expression correlated with improved survival outcomes (HR = 0.42, 95% CI: 0.19–0.95, p = 0.031). These findings suggest that the prognostic impact of SETD5 may be context-dependent and influenced by tumor-specific biological programs.

4. Discussion

The present study suggests that SETD5 is recurrently dysregulated across multiple cancer types through coordinated transcriptional, genetic, and epigenetic mechanisms. Our pan-cancer analysis reveals consistent upregulation in nine distinct malignancies, accompanied by tumor-specific patterns of promoter methylation and copy-number alterations. Beyond these genomic and epigenomic features, our findings further demonstrate that elevated SETD5 expression is associated with immune-related transcription programs, including coordinated expression of multiple immune checkpoint genes across tumor types. Collectively, these findings support the hypothesis that SETD5 acts as a candidate epigenetic regulator of oncogenic and immunomodulatory programs and suggest a potential role in cancer-associated transcriptional reprogramming that extends to the shaping of the tumor immune microenvironment.
The observed upregulation of SETD5 in BLCA, COAD, ESCA, HNSC, LUSC, and LUAD aligns with evidence from large-scale transcriptomic profiling and functional genomic screens that have recurrently identified epigenetic regulators as dysregulated across multiple tumor types [16,17,18]. While SET domain-containing proteins have been extensively characterized as key regulators of chromatin states, SETD5 has remained comparatively understudied despite its structural similarity to established histone methyltransferases. These findings indicate that SETD5 expression is elevated independently of high mutation burden, suggesting that genetic alterations are not the primary driver of its deregulation in most tumor contexts [18]. The consistent upregulation of SETD5 across multiple cancer types, coupled with its integration into chromatin regulatory networks, suggests potential vulnerabilities that may be therapeutically exploited. The development of selective small-molecule inhibitors targeting SET domain methyltransferases has shown promise in preclinical models [19,20].
The mutation frequencies observed in colorectal (COAD: 3.9%; READ: 4.7%) and lung squamous cell carcinoma (5.9%) are consistent with the hypermutated phenotypes characteristic of these malignancies [21,22]. However, the predominance of missense over truncating mutations suggests selective pressure to maintain SETD5 catalytic function rather than loss-of-function. Copy-number analysis revealed appreciable amplification frequencies in esophageal carcinoma (ESCA; 2.6%) and bladder urothelial carcinoma (BLCA; 7.5%). These findings are consistent with the well-established role of chromosomal instability in driving recurrent copy-number alteration in cancer that SETD5 amplification occurs in a subset of ESCA and BLCA tumors [23,24].
Our methylation profiling showed tumor-type specificity in SETD5 promoter methylation, with hypomethylation observed in BLCA and LIHC correlating inversely with elevated expression. This result is consistent with previous observations that promoter hypomethylation may contribute to transcriptional activation [5,25]. In contrast, the analysis of HNSC, LUAD and LUSC revealed a pattern of hypermethylation accompanied by elevated SETD5 expression. This finding suggests the potential involvement of alternative regulatory mechanisms, such as enhancer activation, chromatin remodeling, or transcription factor binding, which may supersede the effects of methylation-mediated repression in these specific contexts [26]. The absence of statistical significance in COAD and READ, despite discernible trends toward hypomethylation, may be indicative of limited representation of normal tissue in the TCGA cohorts. These observations are based on a promoter-associated probe, and future studies evaluating additional promoter sites across the SETD5 locus may provide a more comprehensive characterization of its methylation profile.
Protein interaction network analysis based on STRING identified THUMPD3, KMT2E (MLL5), SETD2 and SETD4 as predicted functional partners of SETD5, with interaction scores of 0.732, 0.702, 0.599 and 0.576, respectively. Despite the absence of direct biochemical validation of these interactions, the association of SETD5 with chromatin regulators that share the SET-domain architecture, or the function of chromatin remodeling suggests the potential for these proteins to participate in shared, chromatin-associated regulatory assemblies. It has been noted that KMT2E, a member of the MLL family of H3K4 methyltransferases, is frequently mutated in microsatellite instability–high colorectal tumors. This feature has been associated with reduced gene expression [27]. Similarly, SETD2, a well-established tumor suppressor, exhibits a high mutation frequency in colorectal cancer, consistent with loss-of-function events [28]. SETD4 is overexpressed in several tumor types, and its epigenetic mechanism is associated with tumor progression [29]. Taken together, these observations suggest that, in network-based analysis, chromatin regulators that are positively associated with SETD5 may be functionally compromised in colorectal tumors, potentially influencing chromatin-dependent transcriptional regulation in this context.
THUMPD3 is a methyltransferase that forms a complex with TRMT112 to catalyze N2-methylguanosine (m2G) formation at the sixth or seventh guanine position of tRNA [30,31]. The association between SETD5 and THUMPD3 may be related to their proximity on chromosome 3p25.3 [32]. Notably, SETD5-AS1, also known as THUMPD3-AS1 according to NCBI Gene, is an antisense transcript implicated in the regulation of epigenetic modifications [33]. Therefore, we hypothesize that the high interaction scores between SETD5 and THUMPD3 may be mediated by this overlapping antisense lncRNA, which could regulate the expression of both genes. Additionally, a recent study showed that ANKRD11 (0.669) has been described as a transcriptional regulator of SETD5, being responsible for recruiting WDR5 and increasing H3K4me3 levels at the SETD5 promoter region [34].
Gene Ontology and KEGG pathway enrichment analyses demonstrated significant representation of SETD5-associated genes in macromolecule methylation (GO:0043414), protein methylation (GO:0006479), and peptidyl-lysine methylation (GO:0018022), consistent with its predicted role as a chromatin-associated epigenetic regulator [35,36]. Enrichment in transcription elongation by RNA polymerase II (GO:0006368) and DNA-templated transcription elongation (GO:0006354) further supports the hypothesis that SETD5 functions within the transcriptional machinery to modulate gene expression kinetics [37,38]. The enrichment of the KEGG pathway “Lysine degradation” (hsa00310) is a subject of particular interest, as lysine metabolism is increasingly recognized as a metabolic vulnerability in cancer, with therapeutic implications for targeting epigenetic regulators [39,40]. CDK12 was strongly correlated with SETD5 (0.590) and regulates transcription through RNA polymerase II phosphorylation, as indicated by our KEGG analysis. CDK12 is overexpressed in various cancer types and contributes to oncogenesis by promoting the WNT/β-catenin and MAPK pathways. In addition, it is associated with modulation of the tumor microenvironment, facilitating immune evasion through the upregulation of PD-1 and CTLA-4 and the recruitment of immunosuppressive cells [41].
An emerging dimension of SETD5 biology pertains to its role in metabolic reprogramming. In breast cancer, Yang et al. demonstrated that SETD5 is enriched in cancer stem-like cells and promotes glycolysis through the EP300/HIF-1α axis, with SETD5 knockdown significantly reducing hexokinase-2 and PFKFB3 expression under hypoxic conditions [9]. Similarly, Shi et al. showed that SETD5 silencing in gastric cancer cells inhibited glycolysis and tumor growth through downregulation of the AKT signaling pathway [42]. Most recently, Liu et al. (2025) demonstrated that SETD5 functions as an active H3K36me3 methyltransferase in non-small cell lung cancer, where it facilitates stemness and represses ferroptosis through m6A-mediated PKM2 stabilization involving METTL14 and YTHDF1 [11]. These findings are particularly relevant to our observation of SETD5 upregulation in LUAD, LUSC, and STAD, as they suggest that elevated SETD5 expression may confer metabolic advantages to tumor cells beyond the transcriptional regulatory functions identified in our enrichment analyses. The convergence of epigenetic regulation, metabolic adaptation, and cancer stemness maintenance through SETD5 underscores its potential as a multifaceted therapeutic target.
Importantly, the molecular mechanism by which SETD5 exerts its regulatory functions may not be limited to canonical histone methyltransferase activity. Wang et al. (2020) demonstrated in pancreatic ductal adenocarcinoma that SETD5 lacks direct histone methyltransferase activity but instead scaffolds a co-repressor complex containing HDAC3 and G9a, thereby coupling selective H3K9 deacetylation with methylation at target gene promoters [10]. This scaffolding function directed the silencing of drug resistance-associated genes and the pharmacological co-targeting of MEK1/2, HDAC3, and G9a sustained tumor growth inhibition in vivo. Furthermore, Park et al. (2022) showed in hepatocellular carcinoma that SETD5 depletion downregulated interferon-mediated inflammatory responses and reduced PKM expression, leading to decreased glycolysis activity [43]. The finding that SETD5 loss compromises interferon signaling in liver cancer cells is of particular significance in the context of our immunogenomic results, as it provides a potential mechanistic link between SETD5 expression levels and both the immune checkpoint signatures and the innate immune cell infiltration patterns such as macrophages and dendritic cells observed across tumor types. These complementary functional data suggest that SETD5 may operate as a context-dependent epigenetic scaffolding protein whose deregulation is associated with transcriptional fidelity, metabolic programming, and immune signaling pathways.
We investigated the relationship between SETD5 and the tumor immune microenvironment to explore mechanisms that may underlie its context-dependent prognostic associations. Our immunogenomic analysis revealed that elevated SETD5 expression is preferentially associated with innate immune cell infiltration such as macrophages, neutrophils, and dendritic cells while associations with cytotoxic lymphocytes were variable and tumor-type dependent, being absent in ESCA and HNSC. Although correlations between SETD5 and individual immune checkpoint genes were modest in magnitude (ρ = 0.11–0.39 across tumor types), strong inter-checkpoint co-expression was observed, particularly between LAG3 and PDCD1 (ρ = 0.84 in COAD; ρ = 0.78 in READ), CTLA4 and PDCD1 (ρ = 0.75 in COAD; ρ = 0.69 in READ), and HAVCR2 and LAG3 (ρ = 0.69 in COAD; ρ = 0.66 in READ). This pattern of coordinated checkpoint co-expression, rather than a direct SETD5–checkpoint relationship, is consistent with SETD5 marking a tumor state in which T-cell exhaustion programs are broadly engaged. Exhausted T cells express high levels of inhibitory receptors including PD-1, CTLA-4, LAG-3, and TIM-3, which severely limit their proliferative and cytotoxic capacity [44,45]. Notably, co-expression of TIM-3 with PD-1 identifies the most severely exhausted CD8+ T cell subset, characterized by reduced ability to proliferate and secrete IL-2, TNF, and IFN-γ [44,46,47]. Meta-analyses have demonstrated that high TIM-3 expression is an independent prognostic indicator for poor overall survival (HR = 1.54–1.67) across multiple cancer types [48,49], with TIM-3 positivity correlating with worse progression-free survival in various malignancies [50]. Taken together, the predominance of innate immune cell associations including macrophages and neutrophils alongside the coordinated checkpoint co-expression observed in SETD5-high tumors, suggests an immune landscape shaped by innate immunosuppression rather than adaptive cytotoxic activity, with critical implications for immunotherapy responsiveness.
The immunosuppressive character of this microenvironment is further supported by the robust correlations between SETD5 and innate immune populations, most notably macrophages, neutrophils, and dendritic cells alongside the coordinated checkpoint co-expression patterns described above. Tumor-associated macrophages (TAMs) create immunosuppressive niches through PD-L1 expression and secretion of arginase 1, IL-10, and TGF-β [51,52], which inhibit CD8+ T cell function and promote T cell exhaustion [44,45]. Tumor-associated neutrophils (TANs) can adopt both anti-tumorigenic (N1) and pro-tumorigenic (N2) phenotypes, with the latter promoting angiogenesis, matrix remodeling, and immunosuppression through secretion of VEGF, MMP-9, and TGF-β [53], suggesting a potential role for SETD5 in fostering a pro-tumorigenic innate immune niche. Similarly, tumor-associated dendritic cells with compromised antigen-presenting function promote immunosuppression through secretion of VEGF, TGF-β, and IL-10 [54,55]. While immune checkpoint inhibitors have demonstrated clinical efficacy in various solid tumors [56], resistance remains a significant challenge. Our analysis cannot determine whether SETD5-high tumors would respond to immunotherapy or exhibit resistance mechanisms, such as primary resistance in tumors with predominant innate immune infiltration and limited cytotoxic T-cell engagement (as observed in ESCA and HNSC); adaptive resistance with upregulation of alternative checkpoints (TIM-3, LAG-3, TIGIT) during treatment; or acquired resistance through mutations in antigen presentation or interferon-γ signaling pathways [4,57]. Given the limitations of bulk RNA-seq deconvolution analyses, future single-cell RNA sequencing and spatial transcriptomics studies will be important to validate these associations and define the cellular and spatial context of SETD5 within the tumor microenvironment.
The convergence of our immunogenomic findings characterized by innate immune cell infiltration, modest SETD5–checkpoint correlations, and strong inter-checkpoint co-expression with the growing body of functional evidence on SETD5 supports a model in which SETD5 overexpression marks, and may contribute to, the establishment of an immunosuppressive tumor microenvironment through multiple, potentially interconnected mechanisms. SETD5-mediated regulation of interferon signaling pathways, as demonstrated in hepatocellular carcinoma [43], may directly influence the expression of immune checkpoint molecules and the polarization state of infiltrating innate immune cells, including macrophages and dendritic cells, the populations most consistently correlated with SETD5 expression in our analysis. Concurrently, SETD5-driven metabolic reprogramming, particularly glycolysis enhancement through the EP300/HIF-1α axis [9] and PKM2 nuclear translocation [11], could create a lactate-rich microenvironment that further promotes macrophage polarization toward immunosuppressive phenotypes and neutrophil recruitment to the tumor microenvironment. Notably, the near-zero and slightly negative correlations between SETD5 and checkpoint molecules observed in LUSC (CTLA4: ρ = −0.03; PDCD1: ρ = −0.02; HAVCR2: ρ = −0.08) underscore the tumor-type specificity of these relationships and caution against generalizing a single mechanistic model across all SETD5-overexpressing malignancies. This integrative view positions SETD5 at the intersection of epigenetic, metabolic, and immune regulatory circuits, providing a rationale for combinatorial therapeutic strategies targeting SETD5-associated pathways in conjunction with immune checkpoint inhibitors, although these findings remain correlative and require experimental validation.
This study has limitations that should be acknowledged. First, although robust, our analyses are based on publicly available in silico data, and the correlative nature of the findings precludes causal inference. The positive correlations between SETD5 expression and immune cell infiltration scores for macrophages, neutrophils, and dendritic cells derived from bulk RNA-seq deconvolution algorithms such as CIBERSORT, cannot distinguish between genuine immune cell presence and potential computational artifacts. Furthermore, the absence of detectable correlations for CD8+ T cells in ESCA and HNSC, and for B cells in most cohorts, may reflect biological tumor-type specificity or limitations of the deconvolution algorithm in resolving rare cell populations in these datasets. Second, the TCGA datasets used in this study lack matched normal tissue controls for several cancer types, which may limit the statistical power of methylation and expression comparisons, as observed for COAD and READ. Third, while we identified consistent positive correlations between SETD5 and immune checkpoint genes most notably CD274 and HAVCR2 in gastrointestinal tumor types these associations are modest in magnitude and do not establish that SETD5 directly regulates checkpoint expression or T-cell exhaustion. The observed correlation may reflect shared upstream regulatory mechanisms or co-regulation by third-party factors. Finally, we acknowledge that future studies using SETD5 knockout or knockdown models, coupled with single-cell RNA sequencing of the tumor immune microenvironment, will be essential to delineate the causal relationships suggested by our integrative analysis.
In this study, we performed a comprehensive pan-cancer characterization of SETD5 across nine malignancies by integrating transcriptomic, genomic, epigenetic, and immunogenomic data. SETD5 was consistently overexpressed in tumor tissues compared with normal controls, predominantly independent of mutation burden. Instead, promoter hypomethylation and copy-number amplification emerged as potential drivers of SETD5 deregulation, particularly in BLCA, LIHC, and ESCA. Functional enrichment analyses further associated SETD5 with chromatin-related regulatory complexes involved in macromolecule methylation and transcriptional elongation, supporting its proposed role in epigenetic regulation. Immunogenomic analyses revealed that elevated SETD5 expression correlates with increased infiltration of innate immune populations, including macrophages, neutrophils and dendritic cells across tumor types, with variable CD8+ T cell associations depending on tumor context. Additionally, SETD5-high tumors were characterized by strong coordinated co-expression among immune checkpoint genes, suggesting a tumor microenvironment permissive to immune evasion.

5. Conclusions

Collectively, our findings suggests a model in which SETD5 may promote tumor progression through interconnected mechanisms involving epigenetic reprogramming, metabolic adaptation, and modulation of the tumor immune microenvironment, including association with coordinated checkpoint programs and immune cell exhaustion signatures. Although our analyses are primarily correlative, the integration of pan-cancer data with previously reported functional evidence highlights SETD5 as a promising candidate for future mechanistic and translational studies.

Supplementary Materials

The following supporting information can be downloaded at: https://www.mdpi.com/article/10.3390/cimb48070742/s1.

Author Contributions

A.C.M.G.: Data curation, investigation, methodology, writing—original draft, and project administration. B.L.d.O.S.: Data curation, investigation, methodology, writing—original draft. M.B.d.L.: Data curation, investigation, methodology, writing—original draft. Y.S.d.C.: Data curation, writing—original draft. F.P.-S.: Project administration, supervision, writing—review and editing. All authors have read and agreed to the published version of the manuscript.

Funding

This work was supported by grants from the Conselho Nacional de Desenvolvimento Científico e Tecnológico (CNPq; grant no. 405618/2025-5), awarded to FP-S, and the Fundação de Amparo à Pesquisa do Distrito Federal (FAPDF; grant no. 00193-00002417/2023-55), awarded to ACMG.

Institutional Review Board Statement

Not applicable.

Informed Consent Statement

Not applicable.

Data Availability Statement

The data sets and methods used and/or analyzed in the current study are available within the manuscript. All data analyzed and materials used in this study are available from the corresponding author upon request.

Acknowledgments

We would like to thank all the members of the Laboratory of Molecular Pathology of Cancer, Faculty of Health Sciences, University of Brasilia.

Conflicts of Interest

The authors declare that there are no conflicts of interest regarding the publication of this article.

Abbreviations

The following abbreviations are used in this manuscript:
SETD5 SET domain-containing protein 5
CNACopy number alteration
GISTICGenomic Identification of Significant Targets in Cancer
TCGAThe Cancer Genome Atlas
PPIProtein–protein interaction
GOGene ontology
KEGGKyoto Encyclopedia of Genes and Genomes
TPMTranscripts per million
AMPGene amplification
BLCABladder urothelial carcinoma
COADColon adenocarcinoma
ESCAEsophageal carcinoma
HNSCHead and neck squamous cell carcinoma
LIHCLiver hepatocellular carcinoma
LUADLung adenocarcinoma
LUSCLung squamous cell carcinoma
READRectum adenocarcinoma
STADStomach adenocarcinoma
TAMTumor-associated macrophage
TANTumor-associated neutrophil

References

  1. Hanahan, D. Hallmarks of cancer: New dimensions. Cancer Discov. 2022, 12, 31–46. [Google Scholar] [CrossRef] [Scilit] [PubMed]
  2. Flavahan, W.A.; Gaskell, E.; Bernstein, B.E. Epigenetic plasticity and the hallmarks of cancer. Science 2017, 357, eaal2380. [Google Scholar] [CrossRef] [Scilit] [PubMed]
  3. Peng, D.; Kryczek, I.; Nagarsheth, N.; Zhao, L.; Wei, S.; Wang, W.; Sun, Y.; Zhao, E.; Vatan, L.; Szeliga, W.; et al. Epigenetic silencing of TH1-type chemokines shapes tumour immunity and immunotherapy. Nature 2015, 527, 249–253. [Google Scholar] [CrossRef] [Scilit] [PubMed]
  4. Sharma, P.; Hu-Lieskovan, S.; Wargo, J.A.; Ribas, A. Primary, adaptive, and acquired resistance to cancer immunotherapy. Cell 2017, 168, 707–723. [Google Scholar] [CrossRef] [Scilit] [PubMed]
  5. Feinberg, A.P.; Koldobskiy, M.A.; Göndör, A. Epigenetic modulators, modifiers and mediators in cancer a etiology and progression. Nat. Rev. Genet. 2016, 17, 284–299. [Google Scholar] [CrossRef] [Scilit] [PubMed]
  6. Zhou, X.; Chen, W.; Zhuang, D.; Xu, G.; Puyang, Y.; Rui, H. Knockdown of SETD5 inhibits colorectal cancer cell growth and stemness by regulating PI3K/AKT/mTOR pathway. Biochem. Genet. 2025, 63, 1924–1937. [Google Scholar] [PubMed]
  7. Taneja, L.; Bhardwaj, S.; Yadav, A.K. SETD5 in glioma cells conferred TRAIL resistance induction. Sci. Rep. 2025, 15, 33520. [Google Scholar] [CrossRef] [Scilit] [PubMed]
  8. Abe, M.; Kubota, N.; Yamazaki, K.; Miura, E.; Hirabayashi, K.; Ishii, M.; Shirakawa, H.; Kikuta, K.; Murayama, Y.; Nakagawa, R.; et al. High immunohistochemical expression of SETD5 as a candidate pathological factor for dedifferentiation and prognosis in liposarcoma. Pathol. Int. 2025, 76, e70076. [Google Scholar] [CrossRef] [Scilit] [PubMed]
  9. Yang, Z.; Zhang, C.; Liu, X.; Che, N.; Feng, Y.; Xuan, Y. SETD5 regulates glycolysis in breast cancer stem-like cells and fuels tumor growth. Am. J. Pathol. 2022, 192, 712–721. [Google Scholar] [CrossRef] [Scilit] [PubMed]
  10. Wang, Z.; Hausmann, S.; Lyu, R.; Li, T.-M.; Lofgren, S.M.; Flores, N.M.; Fuentes, M.E.; Caporicci, M.; Yang, Z.; Meiners, M.J.; et al. SETD5-coordinated chromatin reprogramming regulates adaptive resistance to targeted pancreatic cancer therapy. Cancer Cell 2020, 37, 834–849.e13. [Google Scholar] [CrossRef] [Scilit] [PubMed]
  11. Liu, X.; Cui, Y.; Gong, J.; Yu, X.; Cui, Y.; Xuan, Y. SETD5 facilitates stemness and represses ferroptosis via m6A-mediating PKM2 stabilization in non-small cell lung cancer. Oncogene 2025, 44, 2474–2489. [Google Scholar] [PubMed]
  12. Li, M.; Hou, Y.; Zhang, Z.; Zhang, B.; Huang, T.; Sun, A.; Shao, G.; Lin, Q. Structure, activity and function of the lysine methyltransferase SETD5. Front. Endocrinol. 2023, 14, 1089527. [Google Scholar] [CrossRef] [Scilit]
  13. Jiang, Z.; Zhao, J.; Zou, H.; Cai, K. CircRNA PTPRM promotes non-small cell lung cancer progression by modulating the miR-139-5p/SETD5 axis. Technol. Cancer Res. Treat. 2022, 21, 15330338221090090. [Google Scholar] [PubMed]
  14. Poissonnier, L.; Villain, G.; Soncin, F.; Mattot, V. miR126-5p repression of ALCAM and SetD5 in endothelial cells regulates leucocyte adhesion and transmigration. Cardiovasc. Res. 2014, 102, 436–447. [Google Scholar] [CrossRef] [Scilit] [PubMed]
  15. Yu, G.; Wang, L.G.; Han, Y.; He, Q.Y. clusterProfiler: An R package for comparing biological themes among gene clusters. Omics 2012, 16, 284–287. [Google Scholar] [CrossRef] [Scilit] [PubMed]
  16. Lazaro-Camp, V.J.; Salari, K.; Meng, X.; Yang, S. SETDB1 in cancer: Overexpression and its therapeutic implications. Am. J. Cancer Res. 2021, 11, 1803–1827. [Google Scholar] [CrossRef] [Scilit] [PubMed]
  17. Han, T.-S.; Kim, D.-S.; Son, M.-Y.; Cho, H.-S. SMYD family in cancer: Epigenetic regulation and molecular mechanisms of cancer proliferation, metastasis, and drug resistance. Exp. Mol. Med. 2024, 56, 2325–2336. [Google Scholar] [CrossRef] [Scilit] [PubMed]
  18. Vogelstein, B.; Papadopoulos, N.; Velculescu, V.E.; Zhou, S.; Diaz, L.A., Jr.; Kinzler, K.W. Cancer genome landscapes. Science 2013, 339, 1546–1558. [Google Scholar] [CrossRef] [Scilit] [PubMed]
  19. McCabe, M.T.; Ott, H.M.; Ganji, G.; Korenchuk, S.; Thompson, C.; Van Aller, G.S.; Liu, Y.; Graves, A.P.; Iii, A.D.P.; Diaz, E.; et al. EZH2 inhibition as a therapeutic strategy for lymphoma with EZH2-activating mutations. Nature 2012, 492, 108–112. [Google Scholar] [CrossRef] [Scilit] [PubMed]
  20. Copeland, R.; Solomon, M.; Richon, V. Protein methyltransferases as a target class for drug discovery. Nat. Rev. Drug Discov. 2009, 8, 724–732. [Google Scholar] [CrossRef] [Scilit] [PubMed]
  21. De Angelis, M.T.; Rizzuto, A.; Amaddeo, A.; Sagnelli, C.; Vono, N.; Reda, M.; Lise, V.; Parrillo, L.; De Marco, C.; Malanga, D.; et al. Distinctive chromosomal, mutational and transcriptional profiling in colon versus rectal cancers. J. Transl. Med. 2025, 23, 869. [Google Scholar] [CrossRef] [Scilit] [PubMed]
  22. Zengin, T.; Önal-Süzek, T. Comprehensive profiling of genomic and transcriptomic differences between risk groups of lung adenocarcinoma and lung squamous cell carcinoma. J. Pers. Med. 2021, 11, 154. [Google Scholar] [CrossRef] [Scilit] [PubMed]
  23. Beroukhim, R.; Mermel, C.H.; Porter, D.; Wei, G.; Raychaudhuri, S.; Donovan, J.; Barretina, J.; Boehm, J.S.; Dobson, J.; Urashima, M.; et al. The landscape of somatic copy-number alteration across human cancers. Nature 2010, 463, 899–905. [Google Scholar] [CrossRef] [Scilit] [PubMed]
  24. Zack, T.I.; Schumacher, S.E.; Carter, S.L.; Cherniack, A.D.; Saksena, G.; Tabak, B.; Lawrence, M.S.; Zhang, C.-Z.; Wala, J.; Mermel, C.H.; et al. Pan-cancer patterns of somatic copy number alteration. Nat. Genet. 2013, 45, 1134–1140. [Google Scholar] [CrossRef] [Scilit] [PubMed]
  25. Van Tongelen, A.; Loriot, A.; De Smet, C. Oncogenic roles of DNA hypomethylation through the activation of cancer-germline genes. Cancer Lett. 2017, 396, 130–137. [Google Scholar] [CrossRef] [Scilit] [PubMed]
  26. Smith, J.; Sen, S.; Weeks, R.J.; Eccles, M.R.; Chatterjee, A. Promoter DNA hypermethylation and paradoxical gene activation. Trends Cancer 2020, 6, 392–406. [Google Scholar] [CrossRef] [Scilit] [PubMed]
  27. Zhu, J.; Liu, Z.; Liang, X.; Wang, L.; Wu, D.; Mao, W.; Shen, D. A pan-cancer study of KMT2 family as therapeutic targets in cancer. J. Oncol. 2022, 2022, 3982226. [Google Scholar] [CrossRef] [Scilit] [PubMed]
  28. Bushara, O.; Wester, J.R.; Jacobsen, D.; Sun, L.; Weinberg, S.; Gao, J.; Jennings, L.J.; Wang, L.; Lauberth, S.M.; Yue, F.; et al. Clinical and histopathologic characterization of SETD2-mutated colorectal cancer. Hum. Pathol. 2023, 131, 9–16. [Google Scholar] [CrossRef] [Scilit] [PubMed]
  29. Zhong, Y.; Wang, R.; Huang, Z.; Hu, Z.; Peng, B.; Chen, B.; Sun, L. Identification of SETD4 as an onco-immunological biomarker encompassing the tumor microenvironment, prognoses, and therapeutic responses in various human cancers. Immun. Inflamm. Dis. 2025, 13, e70126. [Google Scholar] [CrossRef] [Scilit] [PubMed]
  30. Yang, W.-Q.; Xiong, Q.-P.; Ge, J.-Y.; Li, H.; Zhu, W.-Y.; Nie, Y.; Lin, X.; Lv, D.; Li, J.; Lin, H.; et al. THUMPD3-TRMT112 is a m2G methyltransferase working on a broad range of tRNA substrates. Nucleic Acids Res. 2021, 49, 11900–11919. [Google Scholar] [CrossRef] [Scilit] [PubMed]
  31. Wang, C.; Ulryck, N.; Herzel, L.; Pythoud, N.; Kleiber, N.; Guérineau, V.; Jactel, V.; Moritz, C.; Bohnsack, M.T.; Carapito, C.; et al. N2-methylguanosine modifications on human tRNAs and snRNA U6 are important for cell proliferation, protein translation and pre-mRNA splicing. Nucleic Acids Res. 2023, 51, 7496–7519. [Google Scholar] [CrossRef] [Scilit] [PubMed]
  32. Kuechler, A.; Zink, A.M.; Wieland, T.; Lüdecke, H.-J.; Cremer, K.; Salviati, L.; Magini, P.; Najafi, K.; Zweier, C.; Czeschik, J.C.; et al. Loss-of-function variants of SETD5 cause intellectual disability and the core phenotype of microdeletion 3p25.3 syndrome. Eur. J. Hum. Genet. 2015, 23, 753–760. [Google Scholar] [CrossRef] [Scilit] [PubMed]
  33. Fan, L.; Sun, W.; Lyu, Y.; Ju, F.; Sun, W.; Chen, J.; Ma, H.; Yang, S.; Zhou, X.; Wu, N.; et al. Chrom-seq identifies RNAs at chromatin marks. Sci. Adv. 2024, 10, eadn1397. [Google Scholar] [CrossRef] [Scilit] [PubMed]
  34. Sashiyama, S.; Nakagawa, T.; Nakagawa, M.; Hosogane, M.; Watanabe, Y.; Ashitomi, H.; Yamane, K.; Shibuya, N.; Moroishi, T.; Nakayama, K.; et al. KBG syndrome-associated protein ANKRD11 regulates SETD5 expression to modulate rRNA levels and translation. iScience 2025, 28, 112699. [Google Scholar] [CrossRef] [Scilit] [PubMed]
  35. Black, J.C.; Van Rechem, C.; Whetstine, J.R. Histone lysine methylation dynamics: Establishment, regulation, and biological impact. Mol. Cell. 2012, 48, 491–507. [Google Scholar] [CrossRef] [Scilit] [PubMed]
  36. Greer, E.L.; Shi, Y. Histone methylation: A dynamic mark in health, disease and inheritance. Nat. Rev. Genet. 2012, 13, 343–357. [Google Scholar] [CrossRef] [Scilit] [PubMed]
  37. Kwak, H.; Lis, J.T. Control of transcriptional elongation. Annu. Rev. Genet. 2013, 47, 483–508. [Google Scholar] [CrossRef] [Scilit] [PubMed]
  38. Jonkers, I.; Lis, J.T. Getting up to speed with transcription elongation by RNA polymerase II. Nat. Rev. Mol. Cell Biol. 2015, 16, 167–177. [Google Scholar] [CrossRef] [Scilit] [PubMed]
  39. Sun, L.; Zhang, H.; Gao, P. Metabolic reprogramming and epigenetic modifications on the path to cancer. Protein Cell 2022, 13, 877–919. [Google Scholar] [CrossRef] [Scilit] [PubMed]
  40. Shen, R.; Ruan, H.; Lin, S.; Liu, B.; Song, H.; Li, L.; Ma, T. Lysine succinylation, the metabolic bridge between cancer and immunity. Genes Dis. 2022, 10, 2470–2478. [Google Scholar] [PubMed]
  41. Lu, K.-Q.; Li, Z.-L.; Zhang, Q.; Yin, Q.; Zhang, Y.-L.; Ni, W.-J.; Jiang, L.-Z.; He, W.; Wang, B. CDK12 is a potential biomarker for diagnosis, prognosis and immunomodulation in pan-cancer. Sci. Rep. 2024, 14, 6574. [Google Scholar] [CrossRef] [Scilit] [PubMed]
  42. Shi, J.; Yu, L.; Zhu, C.; Zhong, H. Knockdown of SETD5 inhibited glycolysis and tumor growth in gastric cancer cells by down-regulating Akt signaling pathway. Open Life Sci. 2023, 18, 20220697. [Google Scholar] [CrossRef] [Scilit] [PubMed]
  43. Park, M.; Moon, B.; Kim, J.-H.; Park, S.-J.; Kim, S.-K.; Park, K.; Kim, J.; Kim, S.-Y.; Kim, J.-H.; Kim, J.-A. Downregulation of SETD5 suppresses the tumorigenicity of hepatocellular carcinoma cells. Mol. Cells 2022, 45, 550–563, Correction in Mol. Cells 2022, 45, 761. [Google Scholar] [CrossRef] [Scilit] [PubMed]
  44. McLane, L.M.; Abdel-Hakeem, M.S.; Wherry, E.J. CD8 T cell exhaustion during chronic viral infection and cancer. Annu. Rev. Immunol. 2019, 37, 457–495. [Google Scholar] [CrossRef] [Scilit] [PubMed]
  45. Wherry, E.J.; Kurachi, M. Molecular and cellular insights into T cell exhaustion. Nat. Rev. Immunol. 2015, 15, 486–499. [Google Scholar] [CrossRef] [Scilit] [PubMed]
  46. Sakuishi, K.; Apetoh, L.; Sullivan, J.M.; Blazar, B.R.; Kuchroo, V.K.; Anderson, A.C. Targeting Tim-3 and PD-1 pathways to reverse T cell exhaustion and restore anti-tumor immunity. J. Exp. Med. 2010, 207, 2187–2194. [Google Scholar] [CrossRef] [Scilit] [PubMed]
  47. Fourcade, J.; Sun, Z.; Benallaoua, M.; Guillaume, P.; Luescher, I.F.; Sander, C.; Kirkwood, J.M.; Kuchroo, V.; Zarour, H.M. Upregulation of Tim-3 and PD-1 expression is associated with tumor antigen-specific CD8+ T cell dysfunction in melanoma patients. J. Exp. Med. 2010, 207, 2175–2186. [Google Scholar] [CrossRef] [Scilit] [PubMed]
  48. Zang, K.; Hui, L.; Wang, M.; Huang, Y.; Zhu, X.; Yao, B. TIM-3 as a prognostic marker and a potential immunotherapy target in human malignant tumors: A meta-analysis and bioinformatics validation. Front. Oncol. 2021, 11, 579351. [Google Scholar] [CrossRef] [Scilit] [PubMed]
  49. Xu, W.; Qi, F.; Jiao, R.; Zheng, L.; Zhang, Y.; Hou, D.; Liu, Y.; Kang, Z. Prognostic and clinicopathological value of high expression of TIM-3 in different cancer types: A meta-analysis. Precis. Med. Sci. 2020, 9, 47–58. [Google Scholar] [CrossRef] [Scilit]
  50. Granier, C.; Dariane, C.; Combe, P.; Verkarre, V.; Urien, S.; Badoual, C.; Roussel, H.; Mandavit, M.; Ravel, P.; Sibony, M.; et al. Tim-3 expression on tumor-infiltrating PD-1+CD8+ T cells correlates with poor clinical outcome in renal cell carcinoma. Cancer Res. 2017, 77, 1075–1082. [Google Scholar] [CrossRef] [Scilit] [PubMed]
  51. Kuang, D.-M.; Zhao, Q.; Peng, C.; Xu, J.; Zhang, J.-P.; Wu, C.; Zheng, L. Activated monocytes in peritumoral stroma of hepatocellular carcinoma foster immune privilege and disease progression through PD-L1. J. Exp. Med. 2009, 206, 1327–1337. [Google Scholar] [CrossRef] [Scilit] [PubMed]
  52. Pan, Y.; Yu, Y.; Wang, X.; Zhang, T. Tumor-associated macrophages in tumor immunity. Front. Immunol. 2020, 11, 583084. [Google Scholar] [CrossRef] [Scilit] [PubMed]
  53. Jaillon, S.; Ponzetta, A.; Di Mitri, D.; Santoni, A.; Bonecchi, R.; Mantovani, A. Neutrophil diversity and plasticity in tumour progression and therapy. Nat. Rev. Cancer 2020, 20, 485–503. [Google Scholar] [CrossRef] [Scilit] [PubMed]
  54. Scarlett, U.K.; Rutkowski, M.R.; Rauwerdink, A.M.; Fields, J.; Escovar-Fadul, X.; Baird, J.; Cubillos-Ruiz, J.R.; Jacobs, A.C.; Gonzalez, J.L.; Weaver, J.; et al. Ovarian cancer progression is controlled by phenotypic changes in dendritic cells. J. Exp. Med. 2012, 209, 495–506. [Google Scholar] [CrossRef] [Scilit] [PubMed]
  55. Veglia, F.; Gabrilovich, D.I. Dendritic cells in cancer: The role revisited. Curr. Opin. Immunol. 2017, 45, 43–51. [Google Scholar] [CrossRef] [Scilit] [PubMed]
  56. Haslam, A.; Prasad, V. Estimation of the percentage of US patients with cancer who are eligible for and respond to checkpoint inhibitor immunotherapy drugs. JAMA Netw. Open 2019, 2, e192535. [Google Scholar] [CrossRef] [Scilit] [PubMed]
  57. Koyama, S.; Akbay, E.A.; Li, Y.Y.; Herter-Sprie, G.S.; Buczkowski, K.A.; Richards, W.G.; Gandhi, L.; Redig, A.J.; Rodig, S.J.; Asahina, H.; et al. Adaptive resistance to therapeutic PD-1 blockade is associated with upregulation of alternative immune checkpoints. Nat. Commun. 2016, 7, 10501. [Google Scholar] [CrossRef] [Scilit] [PubMed]
Figure 1. SETD5 expression in tumor and normal tissue. (A) Bladder urothelial carcinoma—BLCA. (B) Colon adenocarcinoma—COAD. (C) Esophageal carcinoma—ESCA. (D) Head and neck squamous cell carcinoma—HNSC. (E) Liver hepatocellular carcinoma—LIHC. (F) Lung adenocarcinoma—LUAD. (G) Lung squamous cell carcinoma—LUSC. (H) Rectum adenocarcinoma—READ. (I) Stomach adenocarcinoma—STAD. Unpaired T-test (* p < 0.05 and **** p < 0.0001).
Cimb 48 00742 g001
Figure 2. Frequencies of mutation types (A) Colon adenocarcinoma (COAD). (B) Rectum adenocarcinoma (READ). (C) Lung squamous cell carcinoma (LUSC). (D) Esophageal carcinoma (ESCA). (E) Lung adenocarcinoma (LUAD).
Cimb 48 00742 g002
Figure 3. SETD5 promoter methylation differences between tumor and normal tissues in TCGA datasets. Significant hypomethylation in tumors was observed in BLCA and LIHC (* p < 0.05; **** p < 0.0001), while HNSC showed tumor-specific hypermethylation (*** p < 0.001). LUAD and LUSC also exhibited higher methylation in tumor tissues (** p < 0.01; * p < 0.05). Statistical significance was determined using or Mann–Whitney U test. Dotted lines indicate the median value of each group.
Cimb 48 00742 g003
Figure 4. Protein–protein interaction network built in STRING (version 12.0), considering interactions with a score ≥ 0.4 (medium confidence). The nodes represent proteins encoded by the genes of interest, and the edges represent interactions known (from curated databases and experimental evidence) or predicted (by genomic neighborhood, gene fusions, co-occurrence, co-expression, text mining and homology).
Cimb 48 00742 g004
Figure 5. GO/KEGG pathway enrichment analysis of SETD5-related genes. The dot plot graph shows the main terms enriched in the Gene Ontology biological processes (GO BP, in red) and KEGG pathways (in blue) categories. The size of the dots indicates the number of genes associated with each pathway (Terms with an adjusted FDR below 0.05 were included).
Cimb 48 00742 g005
Figure 6. Correlation analysis between SETD5 expression and immune cell infiltration across TCGA tumor types. Heatmap colors represent correlation coefficients (ρ), ranging from negative (blue) to positive (red) correlations. Gray cells (NA) indicates that no statistically significant correlation was identified in the corresponding analysis.
Cimb 48 00742 g006
Figure 7. Correlation analysis between SETD5 and immune checkpoint genes across TCGA tumor samples. (A) COAD. (B) READ. Spearman correlation coefficients (ρ) are represented by color intensity, ranging from negative (blue) to positive (red) correlations. Only pairwise complete observations were included in the analysis.
Cimb 48 00742 g007
Table 1. Frequency of mutations and copy number alterations in 8 types of tumors.
Cancer TypeMutation
Frequency (%)
Amplification Frequency (%)Homodel Frequency (%)
COAD3.90.00.3
READ4.70.00.6
LUAD3.00.20.2
LUSC5.90.20.8
LIHC1.61.60.0
HNSC1.20.61.0
ESCA2.02.61.0
BLCA0.77.50.0
Disclaimer/Publisher’s Note: The statements, opinions and data contained in all publications are solely those of the individual author(s) and contributor(s) and not of MDPI and/or the editor(s). MDPI and/or the editor(s) disclaim responsibility for any injury to people or property resulting from any ideas, methods, instructions or products referred to in the content.