Article

Development of Chloroplast Microsatellite Markers and Assessment of Genetic Diversity and Population Structure of Sophora tonkinensis Gagnep. in Southwestern China


1
Guangxi Key Laboratory of Medicinal Resources Protection and Genetic Improvement, Guangxi Engineering Research Center of TCM Resource Intelligent Creation, National Center for TCM Inheritance and Innovation, Guangxi Botanical Garden of Medicinal Plants, Nanning 530023, China
2
School of Traditional Chinese Pharmacy, China Pharmaceutical University, Nanjing 211198, China
3
Guangxi TCM Resources General Survey and Data Collection Key Laboratory, Guangxi Botanical Garden of Medicinal Plants, Nanning 530023, China
*
Authors to whom correspondence should be addressed.
Curr. Issues Mol. Biol. 2026, 48(6), 562; https://doi.org/10.3390/cimb48060562
Submission received: 29 April 2026 / Revised: 20 May 2026 / Accepted: 26 May 2026 / Published: 28 May 2026
(This article belongs to the Special Issue Molecular Breeding and Genetics Research in Plants—3rd Edition)

Abstract

Sophora tonkinensis Gagnep. is an important medicinal shrub native to the karst regions of southwestern China, where long-term overharvesting and habitat fragmentation have markedly reduced wild resources. Although recent phytochemical, transcriptomic, and chloroplast genomic studies have improved understanding of this species, its maternally inherited population structure has remained unclear. To address this gap, we developed nine novel chloroplast simple sequence repeat (cpSSR) markers and used them to genotype 274 individuals from eighteen wild populations. A total of 41 alleles were detected, with 2–10 alleles per locus, indicating moderate to high polymorphism at the species level. By combining the nine cpSSR loci, we further identified 25 chlorotypes, including 19 private chlorotypes. Within-population chloroplast diversity was generally low, and five populations were monomorphic, whereas HJSE and LYNG retained comparatively high chlorotype diversity. Genetic differentiation among populations was extremely strong (mean FST = 0.808), whereas historical gene flow was very limited (Nm = 0.112), and AMOVA showed that 85% of total chloroplast variation occurred among populations. Taken together, chlorotype network analysis, chlorotype geographic distribution, UPGMA, PCoA, and exploratory STRUCTURE analysis supported three geographically structured chloroplast groups, indicating long-term restriction of seed-mediated dispersal across the fragmented karst landscape. These newly developed cpSSR markers and the derived chlorotype framework provide a practical basis for tracing maternal lineages, prioritizing conservation units, guiding ex situ germplasm sampling, and informing future breeding of this nationally protected species. Overall, the present results describe chloroplast-based maternal structure rather than total genome-wide diversity in S. tonkinensis.

1. Introduction

Sophora tonkinensis Gagnep. (Fabaceae) is a perennial medicinal shrub distributed mainly in the limestone-dominated karst regions of southwestern China and northern Vietnam. Its dried roots, traded as Shan-dou-gen, are widely used in traditional Chinese medicine for inflammatory disorders of the throat and upper respiratory tract. Modern phytochemical and pharmacological studies further indicate that the species is rich in quinolizidine alkaloids, flavonoids, and related bioactive metabolites with anti-inflammatory, antiviral, antioxidant, and antimicrobial activities [1,2]. However, long-term destructive root harvesting, slow natural regeneration, habitat fragmentation, and the ecological fragility of karst systems have collectively intensified the decline of wild resources [3,4]. These pressures are compounded by cultivation constraints and the growing need to balance medicinal utilization with conservation of this nationally protected plant resource in China [5,6].
Despite its medicinal importance, population-level genomic resources for S. tonkinensis are still limited. In recent years, multi-omics studies have improved our understanding of tissue-specific alkaloid and flavonoid biosynthesis in this species [1,7]. Physiological and proteomic work has also provided useful information on seed dehydration tolerance and cryopreservation, which is relevant to ex situ conservation [8]. At the organellar level, the chloroplast genome of S. tonkinensis has been assembled and compared with related taxa, providing a valuable basis for marker development and species authentication [9,10]. Nevertheless, the only published population genetic study for wild S. tonkinensis based on AFLP markers reported only moderate nuclear differentiation, leaving maternal lineage structure and historical seed-mediated dispersal largely unresolved [11].
Chloroplast simple sequence repeats (cpSSRs) are particularly suitable for addressing this gap. In most angiosperms, plastid genomes are maternally inherited and effectively haploid, so cpSSR markers are highly informative for tracing maternal lineages, historical seed movement, and phylogeographic subdivision [12,13]. Because chloroplast genomes have smaller effective population sizes than nuclear genomes, plastid markers are generally more sensitive to genetic drift, bottlenecks, and long-term geographic isolation [14,15]. Recent studies have demonstrated the utility of newly developed cpSSR panels in medicinal, endangered, and geographically structured plants, including Physalis angulata, Helichrysum italicum, Cryptomeria japonica var. sinensis, Orchidantha chinensis, Paeonia suffruticosa, and Sophora toromiro [16,17]. Similar evidence from comparative plastome and cpSSR studies in Allium, Lysionotus, and Quercus further confirms the value of chloroplast variation for marker development, lineage discrimination, and conservation-oriented genetic assessment [18,19].
This approach is especially relevant for S. tonkinensis because it occupies patchy karst limestone habitats in which populations are often separated by deep valleys, rocky outcrops, edaphic heterogeneity, and expanding human land use. Karst ecosystems are widely recognized as centers of habitat fragmentation, microenvironmental heterogeneity, and localized evolutionary divergence, all of which can strengthen spatial genetic structure and limit seed-mediated connectivity [20,21]. Recent genomic and population studies of karst or limestone-associated plants, such as Platycarya, Heteroplexis, Garcinia paucinervis, Liriodendron chinense, and Oreocharis mileensis, similarly show that topographic complexity, ecological specialization, and anthropogenic disturbance can promote strong differentiation and conservation vulnerability [3,22]. Therefore, reduced seed dispersal and long-term habitat discontinuity are expected to enhance chloroplast lineage divergence in wild S. tonkinensis populations [23,24].
Analytical frameworks integrating diversity indices, differentiation statistics, Bayesian clustering, molecular variance, and multivariate ordination are well suited for testing whether maternally inherited variation is strongly structured across the species’ range [25,26]. Beyond population description, carefully curated chloroplast datasets can illuminate the spatial history of fragmented plant lineages and provide an evidence-based foundation for conservation prioritization, ex situ sampling, seed banking, and lineage-aware translocation in fragile karst systems [27,28]. In the present study, we developed nine novel cpSSR markers from the chloroplast genome of S. tonkinensis and used them to genotype 274 individuals from 18 wild populations in southwestern China. Our objectives were to: (1) evaluate the polymorphism and informativeness of the newly developed loci; (2) quantify chloroplast diversity within and among populations; (3) reconstruct chlorotypes and characterize maternal lineage structure and geographic differentiation; and (4) identify priorities for future conservation and targeted germplasm sampling.

2. Materials and Methods

2.1. Plant Materials and Sampling Strategy

A total of 274 individuals of S. tonkinensis were sampled from eighteen wild populations distributed across Guangxi and adjacent regions of southwestern China. The populations were designated DALG, DBMA, DLSN, FSCD, FSLJ, GZZY, HJML, HJSE, LCJA, LLTS, LYLX, LYNG, MSGL, MSLD, NPDL, TEWY, YZBS, and YZDS. Within each population, 6–22 adult individuals were sampled at intervals of at least 20 m to minimize the likelihood of collecting closely related plants. Young leaves were dried immediately in silica gel and stored until DNA extraction. Voucher specimens representing all populations were deposited in the herbarium of the Guangxi Botanical Garden of Medicinal Plants. The geographic locations of the sampled populations are shown in Table 1.

2.2. DNA Extraction

Total genomic DNA was extracted from approximately 50 mg of silica-dried leaf tissue using a modified cetyltrimethylammonium bromide (CTAB) protocol optimized for tissues rich in secondary metabolites. Leaf material was ground to a fine powder in liquid nitrogen and incubated in preheated extraction buffer containing 2% CTAB, 100 mM Tris-HCl (pH 8.0), 20 mM EDTA, 1.4 M NaCl, and 1% polyvinylpyrrolidone. DNA was purified with chloroform:isoamyl alcohol (24:1), precipitated with cold isopropanol, washed with 70% ethanol, and dissolved in TE buffer. DNA quantity and purity were assessed spectrophotometrically, and integrity was verified by 1.0% agarose gel electrophoresis. All samples were then diluted to approximately 20 ng/μL for PCR amplification.

2.3. cpSSR Marker Development and Primer Information

Candidate cpSSR loci were identified from the complete chloroplast genome sequences of S. tonkinensis [9,29] using standard microsatellite search criteria, with thresholds of 10 repeat units for mononucleotide motifs, five for dinucleotide motifs, four for trinucleotide motifs, and three for tetra- and pentanucleotide motifs. Primer pairs flanking candidate loci were designed with Primer Premier 5.0 and evaluated by in silico amplification against the chloroplast genome. Thirty primer pairs were synthesized and screened in a subset of samples. On the basis of amplification quality, reproducibility, and polymorphism, nine loci were retained for formal genotyping: StcpSSR01-StcpSSR09 (Table 2). Forward primers were labeled with FAM, HEX, TAMRA, or ROX to enable capillary fragment analysis.

2.4. PCR Amplification and Fragment Analysis

PCR amplification was performed in a 10 μL reaction system containing 5 μL of 2× Taq PCR Master Mix, 1 μL of mixed primers, 1 μL of DNA template, and 3 μL of ddH2O. The PCR reaction conditions were as follows: pre-denaturation at 95 °C for 5 min; denaturation at 95 °C for 30 s, annealing at a gradient of 62–52 °C for 30 s, and extension at 72 °C for 30 s for 10 cycles, with a decrease of 1 °C in each cycle; followed by denaturation at 95 °C for 30 s, annealing at 52 °C for 30 s, and extension at 72 °C for 30 s for 25 cycles; and a final extension at 72 °C for 20 min. Fluorescent PCR products were initially examined by agarose gel electrophoresis. Single bands of the expected size were selected and diluted to a comparable concentration range before capillary electrophoresis. Fragment analysis was then performed on an ABI 3730xl DNA Analyzer (Applied Biosystems, Foster City, CA, USA), and the raw fluorescence data were scored in GeneMarker v2.2.0.

2.5. Genetic Diversity and Population Structure Analyses

The raw data in .fsa format were exported from the ABI 3730xl DNA Analyzer, categorized according to locus, and imported into GeneMarker v2.2.0 software for genotype scoring. Genotypic raw data files and peak maps were then exported in Excel and PDF formats, respectively, by locus for subsequent analyses. Only clear, stable, and reproducible allele peaks were retained for downstream analyses, and loci with ambiguous peak patterns were rechecked manually in the electropherograms before final scoring.
Genetic diversity parameters, including the observed number of alleles (Na), the effective number of alleles (Ne), Shannon’s information index (I), observed heterozygosity (Ho), expected heterozygosity (He), and fixation index (F), were calculated using GenAlEx 6.5 [30]. Polymorphism information content (PIC) was calculated according to the method of Botstein et al. [31]. The degree of genetic differentiation and the calculation of genetic distance were also performed using GenAlEx 6.5. Because chloroplast cpSSR loci are effectively haploid and maternally inherited, heterozygosity- and fixation-related indices generated by the software were treated only as auxiliary descriptors, whereas biological interpretation focused primarily on chlorotype diversity, FST, AMOVA, and clustering patterns.
Principal coordinate analysis (PCoA) and analysis of molecular variance (AMOVA) were conducted in GenAlEx 6.5 [30] to evaluate genetic relationships among samples and partition molecular variation among populations, among individuals within populations, and within individuals. Statistical significance for AMOVA was tested using 999 permutations. For cluster analysis, an unweighted pair group method with arithmetic mean (UPGMA) tree was constructed using PHYLIP 3.69 based on the genetic distance matrix [32].
Population genetic structure was analyzed using STRUCTURE 2.3.4 [33] under an admixture model with correlated allele frequencies. Because all cpSSR loci are located on the same non-recombining chloroplast genome, STRUCTURE was used here only as an exploratory clustering tool rather than as a fully independent model-based inference equivalent to analyses based on unlinked nuclear loci. The number of clusters (K) was set from 1 to 20, and 20 independent runs was performed for each K value. The burn-in period and Markov chain Monte Carlo (MCMC) parameters were set to 10,000 and 100,000, respectively. The optimal K value was determined using the ΔK method of Evanno et al. [33] as implemented in Structure Harvester [34].

2.6. Chlorotype Reconstruction and Network Analysis

Each unique multilocus allelic profile across the nine cpSSR loci was treated as one chlorotype. Chlorotype frequencies were tallied for each population, and chlorotype diversity (Hd; Nei’s gene diversity) was calculated at the population level based on chlorotype frequencies. Private chlorotypes were defined as those detected in only a single population. Relationships among chlorotypes were visualized using a chlorotype network derived from pairwise multilocus cpSSR differences, and the geographic distribution of chlorotypes was mapped using the sampling coordinates of the 18 populations.

3. Results

3.1. Polymorphism of cpSSR Loci

We successfully amplified all nine cpSSR loci across the 274 individuals from the 18 sampled populations (Table 3). In total, the panel yielded 41 distinct alleles, ranging from 2 to 10 alleles per locus (mean Na = 4.556). Locus StcpSSR02 was the most polymorphic, displaying the highest effective number of alleles (Ne = 5.745), Shannon’s information index (I = 2.021), expected heterozygosity (He = 0.826), and polymorphism information content (PIC = 0.809). In contrast, StcpSSR03 was the least variable (Ne = 1.045; I = 0.106; He = 0.043; PIC = 0.042). Across all loci, the mean Ne, I, He, and PIC values stood at 2.593, 0.965, 0.487, and 0.451, respectively. Together, these metrics indicate a moderate to high level of chloroplast polymorphism at the species level. As expected for effectively haploid chloroplast markers, Ho values remained close to zero across loci. Accordingly, heterozygosity- and fixation-related indices are reported here only as software-derived descriptors, whereas the biological interpretation focuses primarily on Hd, FST, AMOVA, and clustering patterns.
Population differentiation statistics also indicated strong structuring of cpDNA variation (Table 4). The biologically informative result was the exceptionally high mean FST value of 0.808, indicating very strong differentiation among populations. Correspondingly, estimated historical gene flow (Nm) was consistently low across all loci, with a mean of only 0.112. These patterns suggest that chloroplast exchange among populations has been severely restricted, and that genetic drift has contributed substantially to chloroplast divergence across the fragmented landscape.

3.2. Genetic Diversity Within Populations

At the population level, chloroplast diversity was generally low (Table 5). The observed number of alleles (Na) ranged from 1.000 to 1.778. Five populations (DLSN, LLTS, MSGL, MSLD, and NPDL) were monomorphic across all loci (Na = 1.000; He = 0.000). Most remaining populations showed low diversity, with He values below 0.15. The main exceptions were DBMA and LYNG, which were the most variable populations in this study. DBMA showed the highest chloroplast diversity (Na = 1.667, Ne = 1.511, I = 0.417, He = 0.289), closely followed by LYNG (Na = 1.778, Ne = 1.401, I = 0.331, He = 0.209). As expected for chloroplast markers, the Ho in both of these populations remained zero.

3.3. Genetic Differentiation and Population Relationships

AMOVA revealed that 85% of the total cpSSR variation was partitioned among populations. The remaining 15% was attributable to differences among individuals within populations, whereas within-individual variation was effectively zero (Table 6).
Pairwise Nei’s genetic distances ranged from 0.001 between the closely related GZZY and LLTS, to 0.889 between NPDL and GZZY/LLTS (Table 7). The UPGMA dendrogram resolved these relationships into three major population groups (Figure 1): pop I grouped LLTS and GZZY; pop II clustered NPDL, DBMA, FSCD, DLSN, LYNG, TEWY, LYLX, and FSLJ; and pop III included YZDS, MSGL, LCJA, HJSE, HJML, DALG, YZBS, and MSLD.

3.4. Chlorotype Composition and Geographic Distribution

Based on the combined allelic profiles of the nine cpSSR loci, we identified 25 chlorotypes among the 274 sampled individuals (Table 8). Chlorotype frequencies were highly uneven across the dataset, with H1 (43 individuals) and H2 (41 individuals) the most frequent, followed by H3 (22 individuals), H4 (21 individuals), and H5 (19 individuals). A total of 19 chlorotypes were private, each occurring in only a single population, whereas only six chlorotypes were shared among two or more populations. Population-level chlorotype diversity was highest in HJSE (Hd = 0.762), LYNG (Hd = 0.711), DALG (Hd = 0.679), and FSLJ (Hd = 0.667), whereas DLSN, LLTS, MSGL, MSLD, and NPDL were monomorphic.
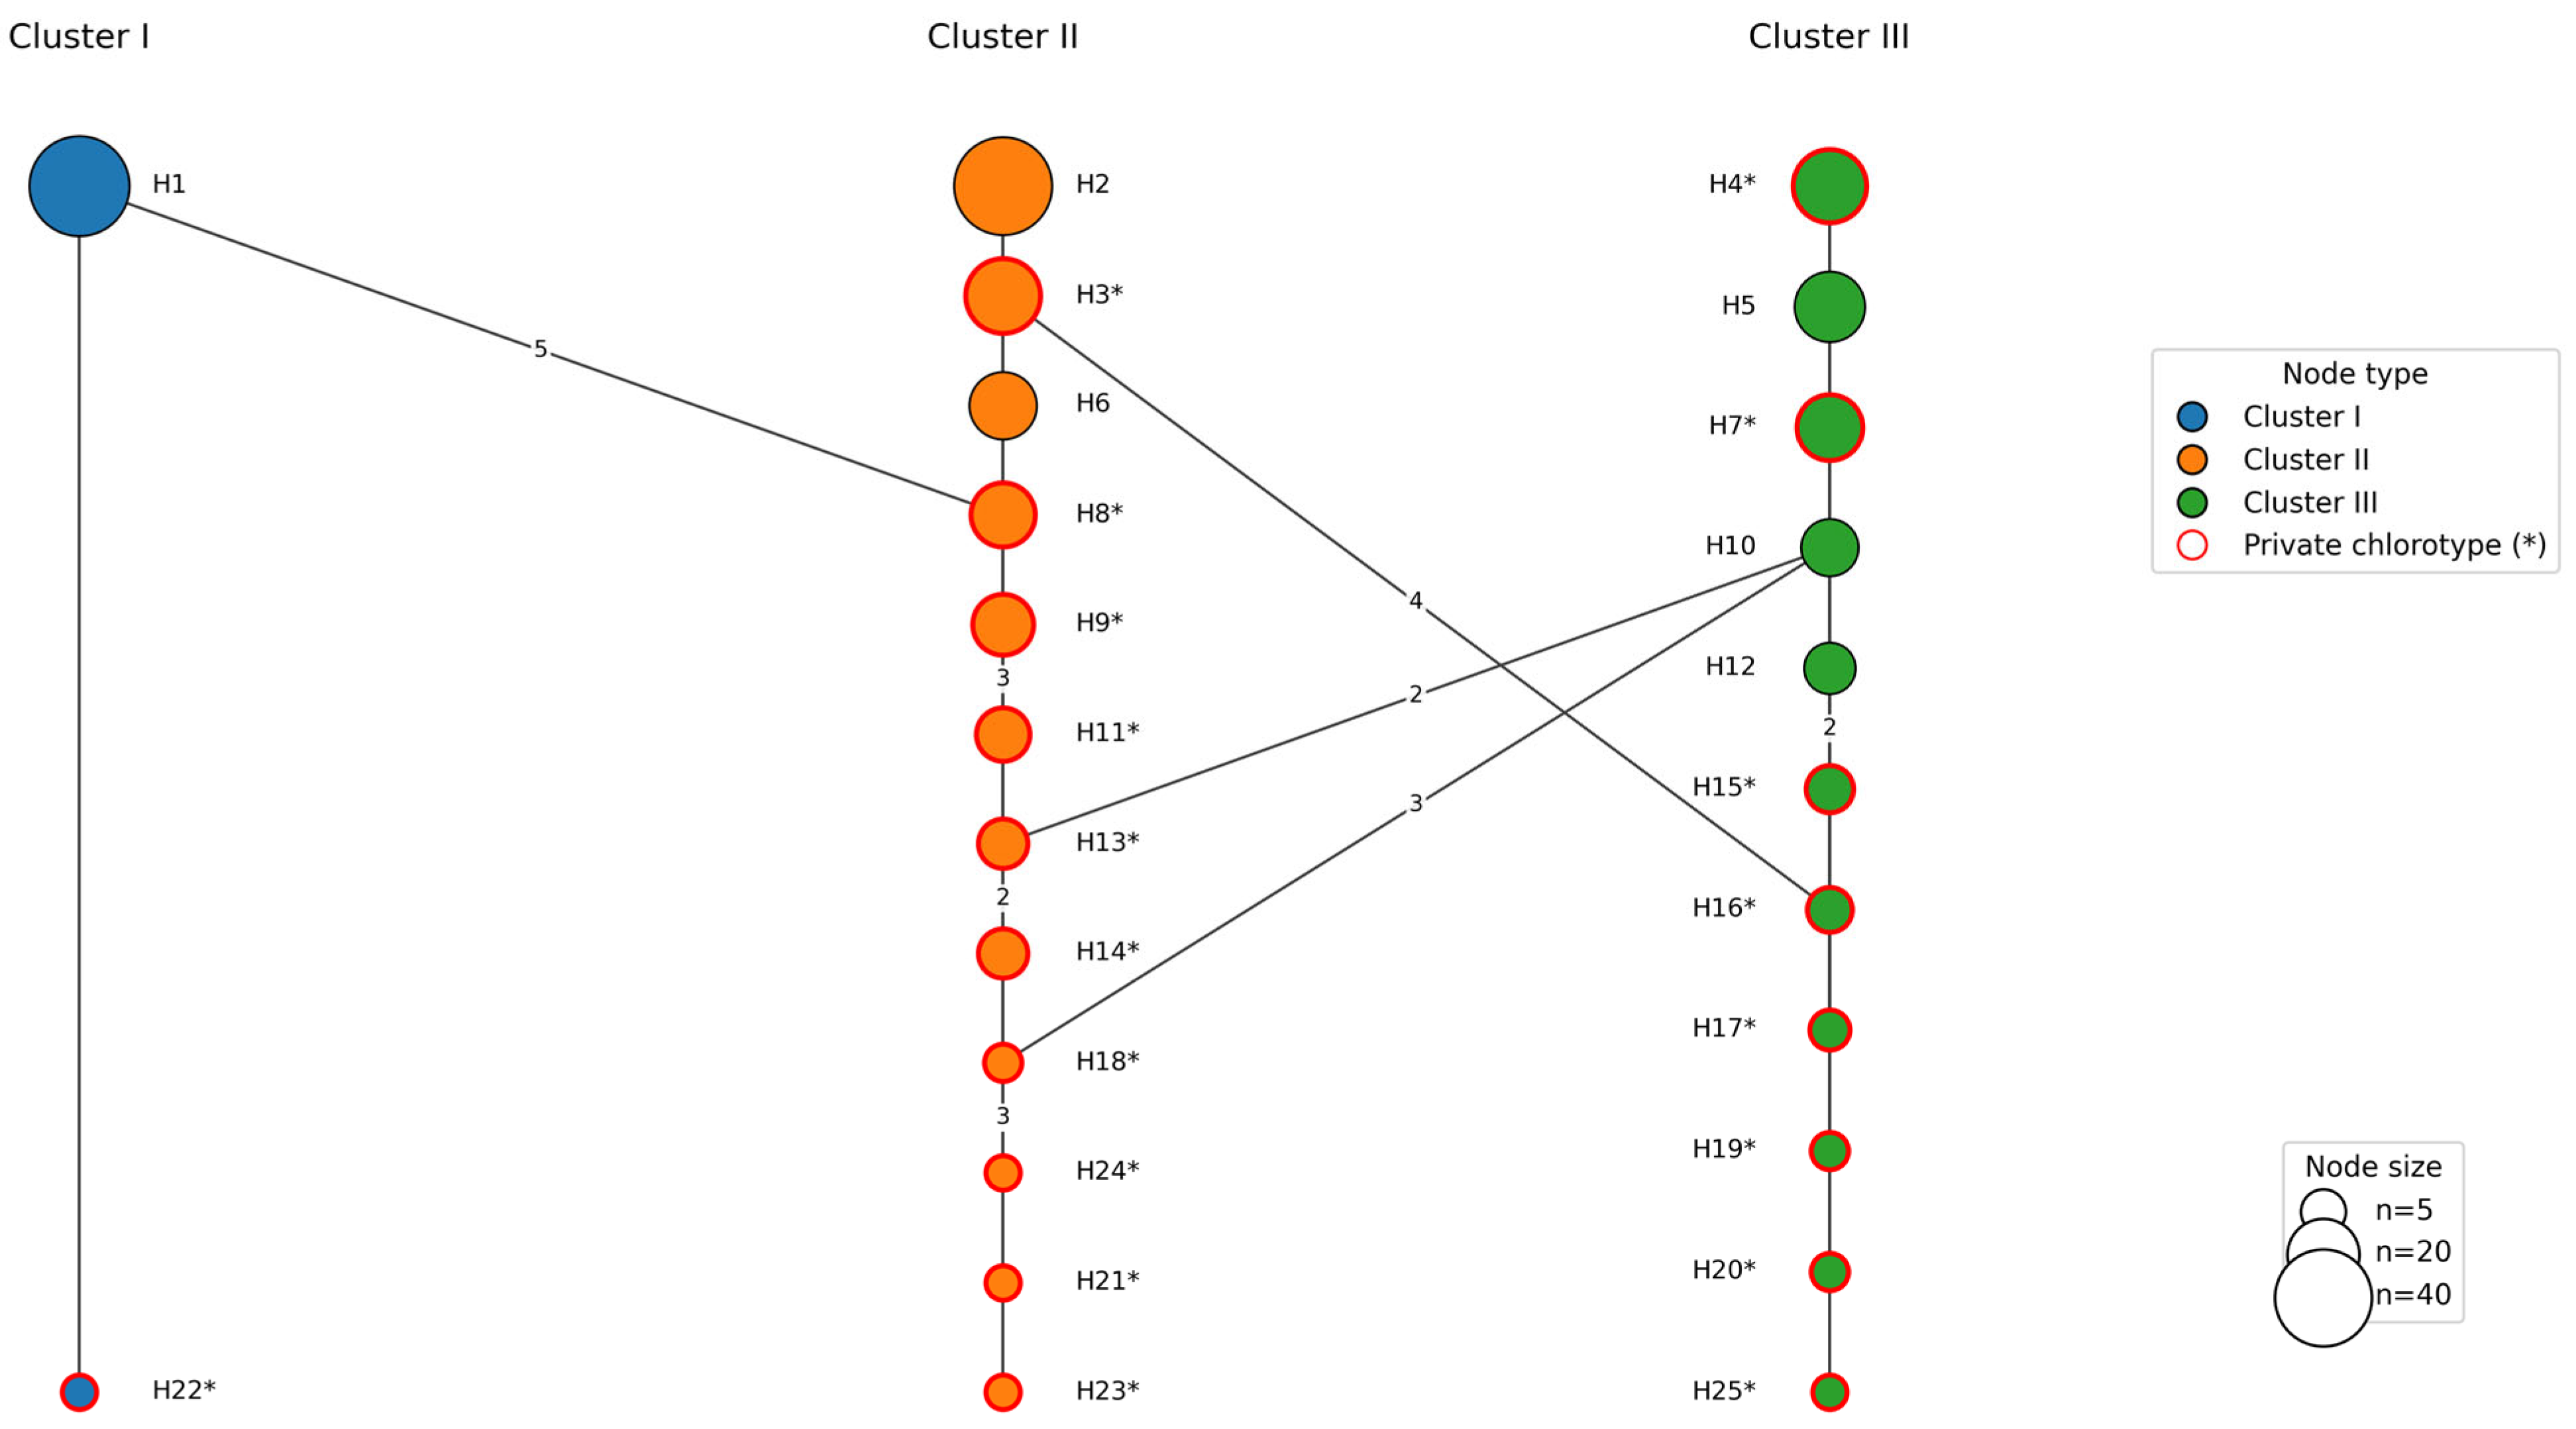
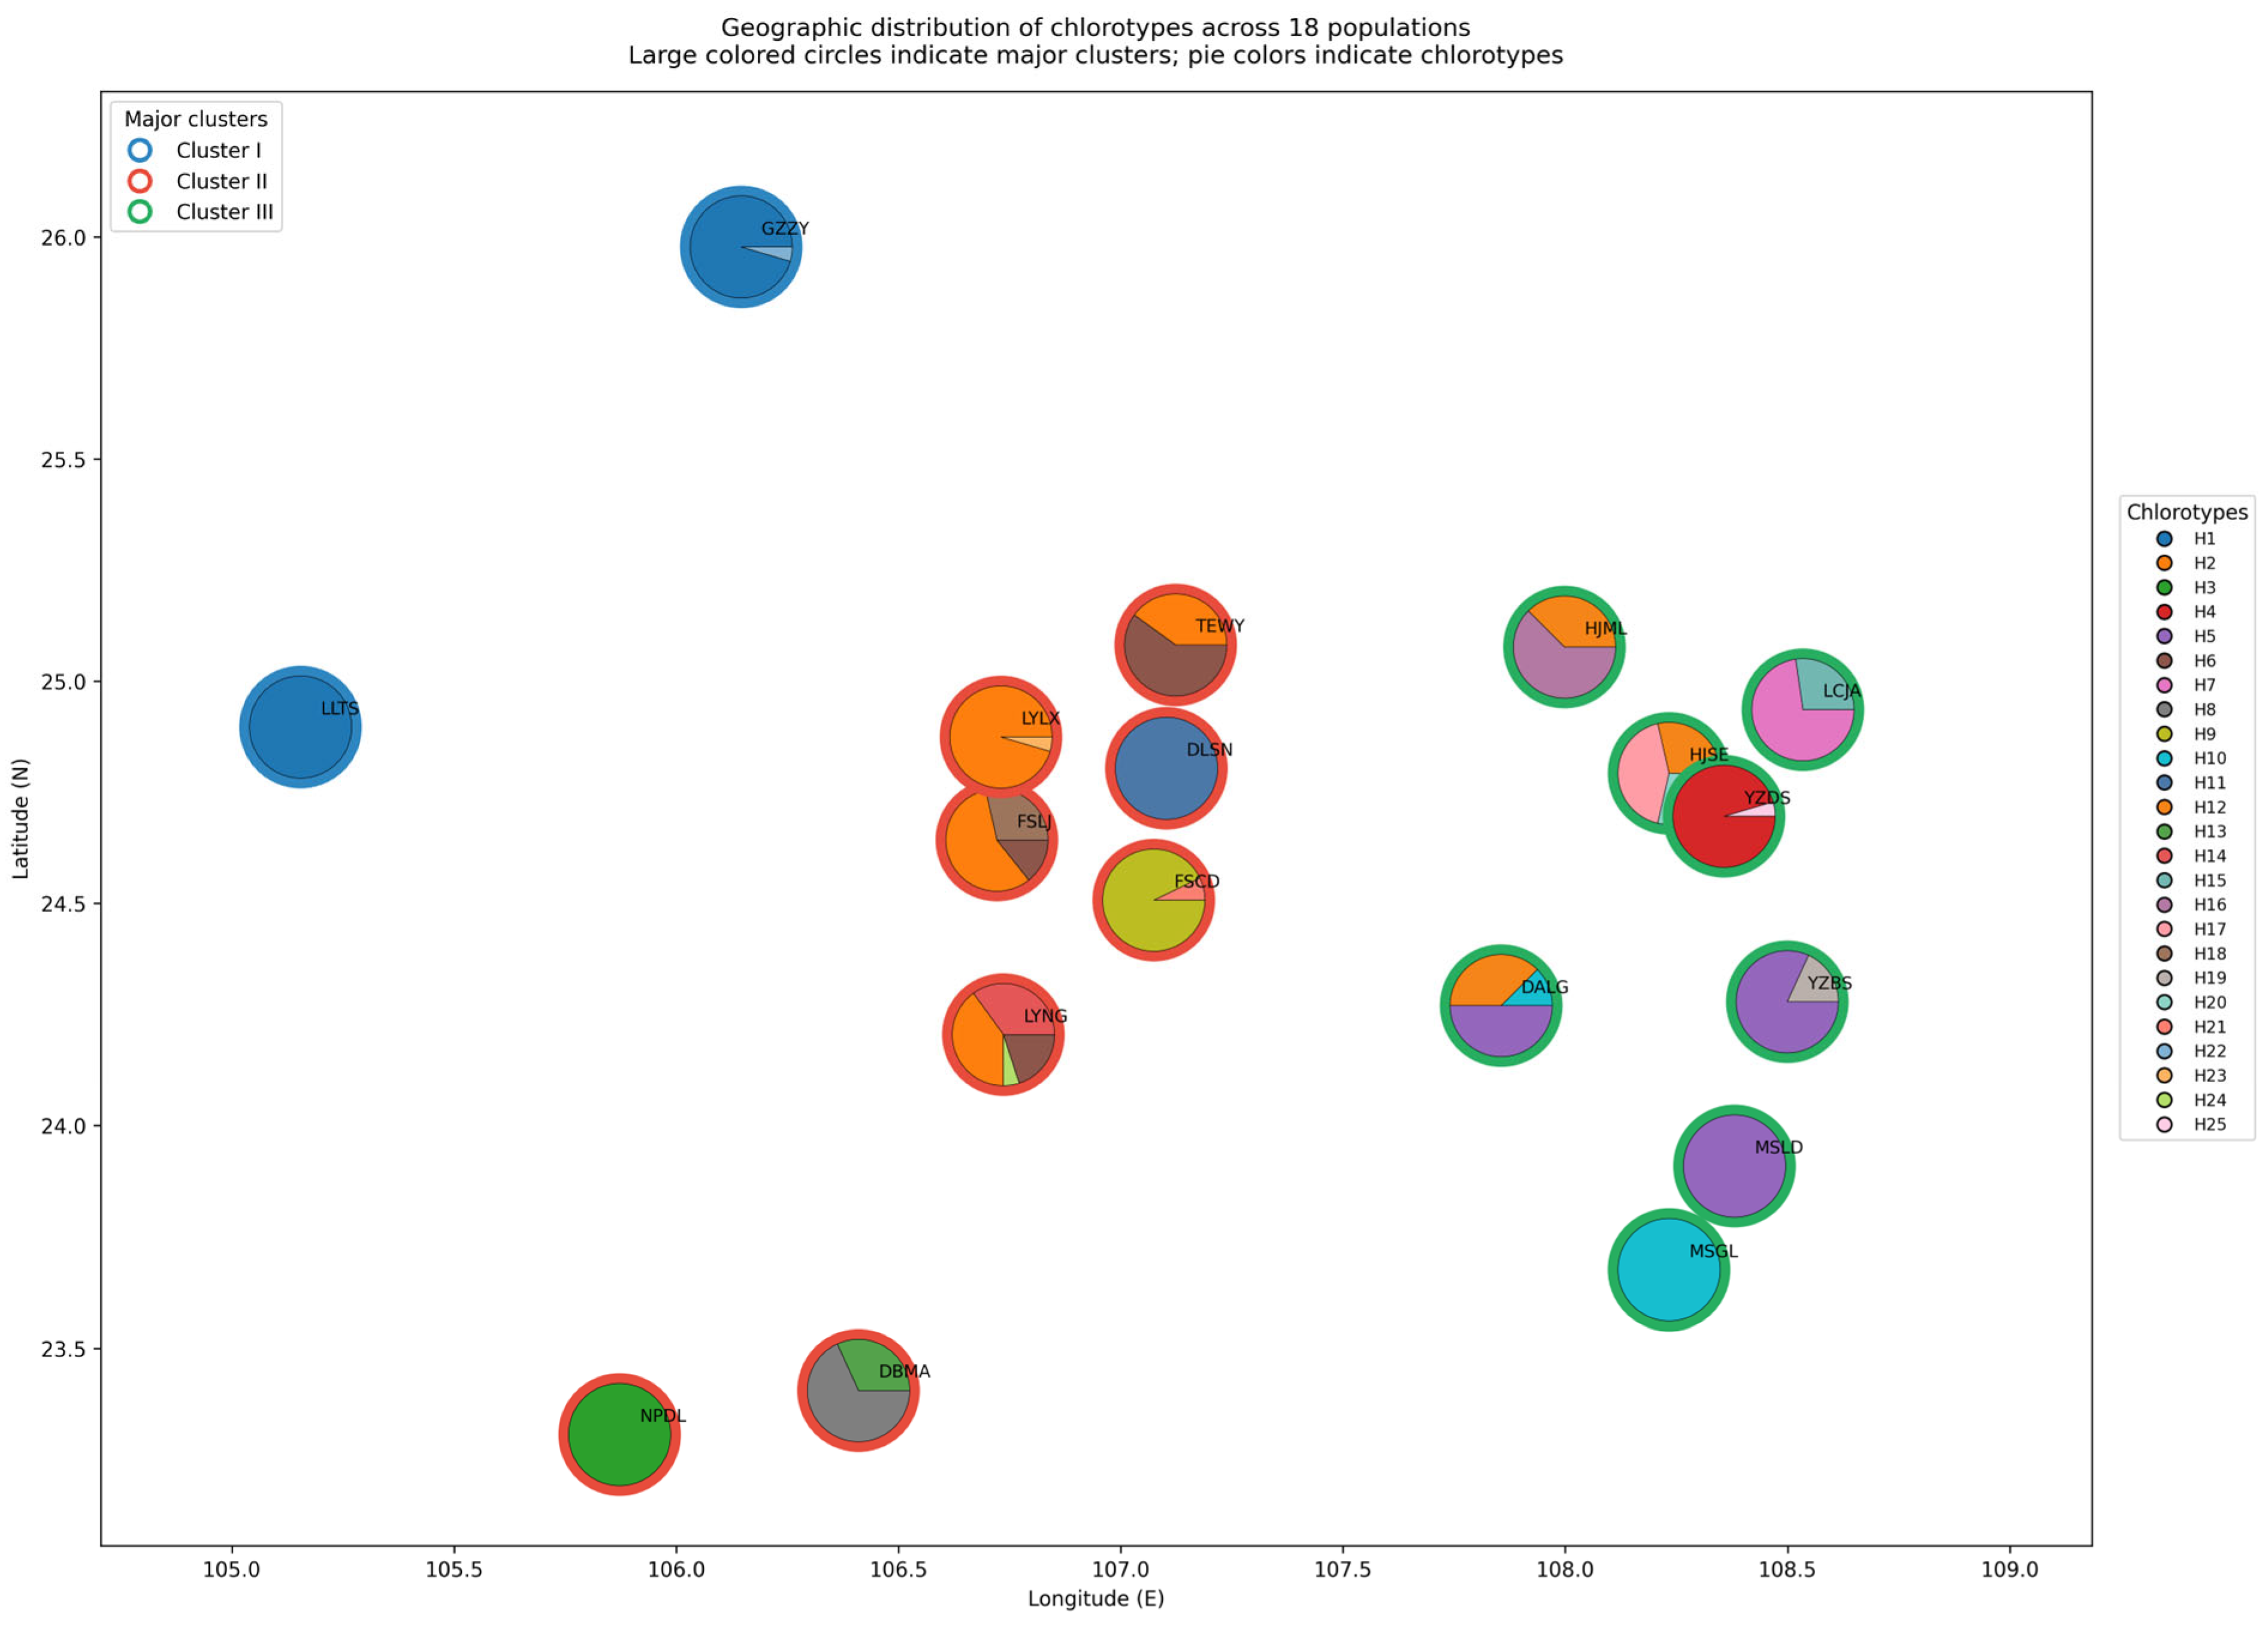
The chlorotype network and geographic distribution map revealed a clear subdivision into three major maternal lineage assemblages (Figure 2 and Figure 3). Cluster I was restricted to GZZY and LLTS and was dominated by H1. Cluster II included DBMA, DLSN, FSCD, FSLJ, LYLX, LYNG, NPDL, and TEWY and contained widespread chlorotypes H2 and H6 together with several private chlorotypes. Cluster III comprised DALG, HJML, HJSE, LCJA, MSGL, MSLD, YZBS, and YZDS and was characterized by H4, H5, H7, H10, and H12. No chlorotype was shared among the three major clusters, indicating strong spatial structuring of maternally inherited chloroplast variation and highly restricted seed-mediated gene flow.

3.5. Population Structure of S. tonkinensis Based on cpSSR Data

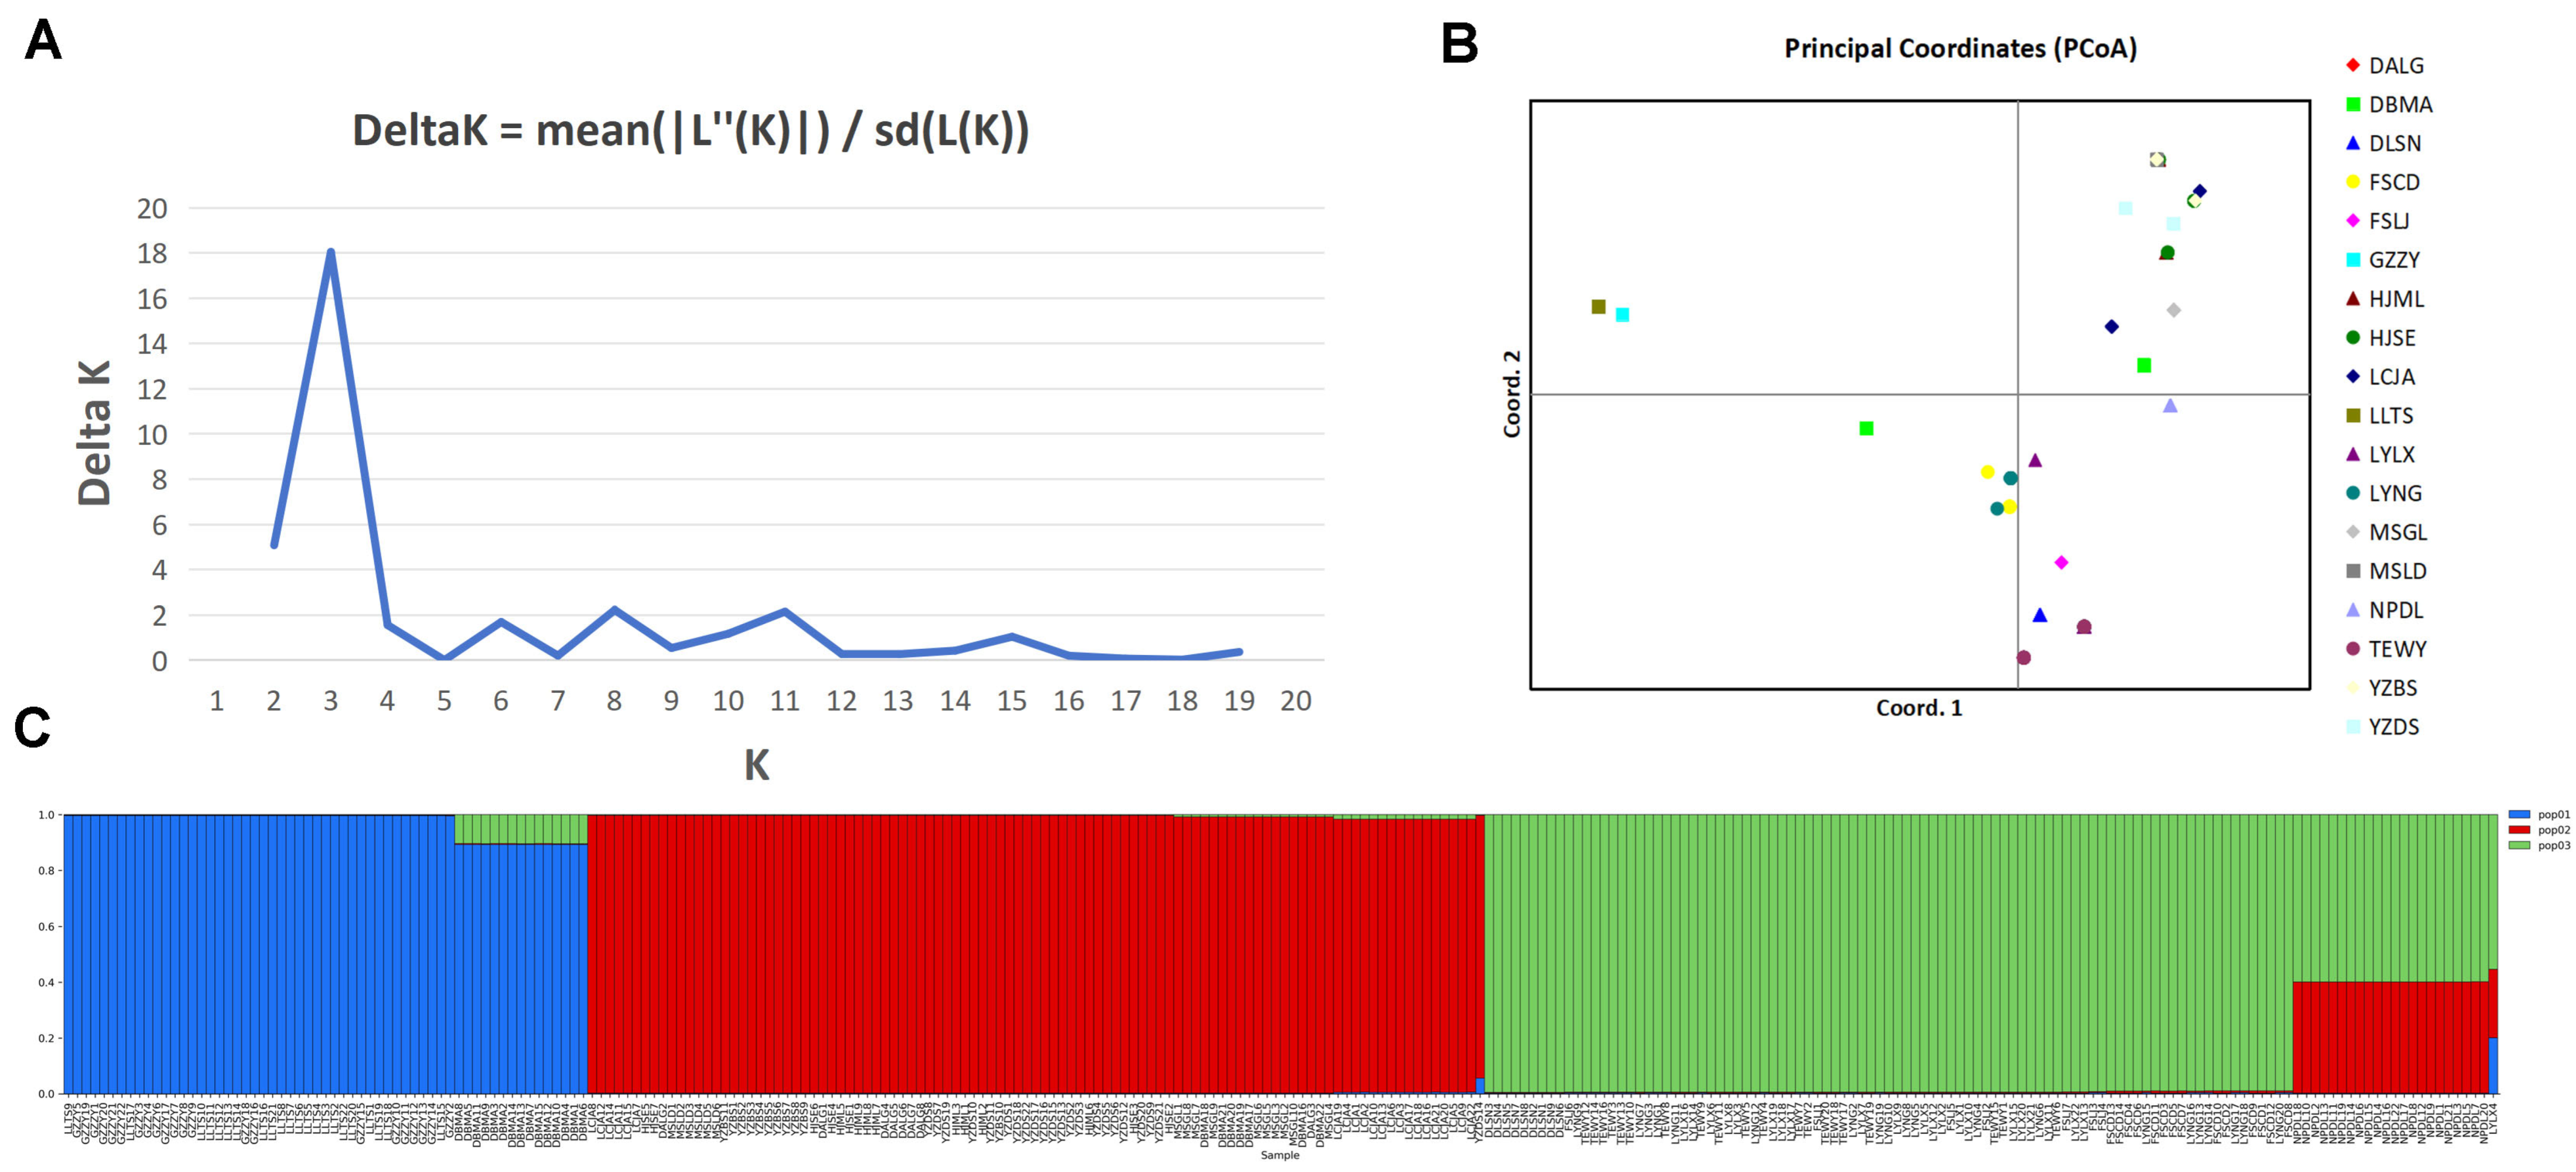
STRUCTURE was used here as an exploratory clustering tool for the chloroplast dataset. A clear maximum ΔK occurred at K = 3, suggesting a three-cluster chloroplast pattern (Figure 4). This pattern was broadly consistent with PCoA and the assignment plot and, importantly, with the chlorotype network and geographic distribution results. The three clusters showed very limited admixture, further supporting strong maternal lineage differentiation across the sampled range of S. tonkinensis.

4. Discussion

4.1. Informativeness and Applicability of the Developed cpSSR Markers

The nine cpSSR loci developed here successfully provided sufficient resolution to characterize maternal variation across wild S. tonkinensis populations. Although the absolute number of loci is modest, the species-level allelic richness and PIC values indicate that this panel captures informative chloroplast polymorphism. Importantly, when the nine loci were combined into multilocus chlorotypes, they resolved 25 chlorotypes, including 19 private chlorotypes, thereby providing a direct framework for tracking maternal lineages. Recent comparative plastome work in Sophora and allied medicinal Fabaceae has further shown that chloroplast genomes harbor hypervariable regions and candidate DNA markers that are directly useful for species identification, phylogenetic inference, and conservation-oriented marker development in S. tonkinensis and related taxa [2,10]. Comparable marker performance has also been reported in newly developed cpSSR panels from Physalis and Helichrysum [16,17]. Additional studies in Cryptomeria, Citrus, Orchidantha, and Paeonia confirm that a moderate number of well-performing chloroplast loci can still provide strong discriminatory power in medicinal or geographically structured plants [25,26,35,36]. Similar conclusions from recent SSR-development studies in Suaeda and Zanthoxylum further support the practical value of compact but informative marker sets for diversity assessment and germplasm identification [25,37].
The observed variation in locus informativeness likely reflects the heterogeneous mutational behavior inherent to chloroplast simple repeats [16,25]. A/T-rich regions within plastid genomes often show uneven mutability, meaning that a small subset of highly variable loci can contribute disproportionately to lineage resolution. In our dataset, StcpSSR02 was especially informative, whereas lower-diversity loci still improved discrimination when considered jointly across the full geographic range [17,35]. Observed heterozygosity predictably approached zero across loci, which is consistent with the effectively haploid and usually maternally inherited nature of angiosperm chloroplast markers. For chloroplast cpSSR datasets, greater emphasis should be placed on chlorotype diversity, among-population differentiation, and lineage assignment than on heterozygosity-related summary statistics [26,36].

4.2. Strong Chloroplast Differentiation Reflects Restricted Seed-Mediated Gene Flow

One of the most striking findings of this study is the extraordinarily high level of chloroplast differentiation among wild populations of S. tonkinensis. The very high mean FST and the AMOVA result showing that most variation resides among populations point to severely restricted maternal connectivity. Similar strong partitioning of chloroplast variation has been reported in endangered or geographically structured taxa such as Tetraena mongolica, Chimonobambusa utilis, and Bretschneidera sinensis [12,14,15]. Chloroplast DNA phylogeography in bermudagrass likewise shows that maternal lineages can remain sharply partitioned across broad environmental and spatial gradients [38].
What drives this extreme isolation? Several non-exclusive ecological and historical processes may account for this pattern. One important factor is that S. tonkinensis is largely confined to discontinuous karst slopes and rocky outcrops, where valleys, exposed limestone, and human-modified land collectively act as strong barriers to seed movement. This interpretation is consistent with studies of limestone endemics and karst-adapted woody plants showing that habitat discontinuity, environmental filtering, and restricted dispersal promote deep lineage isolation [3,20]. Another likely contributor is the combination of environmental harshness, fragmentation, and demographic sensitivity in karst systems, which has also been emphasized for Garcinia paucinervis and other threatened karst plants [4,22]. In addition, molecular evidence from the karst-adapted genus Primulina indicates that high-calcium limestone habitats can drive adaptive differentiation, reinforcing the idea that local selection may accompany long-term geographic isolation [14].
The previous AFLP-based study of wild S. tonkinensis reported only moderate nuclear differentiation among populations [11]. By contrast, our cpSSR dataset revealed much stronger chloroplast structuring. This difference is biologically informative rather than contradictory, because nuclear markers reflect both pollen-mediated and seed-mediated gene exchange, whereas chloroplast markers mainly track maternally inherited seed dispersal. The much stronger spatial structure detected here therefore suggests that historical pollen flow has exceeded seed flow, while actual propagule movement across the karst landscape has remained highly constrained. Taken together, our results indicate that chloroplast variation preserves a deeper record of geographic isolation than was apparent from previously available nuclear-marker data.

4.3. Geographic Structuring and Possible Phylogeographic Implications

Together, the chlorotype network, chlorotype geographic distribution pattern, UPGMA, PCoA, and exploratory STRUCTURE analysis supported the presence of three major chloroplast groups. The chlorotype-based analysis provides the most direct evidence that these groups represent distinct maternal lineages within the sampled range of S. tonkinensis. Similar concordance among clustering and phylogeographic approaches has been reported in Quercus section Cyclobalanopsis and in comparative plastome studies of Lysionotus, both of which revealed clear geographic or lineage-associated chloroplast subdivision [19,23].
The geographic organization of these three lineages is ecologically plausible in light of the fragmented nature of karst environments. Genomic work on East Asian Platycarya indicates that adaptation to karst limestone and incipient speciation can be tightly linked in woody plants [3]. Comparative plastome studies in Soroseris and Lysionotus further show that heterogeneous mountain systems and restricted distributions can foster lineage persistence and divergence [19,39]. In our dataset, no chlorotype was shared among the three major groups, whereas shared chlorotypes occurred only within groups. Although the exploratory STRUCTURE analysis suggested limited admixture, the absence of chlorotype sharing across groups indicates that the principal chloroplast groups correspond to strongly differentiated maternal lineages rather than to a continuum of recent seed exchange.

4.4. Conservation Significance and Implications for Germplasm Management

The strong chloroplast structure documented here carries clear implications for the conservation of S. tonkinensis. Because a large majority of chloroplast variation resides between populations, the loss of any single local population could eliminate unique maternal diversity that is not recoverable elsewhere. Similar conservation warnings have been raised in recent genomic work on Thuja sutchuenensis and in nationwide assessments of ex situ conservation gaps for Chinese native flora [5,6].
From a practical standpoint, populations such as DBMA and LYNG warrant priority attention because they retain relatively high allele-level chloroplast diversity, while HJSE and DALG also deserve attention because they showed comparatively high chlorotype diversity. However, monomorphic populations should not be dismissed as unimportant. Even when internal variation is low, an isolated population may still represent a geographically distinctive lineage and thus contribute uniquely to the species-level chloroplast gene pool [13,15].
The new cpSSR markers developed here provide an operational tool for conservation-oriented sampling and germplasm management. For ex situ collections, maternal lines should be sampled systematically from multiple populations spanning all three chloroplast groups rather than collected opportunistically from a few accessible sites. Recent work on maximizing genetic representation in seed collections provides a useful framework for this strategy [27]. More broadly, restoration or translocation programs should avoid indiscriminate mixing of deeply differentiated chloroplast lineages, while monomorphic but geographically distinctive populations should still be retained to preserve lineage-level chlorotype diversity [22,28,40,41,42,43,44].
Accordingly, ex situ collections should include representative maternal lines from all three chloroplast groups, with priority sampling of DBMA, LYNG, HJSE, and DALG, while geographically distinctive monomorphic populations should also be retained.

5. Conclusions

Nine novel cpSSR markers revealed moderate chloroplast polymorphism at the species level but generally low chloroplast diversity within wild S. tonkinensis populations. When combined into multilocus chlorotypes, these markers resolved 25 chlorotypes, including 19 private chlorotypes, and clearly supported three major chloroplast lineage groups. Strong among-population differentiation indicated that maternal gene flow has been severely restricted across the fragmented karst landscape of southwestern China. Populations with relatively high chloroplast diversity, such as DBMA and LYNG, together with populations showing comparatively high chlorotype diversity, such as HJSE and DALG, should be prioritized for protection and ex situ sampling, while geographically distinctive low-diversity populations should also be conserved to preserve lineage-level variation. Overall, this study provides a practical chloroplast marker system and chlorotype framework for future conservation, breeding, and genomic research.

Author Contributions

Conceptualization, F.W.; methodology, F.W.; software, Y.L.; validation, F.W. and Y.L.; formal analysis, F.W. and X.H.; investigation, F.W. and L.L.; resources, C.W. and X.L.; data curation, G.W.; writing—original draft preparation, X.H. and F.W.; writing—review and editing, F.W.; visualization, C.W.; supervision, S.Q. and D.T.; project administration, D.T.; funding acquisition, Z.Z. All authors have read and agreed to the published version of the manuscript.

Funding

This work was funded by the National Key R&D Program of China 2024YFC3506702, the Central Guidance on Local Science and Technology Development Fund of Guangxi (Guike ZY24212031), and Guangxi Qihuang Scholars Training Program (GXQH202402).

Institutional Review Board Statement

Not applicable.

Informed Consent Statement

Not applicable.

Data Availability Statement

The original contributions presented in this study are included in the article. Further inquiries can be directed to the corresponding authors.

Conflicts of Interest

The authors declare no conflicts of interest.

References

  1. Liang, Y.; Wei, G.; Liang, X.; Tang, M.; He, H.; Tang, D.; Lin, Y.; Li, L.; Qin, S.; Wei, F. Genes involved in the regulation of alkaloid and flavonoid biosynthesis in different tissues of Sophora tonkinensis via transcriptomics and metabolomics. BMC Plant Biol. 2025, 25, 840. [Google Scholar] [CrossRef]
  2. Zeng, F.-F.; Chen, Z.-H.; Luo, F.-H.; Liu, C.-J.; Yang, X.; Zhang, F.-X.; Shi, W. Sophorae tonkinensis Radix et Rhizoma: A Comprehensive Review of the Ethnopharmacology, Phytochemistry, Pharmacology, Pharmacokinetics, Toxicology and Detoxification Strategy. J. Ethnopharmacol. 2025, 337, 118784. [Google Scholar] [CrossRef]
  3. Cao, Y.; Almeida-Silva, F.; Zhang, W.-P.; Ding, Y.-M.; Bai, D.; Bai, W.-N.; Zhang, B.-W.; Van de Peer, Y.; Zhang, D.-Y. Genomic Insights into Adaptation to Karst Limestone and Incipient Speciation in East Asian Platycarya spp. (Juglandaceae). Mol. Biol. Evol. 2023, 40, msad121. [Google Scholar] [CrossRef] [PubMed]
  4. Liu, C.; Huang, Y.; Wu, F.; Liu, W.; Ning, Y.; Huang, Z.; Tang, S.; Yu, L. Plant adaptability in karst regions. J. Plant Res. 2021, 134, 889–906. [Google Scholar] [CrossRef] [PubMed]
  5. Tao, T.; Milne, R.I.; Li, J.; Yang, H.; Wang, S.; Chen, S.; Mao, K. Conservation genomic investigation of an endangered conifer, Thuja sutchuenensis, reveals low genetic diversity but also low genetic load. Plant Divers. 2024, 46, 78–90. [Google Scholar] [CrossRef] [PubMed]
  6. Ye, J.; Shan, Z.; Peng, D.; Sun, M.; Niu, Y.; Liu, Y.; Zhang, Q.; Yang, Y.; Lin, Q.; Chen, J.; et al. Identifying gaps in the ex situ conservation of native plant diversity in China. Biol. Conserv. 2023, 282, 110044. [Google Scholar] [CrossRef]
  7. Wei, F.; Qin, S.; Li, L.; Qiao, Z.; Tang, D.; Wei, G.; Lin, Y.; Liang, Y. Genome-Wide Identification and Functional Analysis of DNA Methylation-Related Genes in Sophora tonkinensis Under Cadmium and Drought Stress. Plants 2026, 15, 396. [Google Scholar] [CrossRef]
  8. Luo, Y.; Zhang, Y.; Jiang, Y.; Dai, Z.; Li, Q.; Mou, J.; Xu, L.; Deng, S.; Li, J.; Wang, R.; et al. iTRAQ-Based Proteomic and Physiological Analyses Reveal the Mechanisms of Dehydration and Cryopreservation Tolerance of Sophora tonkinensis Gagnep. Seeds. Plants 2023, 12, 1842. [Google Scholar] [CrossRef]
  9. Wei, F.; Tang, D.; Wei, K.; Qin, F.; Li, L.; Lin, Y.; Zhu, Y.; Khan, A.; Kashif, M.H.; Miao, J. The complete chloroplast genome sequence of the medicinal plant Sophora tonkinensis. Sci. Rep. 2020, 10, 12473. [Google Scholar] [CrossRef]
  10. Duan, N.; Ru, D.; Liu, B. Comparative chloroplast genomes of Sophora species: Identification of variable DNA markers and phylogenetic relationships within the genus. BMC Plant Biol. 2025, 25, 1308. [Google Scholar] [CrossRef]
  11. Qiao, Z.; Xiao, D.; Keovongkod, C.; Wei, K.-H.; He, L.-F. Assessment of the genetic diversity and population structure of Sophora tonkinensis in South China by AFLP markers. Biotechnol. Biotechnol. Equip. 2020, 34, 975–985. [Google Scholar] [CrossRef]
  12. Liu, Y.; Wu, M.; Xu, X.; Zhu, X.; Dai, Z.; Gou, G. Genetic diversity and phylogeography of the endemic species Chimonobambusa utilis growing in Southwest China: Chloroplast DNA sequence and microsatellite marker analyses. Front. Plant Sci. 2022, 13, 943225. [Google Scholar] [CrossRef]
  13. Yao, Z.; Wang, X.; Wang, K.; Yu, W.; Deng, P.; Dong, J.; Li, Y.; Cui, K.; Liu, Y. Chloroplast and nuclear genetic diversity explain the limited distribution of endangered and endemic Thuja sutchuenensis in China. Front. Genet. 2021, 12, 801229. [Google Scholar] [CrossRef]
  14. Shang, C.; Li, E.; Yu, Z.; Lian, M.; Chen, Z.; Liu, K.; Xu, L.; Tong, Z.; Wang, M.; Dong, W. Chloroplast genomic resources and genetic divergence of endangered species Bretschneidera sinensis. Front. Ecol. Evol. 2022, 10, 873100. [Google Scholar] [CrossRef]
  15. Yang, Y.; Jia, Y.; Zhao, Y.; Wang, Y.; Zhou, T. Comparative chloroplast genomics provides insights into the genealogical relationships of endangered Tetraena mongolica and the chloroplast genome evolution of related Zygophyllaceae species. Front. Genet. 2022, 13, 1026919. [Google Scholar] [CrossRef] [PubMed]
  16. Feng, S.; Jiao, K.; Zhang, Z.; Yang, S.; Gao, Y.; Jin, Y.; Shen, C.; Lu, J.; Zhan, X.; Wang, H. Development of chloroplast microsatellite markers and evaluation of genetic diversity and population structure of cutleaf groundcherry (Physalis angulata L.) in China. Plants 2023, 12, 1755. [Google Scholar] [CrossRef]
  17. Hladnik, M.; Baruca Arbeiter, A.; Gabrovsek, P.; Tomi, F.; Gibernau, M.; Brana, S.; Bandelj, D. New chloroplast microsatellites in Helichrysum italicum (Roth) G. Don: Their characterization and application for the evaluation of genetic resources. Plants 2024, 13, 2740. [Google Scholar] [CrossRef]
  18. Khade, Y.P.; Mainkar, P.; Chandanshive, A.; Rai, K.M.; Sinhasane, S.R.; Jadhav, M.; Patil, A.; Hembade, V.L.; Radhakrishna, A.; More, S.J.; et al. Harnessing chloroplast SSRs to decipher genetic diversity in underutilized Allium species. Front. Plant Sci. 2025, 16, 1645145. [Google Scholar] [CrossRef]
  19. Li, J.-H.; Xu, W.-B.; Guo, C.-H. Comparative Analysis of Chloroplast Genome Between Widely Distributed and Locally Distributed Lysionotus (Gesneriaceae) Related Members. Int. J. Mol. Sci. 2025, 26, 7031. [Google Scholar] [CrossRef]
  20. Zhu, X.; Liang, H.; Jiang, H.; Kang, M.; Wei, X.; Deng, L.; Shi, Y. Phylogeographic structure of Heteroplexis (Asteraceae), an endangered endemic genus in the limestone karst regions of southern China. Front. Plant Sci. 2022, 13, 999964. [Google Scholar] [CrossRef] [PubMed]
  21. Jia, Z.; Wang, Y.; Huang, B.; Liang, M.; Ge, C.; Zhu, N.; You, R. Genetic diversity analysis of the natural regeneration loci of Liriodendron chinense in artificial mixed forests in the rocky desertification area of Western Hunan. PeerJ 2025, 13, e20138. [Google Scholar] [CrossRef] [PubMed]
  22. Wang, Y.; Zhao, B.; Lu, Z.; Shi, Y.; Li, J. The complete chloroplast genome provides insight into the polymorphism and adaptive evolution of Garcinia paucinervis. Biotechnol. Biotechnol. Equip. 2021, 35, 377–391. [Google Scholar] [CrossRef]
  23. Huang, K.; Li, B.; Chen, X.; Qin, C.; Zhang, X. Comparative and phylogenetic analysis of chloroplast genomes from ten species in Quercus section Cyclobalanopsis. Front. Plant Sci. 2024, 15, 1430191. [Google Scholar] [CrossRef] [PubMed]
  24. Asatulloev, T.; Cai, L.; Yusupov, Z.; Jia, K.-H.; Zhang, R.-G.; Tojibaev, K.S.; Sun, W.-B. High-quality genome of Oreocharis mileensis (Gesneriaceae) provides insights into the adaptation and conservation of highly threatened species in karst region. Plant Divers. 2026, 48, 262–277. [Google Scholar] [CrossRef]
  25. Guo, Q.; Xue, X.; Wang, D.; Zhang, L.; Liu, W.; Wang, E.; Cui, X.; Hou, X. Genetic diversity and population genetic structure of Paeonia suffruticosa by chloroplast DNA simple sequence repeats (cpSSRs). Hortic. Plant J. 2024, 11, 367–376. [Google Scholar] [CrossRef]
  26. Zhou, Y.; Tan, J.; Huang, L.; Ye, Y.; Xu, Y. Assessing genetic diversity in endangered plant Orchidantha chinensis: Chloroplast genome assembly and simple sequence repeat marker-based evaluation. Int. J. Mol. Sci. 2024, 25, 11137. [Google Scholar] [CrossRef]
  27. Kallow, S.; Panis, B.; Vu, D.T.; Vu, T.D.; Paofa, J.; Mertens, A.; Swennen, R.; Janssens, S.B. Maximizing genetic representation in seed collections from populations of self and cross-pollinated banana wild relatives. BMC Plant Biol. 2021, 21, 415. [Google Scholar] [CrossRef]
  28. Van Rossum, F.; Le Pajolec, S.; Raspé, O.; Godé, C. Assessing population genetic status for designing plant translocations. Front. Conserv. Sci. 2022, 3, 829332. [Google Scholar] [CrossRef]
  29. Zhang, W.; Liu, L.; Wang, J.; Li, L.; Li, G. Characterization of the complete chloroplast genome of Sophora tonkinensis Gagnep. Mitochondrial DNA Part B Resour. 2019, 4, 460–462. [Google Scholar] [CrossRef]
  30. Peakall, R.; Smouse, P.E. GenAlEx 6.5: Genetic analysis in Excel. Population genetic software for teaching and research—An update. Bioinformatics 2012, 28, 2537–2539. [Google Scholar] [CrossRef]
  31. Botstein, D.; White, R.L.; Skolnick, M.; Davis, R.W. Construction of a genetic linkage map in man using restriction fragment length polymorphisms. Am. J. Hum. Genet. 1980, 32, 314–331. [Google Scholar]
  32. Felsenstein, J. PHYLIP—Phylogeny Inference Package (Version 3.2). Cladistics 1989, 5, 164–166. [Google Scholar]
  33. Evanno, G.; Regnaut, S.; Goudet, J. Detecting the number of clusters of individuals using the software STRUCTURE: A simulation study. Mol. Ecol. 2005, 14, 2611–2620. [Google Scholar] [CrossRef]
  34. Earl, D.A.; VonHoldt, B.M. STRUCTURE HARVESTER: A website and program for visualizing STRUCTURE output and implementing the Evanno method. Conserv. Genet. Resour. 2012, 4, 359–361. [Google Scholar] [CrossRef]
  35. Wang, M.; Yuan, M.; Li, X.; Wu, X.; Ueno, S.; Cai, M.; Tsumura, Y.; Wen, Y. Development and Characterization of Novel Chloroplast Microsatellite Markers for Cryptomeria japonica var. sinensis (Cupressaceae) and Their Cross-Species Amplification. Biologia 2022, 77, 361–367. [Google Scholar] [CrossRef]
  36. Tourvas, N.; Boutsika, A.; Michailidis, M.; Bazakos, C.; Mellidou, I.; Sarrou, E.; Polychroniadou, C.; Lyrou, F.; Kotina, V.-M.; Xanthopoulou, A.; et al. Citrus Greek National Germplasm Collection: A Genetic Diversity Survey Using Nuclear and Chloroplast Microsatellite Markers. Genet. Resour. Crop Evol. 2025, 72, 4737–4751. [Google Scholar] [CrossRef]
  37. Xu, W.; Wang, J.; Tian, C.; Shi, W.; Wang, L. Genome-Wide Development of Polymorphic Microsatellite Markers and Genetic Diversity Analysis for the Halophyte Suaeda aralocaspica (Amaranthaceae). Plants 2023, 12, 1865. [Google Scholar] [CrossRef]
  38. Zhu, Y.; Ma, T.; Lin, Y.; Peng, Y.; Huang, Y.; Jiang, J. SSR Molecular Marker Developments and Genetic Diversity Analysis of Zanthoxylum nitidum (Roxb.) DC. Sci. Rep. 2023, 13, 20767. [Google Scholar] [CrossRef]
  39. Zhang, J.; Shang, J.; He, Y.; Liu, J.; Fan, J.; Zhang, C.; Sun, S.; Han, M.; Yan, X. Chloroplast DNA Phylogeography Reveals Genetic Divergence of Bermudagrass along Latitudinal and Longitudinal Gradients in China. Genet. Resour. Crop Evol. 2025, 72, 2141–2155. [Google Scholar] [CrossRef]
  40. Tao, J.; Feng, C.; Ai, B.; Kang, M. Adaptive molecular evolution of the two-pore channel 1 gene TPC1 in the karst-adapted genus Primulina (Gesneriaceae). Ann. Bot. 2016, 118, 1257–1268. [Google Scholar] [CrossRef]
  41. Tian, T.; Lin, X.; Wang, Y.; Wang, J. Complete Chloroplast Genome Sequence and Phylogenetic Analysis of the Tibetan Medicinal Plant Soroseris hookeriana. Genes 2026, 17, 24. [Google Scholar] [CrossRef] [PubMed]
  42. White, F.J.; Ensslin, A.; Godefroid, S.; Faruk, A.; Abeli, T.; Rossi, G.; Mondoni, A. Using stored seeds for plant translocation: The seed bank perspective. Biol. Conserv. 2023, 281, 109991. [Google Scholar] [CrossRef]
  43. Abeli, T.; Dalrymple, S.E. Advances in plant conservation translocation. Plant Ecol. 2023, 224, 741–744. [Google Scholar] [CrossRef]
  44. Chung, M.Y.; Merilä, J.; Li, J.; Mao, K.; López-Pujol, J.; Tsumura, Y.; Chung, M.G. Neutral and Adaptive Genetic Diversity in Plants: An Overview. Front. Ecol. Evol. 2023, 11, 1116814. [Google Scholar] [CrossRef]
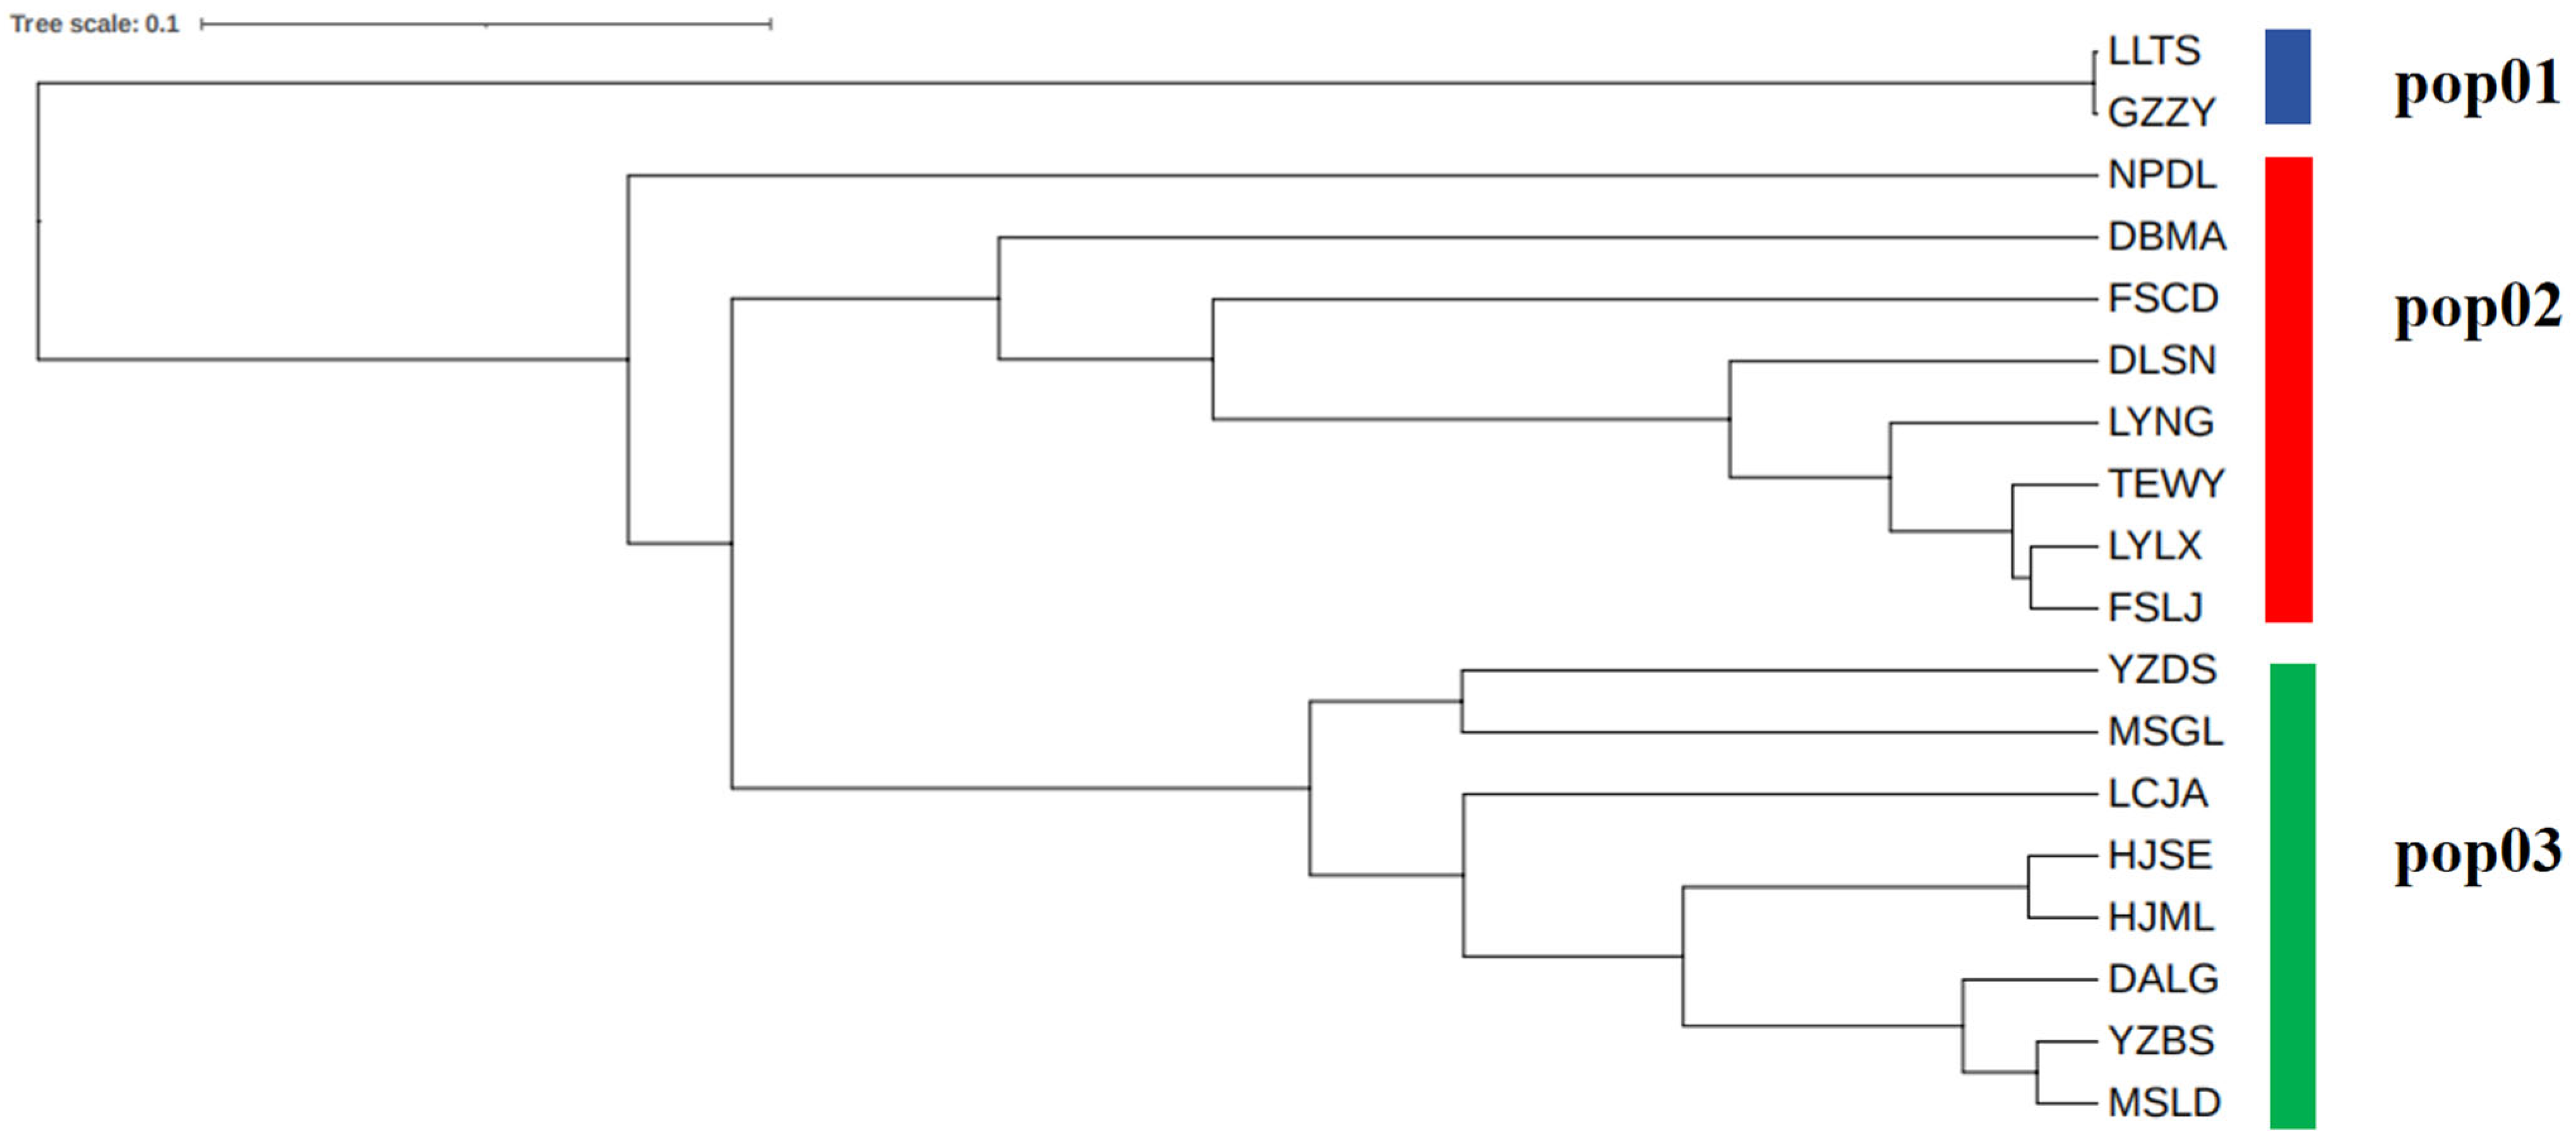
Figure 1. Dendrogram of eighteen S. tonkinensis populations based on UPGMA clustering analysis. Blue represents pop 1, red represents pop 2, and green represents pop 3.
Cimb 48 00562 g001
Figure 2. Chlorotype network based on multilocus cpSSR profiles. A chlorotype network was constructed using the combined allelic profiles of nine cpSSR loci from 274 individuals of S. tonkinensis. Each circle represents a chlorotype, and its area is proportional to the number of individuals harboring that chlorotype. Chlorotypes are arranged according to the three major chloroplast clusters identified in the population structure analyses (Cluster I, Cluster II, and Cluster III). Private chlorotypes occurring in only one population are marked with an asterisk and highlighted by red circle outlines. Numbers on branches indicate the number of mutational steps, defined here as the number of differing cpSSR loci between connected chlorotypes.
Cimb 48 00562 g002
Figure 3. Geographic distribution of chlorotypes across 18 populations of S. tonkinensis. Pie charts represent the chlorotype composition of each population based on the combined allelic profiles of nine cpSSR loci, with pie colors indicating different chlorotypes (H1–H25). Large colored circles behind the pie charts indicate the three major chloroplast clusters identified in the population structure analyses, whereas the population codes are shown in black. Geographic coordinates correspond to the sampling locations listed in Table 1. This pattern reveals strong spatial structuring of maternally inherited chloroplast variation across the sampled range.
Cimb 48 00562 g003
Figure 4. Population structure of S. tonkinensis inferred from cpSSR data. (A) ΔK values from STRUCTURE analysis; (B) principal coordinate analysis (PCoA) of sampled individuals; (C) assignment proportions of 274 individuals at K = 3. Different colors indicate the inferred chloroplast genetic groups.
Cimb 48 00562 g004
Table 1. Sample sizes and location information for eighteen wild populations of S. tonkinensis.
No.Population
Code
Sample
Size
LocationsLongitude
(E)
Latitude
(N)
Altitude
(m)
1DALG8Longma, Du’an, Hechi, Guangxi, China107.855924.2696622
2DBMA22Ma’ai, Debao, Baise, Guangxi, China106.410123.40581009
3DLSN9Shuina, Donglan, Hechi, Guangxi, China107.102924.8037758
4FSCD14Changdong, Fengshan, Hechi, Guangxi, China107.074424.5069750
5FSLJ7Longjiang, Fengshan, Hechi, Guangxi, China106.721524.6421784
6GZZY22Ziyun, Anshun, Guizhou, China106.146225.97711217
7HJML8Mulun, Huanjiang, Hechi, Guangxi, China107.998325.0765492
8HJSE7Si’en, Huanjiang, Hechi, Guangxi, China108.233724.7922393
9LCJA22Jian’ai, Luocheng, Hechi, Guangxi, China108.534824.9355670
10LLTS22Tiansheng, Longlin, Baise, Guangxi, China105.154824.89651416
11LYLX22Luoxi, Leye, Baise, Guangxi, China106.730624.87411129
12LYNG20Nonggu, Lingyun, Baise, Guangxi, China106.736124.2043861
13MSGL10Guling, Mashan, Nanning, Guangxi, China108.233623.6760506
14MSLD6Lidang, Mashan, Nanning, Guangxi, China108.380923.9088510
15NPDL22Delong, Napo, Baise, Guangxi, China105.872623.30691026
16TEWY20Wayao, Tian’e, Hechi, Guangxi, China107.123525.0812965
17YZBS11Beishan, Yizhou, Hechi, Guangxi, China108.499524.2782302
18YZDS22Desheng, Yizhou, Hechi, Guangxi, China108.357324.6957247
Table 2. Characteristics of nine cpSSR loci for PCR amplification in S. tonkinensis.
Primer No.Primer NameFluorescent LabelPrimer Sequence
StcpSSR01StcpSSR01-FHEXAACAAAAACAAGCAAAACGGA
StcpSSR01-R AATTTCACACAACAGGGGGA
StcpSSR02StcpSSR02-FROXCCGAAACGAAACTACGGAAT
StcpSSR02-R AAAAAGGATTGAGCCGAATTT
StcpSSR03StcpSSR03-FROXTGTTTCACGTTTTCTGCCAA
StcpSSR03-R TCTCGTTCACCTCCAAAAAGA
StcpSSR04StcpSSR04-FHEXTCCAATAACCATCCTTCCCTT
StcpSSR04-R GAGTTTTCACACCGGAAAGC
StcpSSR05StcpSSR05-FTAMRAACAGACCAAACTAAAGATATTTAGCAT
StcpSSR05-R GGGGGTCTGGCCTTATTTGA
StcpSSR06StcpSSR06-FFAMGCCTTGATCCACTTGGCTAC
StcpSSR06-R TCGGGGTTTTAAAGTATACGAG
StcpSSR07StcpSSR07-FTAMRATGATGGGCATTCTTTGGTTT
StcpSSR07-R GCCAATTCGAATGACGAAAA
StcpSSR08StcpSSR08-FROXACAGCGGATTTTCCAACAAG
StcpSSR08-R TTTCATCTGCACGAATGGTT
StcpSSR09StcpSSR09-FFAMTCAAGCAGAGCCAAAAATTCTT
StcpSSR09-R ACCTCGATTTAATATTTGCACCTGA
Table 3. Genetic diversity parameters of nine cpSSR loci in S. tonkinensis.
LocusNaNeIHoHeFPICProbSignif
StcpSSR013.0002.1180.8690.0000.5281.0000.4490.000***
StcpSSR0210.0005.7452.0210.0000.8261.0000.8090.000***
StcpSSR032.0001.0450.1060.0000.0431.0000.0420.000***
StcpSSR044.0002.4711.0990.0040.5950.9940.5450.000***
StcpSSR055.0002.0560.9890.0040.5140.9930.4750.000***
StcpSSR066.0003.7541.4490.0000.7341.0000.6890.000***
StcpSSR073.0001.3730.4550.0070.2720.9730.2350.000***
StcpSSR082.0001.1730.2790.0000.1471.0000.1360.000***
StcpSSR096.0003.6061.4210.0000.7231.0000.6760.000***
Mean4.5562.5930.9650.0020.4870.9960.4510.000
STDEV2.5551.5300.6180.0030.2750.0090.2640.000
Note: Na, number of observed alleles; Ne, effective number of alleles; I, Shannon’s information index; Ho, observed heterozygosity; He, expected heterozygosity; F, fixation index, a software-derived fixation index; PIC, polymorphic information content; Prob, p-value; Signif, significance (*** indicates extremely significant difference at p < 0.001).
Table 4. Population differentiation and historical gene flow estimates of nine cpSSR loci in S. tonkinensis.
LocusFSTNm
StcpSSR010.9070.026
StcpSSR020.8570.042
StcpSSR030.2620.706
StcpSSR040.7920.066
StcpSSR050.7790.071
StcpSSR060.8940.030
StcpSSR070.9750.006
StcpSSR081.0000.000
StcpSSR090.8060.060
Mean0.8080.112
SE0.0730.075
Note: FST, genetic differentiation coefficient; Nm, historical gene flow estimate (Nm = 0.25(1 − FST)/FST).
Table 5. Genetic diversity indices of S. tonkinensis populations.
PopulationNaNeIHoHeF
DALG1.444 ± 0.2421.225 ± 0.1600.192 ± 0.1120.000 ± 0.0000.115 ± 0.0681.000 ± 0.000
DBMA1.667 ± 0.1671.511 ± 0.1280.417 ± 0.1040.000 ± 0.0000.289 ± 0.0721.000 ± 0.000
DLSN1.000 ± 0.0001.000 ± 0.0000.000 ± 0.0000.000 ± 0.0000.000 ± 0.0001.000 ± 0.000
FSCD1.444 ± 0.1761.050 ± 0.0220.091 ± 0.0380.016 ± 0.0100.045 ± 0.0190.481 ± 0.200
FSLJ1.222 ± 0.1471.113 ± 0.0800.112 ± 0.0760.000 ± 0.0000.073 ± 0.0501.000 ± 0.000
GZZY1.111 ± 0.1111.005 ± 0.0050.012 ± 0.0120.005 ± 0.0050.005 ± 0.005−0.023 ± 0.005
HJML1.222 ± 0.1471.196 ± 0.1300.147 ± 0.0970.000 ± 0.0000.104 ± 0.0691.000 ± 0.000
HJSE1.333 ± 0.1671.230 ± 0.1150.199 ± 0.1000.000 ± 0.0000.136 ± 0.0681.000 ± 0.000
LCJA1.333 ± 0.1671.219 ± 0.1100.195 ± 0.0980.000 ± 0.0000.132 ± 0.0661.000 ± 0.000
LLTS1.000 ± 0.0001.000 ± 0.0000.000 ± 0.0000.000 ± 0.0000.000 ± 0.0001.000 ± 0.000
LYLX1.333 ± 0.1671.032 ± 0.0160.062 ± 0.0310.000 ± 0.0000.029 ± 0.0141.000 ± 0.000
LYNG1.778 ± 0.3241.401 ± 0.1640.331 ± 0.1320.000 ± 0.0000.209 ± 0.0831.000 ± 0.000
MSGL1.000 ± 0.0001.000 ± 0.0000.000 ± 0.0000.000 ± 0.0000.000 ± 0.0001.000 ± 0.000
MSLD1.000 ± 0.0001.000 ± 0.0000.000 ± 0.0000.000 ± 0.0000.000 ± 0.0001.000 ± 0.000
NPDL1.000 ± 0.0001.000 ± 0.0000.000 ± 0.0000.000 ± 0.0000.000 ± 0.0001.000 ± 0.000
TEWY1.111 ± 0.1111.103 ± 0.1030.075 ± 0.0750.000 ± 0.0000.053 ± 0.0531.000 ± 0.055
YZBS1.222 ± 0.1471.094 ± 0.0620.105 ± 0.0700.000 ± 0.0000.066 ± 0.0441.000 ± 0.000
YZDS1.111 ± 0.1111.005 ± 0.0050.012 ± 0.0120.005 ± 0.0050.005 ± 0.005−0.023 ± 0.005
Note: Na, number of observed alleles; Ne, effective number of alleles; I, Shannon’s information index; Ho, observed heterozygosity; He, expected heterozygosity; F, fixation index.
Table 6. Analysis of molecular variance (AMOVA) of populations.
SourcedfSSMSEst. Var.%
Among Pops171021.39860.0821.97285%
Among Indiv256177.4180.6930.34315%
Within Indiv2742.0000.0070.0070%
Total5471200.816 2.323100%
Note: SS, sum of squares; MS, mean square; Est. Var., estimated variance. Variation was partitioned among populations, among individuals within populations, and within individuals. The within-individual component was effectively zero, as expected for haploid chloroplast markers.
Table 7. Pairwise Nei’s genetic distance among S. tonkinensis populations.
PopulationDALGDBMADLSNFSCDFSLJGZZYHJSELCJALLTSLYLXLYNGMSGLMSLDNPDLTEWYYZBSYZDS
DALG-0.4970.5160.4430.4850.7780.1000.2240.7780.4560.5080.2150.0470.5230.5180.0480.295
DBMA0.497-0.4500.5390.3080.5940.4550.4470.5940.3580.3260.4160.5410.6520.3390.5150.480
DLSN0.5160.450-0.2950.1370.6670.5560.4770.6670.1190.1100.4440.5560.5560.1520.5560.557
FSCD0.4430.5390.295-0.3190.6670.4800.4600.6670.3220.2960.6460.4290.5430.3240.4400.617
FSLJ0.4850.3080.1370.319-0.6670.4700.3740.6670.0240.0530.3420.5640.4700.0310.5160.454
GZZY0.7780.5940.6670.6670.667-0.7780.6990.0010.6460.6670.7780.7780.8890.6670.7780.761
HJML0.1100.4420.5560.4720.4760.7780.0240.1890.7780.4470.5000.2890.1970.4680.5090.1660.290
HJSE0.1000.4550.5560.4800.4700.778-0.1660.7780.4410.4950.2570.1800.4620.5020.1200.199
LCJA0.2240.4470.4770.4600.3740.6990.166-0.6990.3580.4020.2920.2920.4610.4070.2440.293
LLTS0.7780.5940.6670.6670.6670.0010.7780.699-0.6460.6670.7780.7780.8890.6670.7780.761
LYLX0.4560.3580.1190.3220.0240.6460.4410.3580.646-0.0830.3120.5340.4500.0290.4870.425
LYNG0.5080.3260.1100.2960.0530.6670.4950.4020.6670.083-0.3950.5700.5060.0830.5320.416
MSGL0.2150.4160.4440.6460.3420.7780.2570.2920.7780.3120.395-0.3330.5560.3740.2860.223
MSLD0.0470.5410.5560.4290.5640.7780.1800.2920.7780.5340.5700.333-0.5560.5960.0210.335
NPDL0.5230.6520.5560.5430.4700.8890.4620.4610.8890.4500.5060.5560.556-0.4850.5080.557
TEWY0.5180.3390.1520.3240.0310.6670.5020.4070.6670.0290.0830.3740.5960.485-0.5490.487
YZBS0.0480.5150.5560.4400.5160.7780.1200.2440.7780.4870.5320.2860.0210.5080.549-0.240
YZDS0.2950.4800.5570.6170.4540.7610.1990.2930.7610.4250.4160.2230.3350.5570.4870.240-
Table 8. Summary of chlorotypes identified from nine cpSSR loci in S. tonkinensis.
ChlorotypeNo. of IndividualsNo. of PopulationsPopulations DetectedPrivate Chlorotype
H1432GZZY, LLTSNo
H2414FSLJ, LYLX, LYNG, TEWYNo
H3221NPDLYes
H4211YZDSYes
H5193DALG, MSLD, YZBSNo
H6173FSLJ, LYNG, TEWYNo
H7161LCJAYes
H8151DBMAYes
H9131FSCDYes
H10112DALG, MSGLNo
H1191DLSNYes
H1283DALG, HJML, HJSENo
H1371DBMAYes
H1471LYNGYes
H1561LCJAYes
H1651HJMLYes
H1731HJSEYes
H1821FSLJYes
H1921YZBSYes
H2021HJSEYes
H2111FSCDYes
H2211GZZYYes
H2311LYLXYes
H2411LYNGYes
H2511YZDSYes
Disclaimer/Publisher’s Note: The statements, opinions and data contained in all publications are solely those of the individual author(s) and contributor(s) and not of MDPI and/or the editor(s). MDPI and/or the editor(s) disclaim responsibility for any injury to people or property resulting from any ideas, methods, instructions or products referred to in the content.