Article

The Regulation of Catecholamine Biosynthesis by the Gas Transmitters Carbon Monoxide and Hydrogen Sulfide

1
Medical Sciences Division, Northern Ontario School of Medicine University, Sudbury, ON P3E 2C6, Canada
2
School of Natural Sciences, Laurentian University, Sudbury, ON P3E 2C6, Canada
3
Health Sciences North Research Institute, Sudbury, ON P3E 2H2, Canada
*
Author to whom correspondence should be addressed.
Curr. Issues Mol. Biol. 2025, 47(9), 725; https://doi.org/10.3390/cimb47090725
Submission received: 15 August 2025 / Revised: 2 September 2025 / Accepted: 3 September 2025 / Published: 5 September 2025
(This article belongs to the Section Biochemistry, Molecular and Cellular Biology)

Abstract

The gas transmitters nitric oxide (NO), carbon monoxide (CO), and hydrogen sulfide (H2S) play important roles in physiological regulation, including adrenal function. Among them, only NO has been directly implicated in controlling catecholamine biosynthesis. This study examined whether CO and H2S exert similar effects by treating PC12 cells with a CO donor (CORM-2) or an H2S donor (NaHS), with or without glucocorticoid stimulation. Gene expression of tyrosine hydroxylase (Th), dopamine β-hydroxylase (Dbh), and phenylethanolamine N-methyltransferase (Pnmt) was assessed by RT-qPCR, and catecholamine release was measured by ELISA. We found that exogenous CO decreased Th and Dbh expression, attenuated glucocorticoid-induced upregulation of catecholamine biosynthesis genes, and differentially modulated dopamine and norepinephrine release. In contrast, exogenous H2S treatment had no significant effect. These findings identify CO as a novel regulator of catecholamine biosynthesis and highlight important differences among gas transmitters in stress-related signaling.

1. Introduction

Catecholamines are organic molecules that function as hormones and neurotransmitters and are vital to the physiological stress response, particularly the ‘fight or flight’ reaction, which is partly mediated through the hypothalamic–pituitary–adrenal (HPA) axis [1,2,3]. HPA axis activation induces a rapid increase in the biosynthesis and secretion of glucocorticoids (GCs) in the adrenal cortex, mainly cortisol, in humans. The adrenal medulla is exposed to very high concentrations of glucocorticoids [4]. GCs directly increase the release of catecholamines from the adrenal medulla [5] and increase both enzyme activity and expression of catecholamine biosynthesis genes [6].
The catecholamines dopamine, norepinephrine, and epinephrine are all produced in the same sequential enzymatic pathway [7]. Catecholamines, particularly epinephrine, are implicated in the development of essential hypertension. Increased plasma catecholamines have been linked with individuals who have essential hypertension [8]. The gene expression, protein levels, and activity of phenylethanolamine N-methyltransferase (PNMT), the enzyme responsible for epinephrine production, are increased in hypertensive rats compared to normotensive rats [9,10]. Additionally, several genetic linkage studies have indicated Pnmt as a potential candidate gene for hypertension in rats and humans [11,12,13]. The difference in Pnmt expression among hypertensive individuals is not due to polymorphisms, but likely due to altered gene regulation [14].
Gas transmitters, also known as gasotransmitters, are a class of gases that act as cellular transmitters [15]. Currently, the gases nitric oxide (NO), carbon monoxide (CO) and hydrogen sulfide (H2S) are widely considered the canonical gas transmitters [15]. These gas transmitters have all been shown to regulate blood pressure and are implicated in the development of hypertension. NO was initially identified as an endothelium-derived relaxing factor due to its ability to signal smooth muscle cells to vasodilate after being produced in endothelial cells, marking the beginning of gas transmitter research [16,17]. Decreased bioavailability of NO in the endothelium and specific polymorphisms of the gene responsible for endothelial NO production have been associated with hypertension [18,19]. CO has similarly been shown to support vasodilation. Polymorphisms in the promoter region of heme oxygenase 1 (HO-1) have been linked to the occurrence of cardiovascular disease [20]. Induction of HO in the spontaneously hypertensive rat (SHR), either by treatment with hemin [21] or by the introduction of human HO-1 expression vectors, reduces blood pressure [22]. The inhalation of CO by mice attenuated the development of angiotensin II-dependent hypertension [23]. The endogenous production of H2S is primarily through cysteine metabolism, which is catalyzed by several enzymes, but primarily cystathionine γ-lyase (CSE), cystathionine β-synthase (CBS), and 3-mercaptopyruvate sulfurtransferase (3-MST) [24]. H2S exhibits similar vasodilative activity. Lower circulating levels of H2S are correlated with higher blood pressure and could be a marker of hypertension [25]. SHRs have lower expression levels of H2S-producing enzymes compared to normotensive rats, and lowering H2S-producing enzyme activity leads to increased blood pressure in normotensive rats [26]. H2S predominantly induces vasodilation by modulating the activity of K+ and Ca2+ channels [25]. These studies highlight the potential for interactions between catecholamines and gas transmitters, particularly in the regulation of blood pressure and the development of hypertension.
All three of these gases have been shown to participate in regulating the HPA axis [27]. However, the effect of gas transmitters on catecholamine biosynthesis remains unclear. A previous study showed that treatment of cells derived from a pheochromocytoma of the rat adrenal medulla (PC12) with the NO donor sodium nitroprusside (SNP) results in increased expression of catecholamine biosynthesis genes alone and a potentiation in the responses of the genes to the synthetic GC, dexamethasone (DEX) [28]. However, the ability of CO and H2S to modulate the expression of catecholamine biosynthetic genes and any interactions with glucocorticoid signaling is not yet known. While HOs are expressed in adrenal tissue and have been implicated in adrenal steroidogenesis [29], the effect of endogenous CO on catecholamine biosynthesis has not been studied. The closest comparable work is an investigation of the reaction of carotid bodies’ catecholamine content to extremely high acute concentrations of CO that are more consistent with hypoxic conditions or carbon monoxide poisoning [30,31]. The activity of H2S-producing enzymes plays a vital role in maintaining adrenal cortex mitochondrial function and glucocorticoid production [32]. In rat adrenal chromaffin cells, H2S induces catecholamine release by inhibiting membrane depolarization [33]. In calf chromaffin cells, exogenous H2S donation increases Ca2+ levels, triggering exocytosis [34]. While H2S plays a significant role in adrenal function, its effects on catecholamine production are unknown.
In this study, the role of CO and H2S in regulating catecholamine production was investigated. PC12 cells were treated with the gas donors tricarbonyldichlororuthenium (II) dimer, also known as carbon monoxide-releasing molecule 2 (CORM-2), and sodium hydrosulfide (NaHS) to deliver CO and H2S, respectively. Changes in the expression of catecholamine biosynthetic genes tyrosine hydroxylase (Th), dopamine β-hydroxylase (Dbh), and phenylethanolamine N-methyltransferase (Pnmt) were measured via reverse transcription quantitative polymerase chain reaction (RT-qPCR), and overall production and release of catecholamines were measured with an enzyme-linked immunosorbent assay (ELISA).

2. Materials and Methods

2.1. Cell Culture

PC12 cells (Dr. Sushil Mahata, Department of Medicine, University of California, San Diego, CA USA) were maintained in Dulbecco’s modified Eagle’s medium (DMEM (Medi-Res Corp., Sudbury, ON, Canada) with 5% bovine calf serum (BCS; Hyclone Laboratories, Logan, UT, USA), 5% equine serum (ES; Hyclone), and 0.5 mL gentamycin sulfate supplements (50 mg/mL; EMD Chemicals, Gibbstown, NJ, USA). Cells were cultured at 37 °C with 5% CO2 in 100 mm TC-treated cell culture dishes (Medi-Res) in a humidified incubator (Thermo-Fisher Scientific, Hampton, NH, USA). Cells were grown to 80–90% confluency before being passed or used in an experiment. Prior to experimentations, cells were washed twice with PBS, trypsinized, and transferred to DMEM-containing charcoal-treated serum. For RNA extraction and ELISA experiments, cells were seeded in 6-well plates (Medi-Res) at a 1.5 × 10⁶ cells/well from a suspension of 5 × 10⁵ cells/mL, with 3 mL added per well. Following seeding, cells were allowed to adhere to plates for 20–24 h prior to beginning experiments.

2.2. Experimental Design

To determine the effect of CO on the expression of genes associated with catecholamine biosynthesis, PC12 cells were treated with the CO donor CORM-2 at concentrations of 10, 20, 50, 80 or 100 μM for 6 h. To determine the effect of H2S on the expression of genes associated with catecholamine biosynthesis, PC12 cells were treated with the H2S donor NaHS at concentrations of 20, 50, 80, 100 or 300 μM for 6 h. mRNA expression of key catecholamine biosynthetic genes was assessed by RT-qPCR across three replicates. A preliminary investigation was conducted to determine the effects of CO and H2S on catecholamine production and release. PC12 cells were treated with either 100 μM CORM-2 or 300 μM NaHS for 6 or 24 h. Following treatment, cell culture media were collected and catecholamine levels quantified using the 3-Cat ELISA across two replicates.
To determine the effect of CO and H2S on glucocorticoid-regulated expression of catecholamine biosynthesis genes, PC12 cells were pretreated with 100 μM CORM-2 or 300 μM NaHS for 15 min, followed by a 6 h treatment with or without 1 μM dexamethasone (DEX). mRNA levels of catecholamine biosynthetic genes were quantified via RT-qPCR across three replicates. A preliminary investigation was conducted to determine the effect of CO and H2S on the glucocorticoid-mediated catecholamine levels in culture media. PC12 cells were pretreated with either 100 μM CORM-2 or 300 μM NaHS, followed by a treatment with 1 μM DEX for either 6 or 24 h. Cell culture media was then collected, and catecholamine levels were measured using a 3-Cat ELISA across two replicates.

2.3. RT-qPCR

RNA was isolated using the TRIzol reagent (Sigma-Aldrich Corp., MO, USA); 6 h after drug treatment, total RNA was extracted following the manufacturer’s protocols. Cell culture media was aspirated, 500 μL TRIzol was added to each well; plates were frozen at −80 °C for 24 h. RNA was separated from the total cell extract using centrifugation after the addition of chloroform (Thermo-Fisher Scientific). The aqueous phase was separated, and RNA was precipitated using isopropanol. After washing with 70% ethanol, the RNA pellet was resuspended in 20 μL DEPC-treated water. RNA concentrations were determined using the Nanodrop ND-1000 spectrophotometer (Nanodrop Technologies, Inc., Wilmington, DE, USA), RNA concentrations were measured in duplicate using 1 μL of resuspended RNA. RNA was then treated with DNase1 per the manufacturer’s instructions (Sigma-Aldrich) to a final concentration of 2 μg of RNA/22 μL H2O and subsequently reverse transcribed using Mu-MLV reverse transcriptase (Promega, Madison, WI, USA) to result in a final concentration of 0.04 μg cDNA/μL H2O. PCR was carried out using the GoTaq Flexi DNA polymerase (Promega) with 1 x GoTaq® master mix buffer (Promega), 2 ng/μL of forward and reverse primers, 100 ng cDNA sample, and water. PCR products were separated on 2% agarose gel and imaged by ChemiDoc Imagining System (BioRad Laboratories, Hercules, CA, USA). qPCR was performed in a 96-well plate using SYBR green master mix (Medi-Res), 2 ng/μL of forward and reverse primers and 30 ng sample cDNA and run in a QuantStudio Real-Time PCR System machine (Thermo-Fisher Scientific) using Design & Analysis 2 software (version 2.8.0). The RT-qPCR cycling parameters consisted of 95 °C for one minute, followed by a two-step denaturation and extension cycle of 95 °C for 15 s and 58–60 °C for 30 s for a total of 40 cycles. Plate reading was performed at the end of the extension phase. A DNA melt curve was conducted at the end of each RT-qPCR experiment to evaluate the specificity of amplification. The RT-qPCR data were analyzed using the 2−∆∆Ct analysis method [35]. Gene expression was normalized to glyceraldehyde 3-phosphate dehydrogenase (Gapdh) and Ribosomal Protein L32 (Rpl32). Genes of interest were Th, Dbh, and Pnmt. Primer sequences are outlined in Table 1.

2.4. Catecholamine ELISA

To determine the catecholamine content produced and released by PC12 cells, culture media was collected after treatments. To prevent catecholamine degradation, EDTA (final concentration 10 mM) and sodium metabisulfite (final concentration 4 mM) were added to the media and frozen at −80 °C until analysis. Catecholamine content was measured via a 3-Catecholamine ELISA kit (Labor Diagnostika Nord (LDN), Nordhorn, Germany) following the manufacturer’s protocol. In brief, dopamine, norepinephrine, and epinephrine were extracted using a cis-diol-specific affinity gel, which was acylated and enzymatically converted. The solution was then aliquoted to individual microtiter strips for each catecholamine, and a competitive enzyme-linked immunosorbent assay (ELISA) was performed as per manufacturer’s instructions; absorbance at 450 nm was measured in Synergy HTX Multi-Mode Microplate Reader (Agilent Technologies, Inc., Santa Clara, CA, USA).

2.5. Data Analysis

qPCR data were generated from at least three independent experiments per assay, while ELISA data were generated from at least two independent experiments per assay. For both, technical replicates were averaged to obtain one value per biological replicate, and results are presented as mean ± SEM. Statistical analyses were performed using Jamovi software (version 2.3.28). Group differences were assessed using one-way ANOVA, and when significant effects were detected, post hoc Tukey’s multiple comparisons test was applied. Data were inspected for normal distribution and homogeneity of variance prior to analysis.

3. Results

3.1. Effects of CO on the Expression of Catecholamine Biosynthesis Genes

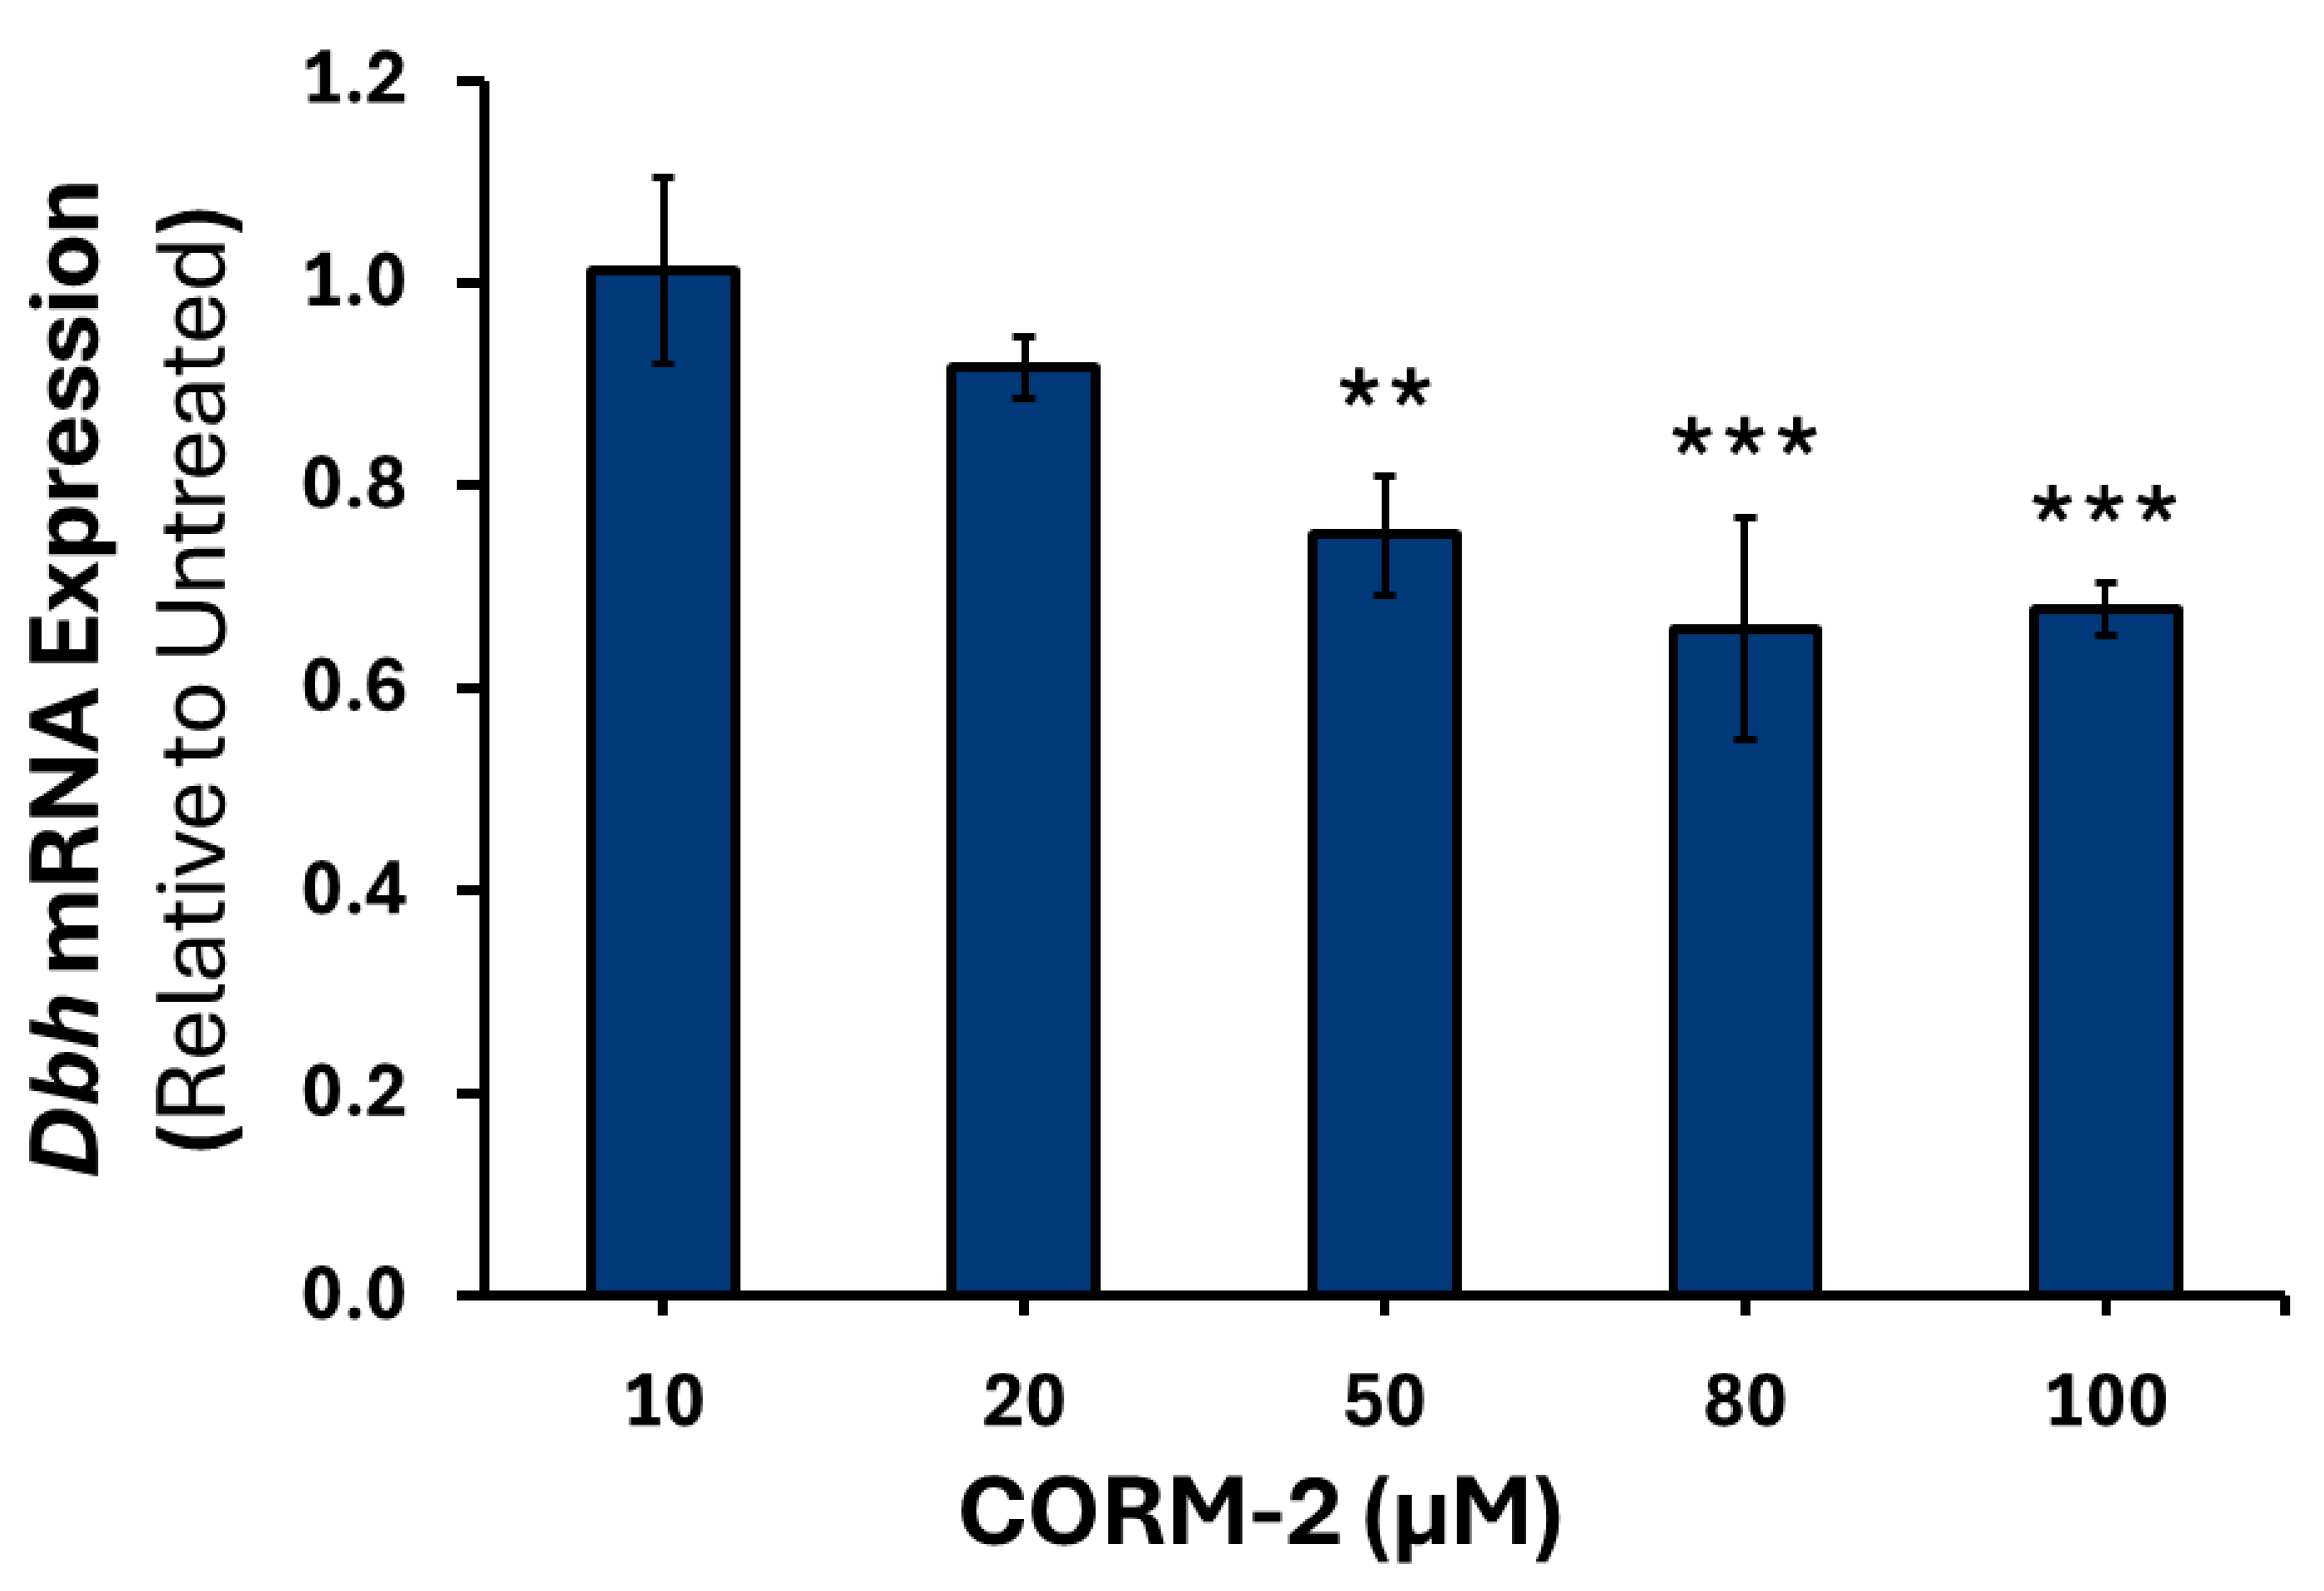
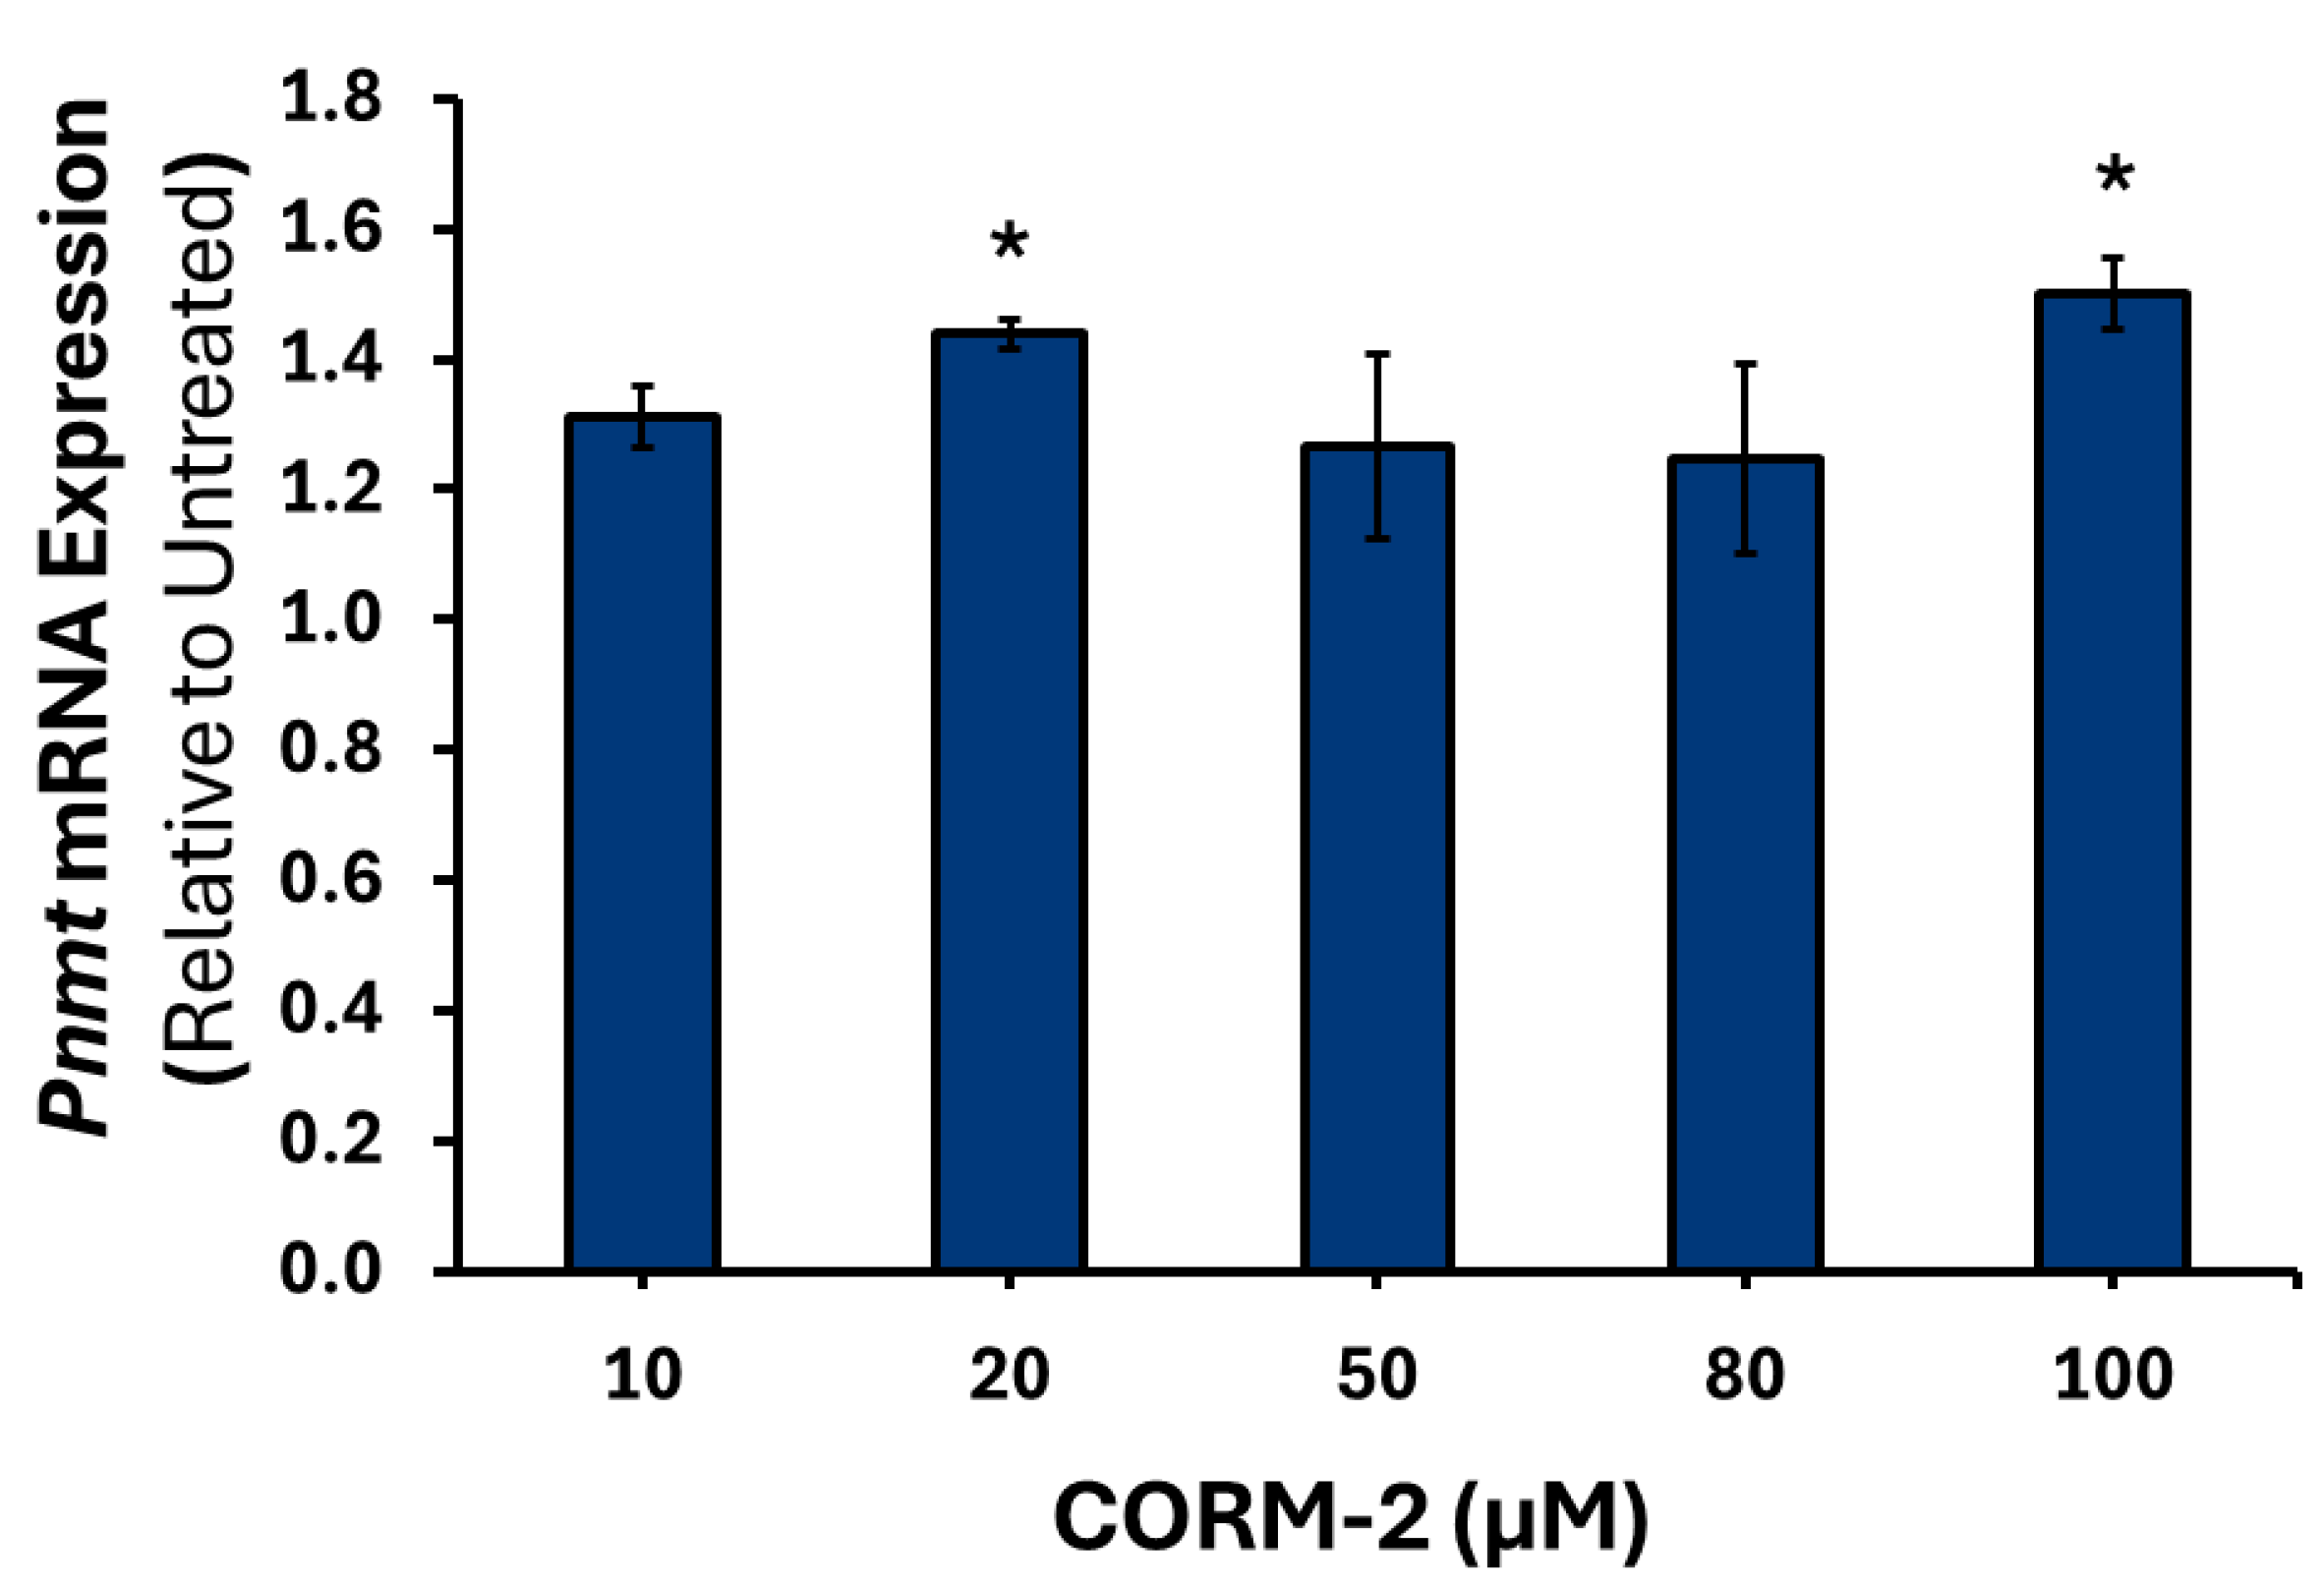
To confirm that the results observed were due to CO, treatment with inactive CORM-2 (iCORM-2) was performed (data not shown). Higher concentrations of CORM-2 induced moderate downregulation of Th mRNA, with 50 μM causing a 0.70-fold reduction (p = 0.001), 80 μM inducing a 1.61-fold decrease (p < 0.001), and 100 μM causing a 1.40-fold decrease (p < 0.01) relative to control (Figure 1). A similar pattern was observed for Dbh mRNA, with 50 μM causing a 1.33-fold decrease (p < 0.01), 80 μM a 1.53-fold decrease (p < 0.001), and 100 μM a 1.49-fold decrease (p < 0.001) compared to the control (Figure 2). However, a moderate increase in intronless Pnmt mRNA was detected at 20 μM, of 1.43-fold (p < 0.05) and 100 μM, of 1.50-fold (p < 0.05) (Figure 3).

3.2. Effects of H2S on the Expression of Catecholamine Biosynthesis Genes

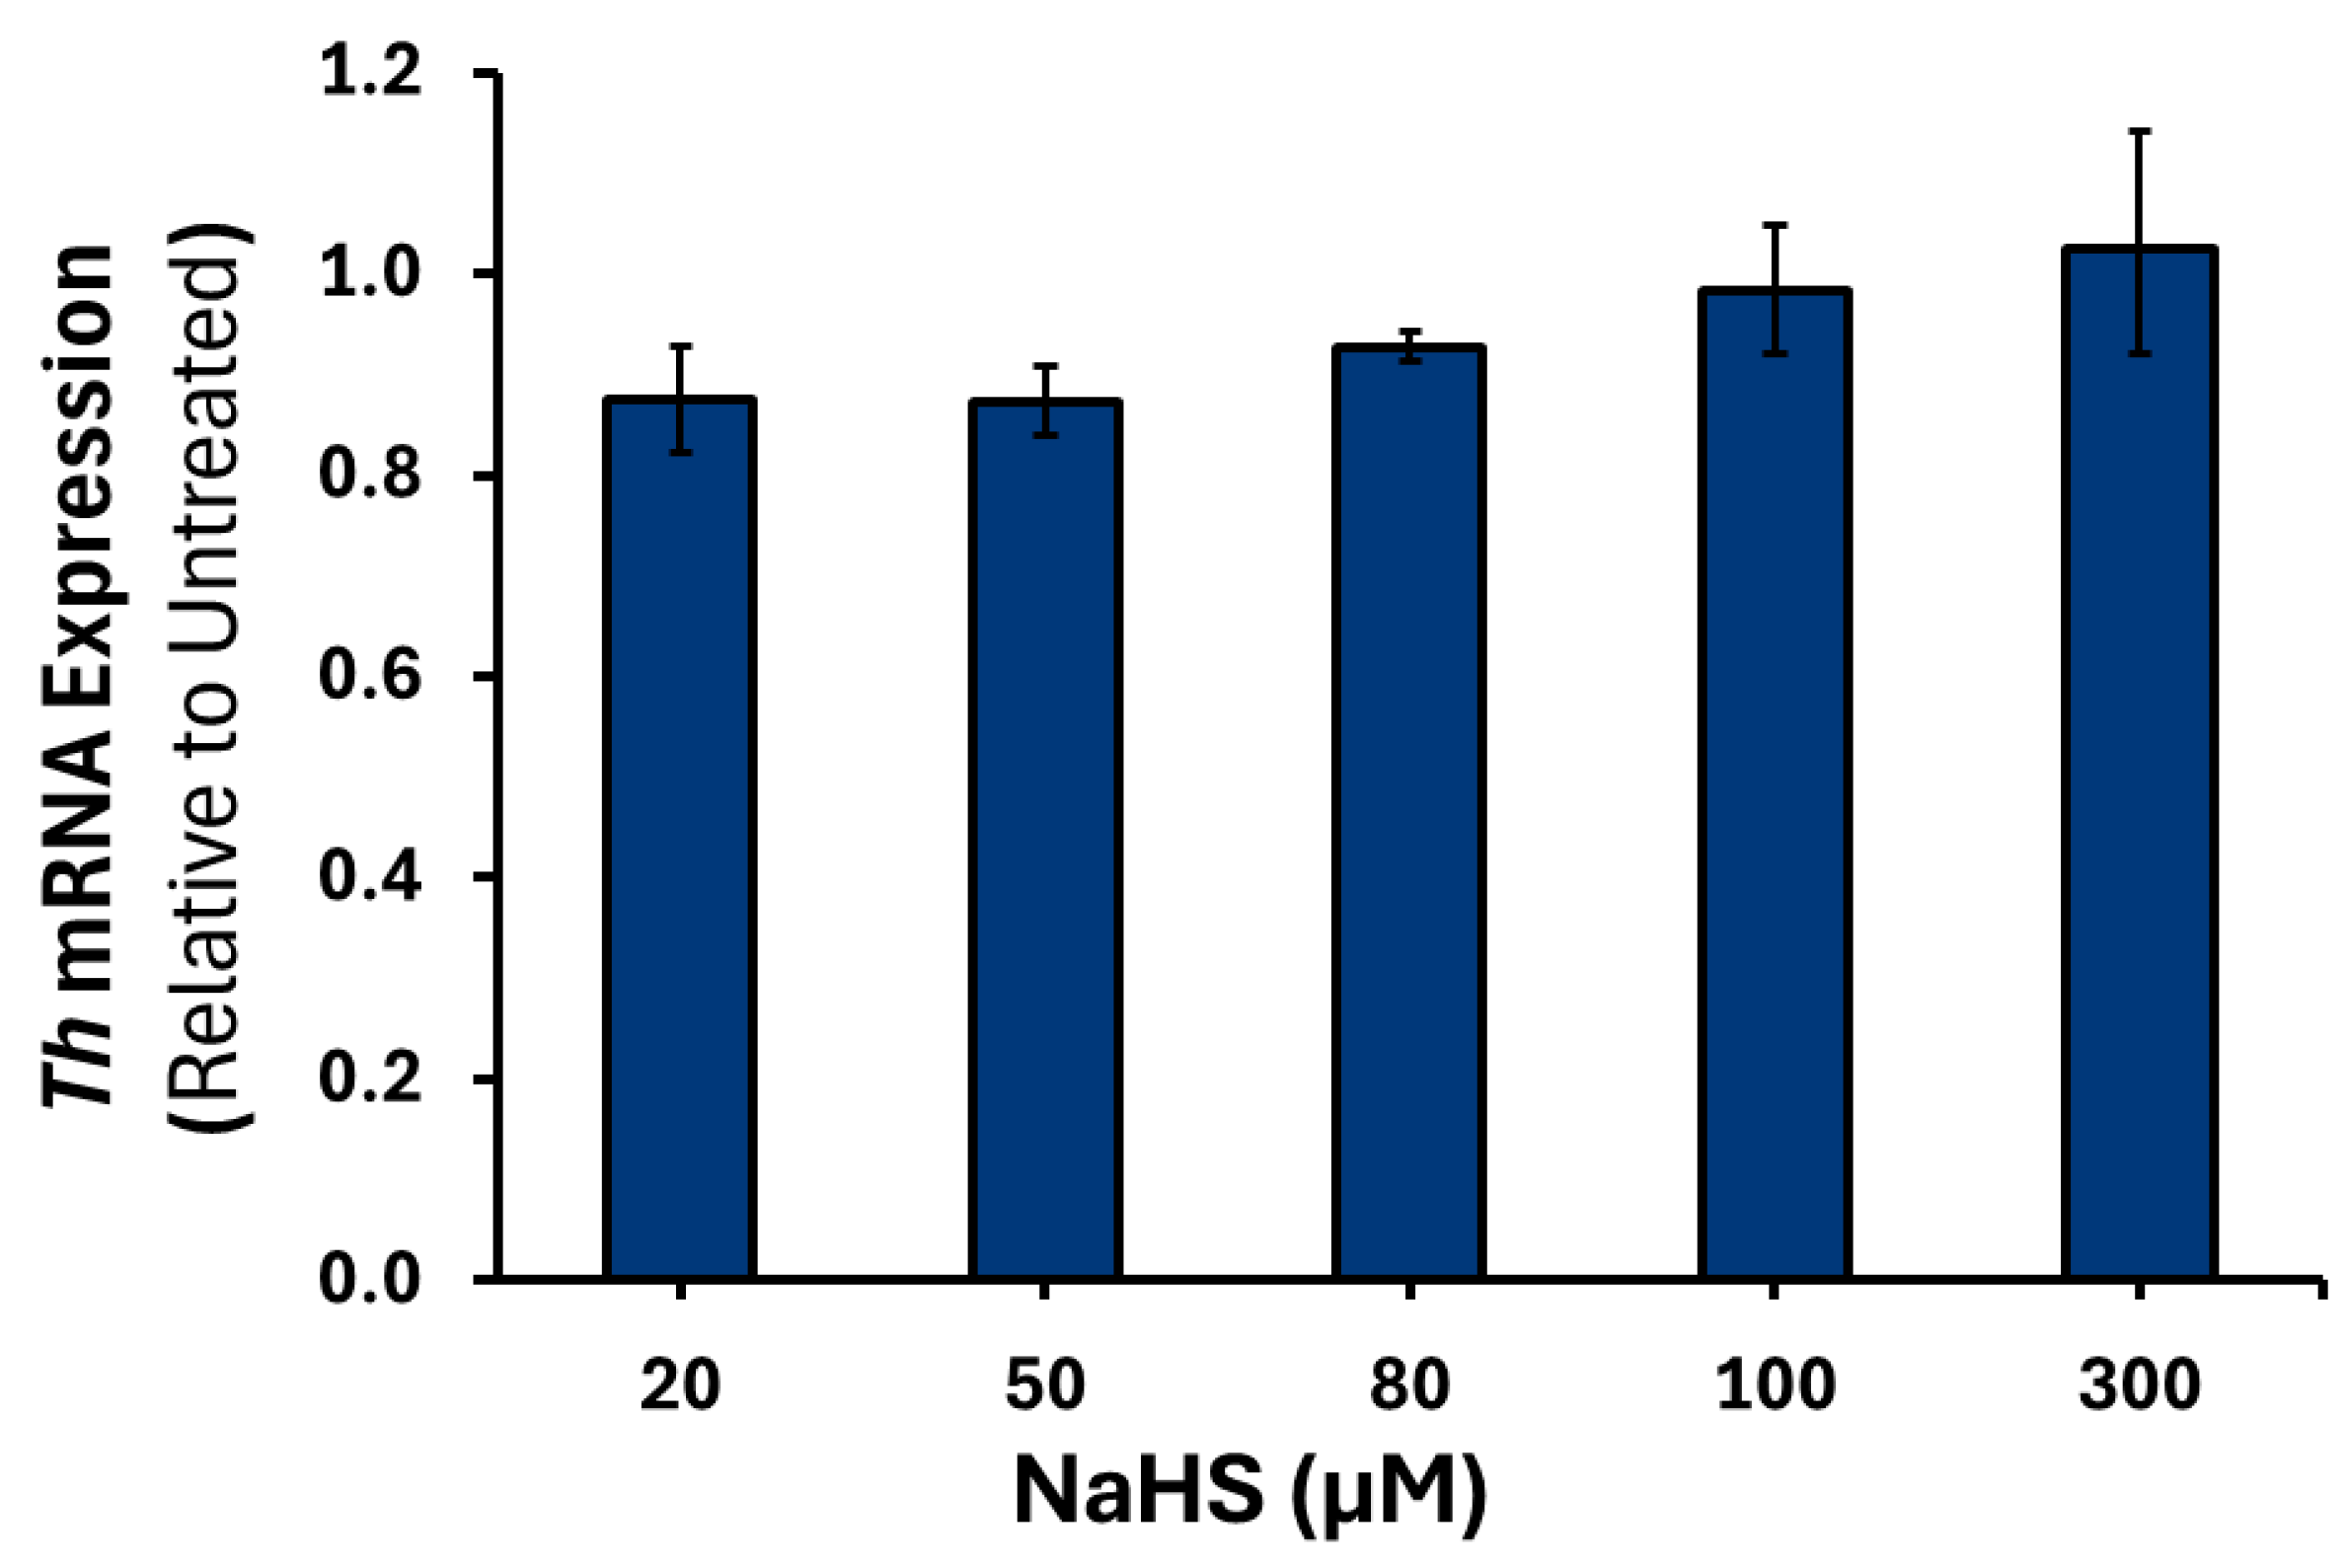
To confirm that the results observed were due to H2S, treatment with spent NaHS was performed (data not shown). No significant changes were observed in the expression of Th, Dbh, or Pnmt mRNA at any of the NaHS concentrations examined (Figure 4, Figure 5 and Figure 6).

3.3. Effects of CO and H2S on the Production and Release of Catecholamines

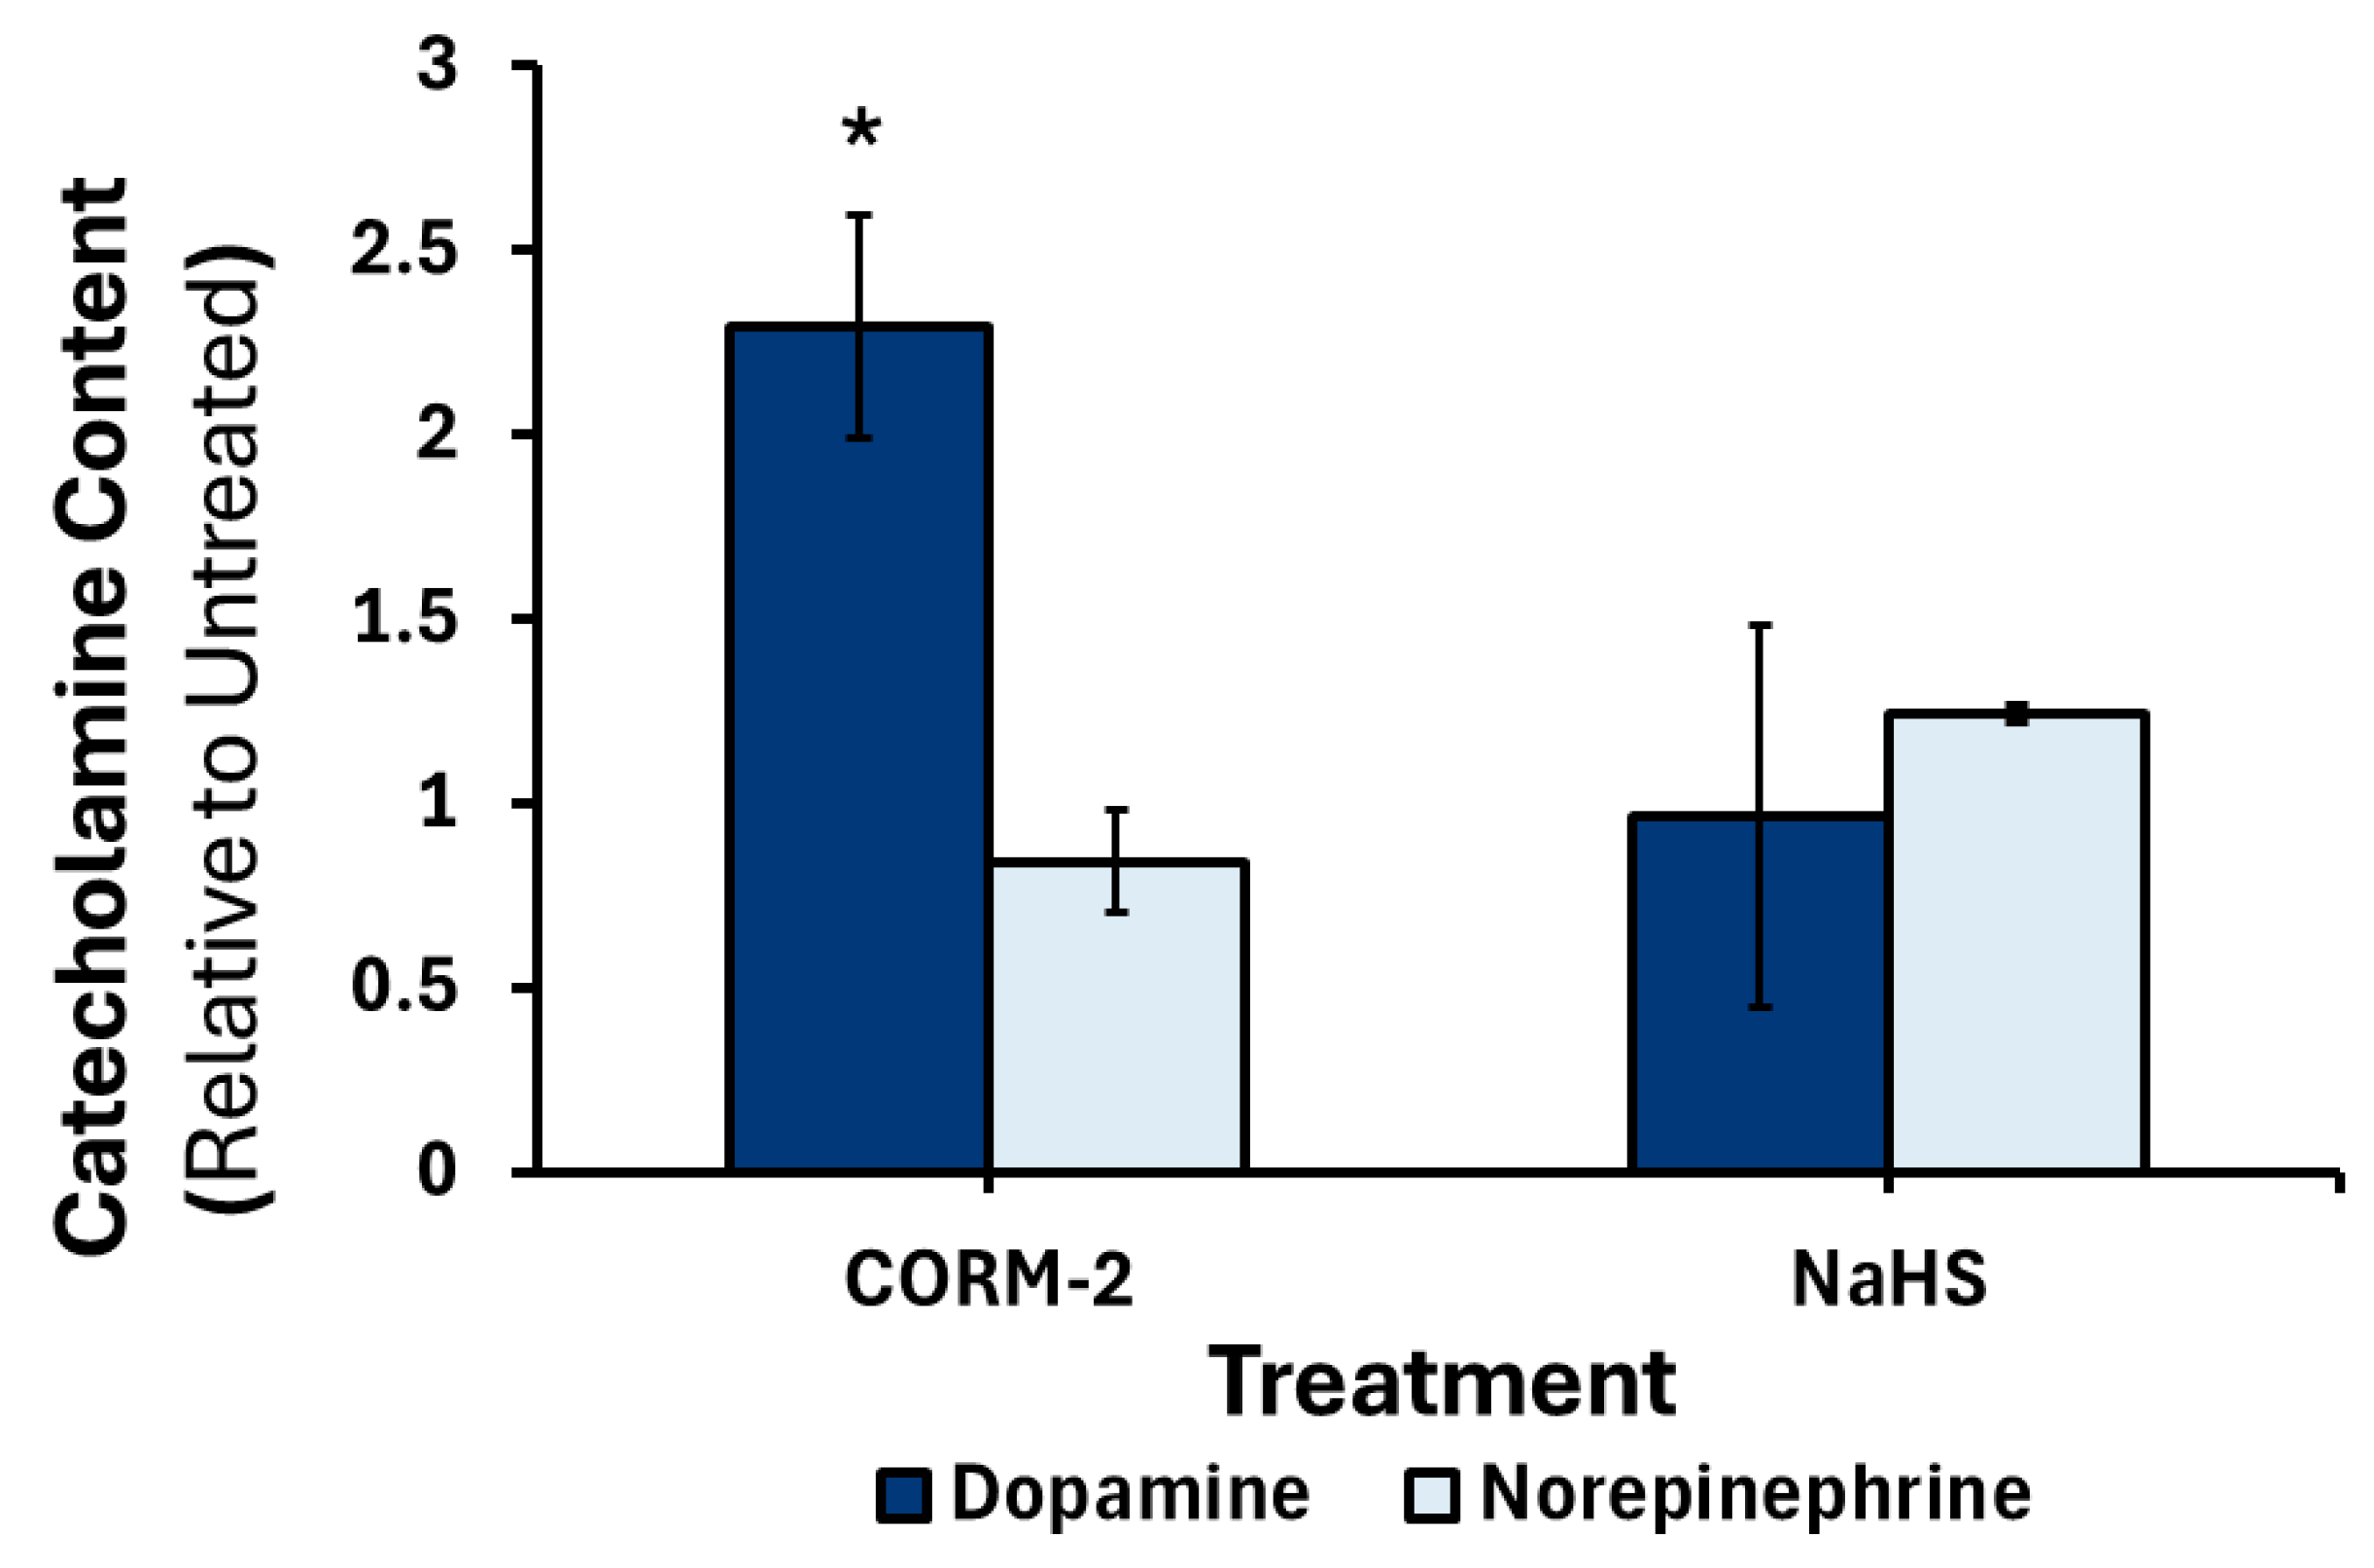
Six hours after treatment with CORM-2 or NaHS there was no significant change in dopamine or norepinephrine content compared to control (data not shown). After 24 h, NaHS treatment resulted in no change in catecholamine content while CORM-2 treatment resulted in a 2.2-fold (p < 0.05) increase in dopamine levels compared to control (Figure 7).

3.4. Effects of CO and H2S on the Regulation of DEX-Associated Expression of Catecholamine Biosynthesis Genes

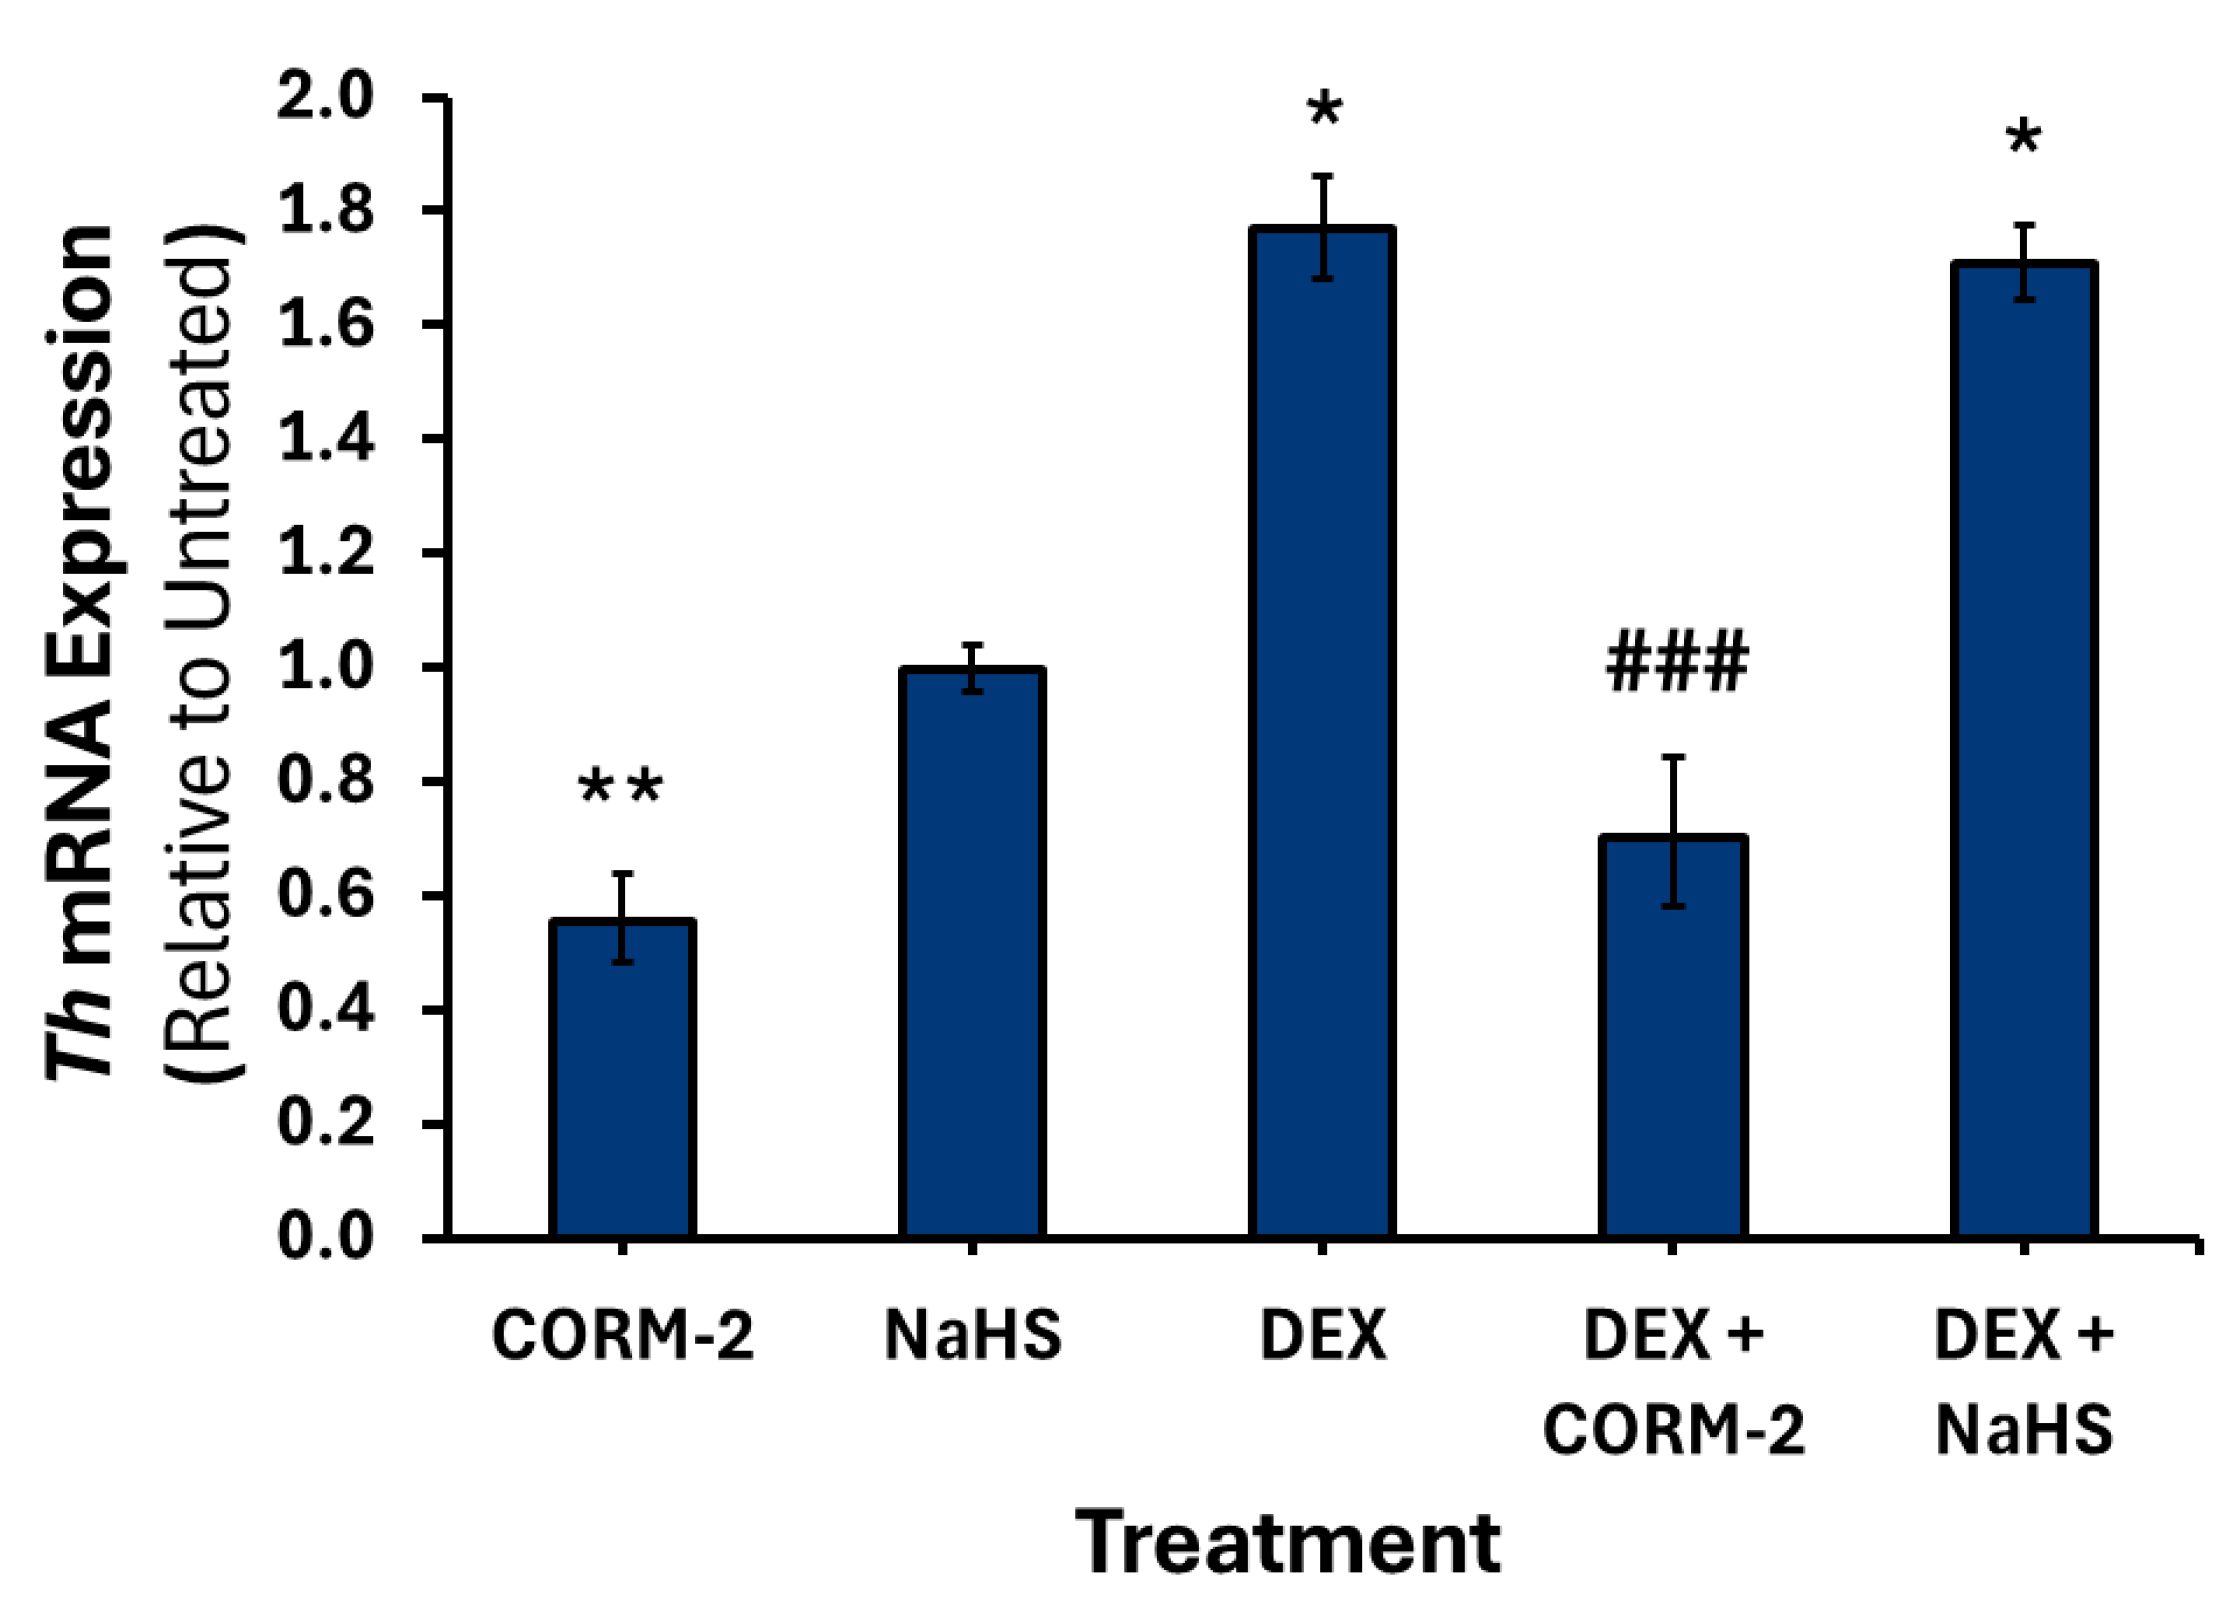
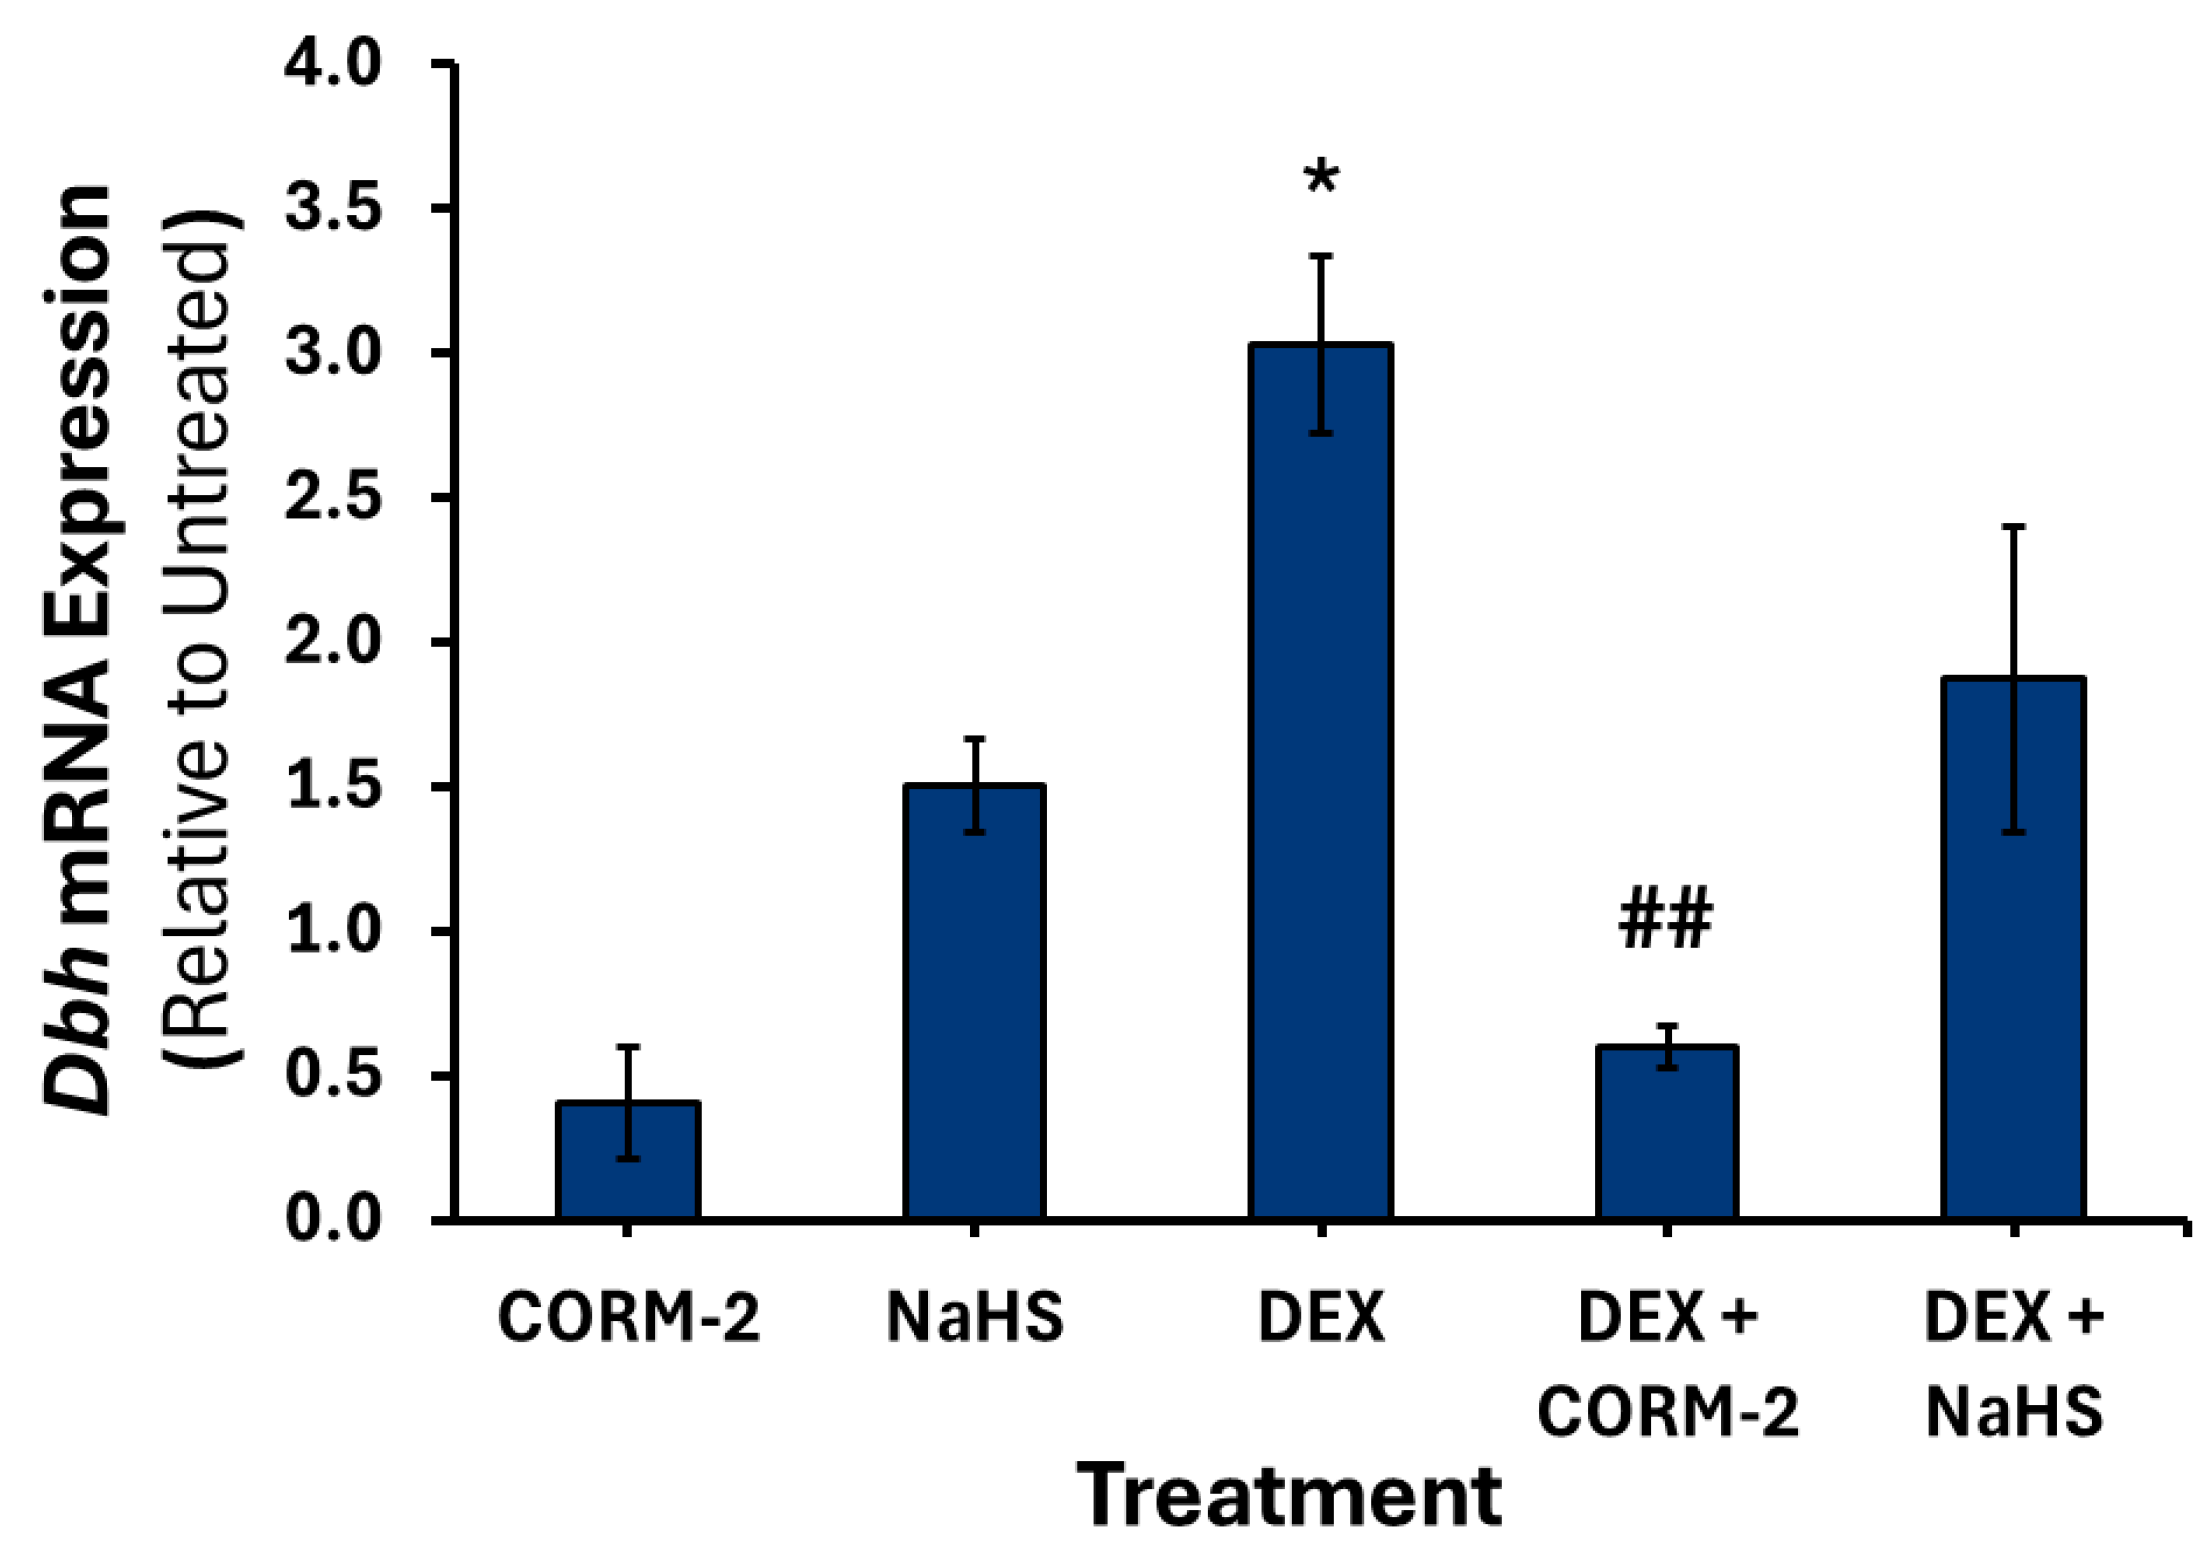
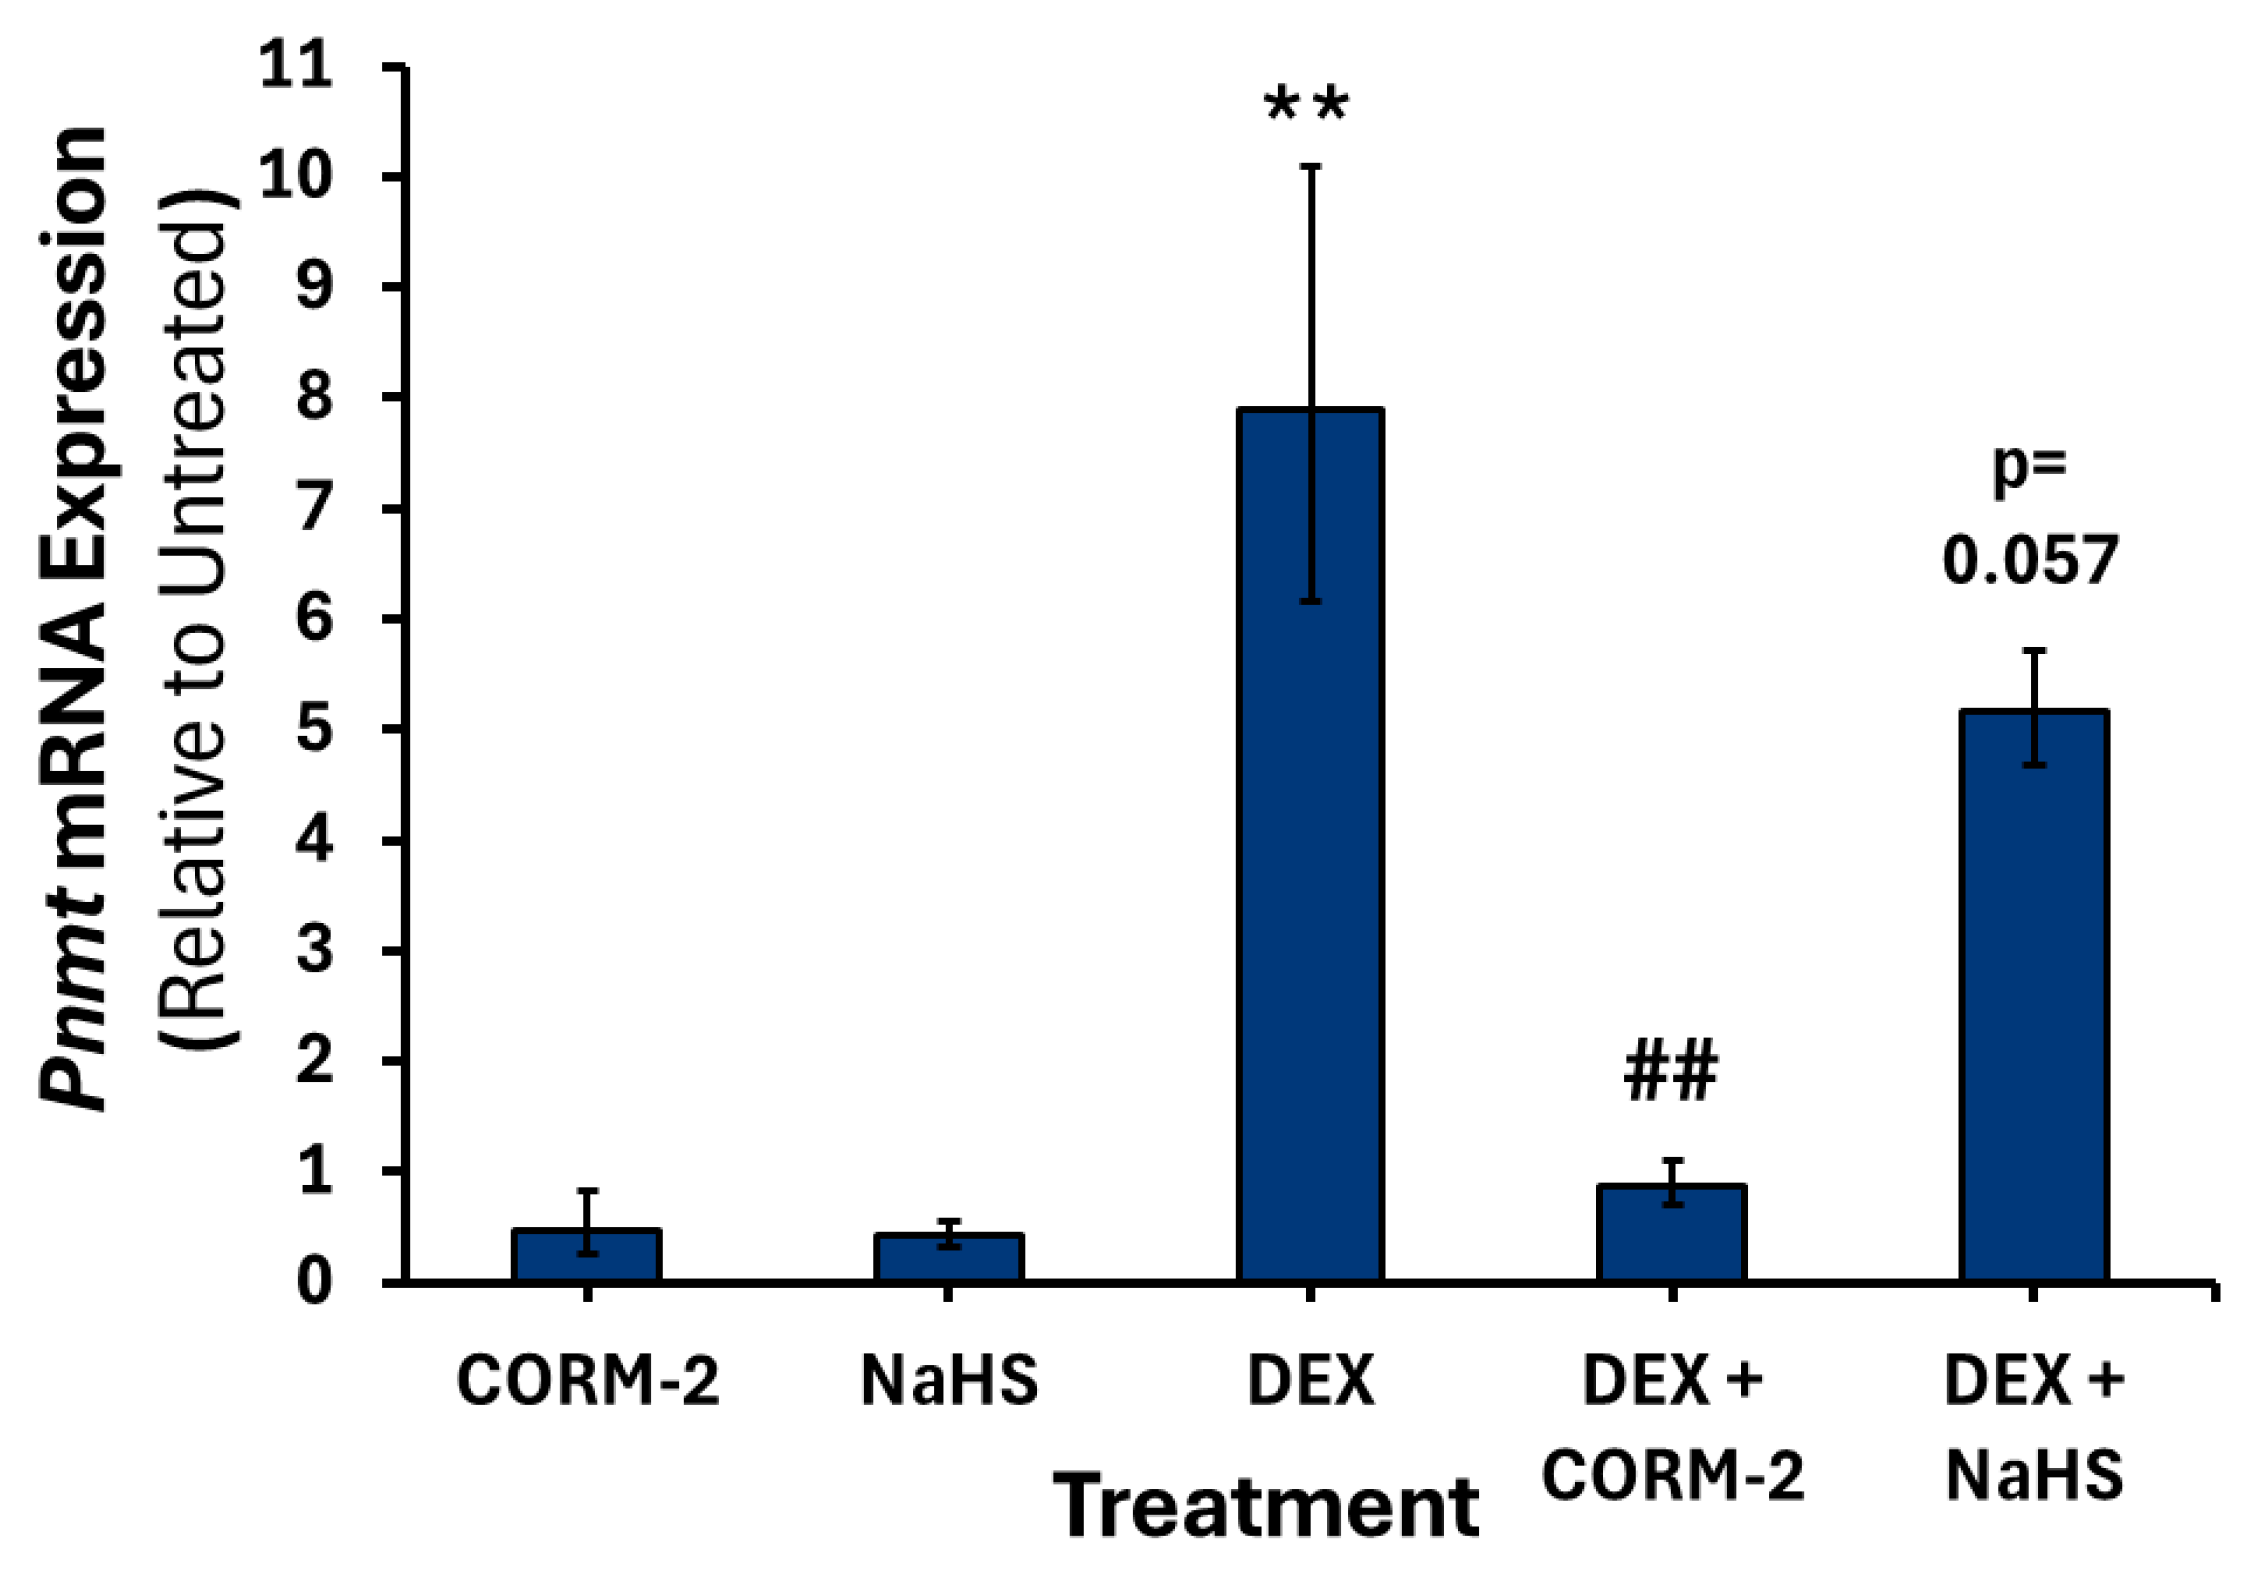
Treatment with DEX alone increased the expression of Th 1.7-fold (p < 0.05) (Figure 8), Dbh 3-fold (p < 0.05) (Figure 9), and Pnmt intronless 7.8-fold (p < 0.01) (Figure 10). Pretreatment with 100 μM CORM-2 significantly attenuated the DEX-mediated increase in Th (p < 0.001), Dbh (p < 0.01) and Pnmt (p < 0.01) mRNA expression. In contrast, pretreatment with 300 μM NaHS did not significantly alter DEX-mediated increase in any of the catecholamine biosynthesis genes. Notably, both DEX-treated mRNA levels of Dbh and Pnmt intronless were not significantly different from those of untreated controls after NaHS pretreatment.

3.5. Effects of CO and H2S on the DEX-Mediated Catecholamine Content in Culture Media

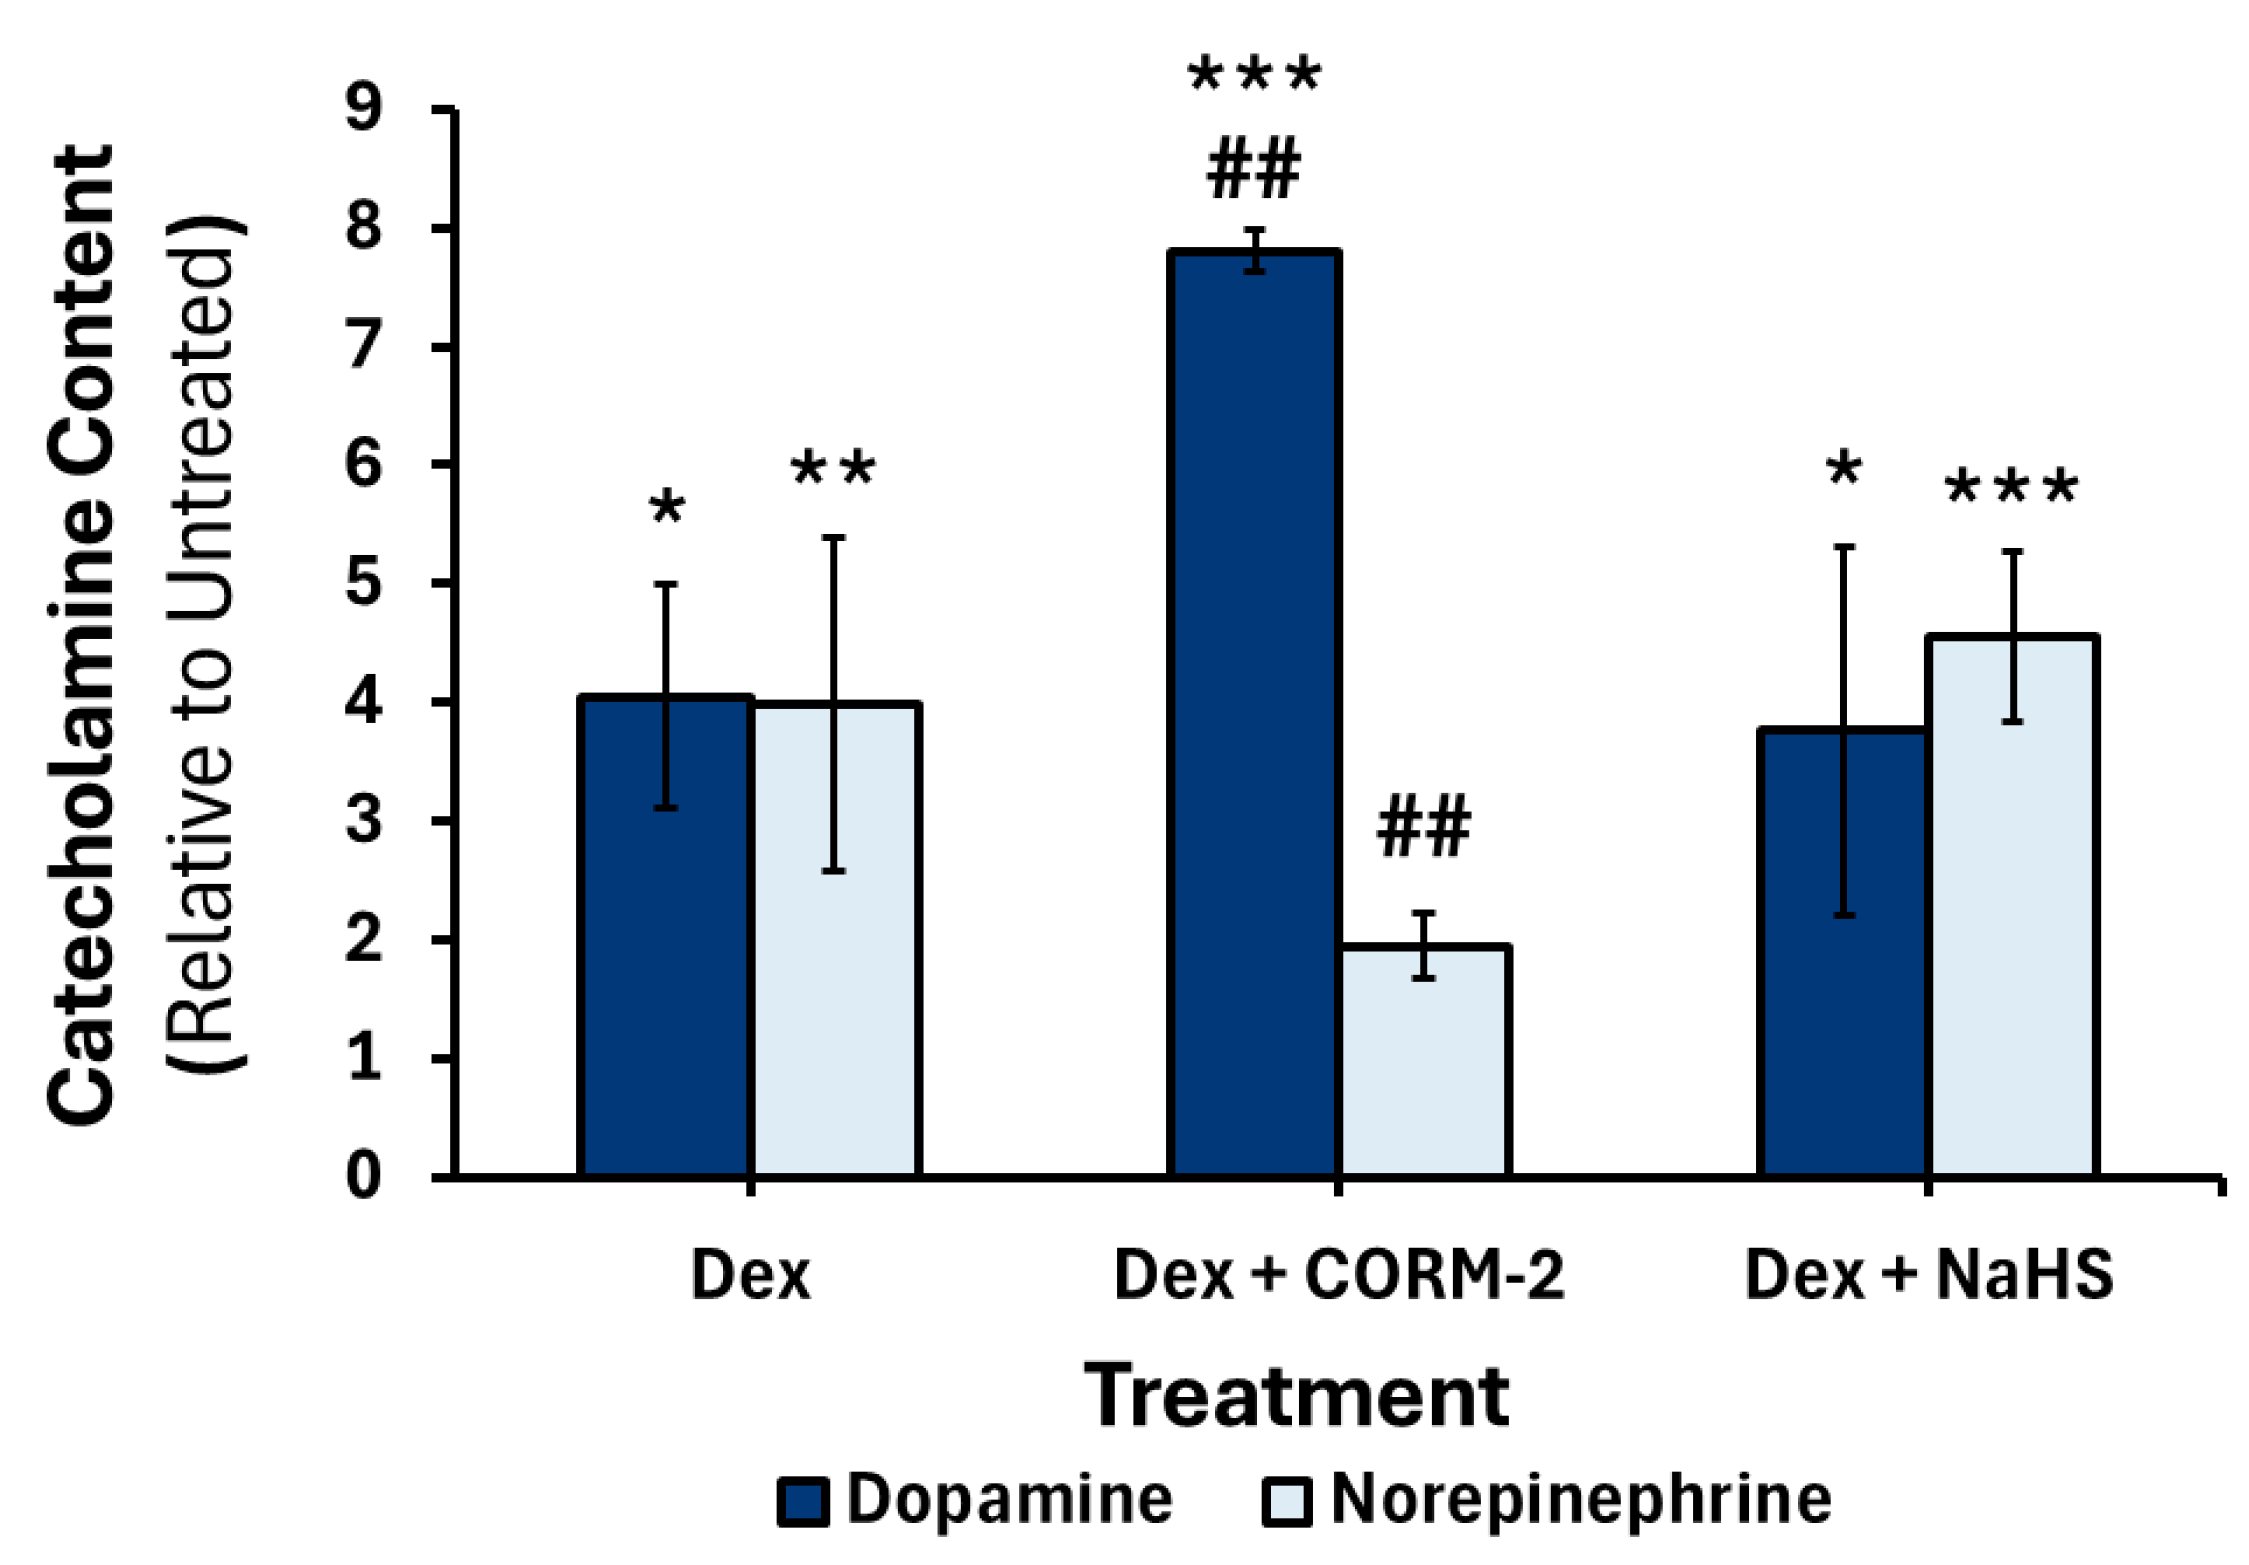
There was no change in catecholamine content after 6 h (data not shown). After 24 h, DEX treatment significantly increased norepinephrine levels 3.9-fold (p < 0.01) (Figure 11); this increase was attenuated by pretreatment of CORM-2 (p < 0.01) but not NaHS, which showed a 4.5-fold (p < 0.001) increase compared to untreated control (Figure 11). After 24 h, DEX treatment significantly increased dopamine levels 4.0-fold (p < 0.01); this response was potentiated by pretreatment with CORM-2 (p < 0.01), resulting in a 7.7-fold (p < 0.001) increase in dopamine levels, compared to untreated control (Figure 11). Pretreatment with NaHS did not significantly affect the DEX-mediated increase in dopamine content (Figure 11).

4. Discussion

This study aimed to investigate the role of CO and H2S in regulating catecholamine production and release. In the present study, exogenous CO donation influenced the expression of enzymes involved in catecholamine biosynthesis. The doses of CORM-2 used in this study are below levels that induce cytotoxic effects in PC12 cells, with doses of 400 μM or higher for 6 h inducing cell death [36], suggesting that the resultant changes in catecholamine gene expression and content in media are dependent on the signaling action of CO. At the same time, there was no change in the expression of catecholamine biosynthesis genes following treatment of cells with the H2S donor NaHS. While H2S has been shown to induce the transient release of catecholamines [33,34], it is possible that the single NaHS treatment only induced a small amount of catecholamine at the start of our treatment, which would be insignificant over 24 h of basal release. NaHS releases H2S rapidly when in solution, with a half-life of about 5 min [37]. Therefore, the use of a single donation of NaHS limits the relevance of this study to the effects of exogenous donation of high concentrations on catecholamine biosynthesis. To determine the definitive role of H2S in catecholamine biosynthesis, periodic treatment with NaHS, use of slow-release donors, or induction of basal H2S production should be carried out in future studies. Alternatively, the role of H2S may be limited to maintaining mitochondrial function and glucocorticoid production in the adrenal cortex [32]. Glucocorticoids are extremely important in regulating catecholamines, particularly the expression and activity of PNMT [6,38]. Therefore, it is possible that the effects of H2S may be driven solely by H2S in the adrenal cortex, and NaHS treatment in adrenal chromaffin cells, such as PC12, will not have any effect.
A significant but moderate decrease in Th and Dbh mRNA expression was observed in response to the higher CORM-2 concentrations of 50, 80, and 100 μM. Interestingly, the expression of Pnmt did not follow the same trend. Instead, there was a significant but moderate increase in Pnmt intronless mRNA expression after treatment with 20 and 100 μM of CORM-2. The difference in response is interesting, considering the similarities in the promoter regions of each gene, which contain many common elements and are bound by similar transcription factors [39]. There are, however, some notable differences between the Th, Dbh and the Pnmt promoters. One difference is in the mechanism of responsiveness to cyclic adenosine monophosphate (cAMP)/protein kinase A (PKA) signalling. Both Th and Dbh have cAMP response element (CRE) motifs that have been capable of interacting with CRE-binding proteins (CREBs) [40,41], while the binding of early growth factor (Egr1) drives the cAMP responsiveness in the Pnmt promoter [42]. However, no direct evidence exists of exogenous CO donation inducing a cAMP response. Future studies are required to determine if this difference is due to a differential cAMP response.
Interestingly, both the Th and Dbh promoters contain activating protein-1 (AP-1) and homeodomain core recognition (HD) sites that enhance or participate in promoter response to cAMP [41]. These HD sites are binding sites for paired-like homeobox (Phox2, also known as Arix) proteins [43]. Phox2 proteins have been implicated in nervous system development, particularly in noradrenergic phenotypes [44]. The CRE element in the Dbh promoter overlaps with several other motifs, including AP-1 and an HD site [43]. Dbh requires interactions between Phox2, AP-1 proteins and CREB-binding proteins (CBP) for maximal response to cAMP [43]. After cAMP treatment, the AP-1 proteins bind to the CRE/AP-1/HD element switch from c-Jun and JunD to c-Fos, c-Jun, and JunD [41]. Similarly, the Th promoter also contains homeodomain core recognition (HD) sites proximal to an AP-1 motif, although these do not overlap with its CRE [41,45]. The binding of Phox2 to the HD site depends on the proximal AP-1 motif [41] but does not act synergistically with CREB [46]. These related AP-1/Phox2 mechanisms in the Th and Dbh promoters may explain the differential responses observed in our CORM-2 treatments.
PC12 cells were initially described as a noradrenergic cell line [47] before the discovery of low levels of Pnmt mRNA expression. To that end, Phox2a and Phox2b proteins have been observed in PC12 cells [48], and non-noradrenergic cell lines require transfection with Phox2 expression plasmids to exhibit increases in DBH activity in response to cAMP [46]. While there is no evidence of CO’s involvement in Phox2 production and activity, CO has been shown to regulate AP-1 proteins by modulating mitogen-activated protein kinase (MAPK) pathways [49]. CO has been implicated in extracellular signal-regulated kinase (ERK), c-Jun N-terminal kinase (JNK) and p38 MAPK pathways, often in an antiapoptotic role [49]. CORM-2 treatment has been shown to attenuate interleukin-1 beta (IL-1β)-induced activation of MAPK and AP-1 binding activities [50]. In PC12 cells, CO ameliorated nitrosative stress through MAPK pathways [51]. We hypothesize that the decrease in Th and Dbh mRNA expression is driven by CORM-2 inactivation of MAPK-mediated AP-1 protein-binding activities, and possibly the sequential inability of Phox2 to bind and lower transcription. Furthermore, the proposed mechanism would not affect the Pnmt promoter, which contains no known AP-1 or HD sites. The small G protein Rap1, a component of ERK MAPK signalling, has been identified as a contributor to cAMP/PKA upregulation of Dbh expression [41]. NO has been shown to inhibit Rap1 [52] and is a promising target for CO-dependent ERK-MAPK-pathway inhibition. To determine the differential effects of CO on Th, Dbh and Pnmt mRNA expression, future studies should investigate changes in transcription factor mRNA and protein expression after CORM-2 treatment, specifically AP-1 proteins and Phox2. Catecholamine biosynthesis gene promoter activity should also be examined. Additionally, the activation and inhibition of MAPK pathways can elucidate these differential effects, particularly confirming whether CO affects Rap1 activity.
The response of Th, Dbh and Pnmt to CO differed drastically from previous work with NO, in which exogenous donation of NO to PC12 cells by treatment with 100 μM SNP for 6 h resulted in significantly increased mRNA expression of Th 2.0-fold, Dbh 1.3-fold, and Pnmt intronless 2.0-fold [28]. This suggests a differential response of catecholamine biosynthesis genes to CO and NO. The CO and NO signalling pathways have similar targets and are involved in crosstalk [53]. CO and NO have been shown to activate soluble guanylate cyclase (sGC), the enzyme that catalyzes cyclic guanosine monophosphate (cGMP) production [53]. Treatment of PC12 cells with SNP increases cGMP content [54], and the upregulation of catecholamine biosynthetic genes by SNP in both PC12 and primary bovine adrenal medullary cells is dependent in part on the cGMP/cGMP-dependent protein kinase (PKG) pathway [28,55].
It is, therefore, interesting that CORM-2 treatment did not induce a similar cGMP-dependent increase in catecholamine biosynthesis gene expression. CO induction of cGMP and downstream signalling is less understood than that of NO and is a contentious area of research [56]. CO has a much lower affinity for and activation level of sGC compared to NO, resulting in only a 4–6-fold increase in activity, compared to the approximately 400-fold increase by NO [57]. Despite this difference in affinity, direct relationships between CO and cGMP have been confirmed in multiple systems [53]. One theory that reconciles these two facts is the potential of a molecule that sensitizes sGC to CO. The benzyl indazole derivative YC-1, a known activator of sGC, also increases sGC activity in response to CO [57]. YC-1 stabilization of the active configuration of sGC increases CO-dependent stimulation of sGC to levels similar to those of NO [57]. However, since this discovery, no naturally occurring YC-1-like molecule has been identified [56].
Some evidence suggests that CO may stimulate the activity of sGC and increase cGMP levels in PC12 cells. When PC12 cells are exposed to nerve growth factor (NGF), they extend neurites, and this neurite growth can be further improved by guanosine treatment [58]. Treatment with sGC inhibitors abolishes guanosine’s enhancement of NGF-dependent neurite outgrowth [59]. It was also found that inhibiting HOs but not NOS affects guanosine-enhanced sGC-mediated neurite outgrowth [59]. Additionally, the combined treatment of NGF and guanosine activated HO-2 and induced the expression of HO-1 [59]. Inhibition of HOs led to a reduction in cGMP levels [59]. However, the role of CO in sGC-mediated neurite outgrowth was not independently verified by treatment with a CO donor.
We theorize three possible explanations for why exogenous CO did not increase the expression of catecholamine biosynthetic genes. (1) CO alone does not induce sGC activity in PC12 cells. It is possible that PC12 does not produce an unknown YC-1-like or other molecule required for high-affinity binding and complete activation. Alternatively, treatment with NGF, as performed previously [57], which has been shown to increase cGMP levels [58], may be required for CO to induce sGC activity in PC12 cells. (2) Our CORM-2 treatments did not induce enough sGC activity to increase gene expression. As CO has a lower affinity and a more negligible effect on sGC activity, it is possible that a 6 h treatment with a quick-release donor, such as CORM-2, was not sufficient to induce cGMP/PKG-dependent gene expression. (3) Activation of additional signalling pathways is required to induce catecholamine biosynthetic gene expression. Our previous work with NO revealed that inhibitors for PKA, PKC, cGMP, and PKG all independently attenuated SNP’s induction of catecholamine biosynthesis genes [28]. To determine the differential effects of CO and NO on catecholamine biosynthesis genes, future studies should investigate changes in sGC activity and cGMP concentration after CORM-2 and SNP treatment, in combination, and at longer time points. The activation and inhibition of PKA, protein kinase C (PKC), and PKG pathways can also elucidate these differential effects.
Glucocorticoids significantly influence catecholamine biosynthesis, as the promoter regions of Th, Dbh, and Pnmt contain glucocorticoid response elements (GREs) [60,61,62]. Although the binding of glucocorticoid receptors (GRs) to the GREs within the Dbh promoter has not been conclusively confirmed, Dbh expression does respond to DEX [60]. Consequently, any alterations to the glucocorticoid response are likely linked to the modulation of the GR. CO has been shown to interact with GR. The HO-1 promoter contains a glucocorticoid response element; however, the direction of this response appears to be dependent on the cell type [63]. Therefore, it is plausible that exogenous CO donation attenuated DEX-mediated GR activity in PC12 cells, ameliorating the transcriptional response.
In the absence of glucocorticoids, GR resides in the cytosol in complex with several chaperones, including heat shock protein 90 (Hsp90) and heat shock protein 70 (Hsp70) [64]. These chaperone proteins prevent the degradation of GR and promote proper maturation of the protein, and coordination with Hsp90 and Hsp70 is required for GR’s high-affinity towards glucocorticoids [64]. Inhibition of Hsp90 results in GR degradation [65]. In human breast cancer cells, CO has been shown to inhibit Hsp90 activity and decrease the expression of some Hsp90 client proteins [66]. It is possible that CO’s ability to attenuate the DEX-mediated increase in mRNA expression of Th, Dbh, and Pnmt intronless may occur through modulation of Hsp90 activity, resulting in either increased GR degradation or a decrease in GR affinity towards DEX. However, in astrocytes, exogenous CO has been shown to stabilize hypoxia-inducible transcription factor-1α (HIF-1α) by increasing HIF-1α/Hsp90 interactions [67]. This suggests that CO modulation of Hsp90 activity plays different roles depending on the cell type or client protein. The CO-induced stabilization of HIF-1α by Hsp90 is also of interest, as HIF-1α is a critical transcription factor in the response of catecholamine biosynthesis genes to hypoxic conditions [68]. Additionally, HIF-2α is also vital to the development of catecholaminergic sympathoadrenal cells [69,70], and the basal production of epinephrine by regulating Pnmt [71]. This highlights the importance of HIFs in catecholamine biosynthesis. Determining how Hsp90 activity changes in PC12 cells after CO donation would help confirm its role in glucocorticoid and HIF-mediated regulation.
Cytochrome P450 3A4 (CYP3A4) is an enzyme that inactivates several pharmacological substances, including DEX [72,73]. Interestingly, CYP3A4 is inhibited by both CO and NO [74,75]. However, while active CYP3A4 has been identified in adrenocortical carcinomas [76], it is unclear whether adrenal medullary or PC12 cells express this isoform. Given that CO ameliorated the DEX response of all three catecholamine biosynthesis genes, it seems unlikely that CO-dependent inhibition of CYP3A4 occurred. It is also important to note that a previous study utilized a photo-activated CORM to inhibit CYP3A4, and it is, therefore, possible that the difference in release rate may contribute to the differential response [75]. It is also possible that NO, which potentiates the DEX response in Th, Dbh, and Pnmt [28], may inhibit CYP3A4 or a homologous protein in PC12 cells, while CO is unable. Investigating CYP3A4 or other cytochrome P450 enzymes may elucidate the differential response of CO and NO to DEX-mediated upregulation of catecholamine biosynthesis genes.
Circadian rhythm signalling is another pathway that may mediate the interactions between glucocorticoids, blood pressure, catecholamines and carbon monoxide. Whole transcriptome analysis of DEX programmed Wistar–Kyoto rats and SHR has highlighted circadian signalling as a potential mechanism of the development of hypertension [77]. Both dopamine degradation, as catalyzed by monoamine oxidase, and dopamine synthesis, as catalyzed by TH, are under clock influence [78]. In particular, the circadian rhythm factor Neuronal PAS domain protein 2 (NPAS2) expression was decreased in SHR [77]. NPAS2 is a CO-responsive factor [79,80]. NPAS2 contains a heme motif, which controls its transcriptional activity, with CO binding inhibiting DNA binding [80]. Future studies should investigate the transcriptional regulation of Th, Dbh and Pnmt by NPAS2 as a potential key modulator of catecholamine biosynthesis through circadian signalling, glucocorticoids and CO.
The DEX-mediated increase in norepinephrine levels was attenuated when cells were pretreated with CORM-2. This result aligns with the similar attenuation of the DEX-mediated increase in the mRNA expression of Dbh, suggesting the decrease likely affects the levels of translated DBH. However, this study did not measure DBH protein levels and enzyme activity, and CO may be affecting the production of DBH at steps other than transcription. Future studies should investigate the catecholamine biosynthetic enzyme levels and activity. Interestingly, there was an increase in the amount of dopamine in the cell culture media after treatment with CORM-2 and DEX compared to DEX alone. This is in contrast to the significant attenuation of the DEX-mediated increase in the mRNA expression of TH, the rate-limiting enzyme responsible for dopamine production [81]. This suggests that CO may be affecting protein translation, stability, activity, or dopamine release in addition to affecting gene transcription. CO has been shown to induce dopamine release [82]. Rats exposed to pure CO gas for short intervals showed significantly higher dopamine concentrations in the striatum [83]. Additionally, pure CO gas reduces dopamine reuptake [84]. While these studies use vastly higher concentrations of CO than those used in this study, they show a link between CO and dopamine release. Exposure of neuronal stem cells to lower (~25 ppm) intermittent exposures of CO using a novel CORM resulted in an increase in cell survival and dopaminergic differentiation [85]. Additionally, the CO exposure increased Th mRNA and protein expression [85]. A treatment using 100 μM CORM-2 in PC12 cells decreased Th mRNA expression. The discrepancy between results may be due to differences in cell type, dosage, or dosage timing and duration. CORMs with different chemistry and release rates have been shown to modulate different pathways [86]. Regardless, these results highlight the ability of CO to modulate dopamine production and release. It is important to highlight the preliminary nature of this study’s analysis of catecholamine content in media. Future studies should investigate changes in catecholamine content at longer time points, repeated gas donation, and with additional replicates to ensure statistical reliability. Additionally, the use of liquid chromatography–mass spectrometry would allow for high-sensitivity detection of catecholamines.
TH differs from DBH as, in addition to being transcriptionally activated by DEX, it is also enzymatically activated by DEX [87,88]. This activation may be a result of phosphorylation of Ser31 [89], a critical serine residue [90]. Glucocorticoids, including DEX, have been shown to activate the catalytic and regulatory activities of the cAMP/PKA pathway; however, the exact mechanism remains unclear [91,92]. Additionally, 100 μM of CORM-2 has been shown to inhibit cAMP production induced by forskolin in bronchial epithelial cells [93], and increase cAMP levels in serum-starved pluripotent stem cells [94]. Therefore, it is plausible that despite CO inhibiting Th gene expression through GR-dependent means, DEX and CO are increasing TH enzymatic activity through GR-independent means, namely phosphorylation of critical serine residues on TH via activation of the cAMP/PKA pathway. This could explain why CO potentiated the production and release of dopamine despite ameliorating the DEX response on the transcription of Th. In the present study, changes in the protein levels of catecholamine-synthesizing enzymes were not analyzed; future studies should investigate the effects of gas transmitters on catecholamine biosynthesis enzyme expression.

5. Conclusions

In summary, this study demonstrates that exogenous CO, but not H2S, regulates catecholamine biosynthetic enzymes. CO decreased Th and Dbh expression while slightly increasing Pnmt and attenuated the DEX-mediated upregulation of these genes, consistent with possible effects on glucocorticoid signalling. Short-term H2S treatment did not alter catecholamine biosynthetic gene expression or catecholamine content, suggesting its role may be limited or indirect. CO also produced differential effects on dopamine and norepinephrine release, underscoring its distinct actions. Taken together, these findings identify CO as a novel regulator of catecholamine biosynthesis and highlight essential differences in how gas transmitters influence stress-related pathways.

Author Contributions

Conceptualization, R.D., S.T. and T.C.T.; methodology, R.D., C.H., J.L., S.T. and T.C.T.; validation, R.D.; formal analysis, R.D.; investigation, R.D.; resources, S.T. and T.C.T.; writing—original draft preparation, R.D.; writing—review and editing, R.D., C.H., J.L., S.T. and T.C.T.; visualization, R.D.; supervision, S.T. and T.C.T.; project administration, S.T. and T.C.T.; funding acquisition, T.C.T. All authors have read and agreed to the published version of the manuscript.

Funding

This research was funded by the Natural Sciences and Engineering Research Council (NSERC) Discovery Grant (RGPIN-2018-06833). RD was supported by an NSERC USRA Award.

Data Availability Statement

The original contributions presented in this study are included in the article. Data inquiries can be directed to the corresponding author. PC12 cells were obtained from the University of California, San Diego (UCSD, San Diego, CA, USA).

Conflicts of Interest

The authors declare no conflicts of interest.

Abbreviations

The following abbreviations are used in this manuscript:
3MST3-Mercaptopyruvate Sulfurtransferase
AP-1Activating protein-1
CREcAMP response element
COCarbon monoxide
CBSCystathionine β-synthase
CSECystathionine γ-lyase
CYP3A4Cytochrome P450 3A4
DEXDexamethasone
DBHDopamine β-hydroxylase
Egr1Early growth factor
ELISAEnzyme-linked immunosorbent assay
ERKExtracellular signal-regulated kinase
GRGlucocorticoid receptor
GREGlucocorticoid response element
GCsGlucocorticoids
GAPDHGlyceraldehyde 3-phosphate dehydrogenase
Hsp70Heat shock protein 70
Hsp90Heat shock protein 90
HOHeme oxygenase
HDHomeodomain core recognition
H2SHydrogen sulfide
HPAHypothalamic–pituitary–adrenal
HIF-1αHypoxia-inducible transcription factor-1α
IL-1βInterleukin-1 beta
mRNAMessenger RNA
MAPKMitogen-activated protein kinase
NGFNerve growth factor
NONitric oxide
NPAS2Neuronal PAS domain protein 2
PNMTPhenylethanolamine N-methyltransferase
PKAProtein kinase A
PKCProtein kinase C
RT-qPCRReal-time quantitative polymerase chain reaction
Rpl32Ribosomal Protein L32
NaHSSodium hydrosulfide
SNPSodium nitroprusside
sGCSoluble guanylyl cyclase
SHRSpontaneously hypertensive rat
THTyrosine 3-hydroxylase

References

  1. Pocock, G.; Richards, C.D.; Richards, D.A. Human Physiology; Oxford University Press: England, UK, 2018. [Google Scholar]
  2. Tank, A.W.; Lee Wong, D. Peripheral and Central Effects of Circulating Catecholamines. Compr. Physiol. 2015, 5, 1–15. [Google Scholar] [CrossRef] [PubMed]
  3. Kvetnansky, R.; Sabban, E.L.; Palkovits, M. Catecholaminergic Systems in Stress: Structural and Molecular Genetic Approaches. Physiol. Rev. 2009, 89, 535–606. [Google Scholar] [CrossRef]
  4. Wurtman, R.J. Stress and the Adrenocortical Control of Epinephrine Synthesis. Metab. Clin. Exp. 2002, 51, 11–14. [Google Scholar] [CrossRef]
  5. Sharara-Chami, R.I.; Joachim, M.; Pacak, K.; Majzoub, J.A. GLUCOCORTICOID TREATMENT-EFFECT ON ADRENAL MEDULLARY CATECHOLAMINE PRODUCTION. Shock 2010, 33, 213–217. [Google Scholar] [CrossRef]
  6. Kim, K.-T.; Park, D.H.; Joh, T.H. Parallel Up-Regulation of Catecholamine Biosynthetic Enzymes by Dexamethasone in PC12 Cells. J. Neurochem. 1993, 60, 946–951. [Google Scholar] [CrossRef]
  7. Nagatsu, T.; Stjärnet, L. Catecholamine Synthesis and Release. In Advances in Pharmacology; Goldstein, D.S., Eisenhofer, G., McCarty, R., Eds.; Academic Press: Cambridge, MA, USA, 1997; pp. 1–14. [Google Scholar]
  8. Goldstein, D.S. Plasma Catecholamines and Essential Hypertension. An Analytical Review. Hypertension 1983, 5, 86–99. [Google Scholar] [CrossRef]
  9. Axelrod, J. Catecholamines and Hypertension. Clin. Sci. Mol. Med. 1976, 51, 415s–421s. [Google Scholar] [CrossRef] [PubMed]
  10. Reja, V.; Goodchild, A.K.; Pilowsky, P.M. Catecholamine-Related Gene Expression Correlates with Blood Pressures in SHR. Hypertension 2002, 40, 342–347. [Google Scholar] [CrossRef] [PubMed]
  11. Hoehe, M.R.; Plaetke, R.; Otterud, B.; Stauffer, D.; Holik, J.; Byerley, W.F.; Baetge, E.E.; Gershon, E.S.; Lalouel, J.-M.; Leppert, M. Genetic Linkage of the Human Gene for Phenylethanol-Amine N-Methyltransferase (Pnmt), the Adrenaline-Synthesizing Enzyme, to DNA Markers on Chromosome 17q21–Q22. Hum. Mol. Genet. 1992, 1, 175–178. [Google Scholar] [CrossRef]
  12. Kaneda, N.; Ichinose, H.; Kobayashi, K.; Oka, K.; Kishi, F.; Nakazawa, A.; Kurosawa, Y.; Fujita, K.; Nagatsu, T. Molecular Cloning of cDNA and Chromosomal Assignment of the Gene for Human Phenylethanolamine N-Methyltransferase, the Enzyme for Epinephrine Biosynthesis. J. Biol. Chem. 1988, 263, 7672–7677. [Google Scholar] [CrossRef]
  13. Koike, G.; Jacob, H.J.; Krieger, J.E.; Szpirer, C.; Hoehe, M.R.; Horiuchi, M.; Dzau, V.J. Investigation of the Phenylethanolamine N-Methyltransferase Gene as a Candidate Gene for Hypertension. Hypertension 1995, 26, 595–601. [Google Scholar] [CrossRef]
  14. Nguyen, P.; Peltsch, H.; de Wit, J.; Crispo, J.; Ubriaco, G.; Eibl, J.; Tai, T.C. Regulation of the Phenylethanolamine N-Methyltransferase Gene in the Adrenal Gland of the Spontaneous Hypertensive Rat. Neurosci. Lett. 2009, 461, 280–284. [Google Scholar] [CrossRef]
  15. Mustafa, A.K.; Gadalla, M.M.; Snyder, S.H. Signaling by Gasotransmitters. Sci. Signal. 2009, 2, re2. [Google Scholar] [CrossRef]
  16. Feelisch, M.; te Poel, M.; Zamora, R.; Deussen, A.; Moncada, S. Understanding the Controversy over the Identity of EDRF. Nature 1994, 368, 62–65. [Google Scholar] [CrossRef]
  17. Furchgott, R.F.; Zawadzki, J.V. The Obligatory Role of Endothelial Cells in the Relaxation of Arterial Smooth Muscle by Acetylcholine. Nature 1980, 288, 373–376. [Google Scholar] [CrossRef]
  18. Hermann, M.; Flammer, A.; Lüscher, T.F. Nitric Oxide in Hypertension. J. Clin. Hypertens. 2006, 8, 17–29. [Google Scholar] [CrossRef] [PubMed]
  19. Shi, J.; Liu, S.; Guo, Y.; Liu, S.; Xu, J.; Pan, L.; Hu, Y.; Liu, Y.; Cheng, Y. Association between eNOS Rs1799983 Polymorphism and Hypertension: A Meta-Analysis Involving 14,185 Cases and 13,407 Controls. BMC Cardiovasc. Disord. 2021, 21, 385. [Google Scholar] [CrossRef]
  20. Taha, H.; Skrzypek, K.; Guevara, I.; Nigisch, A.; Mustafa, S.; Grochot-Przeczek, A.; Ferdek, P.; Was, H.; Kotlinowski, J.; Kozakowska, M.; et al. Role of Heme Oxygenase-1 in Human Endothelial Cells. Arterioscler. Thromb. Vasc. Biol. 2010, 30, 1634–1641, Correction in Arterioscler Thromb Vasc Biol. 2010, 30, e166. [Google Scholar] [CrossRef] [PubMed]
  21. Martasek, P.; Schwartzman, M.L.; Goodman, A.I.; Solangi, K.B.; Levere, R.D.; Abraham, N.G. Hemin and L-Arginine Regulation of Blood Pressure in Spontaneous Hypertensive Rats. J. Am. Soc. Nephrol. 1991, 2, 1078. [Google Scholar] [CrossRef]
  22. Sabaawy, H.E.; Zhang, F.; Nguyen, X.; ElHosseiny, A.; Nasjletti, A.; Schwartzman, M.; Dennery, P.; Kappas, A.; Abraham, N.G. Human Heme Oxygenase-1 Gene Transfer Lowers Blood Pressure and Promotes Growth in Spontaneously Hypertensive Rats. Hypertension 2001, 38, 210–215. [Google Scholar] [CrossRef] [PubMed]
  23. Kobayashi, A.; Ishikawa, K.; Matsumoto, H.; Kimura, S.; Kamiyama, Y.; Maruyama, Y. Synergetic Antioxidant and Vasodilatory Action of Carbon Monoxide in Angiotensin II–Induced Cardiac Hypertrophy. Hypertension 2007, 50, 1040–1048. [Google Scholar] [CrossRef]
  24. Huang, C.W.; Moore, P.K. H2S Synthesizing Enzymes: Biochemistry and Molecular Aspects. In Chemistry, Biochemistry and Pharmacology of Hydrogen Sulfide; Moore, P.K., Whiteman, M., Eds.; Springer International Publishing: Cham, Switzerland, 2015; pp. 3–25. [Google Scholar]
  25. Gheibi, S.; Jeddi, S.; Kashfi, K.; Ghasemi, A. Regulation of Vascular Tone Homeostasis by NO and H2S: Implications in Hypertension. Biochem. Pharmacol. 2018, 149, 42–59. [Google Scholar] [CrossRef]
  26. Yan, H.; Du, J.; Tang, C. The Possible Role of Hydrogen Sulfide on the Pathogenesis of Spontaneous Hypertension in Rats. Biochem. Biophys. Res. Commun. 2004, 313, 22–27. [Google Scholar] [CrossRef] [PubMed]
  27. Mancuso, C.; Navarra, P.; Preziosi, P. Roles of Nitric Oxide, Carbon Monoxide, and Hydrogen Sulfide in the Regulation of the Hypothalamic-Pituitary-Adrenal Axis. J. Neurochem. 2010, 113, 563–575. [Google Scholar] [CrossRef]
  28. Ansell, D.; Grandbois, J.; Tai, T.C. Gene Regulation of Catecholamine Biosynthetic Enzymes by Nitric Oxide in PC12 Cells. Open J. Endocr. Metab. Dis. 2014, 4, 77–84. [Google Scholar] [CrossRef]
  29. Grion, N.; Repetto, E.M.; Pomeraniec, Y.; Calejman, C.M.; Astort, F.; Sanchez, R.; Pignataro, O.P.; Arias, P.; Cymeryng, C.B. Induction of Nitric Oxide Synthase and Heme Oxygenase Activities by Endotoxin in the Rat Adrenal Cortex: Involvement of Both Signaling Systems in the Modulation of ACTH-Dependent Steroid Production. J. Endocrinol. 2007, 194, 11–20. [Google Scholar] [CrossRef] [PubMed]
  30. Buerk, D.G.; Chugh, D.K.; Osanai, S.; Mokashi, A.; Lahiri, S. Dopamine Increases in Cat Carotid Body during Excitation by Carbon Monoxide: Implications for a Chromophore Theory of Chemoreception. J. Auton. Nerv. Syst. 1997, 67, 130–136. [Google Scholar] [CrossRef]
  31. Lahiri, S.; Penney, D.G.; Mokashi, A.; Albertine, K.H. Chronic CO Inhalation and Carotid Body Catecholamines: Testing of Hypotheses. J. Appl. Physiol. 1989, 67, 239–242. [Google Scholar] [CrossRef]
  32. Wang, C.-N.; Liu, Y.-J.; Duan, G.-L.; Zhao, W.; Li, X.-H.; Zhu, X.-Y.; Ni, X. CBS and CSE Are Critical for Maintenance of Mitochondrial Function and Glucocorticoid Production in Adrenal Cortex. Antioxid. Redox Signal. 2014, 21, 2192–2207. [Google Scholar] [CrossRef]
  33. Zhu, D.; Yu, X.; Sun, J.; Li, J.; Ma, X.; Yao, W. H2S Induces Catecholamine Secretion in Rat Adrenal Chromaffin Cells. Toxicology 2012, 302, 40–43. [Google Scholar] [CrossRef]
  34. de Pascual, R.; Baraibar, A.M.; Méndez-López, I.; Pérez-Ciria, M.; Polo-Vaquero, I.; Gandía, L.; Ohia, S.E.; García, A.G.; de Diego, A.M.G. Hydrogen Sulphide Facilitates Exocytosis by Regulating the Handling of Intracellular Calcium by Chromaffin Cells. Eur. J. Physiol. 2018, 470, 1255–1270. [Google Scholar] [CrossRef]
  35. Tian, X.; Guan, T.; Guo, Y.; Zhang, G.; Kong, J. Selective Susceptibility of Oligodendrocytes to Carbon Monoxide Poisoning: Implication for Delayed Neurologic Sequelae (DNS). Front. Psychiatry 2020, 11, 815. [Google Scholar] [CrossRef]
  36. DeLeon, E.R.; Stoy, G.F.; Olson, K.R. Passive Loss of Hydrogen Sulfide in Biological Experiments. Anal. Biochem. 2012, 421, 203–207. [Google Scholar] [CrossRef] [PubMed]
  37. Nguyen, P.; Khurana, S.; Peltsch, H.; Grandbois, J.; Eibl, J.; Crispo, J.; Ansell, D.; Tai, T.C. Prenatal Glucocorticoid Exposure Programs Adrenal Pnmt Expression and Adult Hypertension. J. Endocrinol. 2015, 227, 117–127. [Google Scholar] [CrossRef] [PubMed]
  38. Sabban, E.L.; Kvetňanský, R. Stress-Triggered Activation of Gene Expression in Catecholaminergic Systems: Dynamics of Transcriptional Events. Trends Neurosci. 2001, 24, 91–98. [Google Scholar] [CrossRef]
  39. Lewis, E.J.; Harrington, C.A.; Chikaraishi, D.M. Transcriptional Regulation of the Tyrosine Hydroxylase Gene by Glucocorticoid and Cyclic AMP. Proc. Natl. Acad. Sci. USA 1987, 84, 3550–3554. [Google Scholar] [CrossRef]
  40. Swanson, D.J.; Zellmer, E.; Lewis, E.J. AP1 Proteins Mediate the cAMP Response of the Dopamine β-Hydroxylase Gene *. J. Biol. Chem. 1998, 273, 24065–24074. [Google Scholar] [CrossRef] [PubMed]
  41. Tai, T.C.; Morita, K.; Wong, D.L. Role of Egr-1 in cAMP-Dependent Protein Kinase Regulation of the Phenylethanolamine N-Methyltransferase Gene. J. Neurochem. 2001, 76, 1851–1859. [Google Scholar] [CrossRef]
  42. Swanson, D.J.; Adachi, M.; Lewis, E.J. The Homeodomain Protein Arix Promotes Protein Kinase A-Dependent Activation of the Dopamine β-Hydroxylase Promoter through Multiple Elements and Interaction with the Coactivator cAMP-Response Element-Binding Protein-Binding Protein. J. Biol. Chem. 2000, 275, 2911–2923. [Google Scholar] [CrossRef]
  43. Pattyn, A.; Morin, X.; Cremer, H.; Goridis, C.; Brunet, J.F. The Homeobox Gene Phox2b Is Essential for the Development of Autonomic Neural Crest Derivatives. Nature 1999, 399, 366–370. [Google Scholar] [CrossRef]
  44. Zellmer, E.; Zhang, Z.; Greco, D.; Rhodes, J.; Cassel, S.; Lewis, E.J. A Homeodomain Protein Selectively Expressed in Noradrenergic Tissue Regulates Transcription of Neurotransmitter Biosynthetic Genes. J. Neurosci. 1995, 15, 8109–8120. [Google Scholar] [CrossRef]
  45. Swanson, D.J.; Zellmer, E.; Lewis, E.J. The Homeodomain Protein Arix Interacts Synergistically with Cyclic AMP to Regulate Expression of Neurotransmitter Biosynthetic Genes*. J. Biol. Chem. 1997, 272, 27382–27392. [Google Scholar] [CrossRef] [PubMed]
  46. Greene, L.A.; Tischler, A.S. Establishment of a Noradrenergic Clonal Line of Rat Adrenal Pheochromocytoma Cells Which Respond to Nerve Growth Factor. Proc. Natl. Acad. Sci. USA 1976, 73, 2424–2428. [Google Scholar] [CrossRef] [PubMed]
  47. Fan, Y.; Huang, J.; Duffourc, M.; Kao, R.L.; Ordway, G.A.; Huang, R.; Zhu, M.-Y. Transcription Factor Phox2 Upregulates Expression of Norepinephrine Transporter and Dopamine β-Hydroxylase in Adult Rat Brains. Neuroscience 2011, 192, 37–53. [Google Scholar] [CrossRef]
  48. Ryter, S.W.; Morse, D.; Choi, A.M.K. Carbon Monoxide: To Boldly Go Where NO Has Gone Before. Sci. STKE 2004, 2004, re6. [Google Scholar] [CrossRef]
  49. Lian, S.; Xia, Y.; Ung, T.T.; Khoi, P.N.; Yoon, H.J.; Kim, N.H.; Kim, K.K.; Jung, Y.D. Carbon Monoxide Releasing Molecule-2 Ameliorates IL-1β-Induced IL-8 in Human Gastric Cancer Cells. Toxicology 2016, 361–362, 24–38. [Google Scholar] [CrossRef]
  50. Li, M.H.; Jang, J.H.; Na, H.K.; Cha, Y.N.; Surh, Y.J. Carbon Monoxide Produced by Heme Oxygenase-1 in Response to Nitrosative Stress Induces Expression of Glutamate-Cysteine Ligase in PC12 Cells via Activation of Phosphatidylinositol 3-Kinase and Nrf2 Signaling. J. Biol. Chem. 2007, 282, 28577–28586. [Google Scholar] [CrossRef]
  51. Schultess, J.; Danielewski, O.; Smolenski, A.P. Rap1GAP2 Is a New GTPase-Activating Protein of Rap1 Expressed in Human Platelets. Blood 2005, 105, 3185–3192. [Google Scholar] [CrossRef] [PubMed]
  52. Hartsfield, C.L. Cross Talk Between Carbon Monoxide and Nitric Oxide. Antioxid. Redox Signal. 2002, 4, 301–307. [Google Scholar] [CrossRef]
  53. Roskoski, R.; Roskoski, L.M. Activation of Tyrosine Hydroxylase in PC12 Cells by the Cyclic GMP and Cyclic AMP Second Messenger Systems. J. Neurochem. 1987, 48, 236–242. [Google Scholar] [CrossRef]
  54. Kim, D.; Choi, H.J.; Kim, S.W.; Cho, S.-W.; Hwang, O. Upregulation of Catecholamine Biosynthetic Enzymes by Nitric Oxide. J. Neurosci. Res. 2003, 72, 98–104. [Google Scholar] [CrossRef]
  55. Lu, W.; Yang, X.; Wang, B. Carbon Monoxide Signaling and Soluble Guanylyl Cyclase: Facts, Myths, and Intriguing Possibilities. Biochem. Pharmacol. 2022, 200, 115041. [Google Scholar] [CrossRef]
  56. Friebe, A.; Schultz, G.; Koesling, D. Sensitizing Soluble Guanylyl Cyclase to Become a Highly CO-Sensitive Enzyme. EMBO J. 1996, 15, 6863–6868. [Google Scholar] [CrossRef]
  57. Gysbers, J.W.; Rathbone, M.P. Guanosine Enhances NGF-Stimulated Neurite Outgrowth in PC12 Cells. Neuroreport 1992, 3, 997–1000. [Google Scholar] [CrossRef]
  58. Bau, C.; Middlemiss, P.J.; Hindley, S.; Jiang, S.; Ciccarelli, R.; Caciagli, F.; DiIorio, P.; Werstiuk, E.S.; Rathbone, M.P. Guanosine Stimulates Neurite Outgrowth in PC12 Cells via Activation of Heme Oxygenase and Cyclic GMP. Purinergic Signal. 2005, 1, 161–172. [Google Scholar] [CrossRef] [PubMed]
  59. McMahon, A.; Sabban, E.L. Regulation of Expression of Dopamine β-Hydroxylase in PC12 Cells by Glucocorticoids and Cyclic AMP Analogues. J. Neurochem. 1992, 59, 2040–2047. [Google Scholar] [CrossRef]
  60. Rani, C.S.S.; Elango, N.; Wang, S.; Kobayashi, K.; Strong, R. Identification of an Activator Protein-1-Like Sequence as the Glucocorticoid Response Element in the Rat Tyrosine Hydroxylase Gene. Mol. Pharmacol. 2009, 75, 589–598. [Google Scholar] [CrossRef] [PubMed]
  61. Tai, T.C.; Claycomb, R.; Her, S.; Bloom, A.K.; Wong, D.L. Glucocorticoid Responsiveness of the Rat PhenylethanolamineN-Methyltransferase Gene. Mol. Pharmacol. 2002, 61, 1385–1392. [Google Scholar] [CrossRef]
  62. Leonardi, D.B.; Anselmino, N.; Brandani, J.N.; Jaworski, F.M.; Páez, A.V.; Mazaira, G.; Meiss, R.P.; Nuñez, M.; Nemirovsky, S.I.; Giudice, J.; et al. Heme Oxygenase 1 Impairs Glucocorticoid Receptor Activity in Prostate Cancer. Int. J. Mol. Sci. 2019, 20, 1006. [Google Scholar] [CrossRef] [PubMed]
  63. Baker, J.D.; Ozsan, I.; Rodriguez Ospina, S.; Gulick, D.; Blair, L.J. Hsp90 Heterocomplexes Regulate Steroid Hormone Receptors: From Stress Response to Psychiatric Disease. Int. J. Mol. Sci. 2019, 20, 79. [Google Scholar] [CrossRef]
  64. Agyeman, A.S.; Jun, W.J.; Proia, D.A.; Kim, C.R.; Skor, M.N.; Kocherginsky, M.; Conzen, S.D. Hsp90 Inhibition Results in Glucocorticoid Receptor Degradation in Association with Increased Sensitivity to Paclitaxel in Triple-Negative Breast Cancer. Horm. Cancer 2016, 7, 114–126. [Google Scholar] [CrossRef]
  65. Lee, W.-Y.; Chen, Y.-C.; Shih, C.-M.; Lin, C.-M.; Cheng, C.-H.; Chen, K.-C.; Lin, C.-W. The Induction of Heme Oxygenase-1 Suppresses Heat Shock Protein 90 and the Proliferation of Human Breast Cancer Cells through Its Byproduct Carbon Monoxide. Toxicol. Appl. Pharmacol. 2014, 274, 55–62. [Google Scholar] [CrossRef] [PubMed]
  66. Choi, Y.K.; Kim, C.K.; Lee, H.; Jeoung, D.; Ha, K.S.; Kwon, Y.G.; Kim, K.W.; Kim, Y.M. Carbon Monoxide Promotes VEGF Expression by Increasing HIF-1α Protein Level via Two Distinct Mechanisms, Translational Activation and Stabilization of HIF-1α Protein. J. Biol. Chem. 2010, 285, 32116–32125. [Google Scholar] [CrossRef]
  67. Tai, T.C.; Wong-Faull, D.C.; Claycomb, R.; Wong, D.L. Hypoxic Stress-Induced Changes in Adrenergic Function: Role of HIF1α. J. Neurochem. 2009, 109, 513–524. [Google Scholar] [CrossRef]
  68. Brown, S.T.; Kelly, K.F.; Daniel, J.M.; Nurse, C.A. Hypoxia Inducible Factor (HIF)-2α Is Required for the Development of the Catecholaminergic Phenotype of Sympathoadrenal Cells. J. Neurochem. 2009, 110, 622–630. [Google Scholar] [CrossRef]
  69. Richter, S.; Qin, N.; Pacak, K.; Eisenhofer, G. Role of Hypoxia and HIF2α in Development of the Sympathoadrenal Cell Lineage and Chromaffin Cell Tumours with Distinct Catecholamine Phenotypic Features. Adv. Pharmacol. 2013, 68, 285–317. [Google Scholar] [CrossRef]
  70. Watts, D.; Bechmann, N.; Meneses, A.; Poutakidou, I.K.; Kaden, D.; Conrad, C.; Krüger, A.; Stein, J.; El-Armouche, A.; Chavakis, T.; et al. HIF2α Regulates the Synthesis and Release of Epinephrine in the Adrenal Medulla. J. Mol. Med. 2021, 99, 1655–1666. [Google Scholar] [CrossRef]
  71. Hashimoto, H.; Toide, K.; Kitamura, R.; Fujita, M.; Tagawa, S.; Itoh, S.; Kamataki, T. Gene Structure of CYP3A4, an Adult-Specific Form of Cytochrome P450 in Human Livers, and Its Transcriptional Control. Eur. J. Biochem. 1993, 218, 585–595. [Google Scholar] [CrossRef]
  72. Kitzmiller, J.P.; Groen, D.K.; Phelps, M.A.; Sadee, W. Pharmacogenomic Testing: Relevance in Medical Practice: Why Drugs Work in Some Patients but Not in Others. Cleve. Clin. J. Med. 2011, 78, 243. [Google Scholar] [CrossRef] [PubMed]
  73. Hara, H. Inhibitory Effect of Nitric Oxide on the Induction of Cytochrome P450 3A4 mRNA by 1,25-Dihydroxyvitamin D3 in Caco-2 Cells. Free Radic. Res. 2000, 33, 279–285. [Google Scholar] [CrossRef] [PubMed]
  74. Kawahara, B.; Faull, K.F.; Janzen, C.; Mascharak, P.K. Carbon Monoxide Inhibits Cytochrome P450 Enzymes CYP3A4/2C8 in Human Breast Cancer Cells, Increasing Sensitivity to Paclitaxel. J. Med. Chem. 2021, 64, 8437–8446. [Google Scholar] [CrossRef]
  75. Kroiss, M.; Quinkler, M.; Lutz, W.K.; Allolio, B.; Fassnacht, M. Drug Interactions with Mitotane by Induction of CYP3A4 Metabolism in the Clinical Management of Adrenocortical Carcinoma. Clin. Endocrinol. 2011, 75, 585–591. [Google Scholar] [CrossRef]
  76. Tharmalingam, S.; Khurana, S.; Murray, A.; Lamothe, J.; Tai, T.C. Whole Transcriptome Analysis of Adrenal Glands from Prenatal Glucocorticoid Programmed Hypertensive Rodents. Sci. Rep. 2020, 10, 18755. [Google Scholar] [CrossRef]
  77. Albrecht, U. Molecular Mechanisms in Mood Regulation Involving the Circadian Clock. Front. Neurol. 2017, 8, 30. [Google Scholar] [CrossRef]
  78. Dioum, E.M.; Rutter, J.; Tuckerman, J.R.; Gonzalez, G.; Gilles-Gonzalez, M.-A.; McKnight, S.L. NPAS2: A Gas-Responsive Transcription Factor. Science 2002, 298, 2385–2387. [Google Scholar] [CrossRef]
  79. Murgo, E.; Colangelo, T.; Bellet, M.M.; Malatesta, F.; Mazzoccoli, G. Role of the Circadian Gas-Responsive Hemeprotein NPAS2 in Physiology and Pathology. Biology 2023, 12, 1354. [Google Scholar] [CrossRef]
  80. Molinoff, P.B.; Axelrod, J. Biochemistry of Catecholamines. Annu. Rev. Biochem. 1971, 40, 465–500. [Google Scholar] [CrossRef]
  81. Bauer, N.; Liu, D.; Nguyen, T.; Wang, B. Unraveling the Interplay of Dopamine, Carbon Monoxide, and Heme Oxygenase in Neuromodulation and Cognition. ACS Chem. Neurosci. 2024, 15, 400–407. [Google Scholar] [CrossRef]
  82. Hiramatsu, M.; Yokoyama, S.; Nabeshima, T.; Kameyama, T. Changes in Concentrations of Dopamine, Serotonin, and Their Metabolites Induced by Carbon Monoxide (CO) in the Rat Striatum as Determined by in Vivo Microdialysis. Pharmacol. Biochem. Behav. 1994, 48, 9–15. [Google Scholar] [CrossRef]
  83. Taskiran, D.; Kutay, F.Z.; Pogun, S. Effect of Carbon Monoxide on Dopamine and Glutamate Uptake and cGMP Levels in Rat Brain. Neuropsychopharmacology 2003, 28, 1176–1181. [Google Scholar] [CrossRef]
  84. Dreyer-Andersen, N.; Almeida, A.S.; Jensen, P.; Kamand, M.; Okarmus, J.; Rosenberg, T.; Friis, S.D.; Serrano, A.M.; Blaabjerg, M.; Kristensen, B.W.; et al. Intermittent, Low Dose Carbon Monoxide Exposure Enhances Survival and Dopaminergic Differentiation of Human Neural Stem Cells. PLoS ONE 2018, 13, e0191207. [Google Scholar] [CrossRef]
  85. Faizan, M.; Muhammad, N.; Niazi, K.U.K.; Hu, Y.; Wang, Y.; Wu, Y.; Sun, H.; Liu, R.; Dong, W.; Zhang, W.; et al. CO-Releasing Materials: An Emphasis on Therapeutic Implications, as Release and Subsequent Cytotoxicity Are the Part of Therapy. Materials 2019, 12, 1643. [Google Scholar] [CrossRef]
  86. Sze, P.Y.; Hedrick, B.J. Effects of Dexamethasone and Other Glucocorticoid Steroids on Tyrosine Hydroxylase Activity in the Superior Cervical Ganglion. Brain Res. 1983, 265, 81–86. [Google Scholar] [CrossRef]
  87. Williams, L.R.; Sandquist, D.; Black AC, J.R.; Williams, T.H. Glucocorticoids Increase Tyrosine Hydroxylase Activity in Cultured Murine Neuroblastoma. J. Neurochem. 1981, 36, 2057–2062. [Google Scholar] [CrossRef]
  88. Núñez, C.; Földes, A.; Pérez-Flores, D.; García-Borrón, J.C.; Laorden, M.L.; Kovács, K.J.; Milanés, M.V. Elevated Glucocorticoid Levels Are Responsible for Induction of Tyrosine Hydroxylase mRNA Expression, Phosphorylation, and Enzyme Activity in the Nucleus of the Solitary Tract during Morphine Withdrawal. Endocrinology 2009, 150, 3118–3127. [Google Scholar] [CrossRef] [PubMed]
  89. Dunkley, P.R.; Bobrovskaya, L.; Graham, M.E.; Von Nagy-Felsobuki, E.I.; Dickson, P.W. Tyrosine Hydroxylase Phosphorylation: Regulation and Consequences. J. Neurochem. 2004, 91, 1025–1043. [Google Scholar] [CrossRef] [PubMed]
  90. Al-Wadei, H.A.N.; Takahasi, T.; Schuller, H.M. PKA-Dependent Growth Stimulation of Cells Derived from Human Pulmonary Adenocarcinoma and Small Airway Epithelium by Dexamethasone. Eur. J. Cancer 2005, 41, 2745–2753. [Google Scholar] [CrossRef]
  91. Dwivedi, Y.; Pandey, G.N. Adrenal Glucocorticoids Modulate [3H]Cyclic AMP Binding to Protein Kinase A (PKA), Cyclic AMP-Dependent PKA Activity, and Protein Levels of Selective Regulatory and Catalytic Subunit Isoforms of PKA in Rat Brain. J. Pharmacol. Exp. Ther. 2000, 294, 103–116. [Google Scholar] [CrossRef]
  92. Zhang, R.G.; Yip, C.Y.; Ko, W.H. Carbon Monoxide Inhibits Cytokine and Chloride Secretion in Human Bronchial Epithelia. Cell Physiol. Biochem. 2018, 49, 626–637. [Google Scholar] [CrossRef]
  93. Schwer, C.I.; Stoll, P.; Rospert, S.; Schallner, N.; Bürkle, H.; Schmidt, R.; Humar, M. Carbon Monoxide Releasing Molecule-2 CORM-2 Represses Global Protein Synthesis by Inhibition of Eukaryotic Elongation Factor eEF2. Int. J. Biochem. Cell Biol. 2013, 45, 201–212. [Google Scholar] [CrossRef]
  94. Livak, K.J.; Schmittgen, T.D. Analysis of Relative Gene Expression Data Using Real-Time Quantitative PCR and the 2(-Delta Delta C(T)) Method. Methods 2001, 25, 402–408. [Google Scholar] [CrossRef] [PubMed]
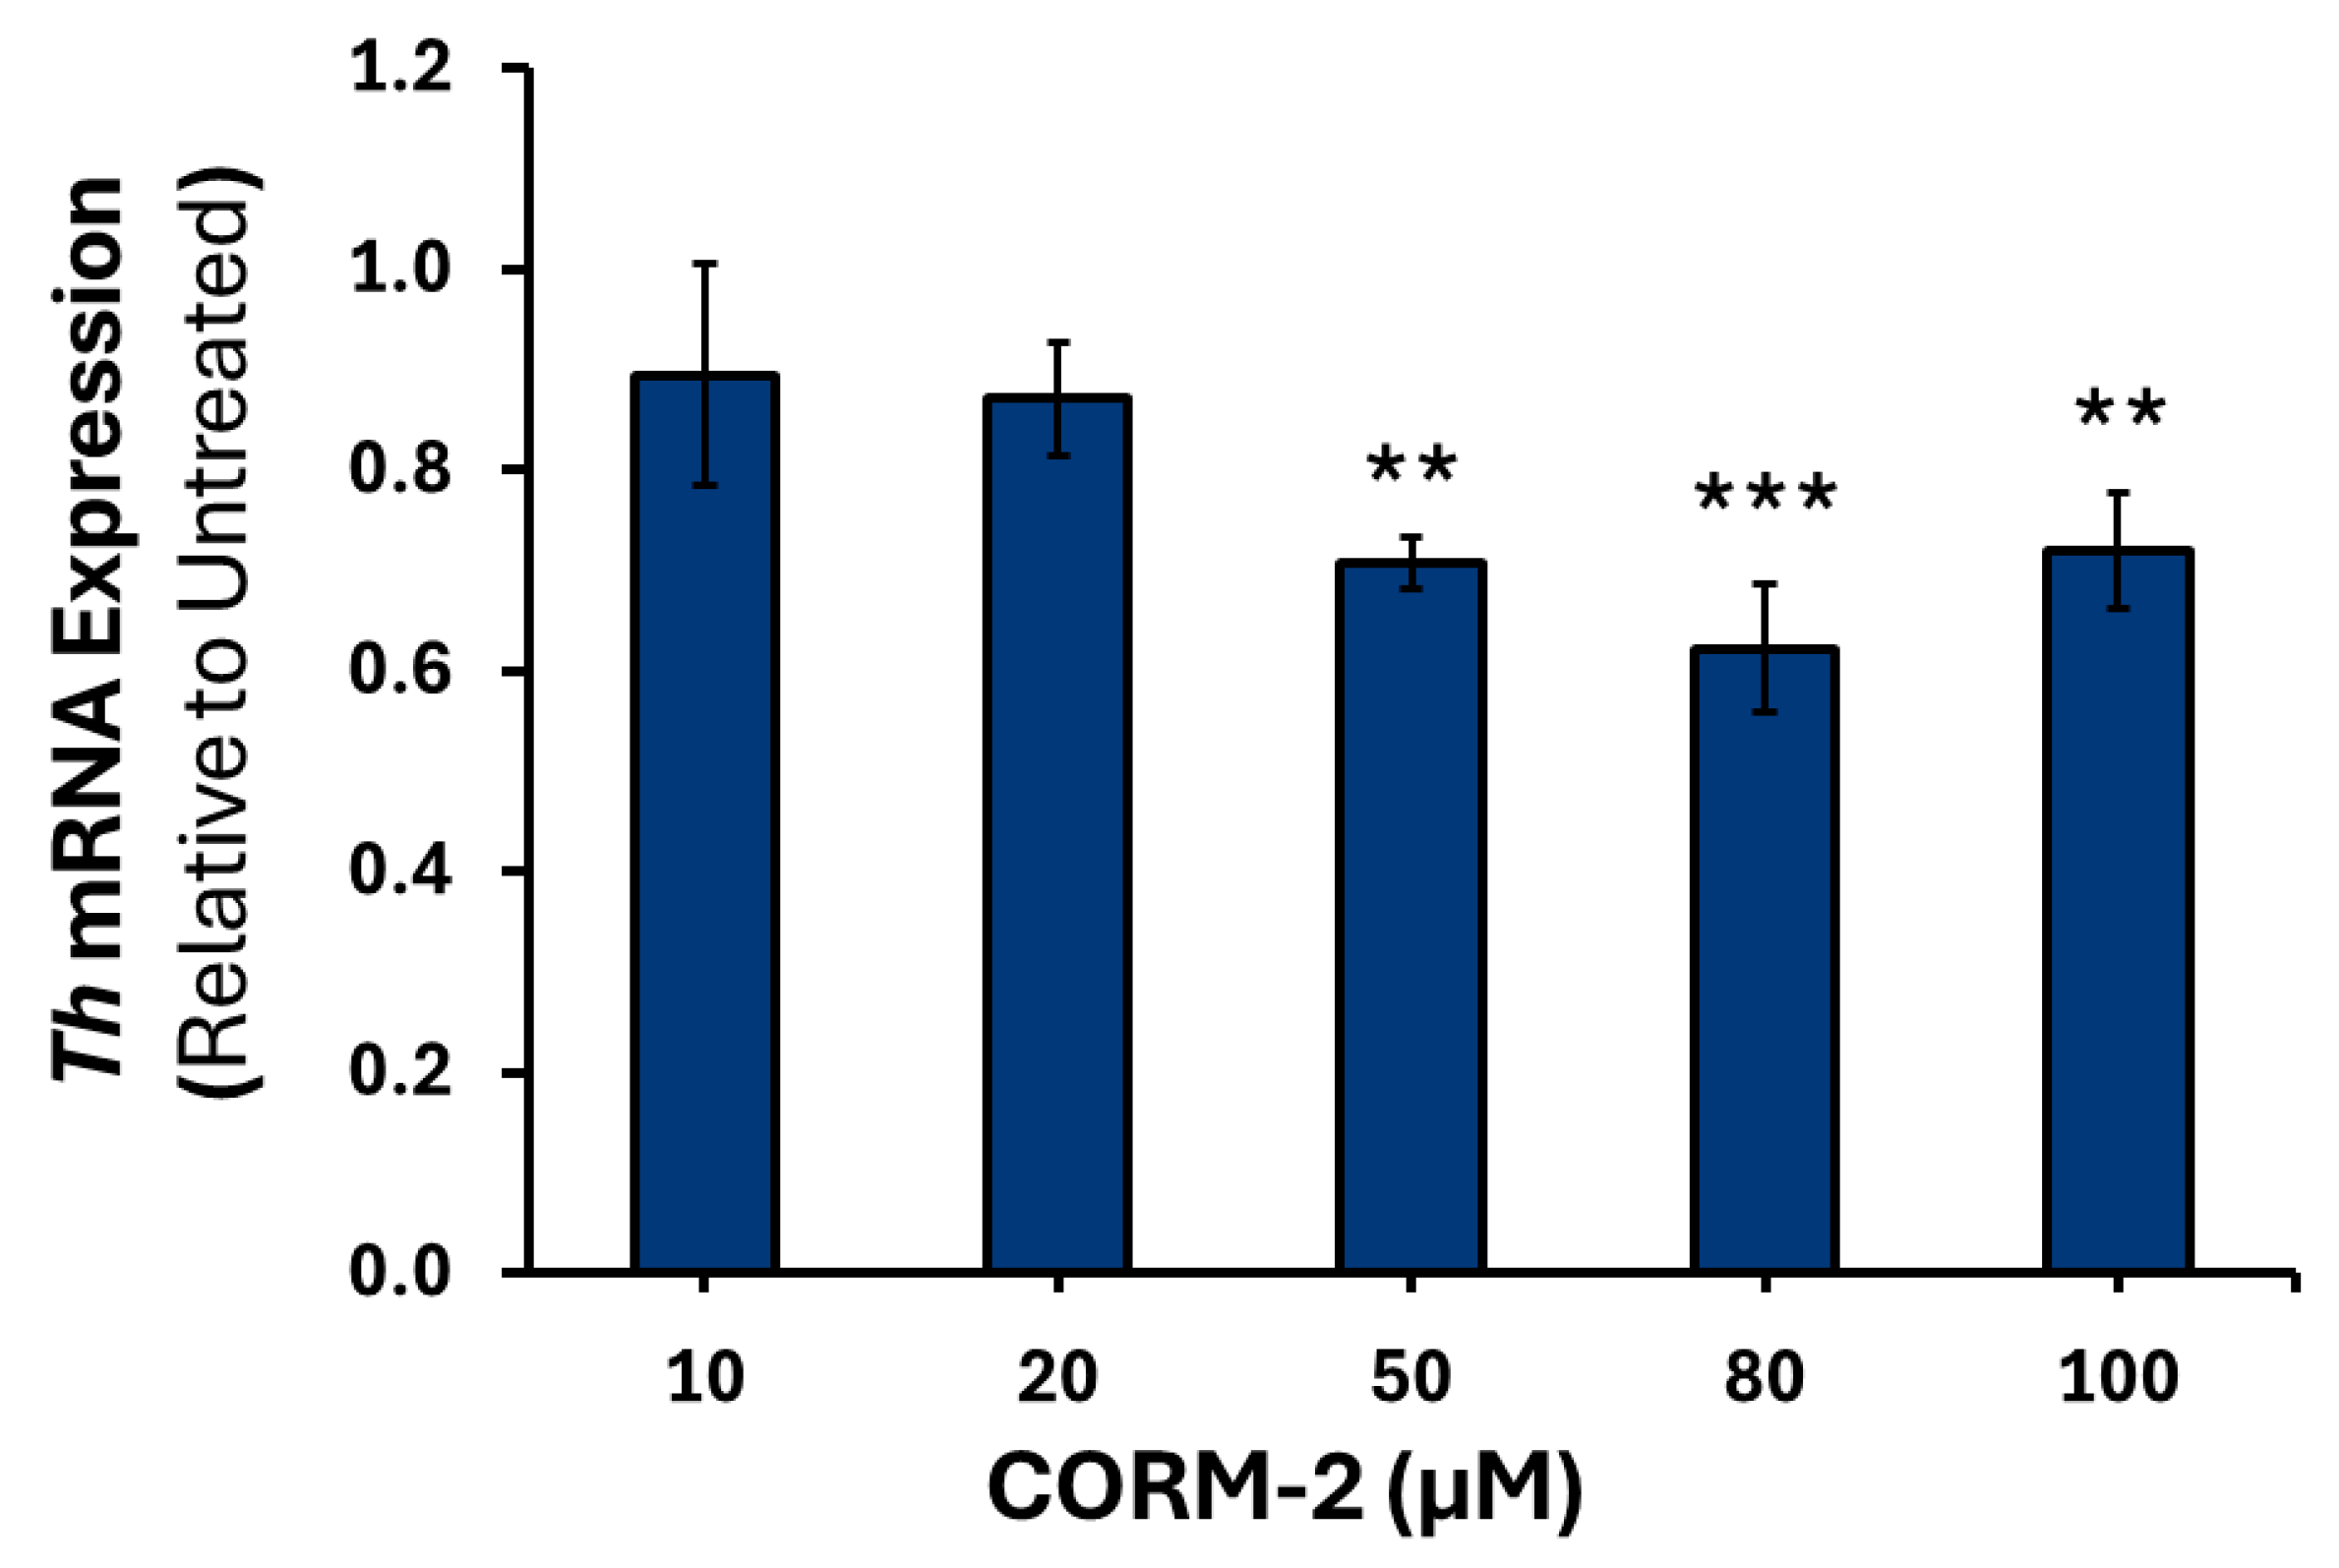
Figure 1. Th mRNA expression in response to varying CORM-2 treatments. PC12 cells were treated with either 10, 20, 50, 80 or 100 μM of CORM-2 (n = 3) for 6 h. Data are presented as the average fold change ±SEM of Th expression normalized to Gapdh and Rpl32 and relative to an untreated control across three replicates ** p < 0.01, *** p < 0.001).
Cimb 47 00725 g001
Figure 2. Dbh mRNA expression in response to varying CORM-2 treatments. PC12 cells were treated with either 10, 20, 50, 80 or 100 μM of CORM-2 (n = 3) for 6 h. Data are presented as the average fold change ±SEM of Dbh expression normalized to Gapdh and Rpl32 and relative to an untreated control across three replicates ** p < 0.01, *** p < 0.001).
Cimb 47 00725 g002
Figure 3. Pnmt mRNA expression in response to varying CORM-2 treatments. PC12 cells were treated with either 10, 20, 50, 80 or 100 μM of CORM-2 (n = 3) for 6 h. Data are presented as the average fold change ±SEM of Pnmt intronless expression normalized to Gapdh and Rpl32 and relative to an untreated control across three replicates (* p < 0.05).
Cimb 47 00725 g003
Figure 4. Th mRNA expression in response to varying NaHS treatments. PC12 cells were treated with either 20, 50, 80, 100 or 300 μM of NaHS (n = 3) for 6 h. Data are presented as the average fold change ±SEM of Th expression normalized to Gapdh and Rpl32 and relative to an untreated control across three replicates.
Cimb 47 00725 g004
Figure 5. Dbh mRNA expression in response to varying NaHS treatments. PC12 cells were treated with either 20, 50, 80, 100 or 300 μM of NaHS (n = 3) for 6 h. Data are presented as the average fold change ±SEM of Dbh expression normalized to Gapdh and Rpl32 and relative to an untreated control across three replicates.
Cimb 47 00725 g005
Figure 6. Pnmt mRNA expression in response to varying NaHS treatments. PC12 cells were treated with either 20, 50, 80, 100 or 300 μM of NaHS (n = 3) for 6 h. Data are presented as the average fold change ±SEM of Pnmt intronless expression normalized to Gapdh and Rpl32 and relative to an untreated control across three replicates.
Cimb 47 00725 g006
Figure 7. Changes in production and release of dopamine and norepinephrine in response to 24 h CORM-2 or NaHS treatment. PC12 cells were treated with 100 μM CORM-2 or 300 μM NaHS (n = 2) for 24 h. Data are presented as the average concentration ±SEM of dopamine or norepinephrine relative to an untreated control across two replicates (* p < 0.05).
Cimb 47 00725 g007
Figure 8. Th mRNA expression following dexamethasone and gas donor treatments. PC12 cells were pretreated with either 100 μM CORM-2 or 300 μM NaHS for 15 min, followed by treatment with or without 1 μM DEX (n = 3) for 6 h. Data are presented as the average fold change ±SEM of Th expression normalized to Gapdh and Rpl32 and relative to an untreated control across three replicates (* p < 0.05, ** p < 0.01, ### p < 0.001). * Indicates a significant difference from untreated control, # represents a significant difference from DEX treatment.
Cimb 47 00725 g008
Figure 9. Dbh mRNA expression following dexamethasone and gas donor treatments. PC12 cells were pretreated with either 100 μM CORM-2 or 300 μM NaHS for 15 min, followed by treatment with or without 1 μM DEX (n = 3) for 6 h. Data are presented as the average fold change ± SEM of Dbh expression normalized to Gapdh and Rpl32 and relative to an untreated control across three replicates (*p < 0.05, ## p < 0.01). * Indicates a significant difference from untreated control, # represents a significant difference from DEX treatment.
Cimb 47 00725 g009
Figure 10. Pnmt mRNA expression following dexamethasone and gas donor treatments. PC12 cells were pretreated with either 100 μM CORM-2 or 300 μM NaHS for 15 min, followed by treatment with or without 1 μM DEX (n = 3) for 6 h. Data are presented as the average fold change ±SEM of Pnmt intronless expression normalized to Gapdh and Rpl32 and relative to an untreated control across three replicates (**/## p < 0.01). * Indicates a significant difference from untreated control, # represents a significant difference from DEX treatment.
Cimb 47 00725 g010
Figure 11. Changes in the 24 h glucocorticoid-mediated catecholamine content in culture media of dopamine and norepinephrine in response to CORM-2 or NaHS pretreatment. PC12 cells were pretreated with either 100 μM CORM-2 or 300 μM NaHS, followed by a DEX treatment for 24 h. Data are presented as the average concentration ±SEM of dopamine (n = 2) or norepinephrine (n = 3) relative to untreated controls (* p < 0.05, **/## p < 0.01, *** p < 0.001). * Indicates a significant difference from untreated control; # represents a significant difference from DEX treatment.
Cimb 47 00725 g011
Table 1. Primers Utilized for qPCR.
Gene
(Accession Number)
Sequence (5′–3′)Annealing Temperature (°C)
Gapdh
(NM_017008.4)
ForwardGTCATCCCAGAGCTGAACGG60
ReverseATACTTGGCAGGTTTCTCCAGG
Rpl32
(NM_013226.3)
ForwardGGTGGCTGCCATCTGTTTTG60
ReverseGTTTCCGCCAGTTTCGCTTAAT
Th
(NM_012740.4)
ForwardGCGACAGAGTCTCATCGAGGAT58
ReverseAAGAGCAGGTTGAGAACAGCATT
Dbh
(NM_013158.3)
ForwardCGGTTTCTCCGACTGGAAGT60
ReverseATCAAGGGCGTGTACACCAG
Pnmt Intronless
(NM_031526.2)
ForwardCGAGGACAAGGGAGAGTCCT60
ReverseGGGCTTGTGCACATCAATGG
Disclaimer/Publisher’s Note: The statements, opinions and data contained in all publications are solely those of the individual author(s) and contributor(s) and not of MDPI and/or the editor(s). MDPI and/or the editor(s) disclaim responsibility for any injury to people or property resulting from any ideas, methods, instructions or products referred to in the content.