1. Introduction
Colorectal cancer (CRC) remains a significant global health burden and is the third most common cancer diagnosis, as well as the second leading cause of cancer-related deaths worldwide [
1]. Despite significant advances in surgical techniques and adjuvant treatments, CRC patient outcomes remain compromised by high recurrence rates and frequent late-stage diagnoses [
2]. Improving patient outcomes lies in the early identification of minimal residual disease (MRD) following operations, enabling personalized treatment strategies and improving survival rates [
3]. Traditional methodologies for detecting MRD, such as imaging and tissue biopsies, are invasive, expensive, and often lack the sensitivity needed for timely intervention [
4]. These limitations underscore an urgent requirement for the development of non-invasive, reliable biomarkers capable of predicting the CRC recurrence and prognosis [
5]. For instance, Guardant has promoted a completely tissue-free test that detect circulating tumor DNA for monitoring the recurrence and MRN assessment in early stages of breast, colorectal, and lung cancer [
6].
Recent advancements have highlighted the promise of circulating cell-free RNAs (cfRNAs) in plasma as non-invasive biomarkers for cancer detection and prognosis in CRC. cfRNAs, which include both messenger RNAs (mRNAs) and non-coding RNAs, are released into the bloodstream by various cells, notably tumor cells, and thereby offer insight into the molecular dynamics of the tumor microenvironment. Building on this potential, our previous study identified three significant cfRNA biomarkers comprising
HPGD (hydroxyprostaglandin dehydrogenase),
PACS1 (Phosphofurin Acidic Cluster Sorting Protein 1), and
TDP2 (tyrosyl-DNA phosphodiesterase 2) via the RNA sequencing (RNA-seq) of plasma samples from a small cohort of CRC patients. This signature demonstrated consistent expression changes before and after tumor-ablative operations in plasma and tissue samples, with a further validation using TCGA CRC datasets and single-cell RNA-seq for cell type deconvolution, which was linked to the presence of MRD, suggesting its utility in tracking the disease progression [
7]. However, the limited sample size and reliance on RNA-seq, a method not yet widely adopted in clinical diagnostics due to its complexity and cost, underscore the need for further validation using more accessible and clinically feasible techniques [
7].
This expanded study seeks to validate the prognostic significance of the
HPGD,
PACS1, and
TDP2 cfRNA signature in a larger cohort of 52 CRC patients, using the Taqman quantitative PCR (qPCR) as the primary method for the gene expression analysis. The Taqman qPCR is a highly sensitive, specific, and reproducible technique, widely utilized in clinical settings for its ability to detect low-abundance transcripts with precision. By examining plasma samples collected pre- and post-operation, this study seeks to verify the expression patterns of these genes and evaluate their links to key clinical outcomes, including the tumor stage, recurrence risk, and patient survival. Building on the foundational work of Jin et al. (2023), this research enhances the practical utility of cfRNA-based biomarkers by employing a more cost-effective and clinically adaptable method compared to RNA-seq [
7].
The objective of this study is to validate the significance of three key biomarkers within a substantially larger patient cohort and methodically correlate their expression profiles with relevant clinical parameters; this research aims to establish a comprehensive and reliable tool that could substantially enhance CRC prognostication. Transitioning from RNA sequencing to the TaqMan qPCR signifies a strategic advancement in the endeavor to translate cutting-edge genomic research into practical diagnostic applications. This shift not only underscores the necessity for actionable diagnostics in clinical settings but also raises prospects for the improved management of CRC through timely detection and intervention, ultimately fostering enhanced patient outcomes in this prevalent malignancy.
3. Results
3.1. The Evaluation of the Taqman qPCR Results Match with the RNA Sequencing from a Previous Study
To evaluate the consistency of the Taqman qPCR results with the RNA-seqdata from a previous study [
7] we applied a one-sample
t-test (test value = 0) to assess the log
2 fold changes in the cfRNA expression of
HPGD,
PACS1, and
TDP2 in CRC patients (
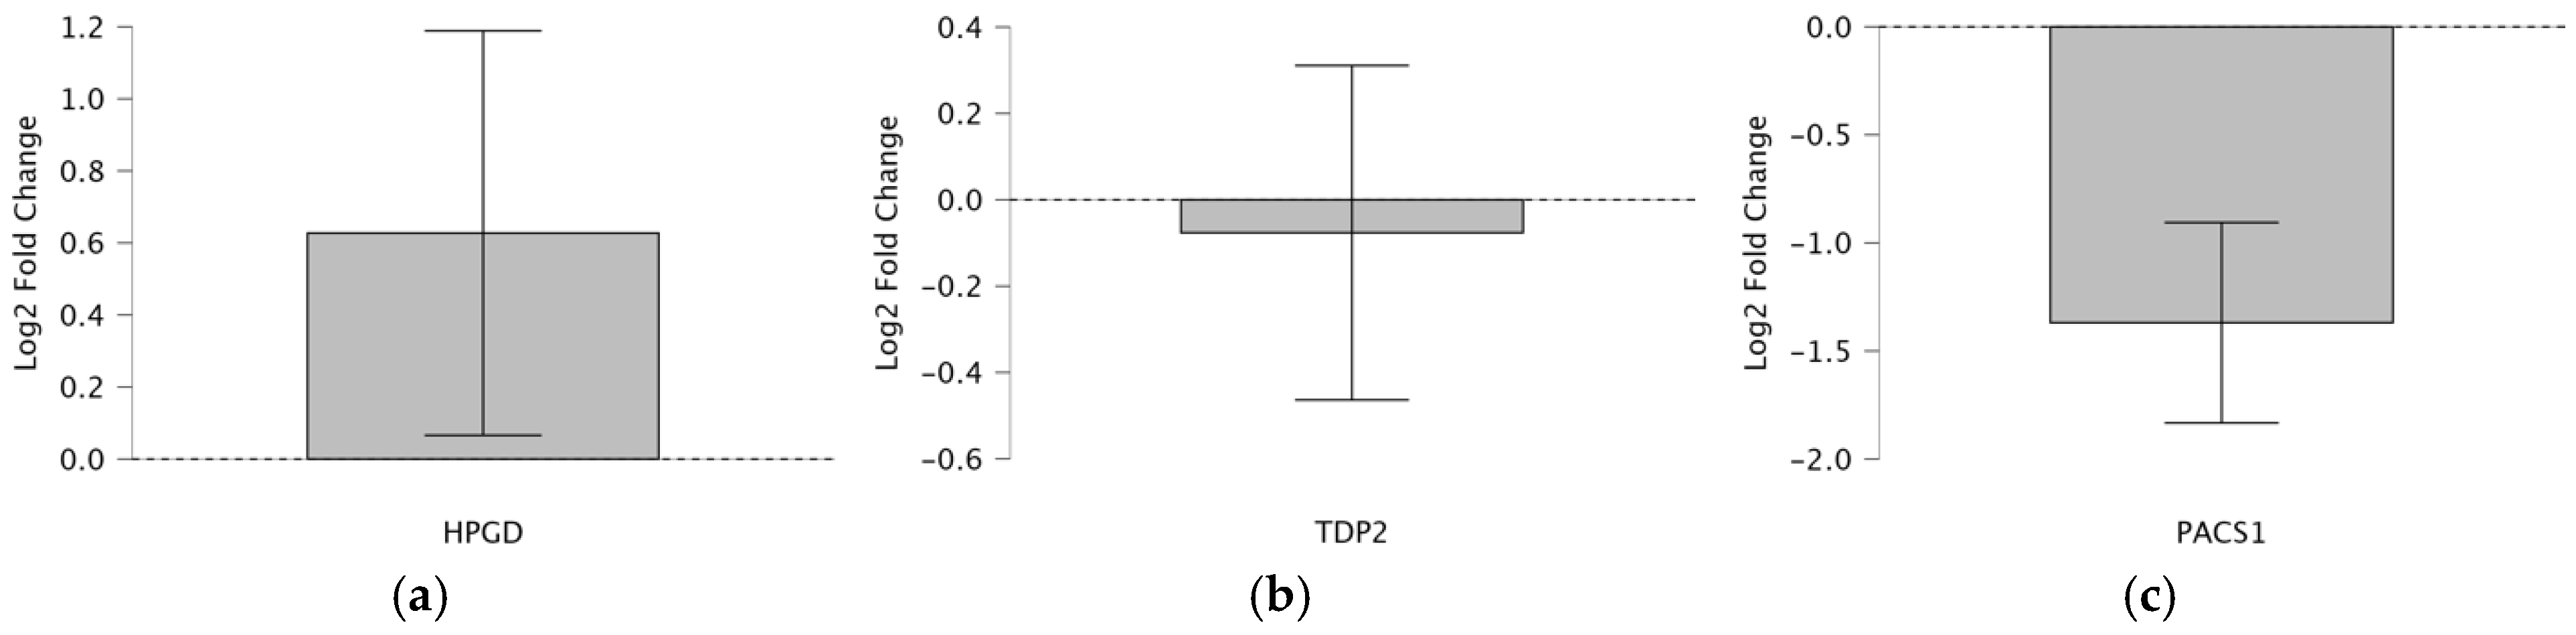
Figure 1a–c). The analysis leverages a table summarizing
t-test statistics for 52 patients and a box plot visualizing
HPGD,
PACS1, and
TDP2’s log
2 fold change pre- and post-operation. The one-sample
t-test determines whether the mean log
2 fold changes significantly deviate from 0, indicating up- or downregulation, while comparing the directional regulation (up or down) between the Taqman qPCR and RNA-seq to validate the reliability of Taqman as a more clinically feasible alternative to RNA-seq (
Table 2).
HPGD shows a significant upregulation with a log2 fold change of 2.254 (p = 0.029, t = 2.254, df = 43), which is consistent across both Taqman and RNA-seq methods, indicating a robust increase in expression post-operation (fold change 22.254 ≈ 4.77). In contrast, TDP2 exhibits a non-significant downregulation via Taqman (log2 fold change = −0.398, p = 0.693, t = −0.398, df = 41; fold change 2−0.398 ≈ 0.76), despite the RNA-seq suggesting upregulation, highlighting a discrepancy possibly due to the methodological sensitivity or sample variation. PACS1 demonstrates a significant downregulation (log2 fold change = −5.938, p < 0.001, t = −5.938, df = 48; fold change 2−5.938 ≈ 0.016), consistently observed in both Taqman and RNA-seq, suggesting a substantial decrease in the expression post-operation. These findings indicate varied expression patterns among the genes, with HPGD and PACS1 showing clear directional changes, while TDP2’s regulation requires further investigation due to conflicting results.
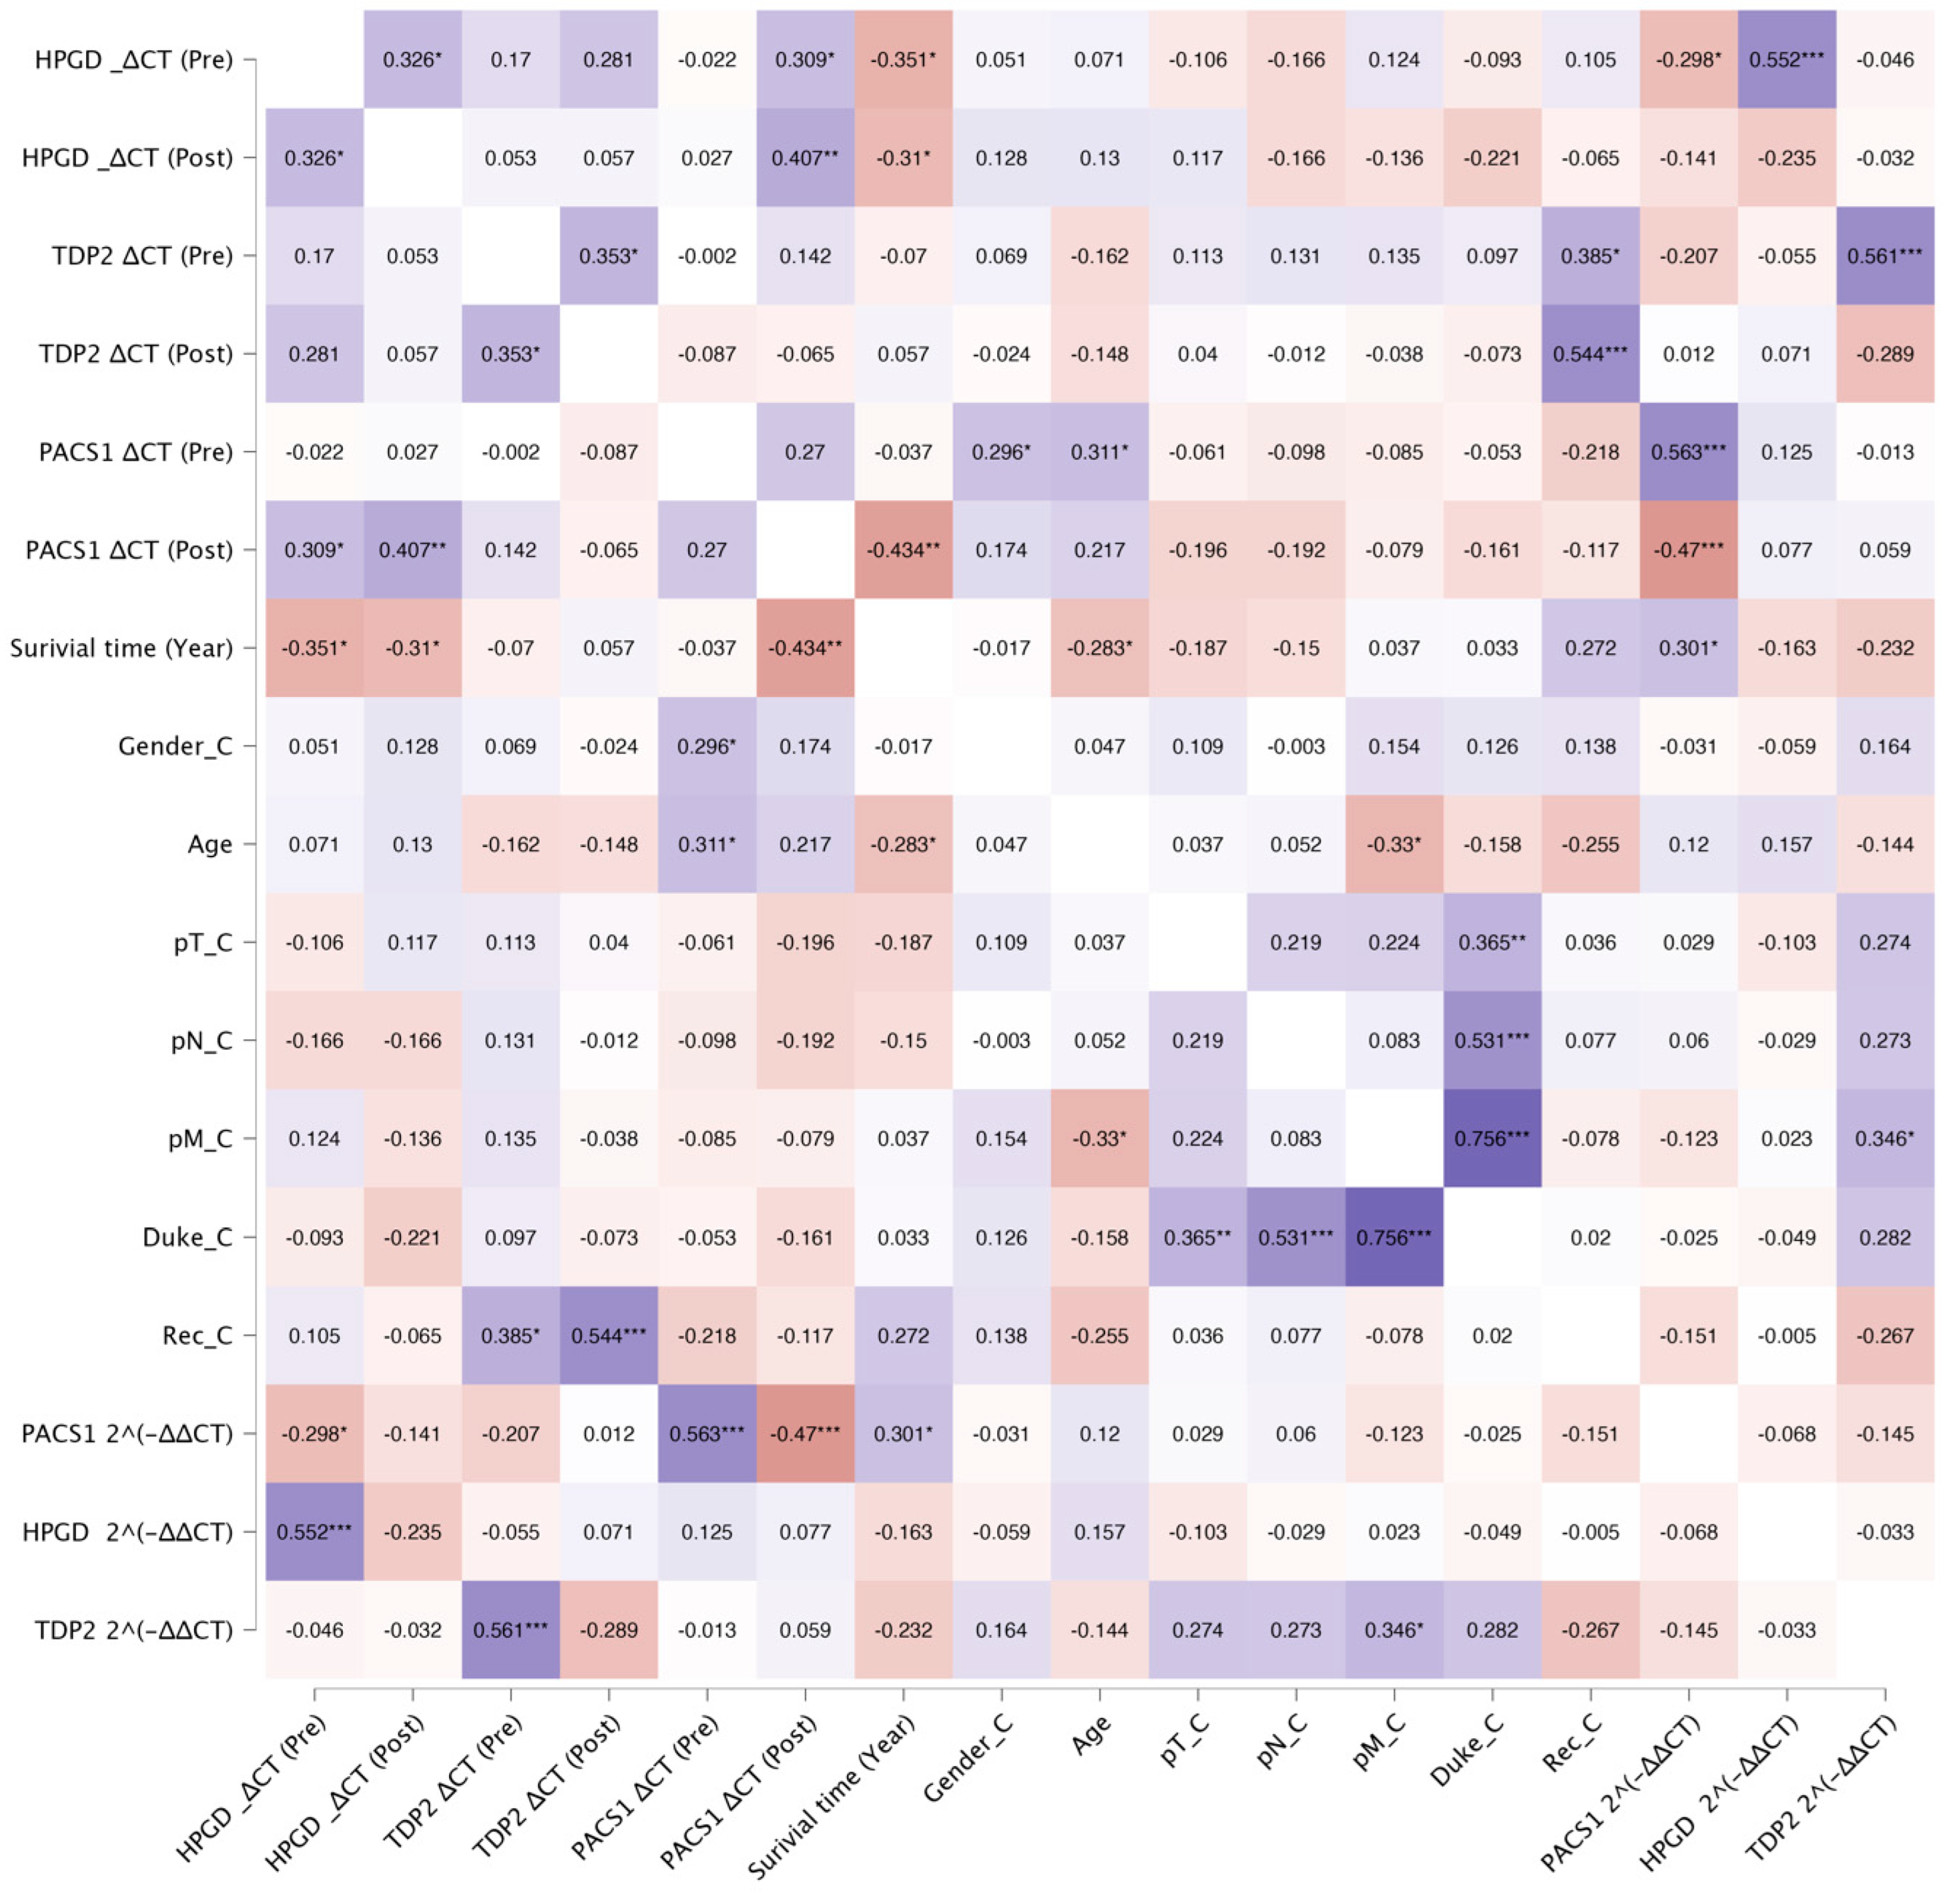
3.2. Correlation Analysis of Biomarkers and Clinical Outcomes
The correlation analysis revealed several significant associations between the biomarkers, survival outcomes, recurrence, and Duke stage in the studied cohort. Below, we summarize the key findings grouped by the biomarker and clinical variables (
Figure 2).
3.3. HPGD
The relationship between the HPGD expression levels, quantified using the Taqman assay (ΔCT values), and patient survival was thoroughly analyzed.
A significant negative correlation was identified between the pre-operative ΔCT values and survival time (years). As shown in
Figure 3, this suggests that higher pre-operative ΔCt values (lower
HPGD expression) are associated with shorter survival times. However, the low R
2 value (0.1234) indicates a weak correlation, meaning that the
HPGD expression pre-operation explains only a small portion of the variability in the survival time.
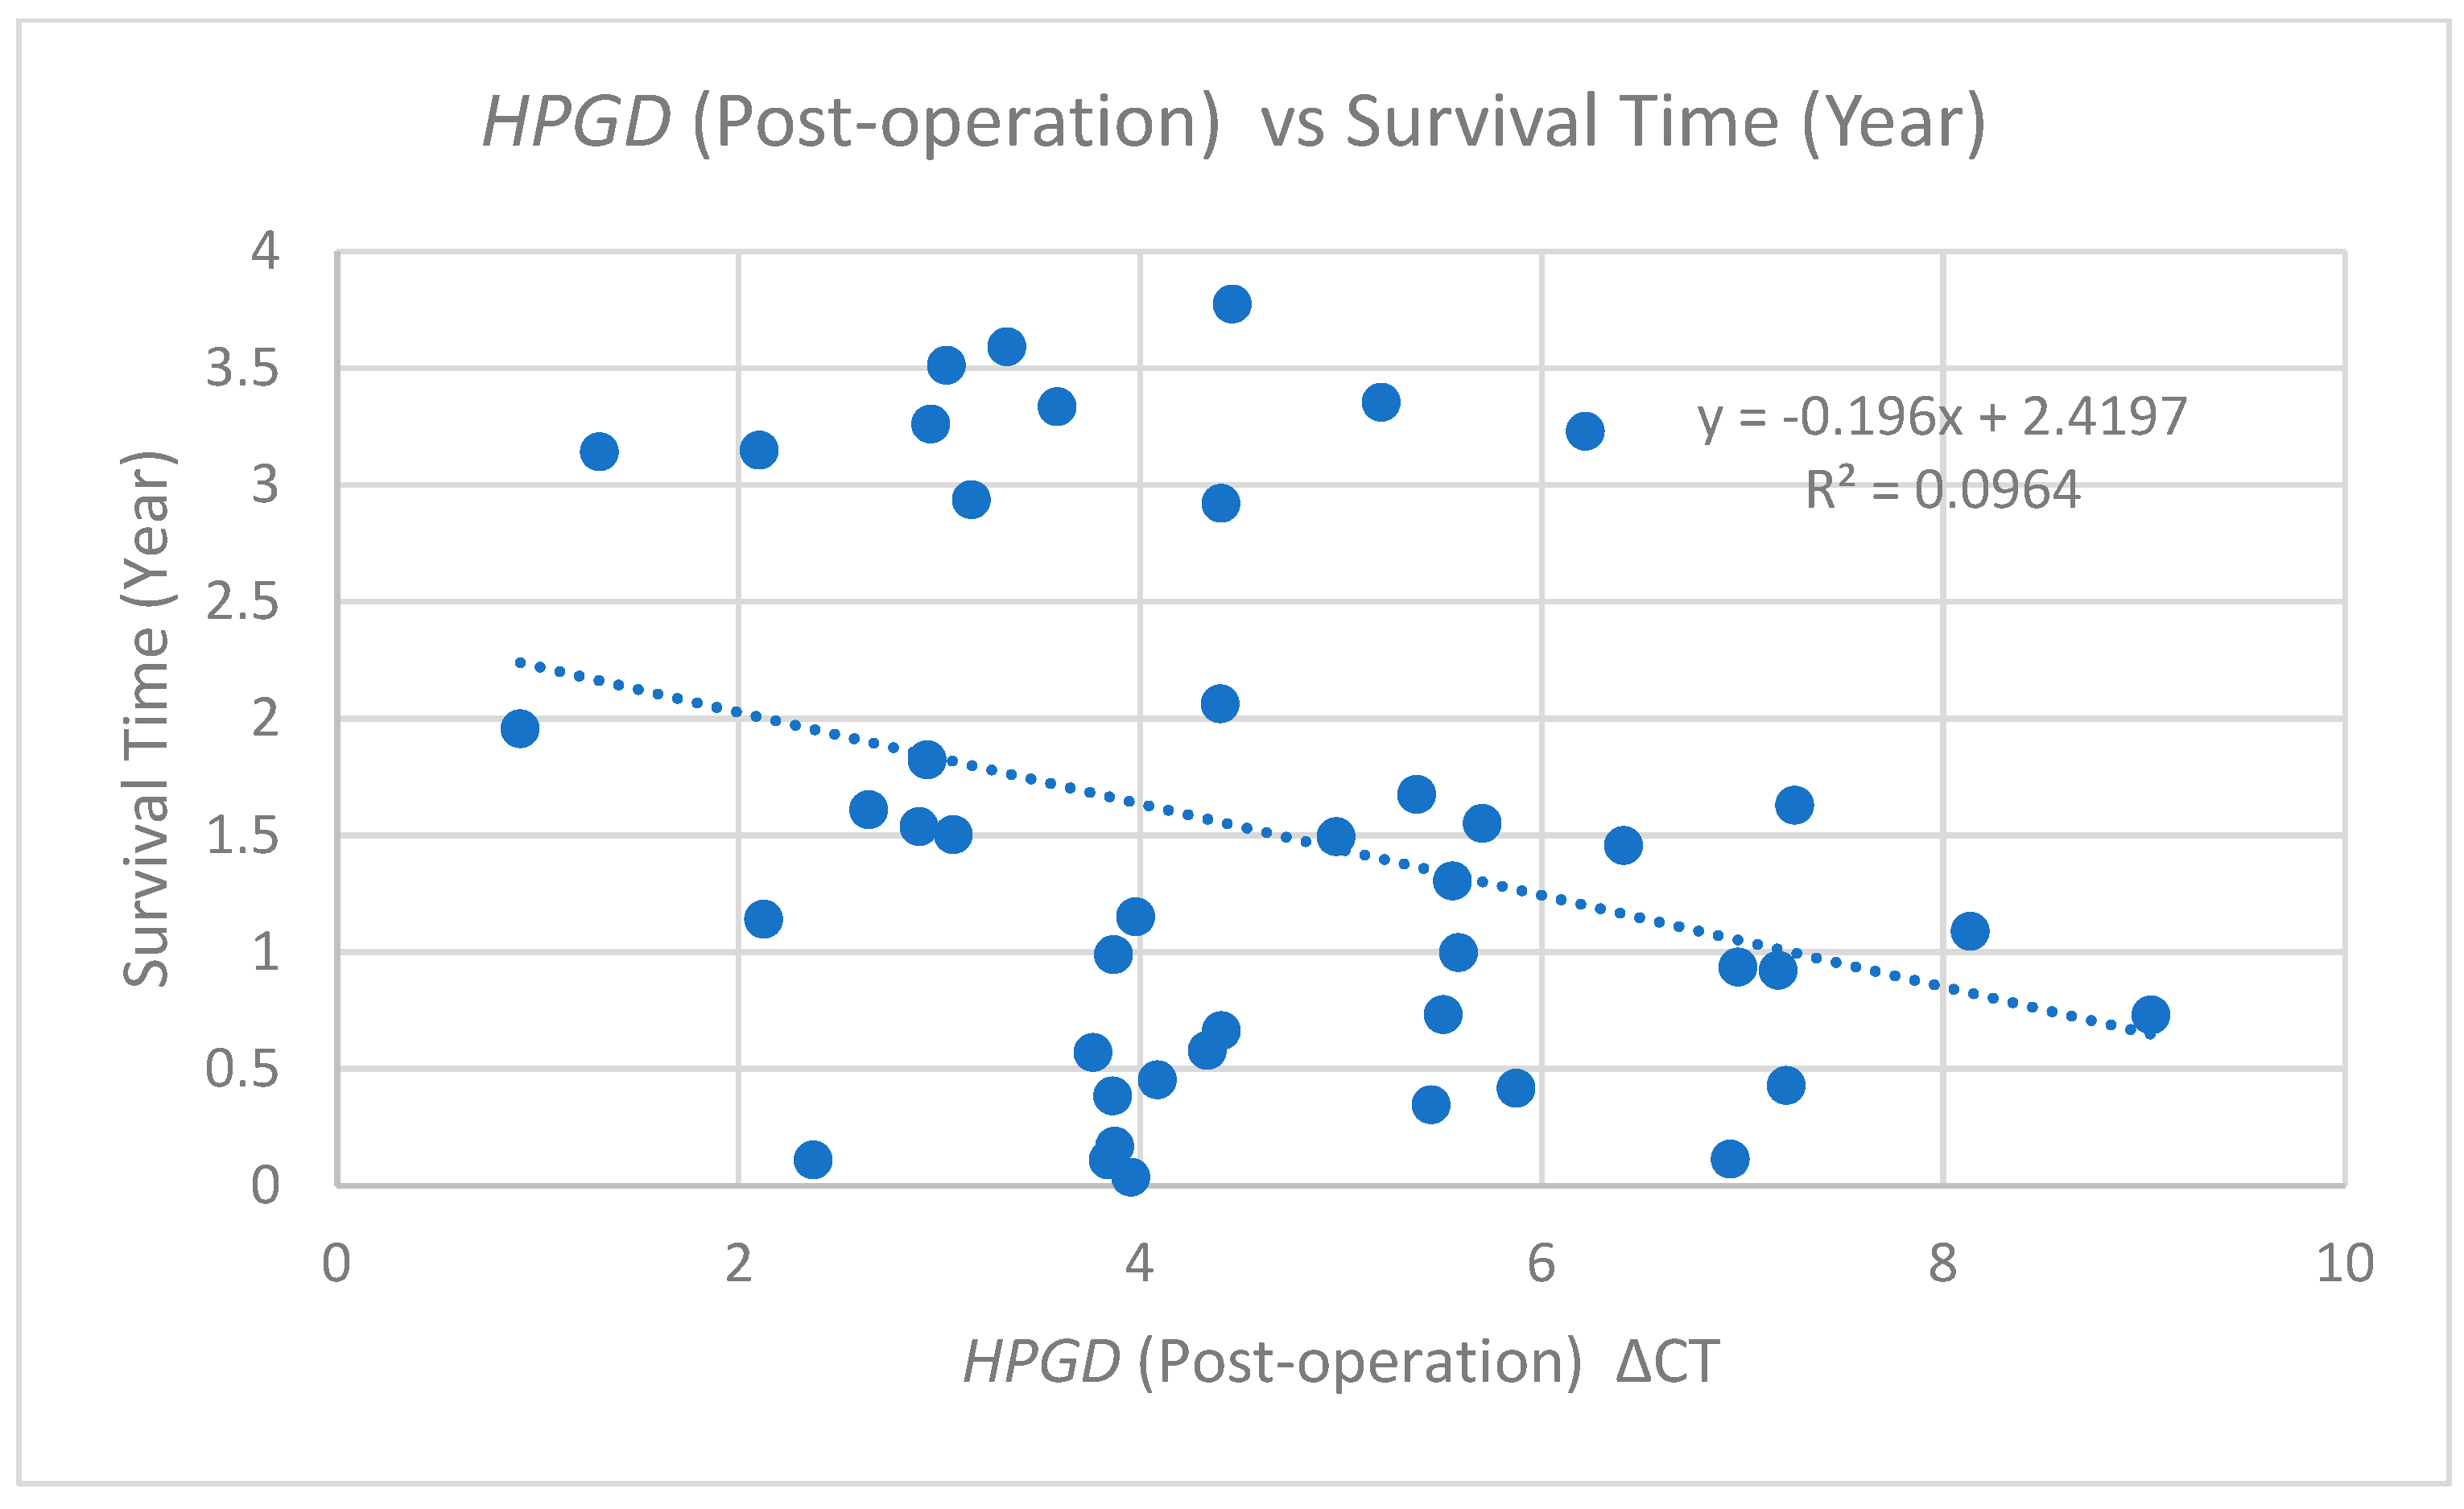
Similarly, an additional analysis of post-operative ΔCT values relative to the survival time is depicted in
Figure 4. This scatter plot illustrates a comparable negative correlation, represented by the trend line equation (y = −0.196x + 2.4197) and an R
2 value of 0.0964. This correlation is slightly weaker than that observed for pre-operative values, suggesting that higher post-operative ΔCt values (lower
HPGD expression) are associated with shorter survival times.
The alignment of the correlation trends between pre- and post-operative measurements reinforces the notion of HPGD’s potential as a prognostic biomarker. Specifically, these findings indicate that patients demonstrating a lower HPGD expression whether assessed pre-operatively or post-operatively may experience shorter survival times.
3.4. TDP2
The analysis of TDP2 expression levels through the TaqMan quantitative PCR (qPCR) revealed significant associations with both recurrence rates and the ΔCT values of TDP2. Specifically, higher expression levels of TDP2 were correlated with lower TDP2 ΔCT values, confirming the expected inverse relationship between the TDP2 expression and ΔCT. Pre-operative TDP2 levels demonstrated a positive correlation with post-operative TDP2 levels, with a Pearson correlation coefficient of (r = 0.353, p = 0.020). A further analysis indicated that pre-operative TDP2 levels were positively correlated with log2 TDP2 (r = 0.362, p = 0.019), thereby establishing that as the pre-operative TDP2 expression increases, the log2 TDP2 also elevates. Conversely, post-operative TDP2 levels exhibited a strong negative correlation with log2 TDP2 (r = −0.643, p < 0.01), which suggests a decline in log2 TDP2 with higher TDP2 levels post-operation.
Importantly,
TDP2 levels were significantly associated with recurrence. Pre-operative
TDP2 ΔCT values showed a moderate positive correlation with the recurrence status (r = 0.385,
p = 0.016), while post-operative
TDP2 ΔCT values revealed a stronger correlation (r = 0.544,
p < 0.001). This suggests that elevated post-operative
TDP2 expression levels, indicated by lower ΔCT values, are strongly associated with increased recurrence rates. Figures illustrate these relationships effectively.
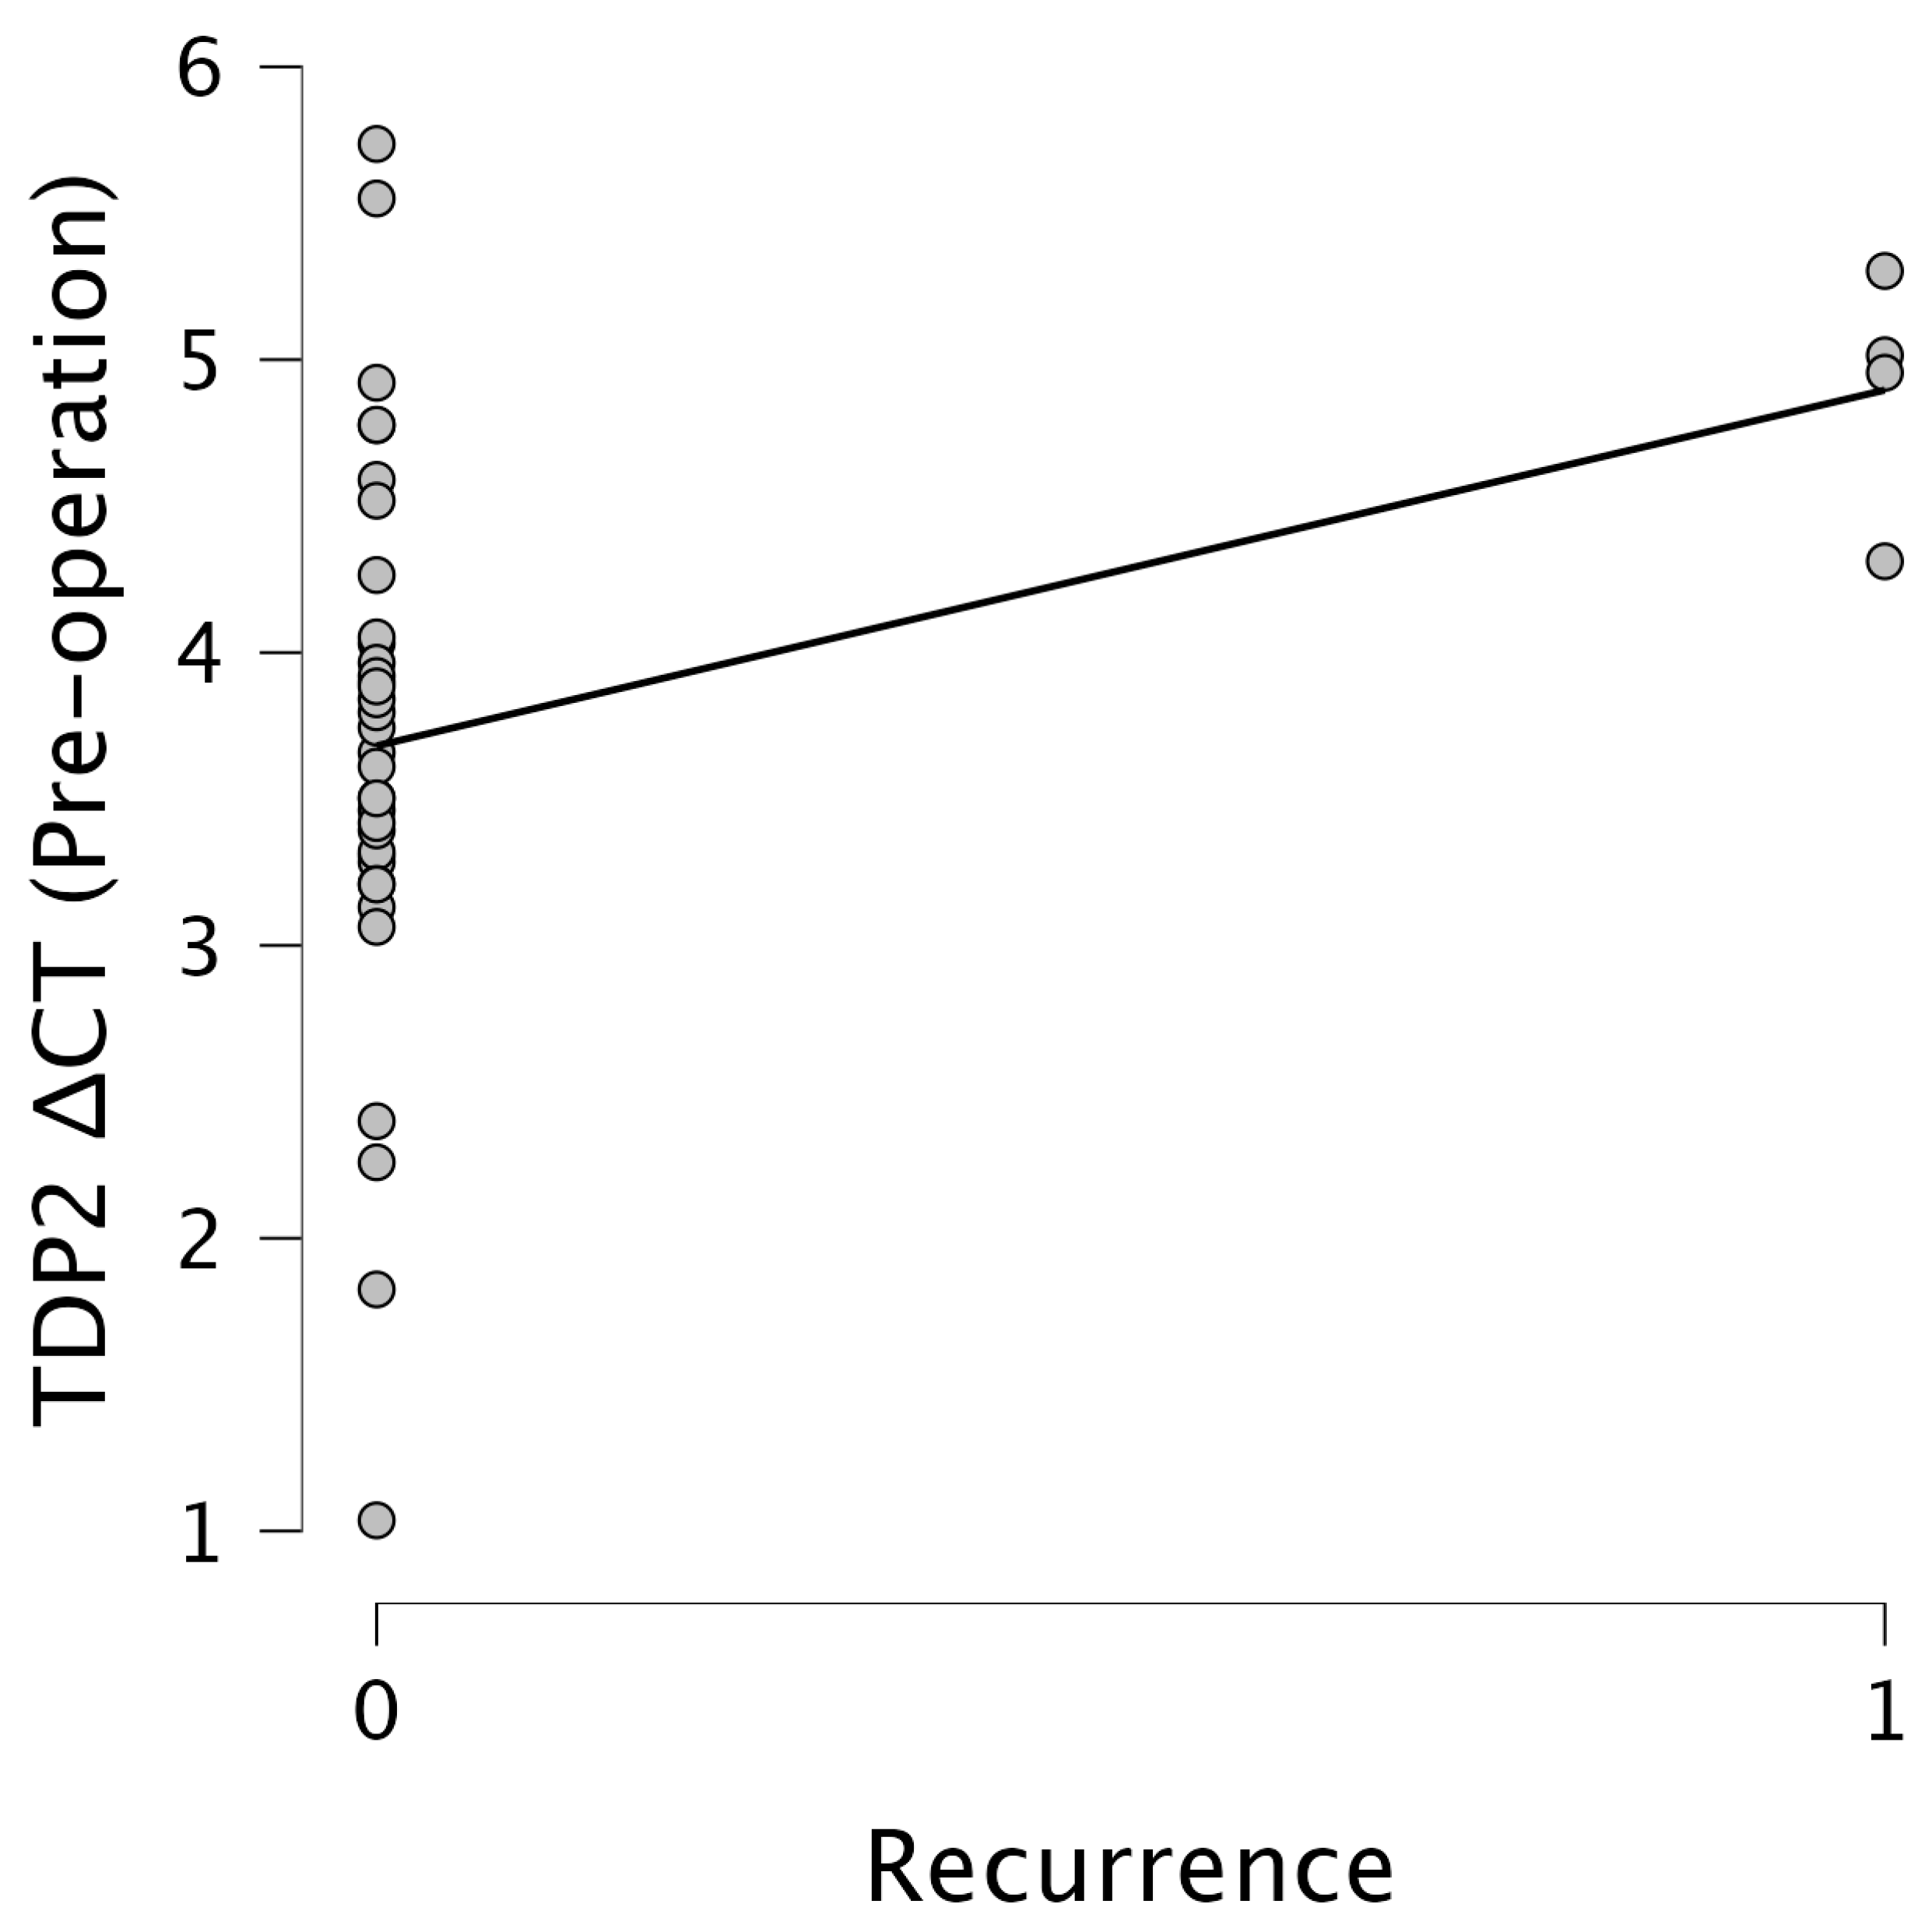
Figure 5 presents a scatter plot showcasing the relationship between the
TDP2 ΔCT pre-operation and the recurrence status, indicating a clustering of data points around ΔCT values of 3–4 for non-recurrent cases, with a slight upward trend observed in recurrent cases.
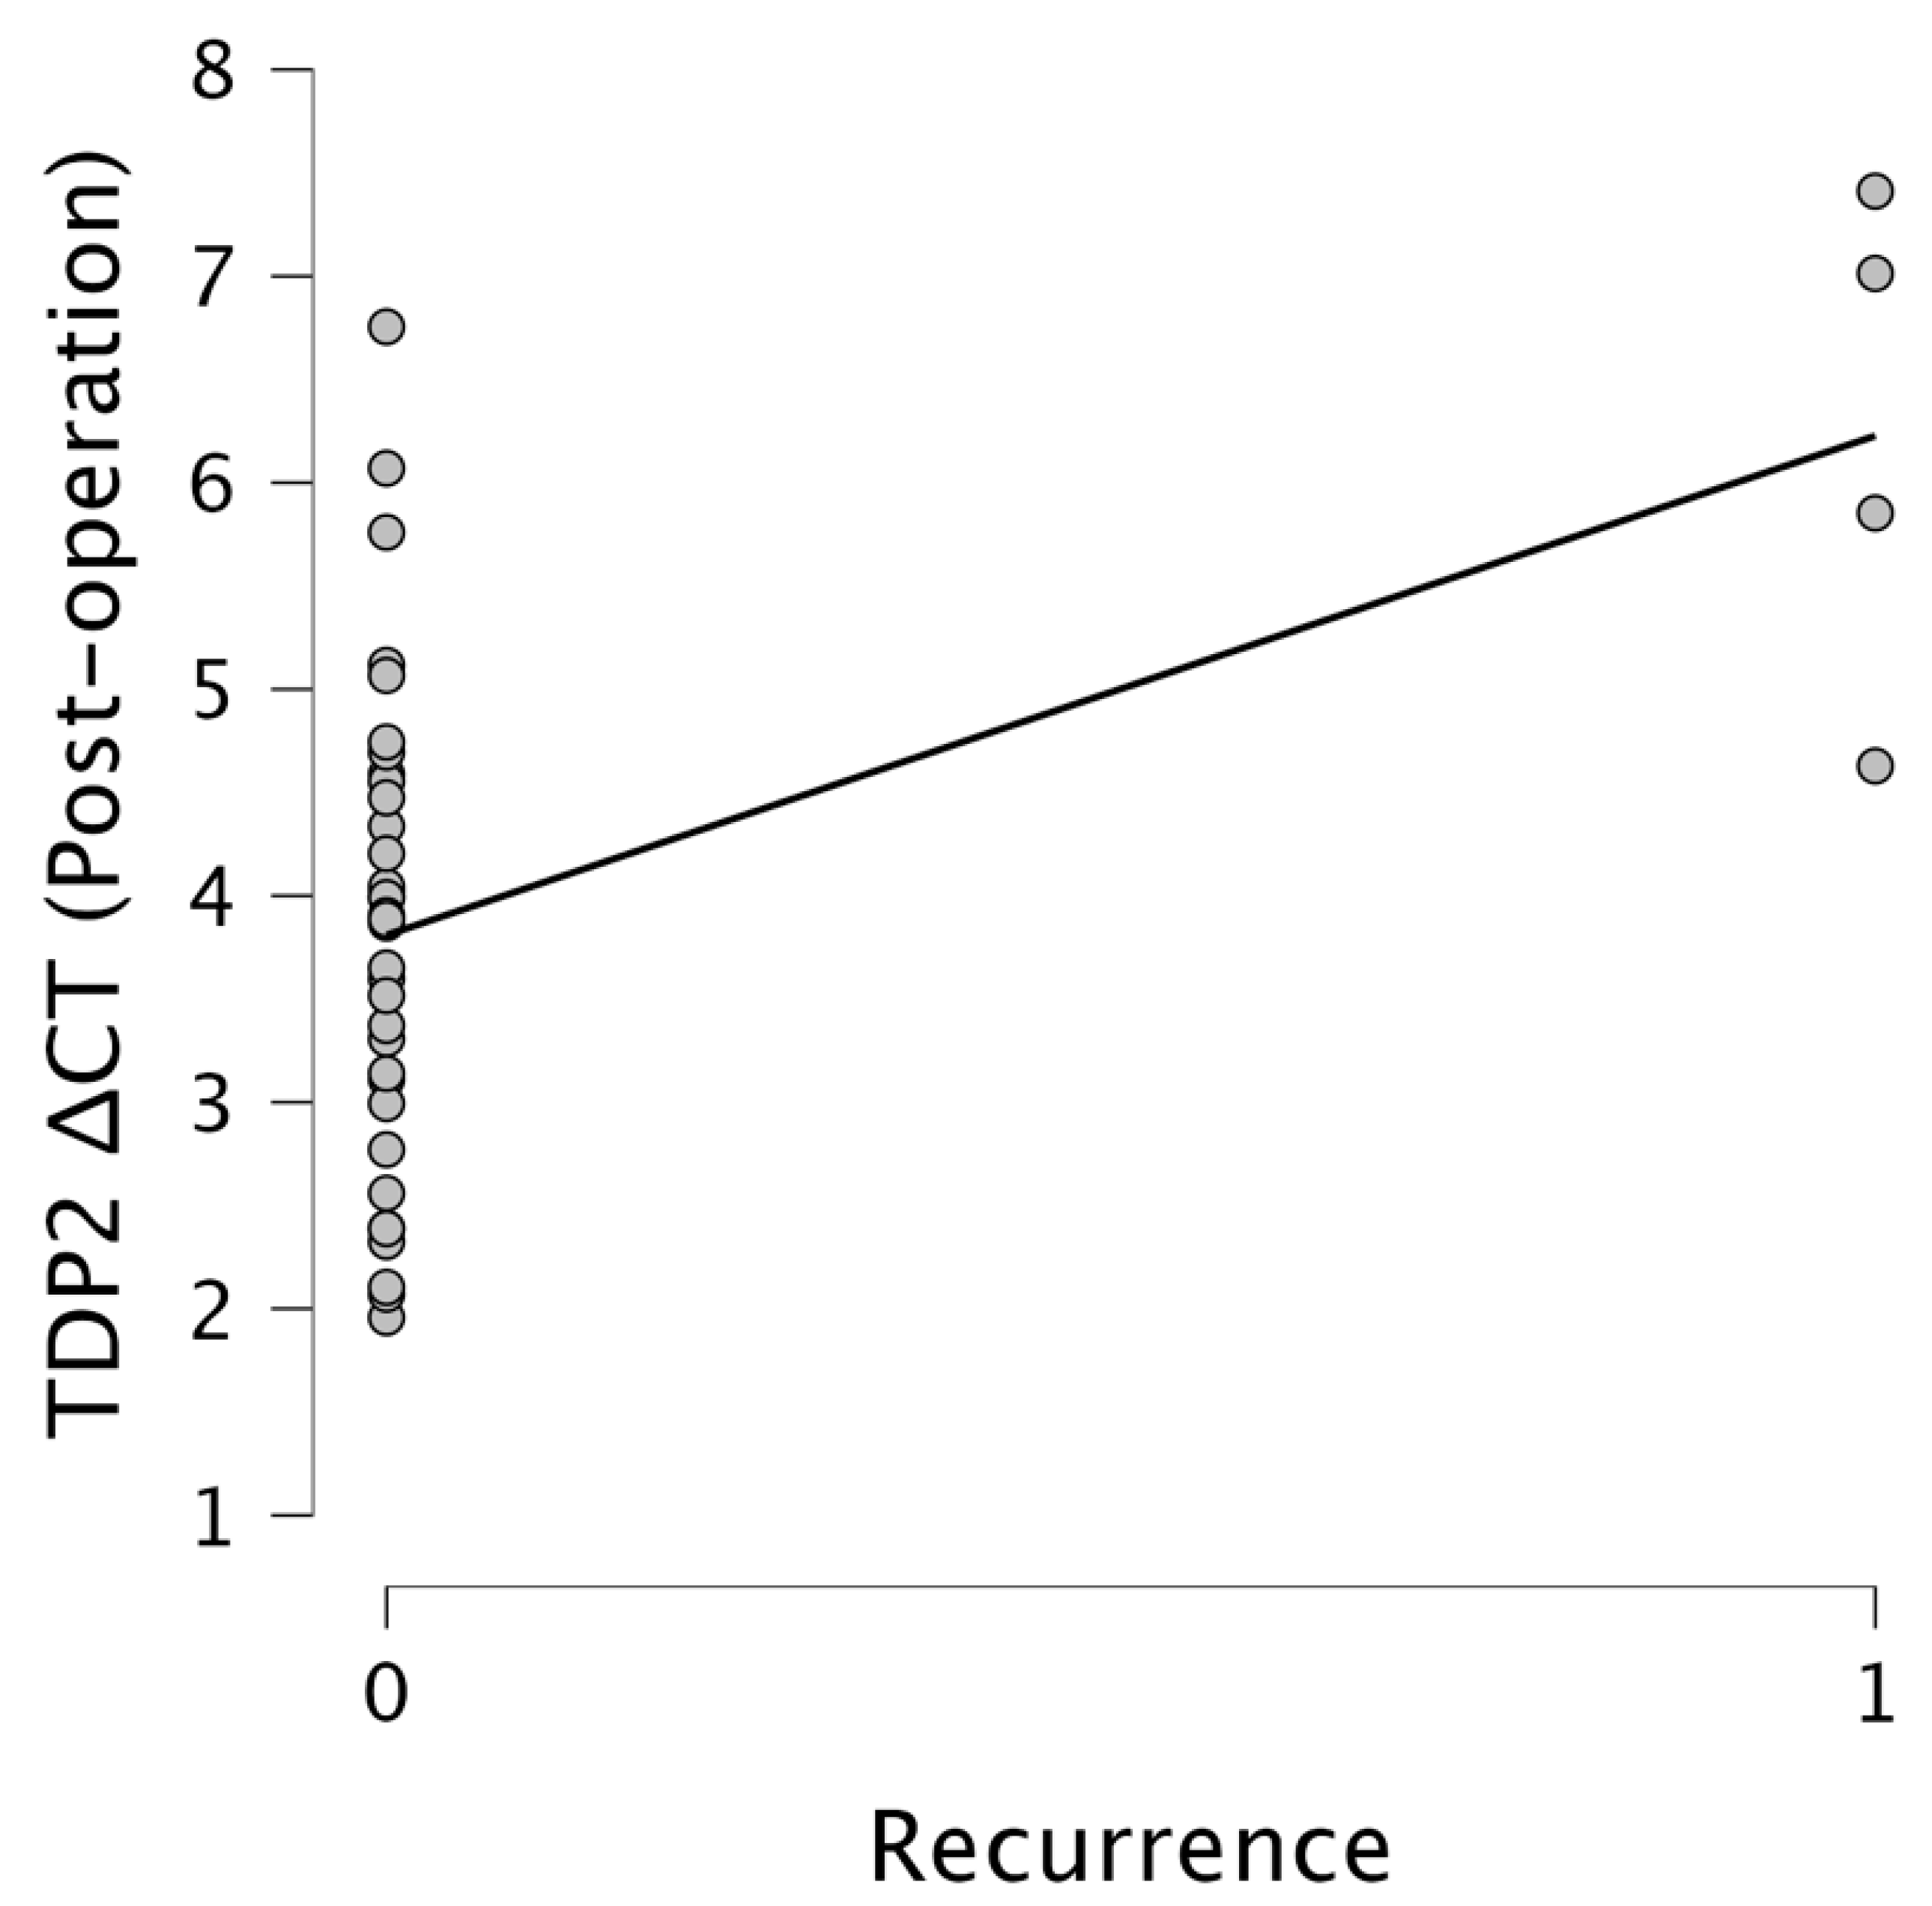
Figure 6 emphasizes the relationship between the
TDP2 ΔCT post-operation and the recurrence, where data points primarily aggregate around 3–4 for non-recurrent cases, with a notable increase towards ΔCT values of 6–7 for recurrent cases, indicating a significant trend. The results underscore the potential of
TDP2 as a biomarker for recurrence, with lower ΔCT values reflecting higher expression levels of
TDP2 being predictive of recurrence outcomes.
3.5. PACS1
We observed a significant negative correlation between
PACS1 2^(−ΔΔCT), representing the fold change in the
PACS1 expression, and
HPGD ΔCT values measured prior to the surgical intervention (r = −0.298,
p = 0.049) (
Figure 7). This suggests that higher expression levels of
PACS1 are associated with lower levels of
HPGD prior to the operation, indicating a possible inverse regulatory relationship between these two biomarkers in the pre-operative setting (
Figure 8).
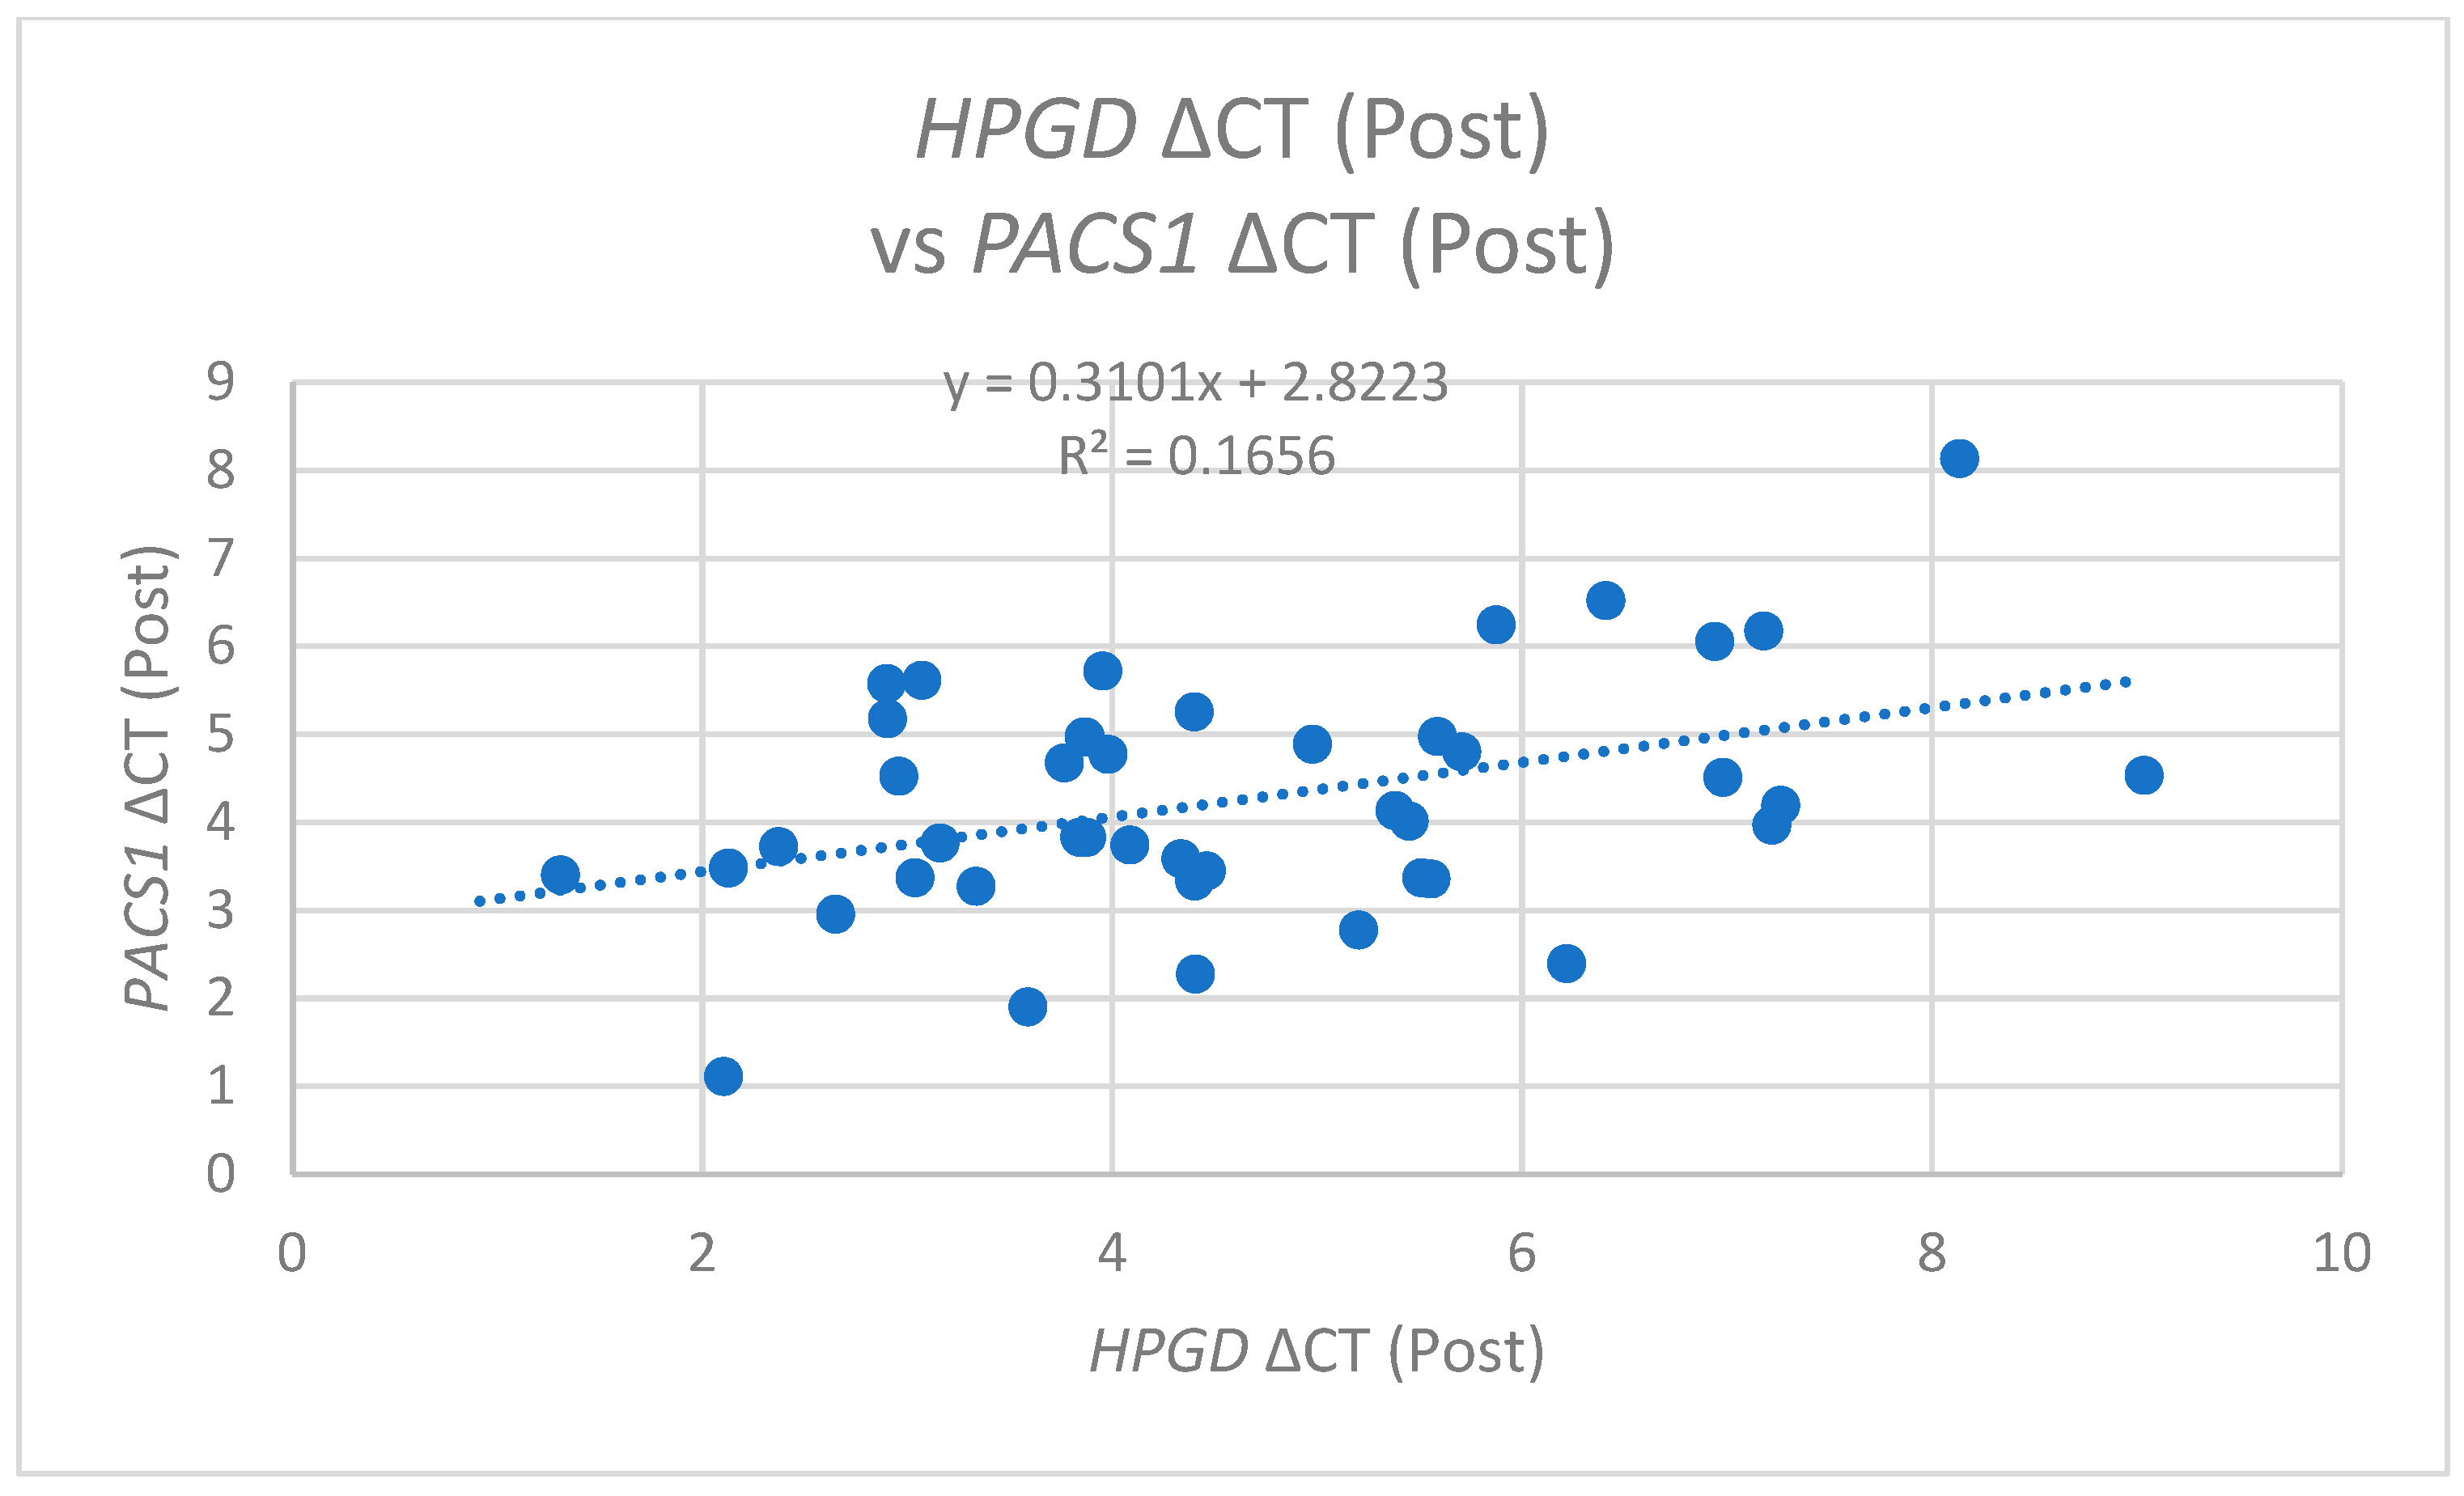
In the post-operative analysis,
PACS1 ΔCT values exhibited a positive correlation with pre-operative
HPGD ΔCT (r = 0.309,
p = 0.041) (
Figure 8) and also with post-operative
HPGD levels (r = 0.407,
p = 0.006) (
Figure 9). This suggests that following the surgical intervention, increases in the
PACS1 expression may facilitate or promote the expression of
HPGD, further underscoring the dynamic interplay between these molecules during operations.
- 2.
PACS1 and Survival Time
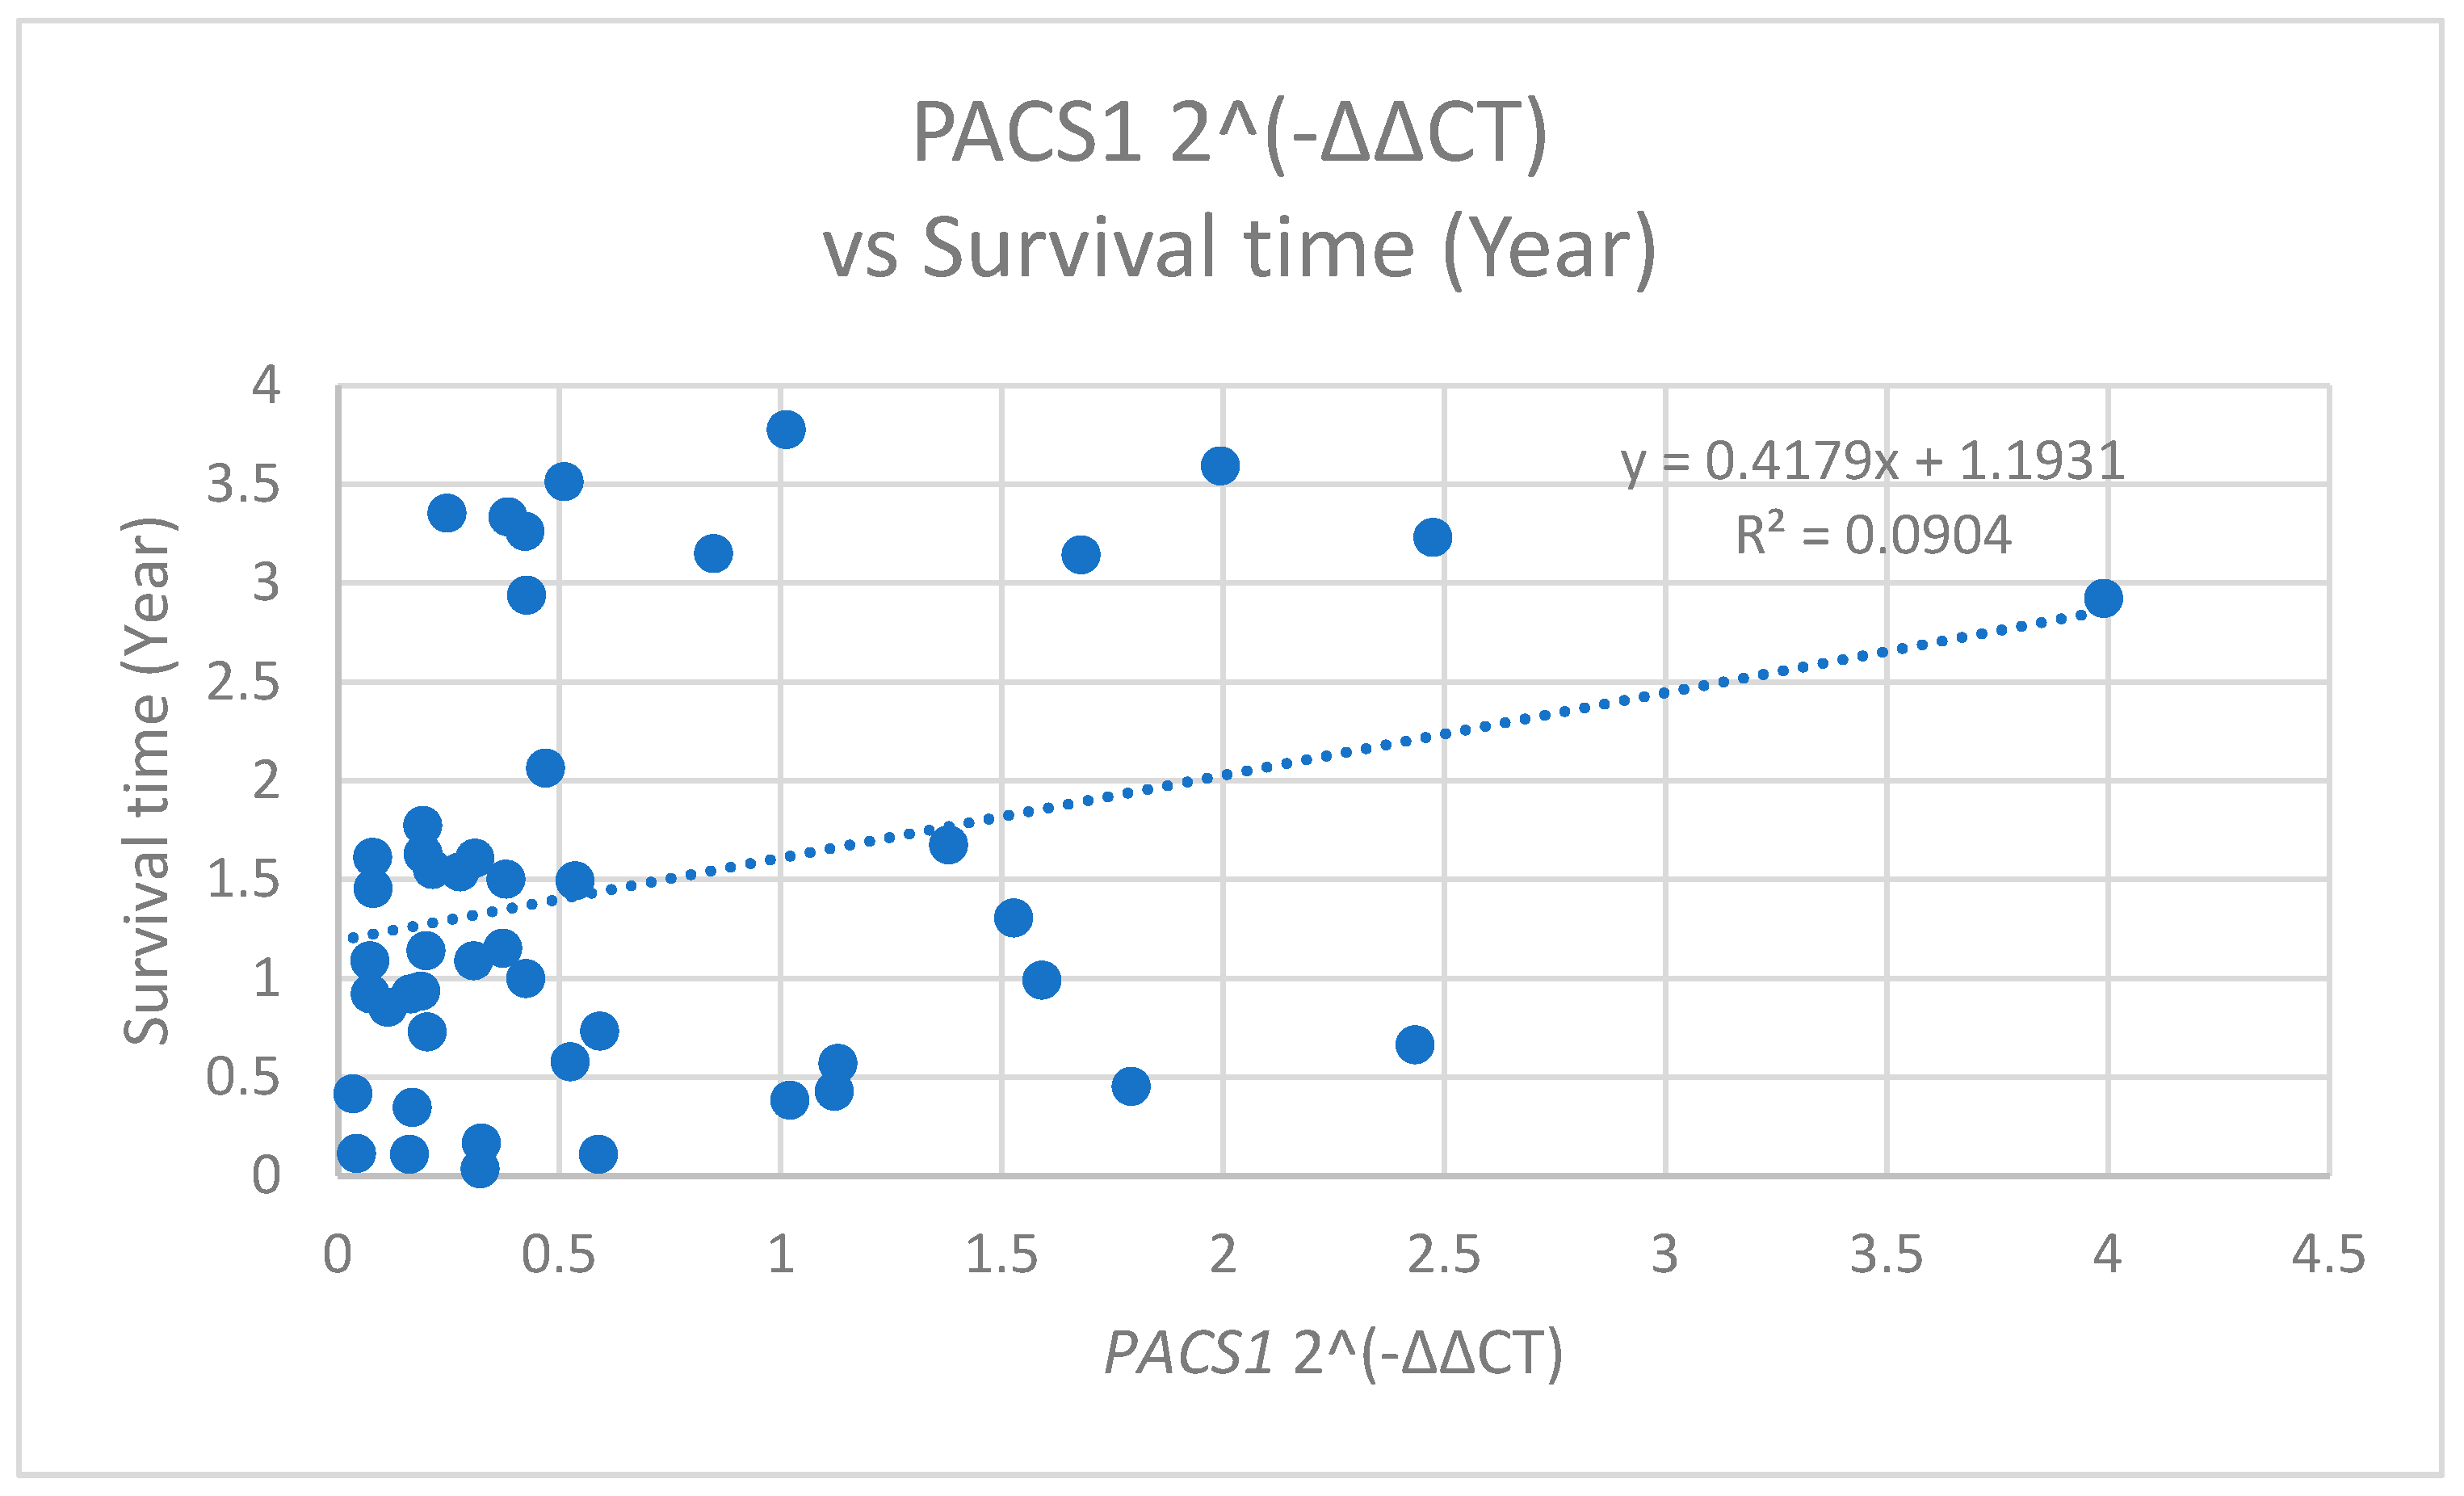
The analysis of
PACS1 expression levels in relation to the patient survival time unveiled significant correlations. Specifically,
PACS1 2^(−ΔΔCT) values was positively correlated with the survival time, measured in years (r = 0.301,
p = 0.038) (
Figure 10). This indicates that a higher
PACS1 expression is associated with shorter survival times.
Conversely, the
PACS1 ΔCT measured post-operation demonstrated a significant negative correlation with the survival duration (r = −0.434,
p = 0.002) (
Figure 11). The contrasting natures of these correlations suggest that the timing of the
PACS1 measurement, whether pre- or post-operation, may influence its prognostic capabilities, warranting a further exploration into the mechanisms through which
PACS1 impacts patient survival.
- 3.
PACS1 and Clinical Parameters
We further assessed the relationship of PACS1 ΔCT (pre-operation) with various clinical parameters, including gender and age. A significant positive correlation was found between the PACS1 ΔCT (pre) and gender (r = 0.296, p = 0.039), as well as between PACS1 ΔCT (pre) and age (r = 0.311, p = 0.030). These findings indicate that demographic factors may influence PACS1 expression levels, suggesting a need for the consideration of these parameters when evaluating PACS1 as a potential biomarker.
- 4.
PACS1 Expression Variability
Moreover, a strong positive correlation was observed between the PACS1 2^(−ΔΔCT) and PACS1 ΔCT (pre) values (r = 0.563, p < 0.001), indicating a robust relationship between these two measures and supporting the reliability of PACS1 as a biomarker. However, PACS1 2^(−ΔΔCT) values showed a significant negative correlation with post-operative PACS1 ΔCT (r = −0.470, p < 0.001). This suggests that significant alterations in the PACS1 expression occur post-operation, potentially reflecting the therapeutic effect of the intervention on biomarker levels.
3.6. Clinical Variables
Age was negatively correlated with the survival in years (r = −0.283, p = 0.044), suggesting that older patients had shorter survival times. The Duke stage was strongly correlated with pathological staging variables, including pN (r = 0.531, p < 0.001), pM (r = 0.756, p < 0.001), and pT (r = 0.365, p = 0.008), indicating a robust association between the tumor staging and disease severity.
4. Discussion
CRC persists as one of the most significant public health challenges globally, characterized by alarming incidence and mortality rates. The findings of our study further emphasize the urgent need to improve prognostic assessments and therapeutic strategies to mitigate the recurrence rates and late-stage diagnoses characteristic of this malignancy. The validation of our three cfRNA biomarkers, HPGD, PACS1 and TDP2, reveals a promising approach for the early identification of MRD in CRC patients.
Our results indicate that pre-operative and post-operative expression levels of
HPGD correlate significantly with survival outcomes, mirroring prior findings that suggested its potential as a prognostic biomarker in CRC. Higher expression levels of
HPGD have been associated with better survival rates in this study, aligning with observations regarding tumor dynamics post-operation from our previous study [
7], which emphasize that cfRNA profiles could reflect shifts in the tumor burden and treatment responses, enhancing their utility in clinical settings. These findings resonate with prior studies suggesting
HPGD’s role as a prognostic biomarker in CRC, where higher levels of this enzyme are associated with improved survival rates of the other cancer types, such as breast cancer [
9] and prostate cancer [
10]. Moreover, the recent work by Zhai et al. concurs with our observations regarding the prognostic significance of
HPGD, highlighting its regulatory effects in cancer progression and immune environment monitoring (Zhai et al., 2024). Their investigations suggest that
HPGD plays an essential role in determining disease outcomes, further establishing the link between this biomarker and survival [
11]. Similarly, Padilla et al. highlight high
HPGD expression levels across various malignancies, proposing its function as a tumor suppressor linked to better prognostic outcomes [
9]. Further reinforcing the clinical relevance of cfRNAs, studies have shown that HPGD’s involvement in the prostaglandin metabolic pathway is crucial for understanding its impact on tumor growth and the inflammatory microenvironment surrounding cancers [
12]. Elevated COX-2 activity has been previously associated with decreased HPGD levels, suggesting a reciprocal relationship that can drive tumor progression [
13]. This interplay may elucidate why monitoring HPGD levels in patients could provide critical insights into treatment efficacy and patient management strategies.
The findings of our study also highlight the critical relationship between
PACS1 and
HPGD expression levels, which may serve as prognostic biomarkers in the context of CRC. Our analysis shows a significant correlation between
PACS1 and
HPGD expression levels post-operation, suggesting that PACS1 may act to regulate the
HPGD expression in response to changes within the tumor microenvironment. These results align with our previous study (Jin et al., 2023), where we demonstrated that expression profiles of
HPGD,
PACS1, and
TDP2 were consistent across cfRNAs and tissue samples, underscoring the potential of these genes as robust biomarkers for CRC [
7]. The interplay between these two biomarkers could offer insights into their collective roles in influencing tumor dynamics and the patient prognosis. Specifically,
PACS1 has been implicated in apoptosis through its regulation of BAX and BAK, highlighting its potential impact on cancer cell survival and treatment responses [
14,
15]. Furthermore, our findings underscore the necessity of understanding demographic influences, such as age and gender, on biomarker expression levels, as these factors may play a pivotal role in patient-specific responses to therapy. Integrating demographic influences into clinical practice is crucial; however, the existing references do not adequately support the claims regarding their impact on the
PACS1 expression and CRC outcomes, indicating a need for more direct evidence. The integration of
PACS1 and
HPGD expression profiles in clinical settings could facilitate personalized therapeutic strategies, optimizing treatment regimens based on individual biomarker profiles. Overall, these insights pave the way for future investigations into the mechanistic underpinnings of
PACS1 and
HPGD interactions, potentially reinforcing their roles as key players in the CRC prognosis and management.
Our findings also extend the understanding of TDP2’s role in cancer progression. Elevated levels of
TDP2 were linked with an increased risk of recurrence, reinforcing the significance of this gene in DNA repair mechanisms and its potential involvement in therapeutic responses. As highlighted by Manguso et al., 2024,
TDP2, along with other key genes, constitutes a vital prognostic indicator, reinforcing its utility in non-invasive diagnostics [
16].
TDP2 is crucial for resolving DNA double-strand breaks involving topoisomerase II (TOP2); its deficiency has been linked to genomic instability and heightened tumorigenesis [
16,
17]. Additionally,
TDP2’s interactions within DNA repair pathways and oncogenic signaling further establish its role in cancer progression and therapeutic responses, making it a promising target for personalized cancer treatment approaches [
17]. Consequently, integrating a
TDP2 analysis with cfRNA profiling could enhance prognostic capabilities and inform tailored therapeutic strategies for CRC management.
The integration of biomarkers such as HPGD, PACS1, and TDP2 into clinical diagnostics holds significant promise for transforming current practices surrounding MRD detection in CRC. Traditional diagnostic methods often struggle with limitations in sensitivity and specificity, which necessitates the development of more reliable, non-invasive alternatives. The findings from this study support the potential of a blood-based test that measures levels of cfRNAs for identifying patients at an elevated risk of recurrence significantly earlier than conventional methods permit. Future research should concentrate on expanding the cohort size and examining the long-term prognostic implications of diverse cfRNA profiles over multiple post-operative time points to further validate the robustness of our findings.
Moreover, it is crucial to evaluate the applicability of those cfRNA biomarkers beyond the predominantly Chinese cohorts in current studies. The genetic variability among different ethnicities can significantly influence the expression and reliability of cfRNAs as biomarkers [
18]. Studies have suggested that cancer-specific cfRNAs exhibit expression patterns that are not universally consistent across various demographic groups [
18,
19]. Additionally, different validation studies indicate the importance of having a diverse reference dataset to evaluate cfRNA biomarkers and address potential biases that may arise from tissue or cell-type specificity [
20]. Hence, the exploration of these cfRNA biomarkers within multiethnic cohorts is essential to enhance the reliability in clinical settings and support personalized medicine approaches in CRC management [
18].
The current study has several limitations that should be addressed to enhance its overall impact. Specifically, a more thorough examination of the biological roles and mechanisms governing the differential regulation of HPGD, PACS1, and TDP2 in CRC is necessary, as this could elucidate the pathways through which these genes contribute to tumor biology, particularly in light of the conflicting TDP2 results. Furthermore, while the initial cohort of 52 patients offers valuable insights, a larger sample size achieved through multicentric studies would improve the statistical power and generalizability of our findings. Additionally, it is important to address the technical aspects of the qPCR calibration, quality control measures, and normalization strategies to ensure a robust data interpretation. Future investigations should also implement a longitudinal design that assesses the prognostic relevance of these biomarkers across multiple post-operative time points, thereby providing a more comprehensive understanding of their kinetic profiles.


 ,
, 


