Abstract
With the advancement of human industrial activities, increased carbon dioxide emissions have made global warming an inescapable trend. Elevated temperatures exert profound effects on the viability of large macroalgae. Bangia fuscopurpurea (Rhodophyta) is a commercially important large red alga widely cultivated along the coastal waters of Putian, Fujian Province, China; however, its physiological, biochemical, and molecular responses to heat stress remain unclear. To address this question, we cultured B. fuscopurpurea at 15 °C (control) and 28 °C (heat stress) for 7 days, assessed changes in growth and photosynthetic parameters, and performed transcriptome sequencing. Growth analysis revealed that the relative growth rate of B. fuscopurpurea at 28 °C was significantly lower than that at 15 °C. After 1 day at 28 °C, the chlorophyll a and carotenoid contents increased significantly; the phycobiliprotein levels rose markedly on days 4 and 7, whereas the Fv/Fm ratio decreased significantly on days 1, 4, and 7. Transcriptomic analysis indicated that heat stress up-regulated the majority of differentially expressed genes (DEGs) in B. fuscopurpurea. KEGG pathway enrichment analysis revealed that the DEGs were predominantly associated with photosynthesis, carbohydrate and energy metabolism, glycerophospholipid metabolism, and the glutathione cycle. In summary, B. fuscopurpurea mitigates the adverse effects of heat stress by up-regulating genes involved in photosynthesis, antioxidant defenses, and glycerophospholipid metabolism. These findings enhance our understanding of the physiological adaptations and molecular mechanisms by which B. fuscopurpurea responds to heat stress.
1. Introduction
Since the last century, anthropogenic emissions of greenhouse gases such as CO2 have increased markedly, leading to global climate change [1]. Studies predict that by 2100 the global mean sea surface temperature will increase by 3–7 °C [2]. As a crucial component of the Earth’s ecosystem, ocean warming will significantly affect the marine environment, including sea level rise [3], an increased frequency of marine heatwaves (MHWs) [4], and sea ice decline [5]. Macroalgae (including microalgae and large macroalgae), as the main primary producers of marine ecosystems, provide essential matter and energy for other consumers, playing an important role in marine ecosystems. In addition, they are responsible for approximately 50% of Earth’s oxygen production and biological carbon dioxide uptake, playing an important role in global oxygen supply, carbon dioxide fixation, and climate change mitigation [6]. The effects of ocean warming on the physiological and biochemical processes of large macroalgae indirectly affect their ecological functions and services in marine ecosystems. Studies have shown that large macroalgae can enhance their survival under high-temperature stress through physiological and molecular mechanisms [7]. High temperatures influence osmotic regulatory substances in macroalgae, such as soluble proteins and soluble sugars, as well as photosynthetic pigments [8]. Short-term high-temperature stress in Saccharina japonica triggers a series of physiological and biochemical responses, such as an increased total soluble protein content and enhanced antioxidant enzyme activities [9].
As integral components of marine ecosystems, intertidal macroalgae significantly influence oceanic carbon cycling and energy flux through photosynthesis. Under global climate change, thermal stress substantially affects the photosynthetic performance of macroalgae. In Kappaphycus alvarezii, photosynthetic performance and pigment content are significantly impaired by elevated temperatures, as evidenced by a reduction in the maximum photochemical quantum yield (Fv/Fm), indicating temperature sensitivity and damage to the photosynthetic apparatus [10]. Conversely, studies on Gracilaria lemaneiformis demonstrate that short-term thermal exposure stimulates growth and enhances photosynthetic activity [11], with photosynthetic saturation rates and carbon utilization efficiency both increasing with temperature [12]. Similar physiological responses have been documented in Gracilaria bailinae [7].
Bangia species are primarily distributed in the temperate and subtropical regions of the western North Pacific and the North Atlantic and are classified into marine and freshwater taxa [13]. B. fuscopurpurea predominantly grows on rocky substrates in the upper intertidal zone; it is a palatable, economically important red alga rich in EPA, free amino acids, polysaccharides, vitamins, and minerals, and among currently cultivated macroalgae, it has the highest EPA content, offering considerable commercial potential [14,15]. Currently, the artificial cultivation of red hair algae in China has been carried out only in Putian, Fujian [16]; however, the physiological responses and molecular mechanisms of marine Bangia thalli under high-temperature stress remain unclear. Therefore, this study investigates the effects of high-temperature stress on marine Bangia thalli in terms of growth and survival, physiological–biochemical parameters, and gene-level changes, aiming to provide further insight into the biological responses of marine Bangia to global warming and to facilitate the breeding of heat-tolerant strains.
2. Materials and Methods
2.1. Seaweed Samples and Temperature Treatment
B. fuscopurpurea samples were collected from aquaculture rafts at Nanri Island, Putian City, Fujian Province (25°13′17.4″ N, 119°28′31.9″ E). The thalli were air-dried and transported back to the laboratory on ice. The samples were first rinsed with seawater filtered through a 0.45 μm membrane to remove debris and epiphytes, then acclimated in an incubator for 2 days. The acclimation conditions were set to 15 °C, a light intensity of 40 μmol photons·m−2·s−1, pH 8.0, a 12 h light/12 h dark photoperiod, and a biomass density of 2 g·L−1; nutrients were supplied as NaNO3-N at 2 mg·L−1 and KH2PO4-P at 1 mg·L−1, with continuous aeration to maintain suspension and growth. After acclimation, the formal experiments were conducted.
Healthy and morphologically intact specimens of B. fuscopurpurea were cultured in 1 L of sterilized seawater medium at 15 °C and 28 °C, supplemented with 2 mg·L−1 NaNO3-N and 1 mg·L−1 KH2PO4-P. The culture conditions were as follows: a light intensity of 40 μmol photons m−2·s−1, seawater salinity of 30 psu, and a 12 h:12 h (light/dark) photoperiod. The experiment lasted 7 days with three replicates per group, and parallel samples were analyzed separately.
The culture conditions for the transcriptome materials were as follows: after the algae were returned to the laboratory and cultivated for two days as described above, they were transferred to sterile seawater containing antibiotics (0.1 g·L−1 kanamycin sulfate + 0.1 g·L−1 ampicillin + 0.2 g·L−1 streptomycin sulfate) for 1 day of cultivation, and then the formal experiments began. At 6 h and 1 d of the experiment, 3 samples of fresh B. fuscopurpurea with a weight of 0.3 to 0.5 g each were taken from each treatment group. These samples were rapidly frozen with liquid nitrogen and then stored at −80 °C for use as experimental materials for transcriptome sequencing.
2.2. Determination of Relative Growth Rate and Fluorescence Parameters
After high-temperature stress treatment, the fresh weight of B. fuscopurpurea was measured at 0, 1, 3, 5, and 7 days of high-temperature cultivation, and the relative growth rate was calculated using the formula proposed by Yong [17].
The maximum photochemical quantum yield of PSII (Fv/Fm) after t days of high-temperature stress was measured using IMAGING-PAM (MAXI, Walz, Nuremberg, Germany), with the formula Fv = Fm − F0. The minimal (F0) and maximal (Fm) fluorescence was obtained by exposing the thalli, dark-adapted for 20 min, to actinic and saturating light provided by the fluorometer [18].
2.3. Measurement of Chlorophyll a and Carotenoids
Approximately 0.05 g of the algal sample was weighed into a 2 mL grinding tube, and 0.95 mL of anhydrous methanol was added. The sample was ground using a cryogenic grinder (JXFSTPRP-CLN-48, Shanghai Jingxin, Shanghai, China) at 70 Hz and −4 °C for 25 cycles (50 s grinding and 10 s pause per cycle). After grinding, the samples were left to stand at 4 °C for 24 h. The mixture was then centrifuged at 4000 rpm for 10 min at 4 °C. The supernatant was collected for further analysis. Using anhydrous methanol as a blank control, OD values at 480 nm, 510 nm, 652 nm, and 665 nm were measured with a microplate reader. The contents of chlorophyll a and carotenoids were calculated using the formula proposed by Porra [19].
2.4. Algal Phycobiliprotein Determination
Approximately 0.05 g (fresh weight) of algal tissue was placed in a 2 mL grinding tube, to which 0.95 mL of precooled 0.1 mol·L−1, pH 7.0 phosphate buffer was added. Samples were homogenized in a cryogenic grinder under the same conditions as described in Section 2.3. The homogenate was centrifuged at 4 °C and 4000 rpm for 10 min. The supernatant was collected for subsequent analysis. Using 0.1 mol·L−1, pH 7.0 phosphate buffer as the blank, OD values at 651 nm, 645 nm, 618 nm, 614 nm, 595 nm, 592 nm, 564 nm, and 455 nm were measured with a microplate reader (TCP011096, Jet Bio-Filtration, Guangzhou, China). The phycoerythrin and phycocyanin contents were calculated using the formula proposed by Beer [20].
2.5. Library Preparation for Transcriptome Sequencing
A total amount of 1 μg RNA per sample was used as input material for the RNA sample preparations. Sequencing libraries were generated using NEBNext®Ultra™ RNA Library Prep Kit for Illumina® (NEB, USA) following the manufacturer’s recommendations, and index codes were added to attribute sequences to each sample. Briefly, mRNA was purified from total RNA using poly-T oligo-attached magnetic beads. Fragmentation was carried out using divalent cations under elevated temperature in NEBNext First Strand Synthesis Reaction Buffer (5×). First-strand cDNA was synthesized using a random hexamer primer and M-MuLV Reverse Transcriptase. Second-strand cDNA synthesis was subsequently performed using DNA polymerase I and RNase H. Remaining overhangs were converted into blunt ends via exonuclease/polymerase activities. After the adenylation of the 3′ ends of DNA fragments, NEBNext Adaptor with a hairpin-loop structure was ligated to prepare for hybridization. In order to select cDNA fragments of preferentially 240 bp in length, the library fragments were purified with the AMPure XP system (Beckman Coulter, Beverly, MA, USA). Then, 3 μL USER Enzyme (NEB, USA) was used with size-selected, adaptor-ligated cDNA at 37 °C for 15 min followed by 5 min at 95 °C before PCR. Then, PCR was performed with Phusion High-Fidelity DNA polymerase, Universal PCR primers, and Index (X) Primer. Finally, the library fragments were purified with AMPure XP system (Beckman Coulter, Beverly, USA), and the library quality was assessed with the Agilent Bioanalyzer 2100 system.
2.6. Quality Control, Transcriptome Assembly, and Gene Function Annotation
Raw data (raw reads) of fastq format were first processed through in-house perl scripts. In this step, clean data (clean reads) were obtained by removing reads containing the adapter, reads containing ploy-N, and low-quality reads from raw data. At the same time, the Q20, Q30, GC content, and sequence duplication level of the clean data were calculated. All the downstream analyses were based on clean data with high quality. The transcriptome was assembled using the Trinity software (2.14.0). Gene function was annotated based on the following databases: NR (NCBI non-redundant protein sequences); Pfam (Protein family); KOG/COG/eggNOG (Clusters of Orthologous Groups of proteins); Swiss-Prot (a manually annotated and reviewed protein sequence database); KEGG (Kyoto Encyclopedia of Genes and Genomes); and GO (Gene Ontology).
2.7. Analysis of Differentially Expressed Genes
The differential expression analysis of the two conditions/groups was performed using the DESeq R package (1.10.1). DESeq provides statistical routines for determining the differential expression in digital gene expression data using a model based on the negative binomial distribution. The resulting p values were adjusted using the Benjamini and Hochberg approach for controlling the false discovery rate. Genes with an adjusted p value < 0.05 found by DESeq were assigned as differentially expressed.
2.8. Statistical Analysis
The RGR, Chl-a, Car, PC, PE, and Fv/Fm data were expressed as means ± SD (n = 3). The experimental data were processed and statistically analyzed by Microsoft Office Excel software. The homogeneity of variance was tested by Levene’s test. At the significance level of p < 0.05, the statistical significance within each group at different time points was tested by One-Way ANOVA, and the statistical significance between groups at the same time point was tested by an independent-sample T-test. Graphpad prism 8.0 software was used for data plotting. Cluster trend profile chart, pairwise comparison, and volcano plot analysis was performed using BMKCloud (www.biocloud.net).
3. Results
3.1. Changes in Photosynthetic Pigments and Fluorescence Parameters Under Different Temperatures
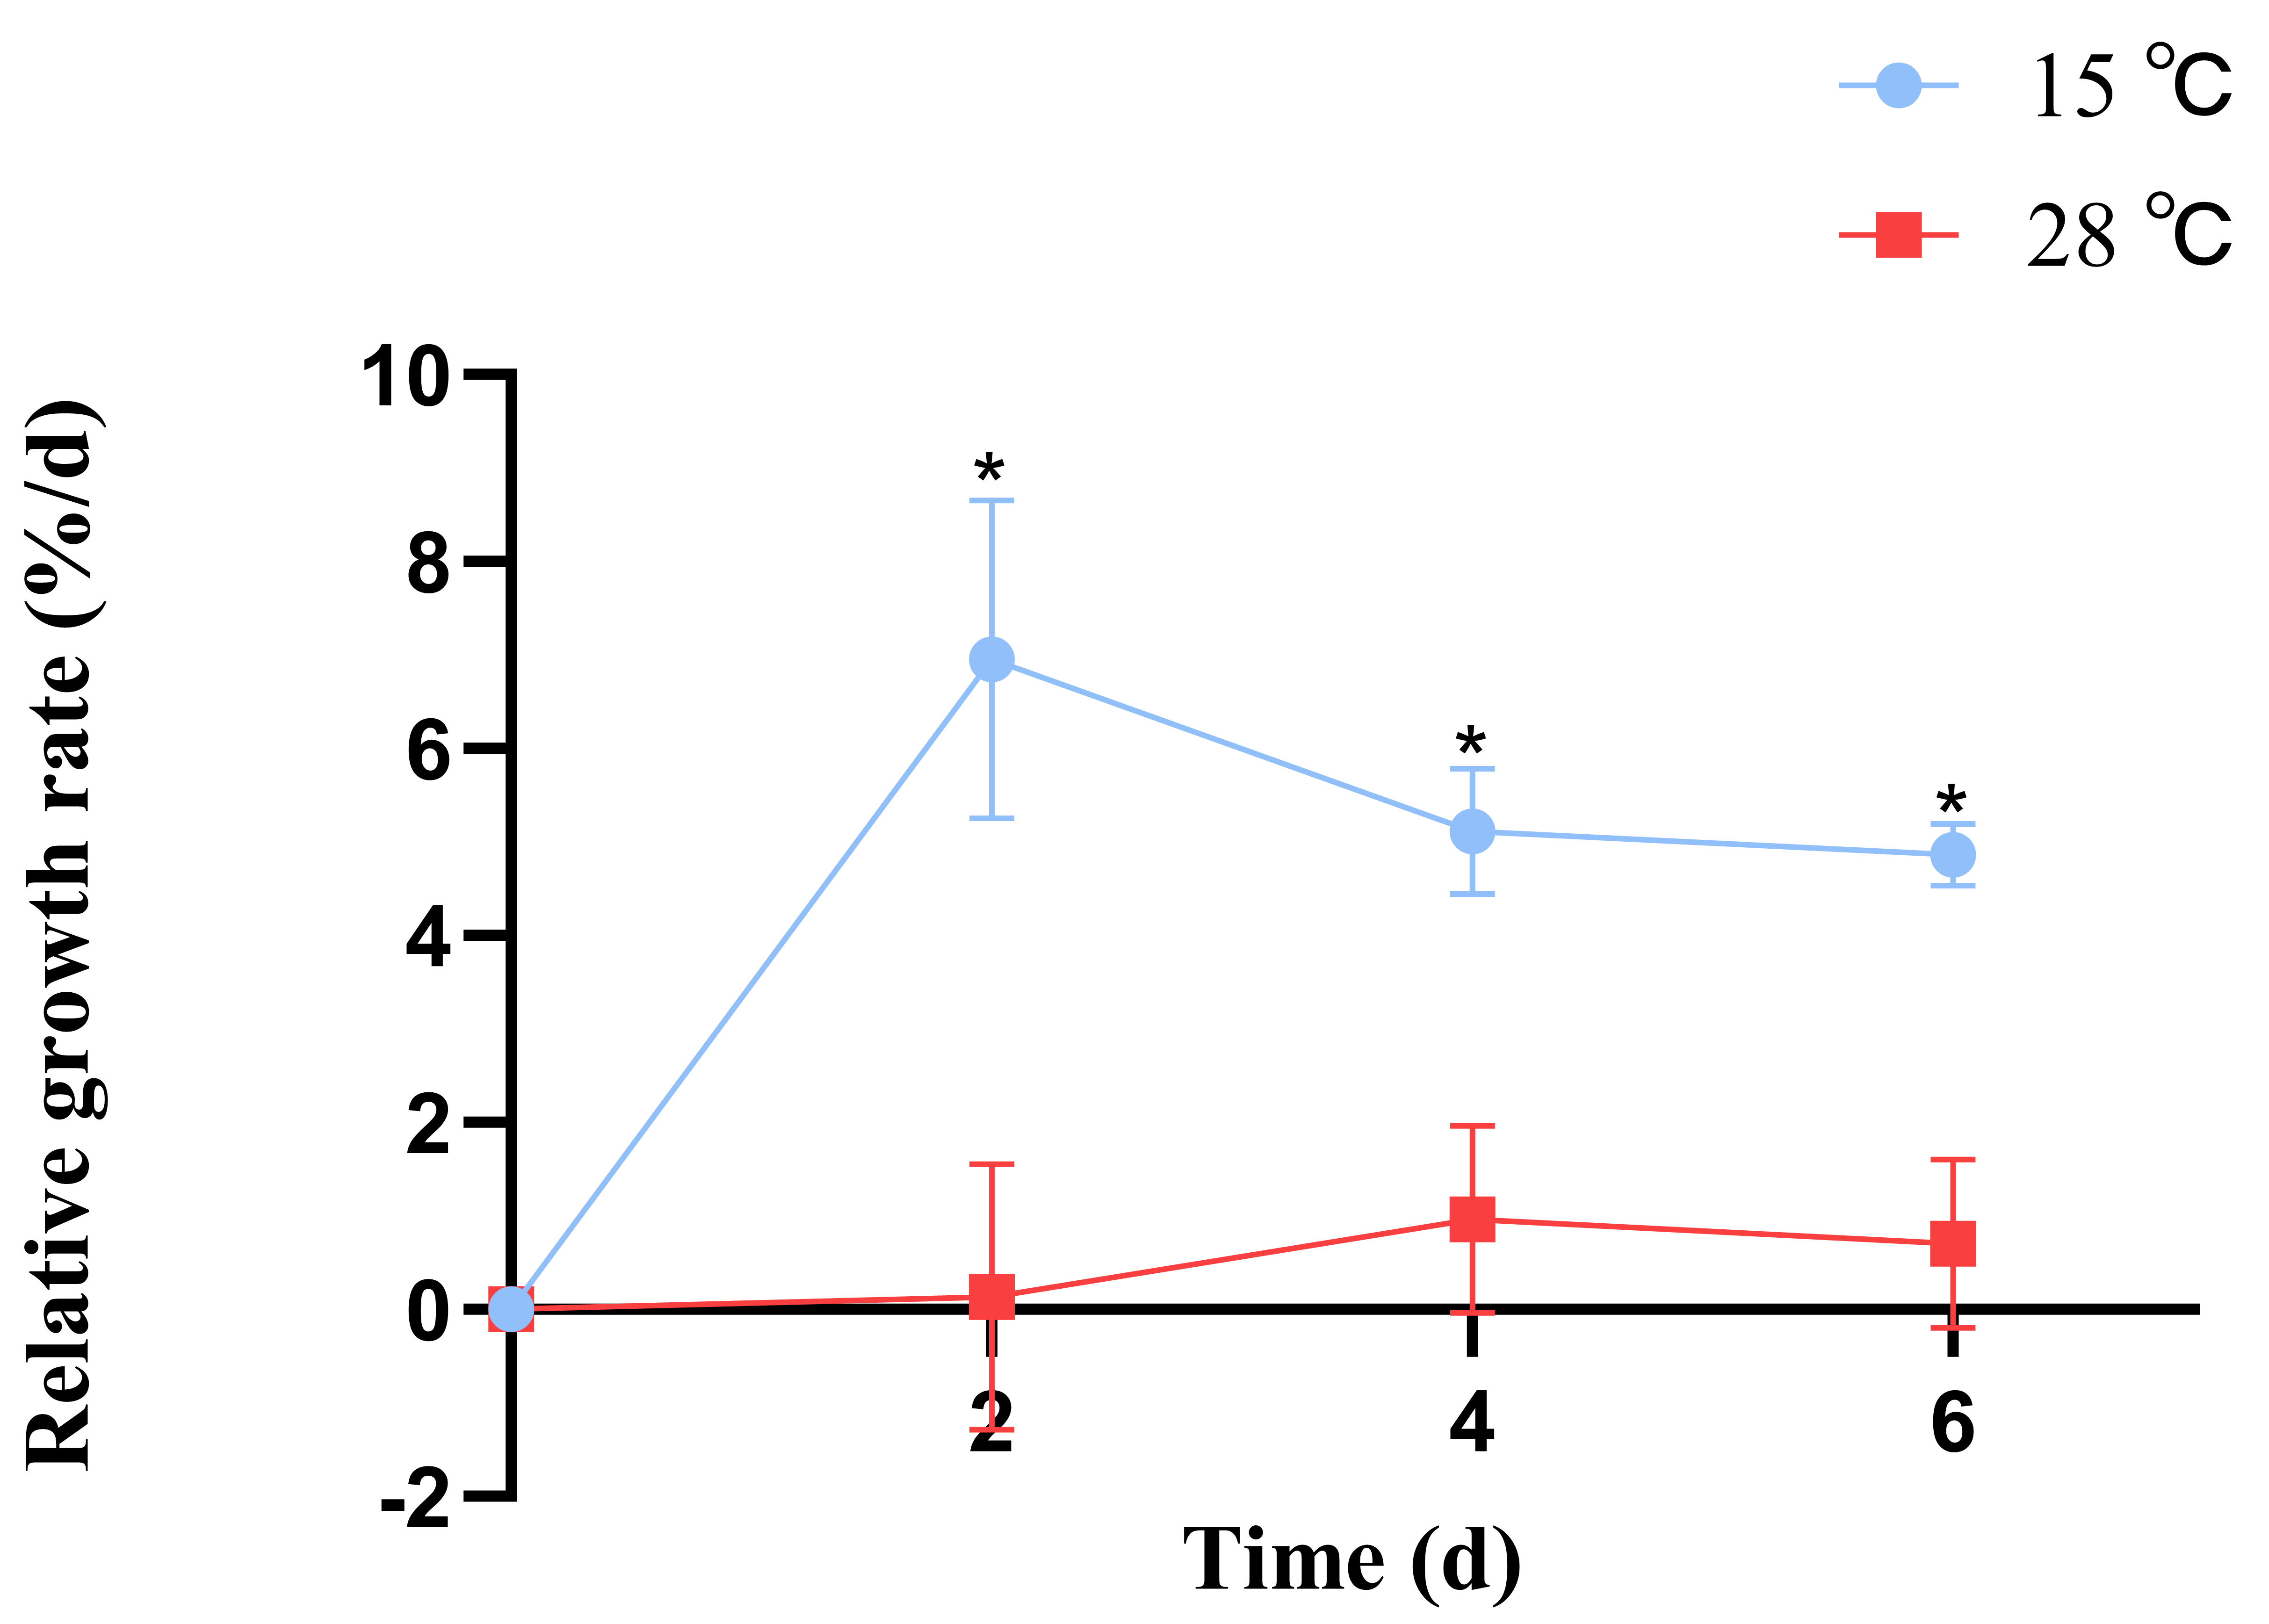
B. fuscopurpurea exhibited different relative growth rates when cultured at 15 °C and 28 °C; from day 1 to day 7, the growth rate at 15 °C was consistently higher than at 28 °C, with significant differences (p < 0.05). At 15 °C, the maximum relative growth rate (6.95%) was observed on day 2, whereas at 28 °C, the peak rate (0.96%) occurred on day 4. The average relative growth rate was 5.6% at 15 °C and 0.59% at 28 °C (Figure 1).
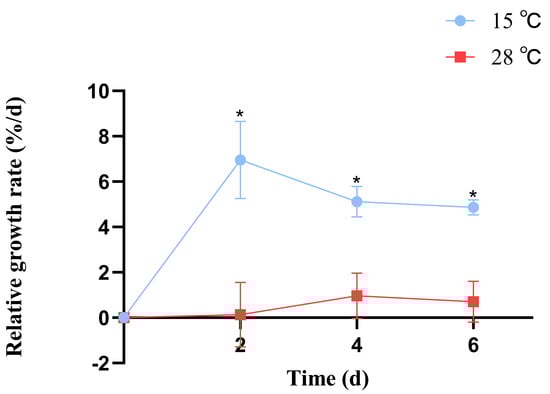
Figure 1.
The influence of different temperatures on the relative growth rate of B. fuscopurpurea. Note: * means that there is a significant difference between the 15 °C and 28 °C groups at the same time point; * means that there is a statistical difference at the p < 0.05 significance level.
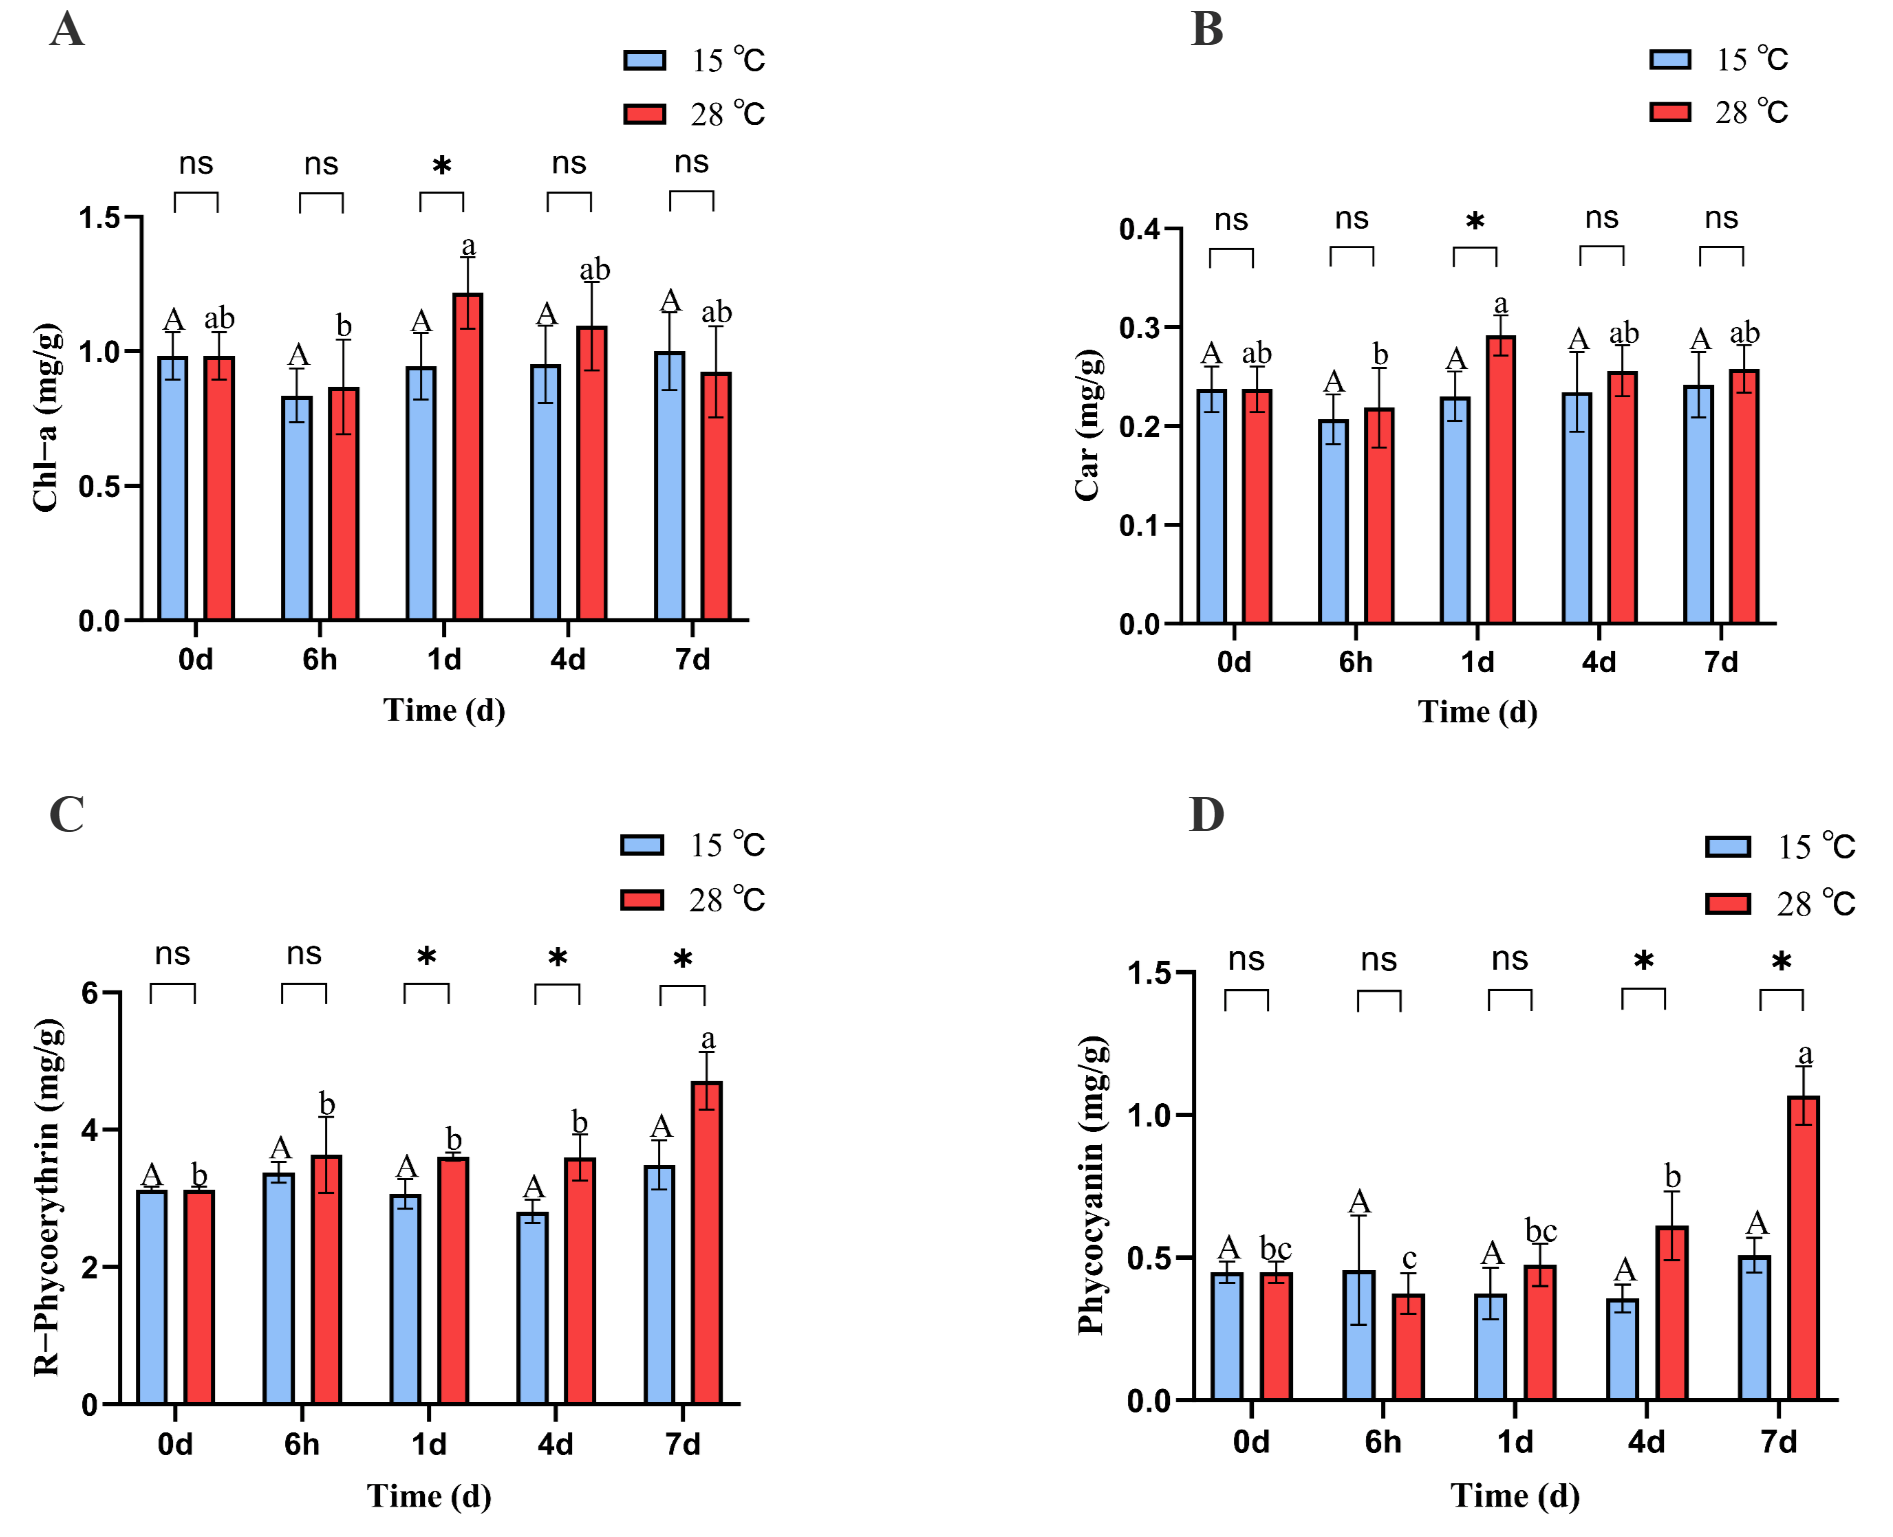
The chlorophyll a and carotenoid contents of B. fuscopurpurea at 15 °C did not change significantly over time; at 28 °C, the chlorophyll and carotenoid levels initially declined, then increased, and subsequently declined again, reaching their lowest values at 6 h (0.86 and 0.21) and highest values at 1 d (1.21 and 0.29). Moreover, on day 1, the chlorophyll a and carotenoid levels in the 28 °C treatment (1.21 and 0.29) were significantly higher than those in the 15 °C treatment (0.94 and 0.23) (p < 0.05) (Figure 2A,B).
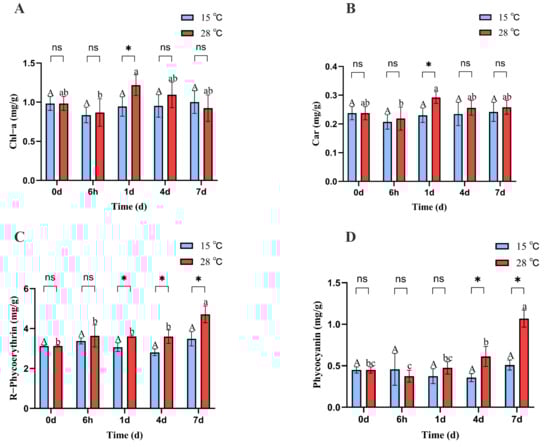
Figure 2.
Chl-a, Car, PC, and PE content of B. fuscopurpurea at different temperatures. Note: In the figure, A, B, C, D represent the content graphs of chlorophyll, carotenoids, phycocyanin, and phycobilin respectively. The capital letters A, B represent the significant differences in the 15 °C treatment group under different culture times; the lowercase letters a, b, and c represent the significant differences in the 28 °C treatment group under different culture times; ns indicates that there is no significant difference between the 15 °C treatment group and the 28 °C treatment group at the same time point; * represents that there are statistical differences between the 15 °C treatment group and the 28 °C treatment group at the significance level of p = 0.05 at the same time point.
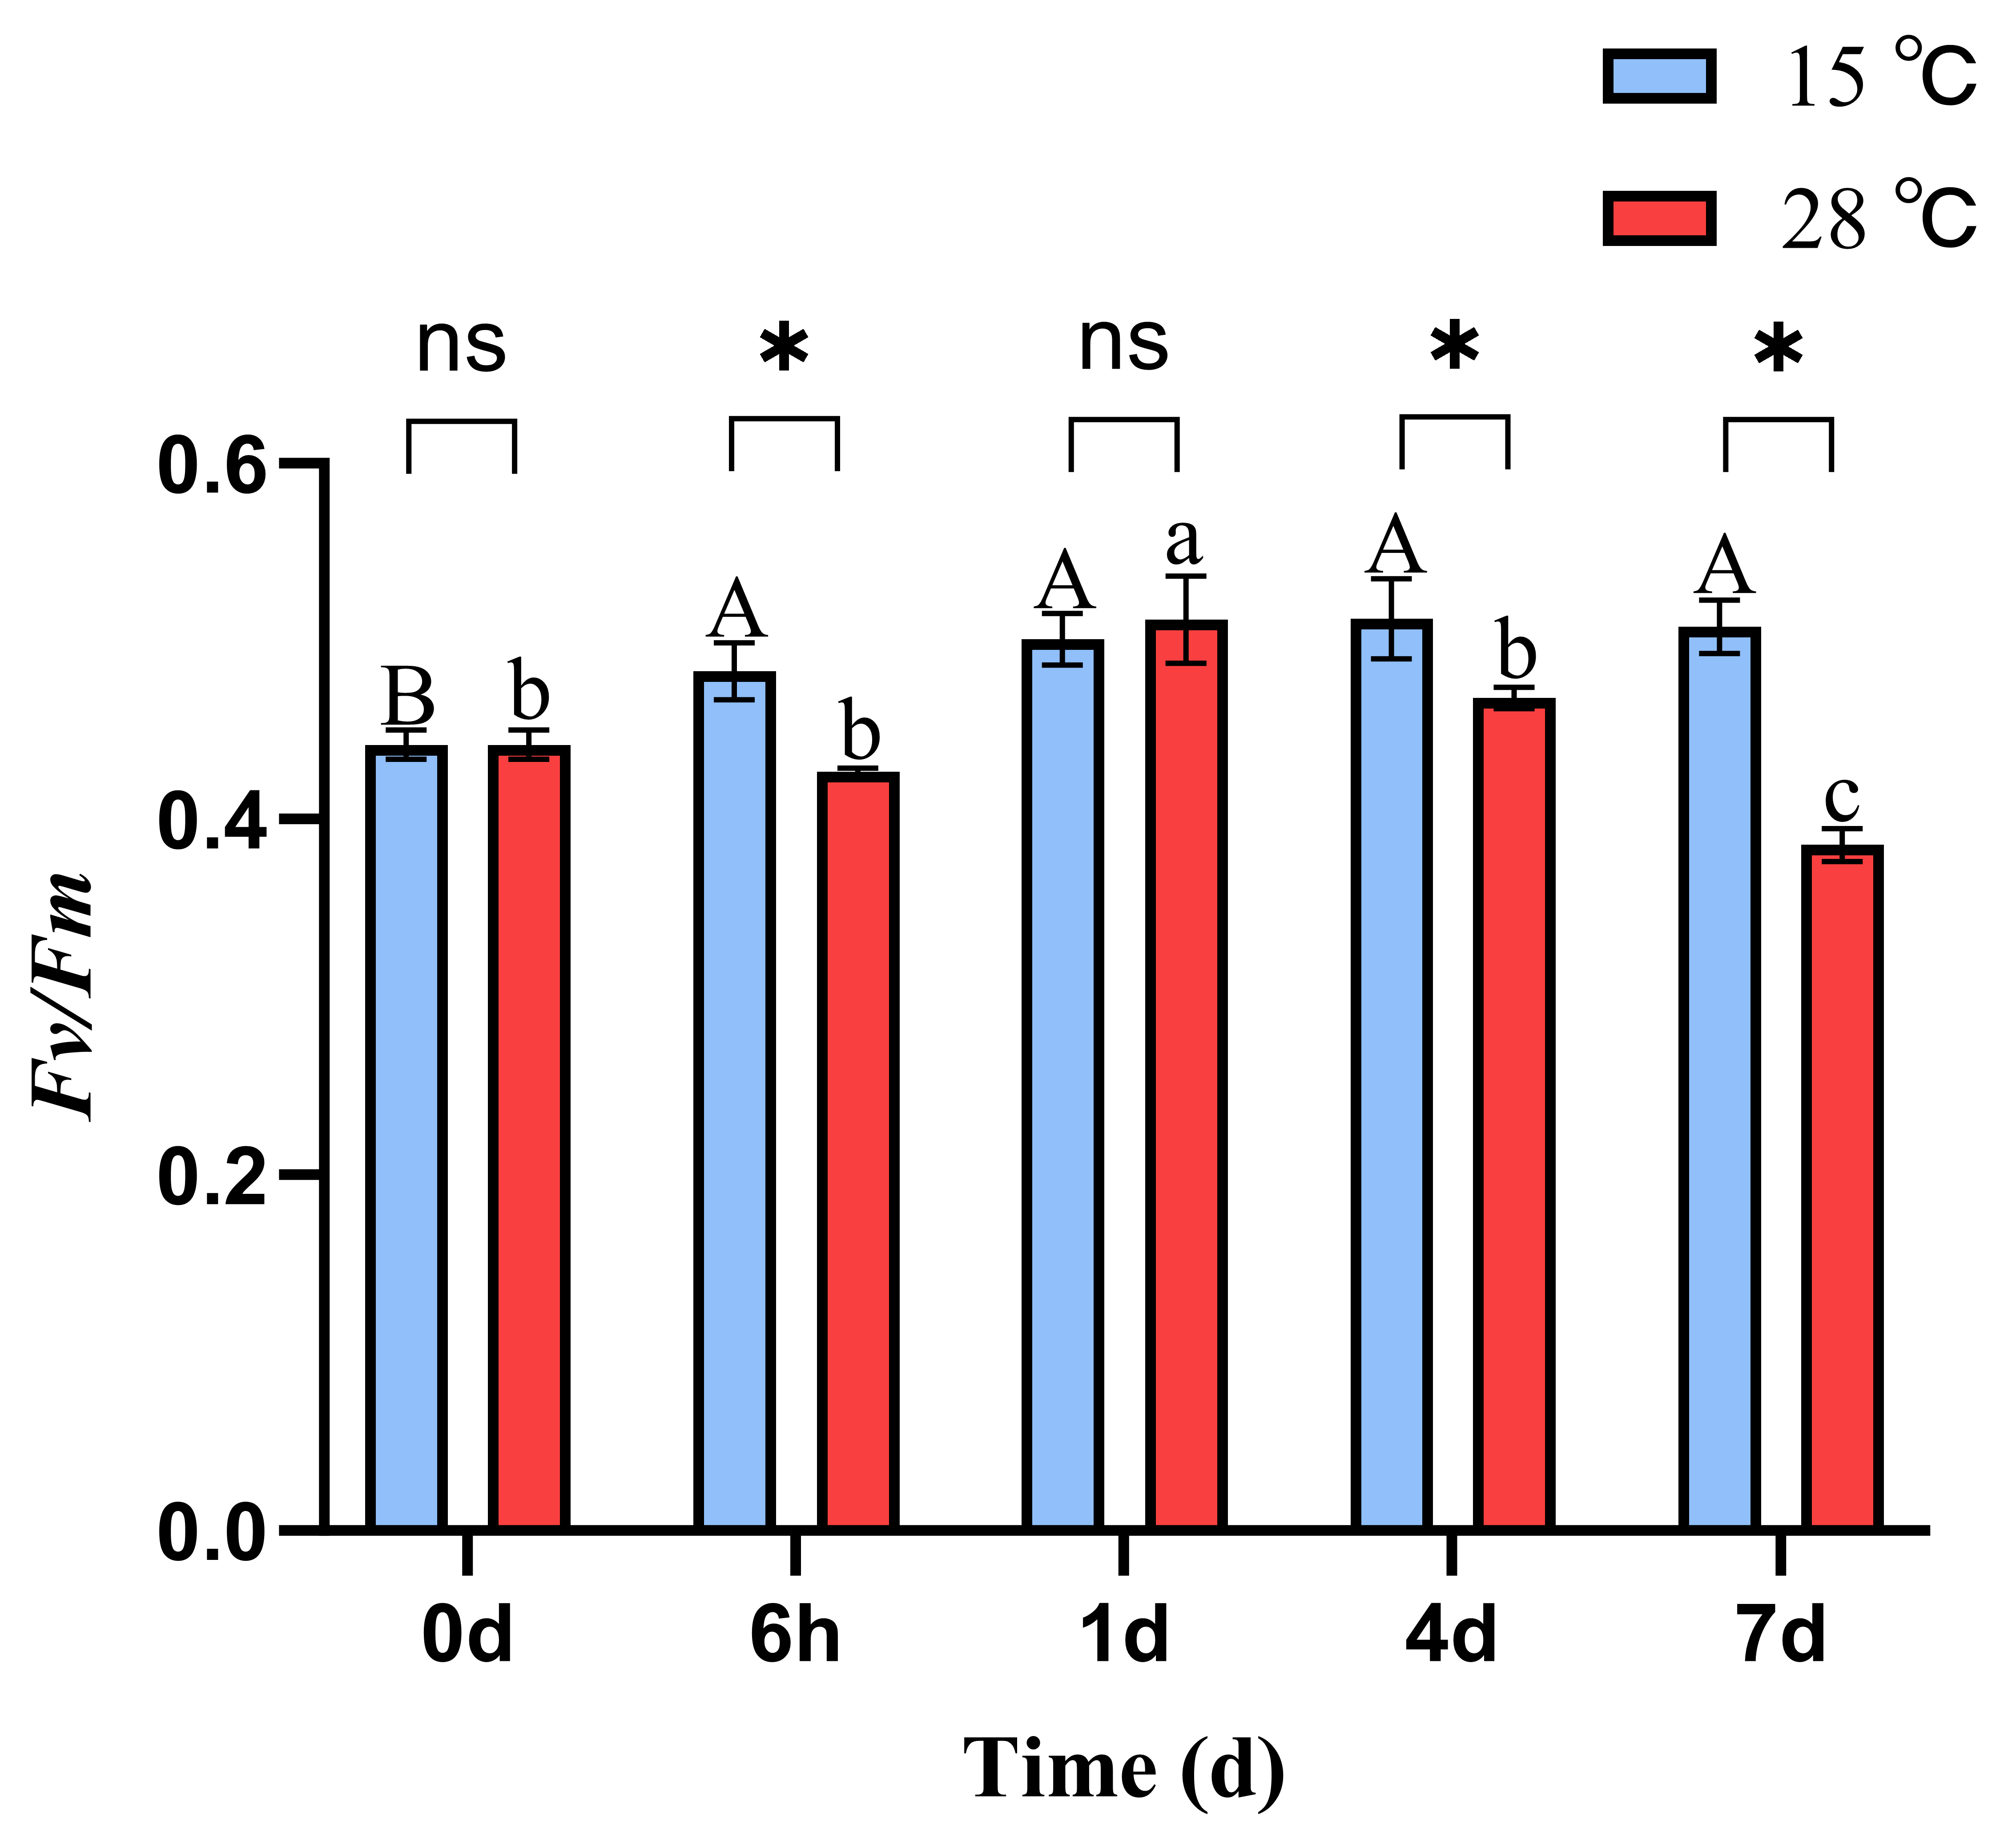
At 15 °C, the phycobiliprotein content in B. fuscopurpurea did not change significantly over time. At 28 °C, the phycobiliprotein content remained stable initially and then increased, with a significant rise from 3.59 on day 4 to 4.71 on day 7 (p < 0.05). Moreover, on days 1, 4, and 7, the phycobiliprotein contents at 28 °C (3.60, 3.59, 4.71) were significantly higher than those at 15 °C (3.06, 2.80, 3.48) (p < 0.05). Similarly, at 15 °C, the phycocyanin content in B. fuscopurpurea did not exhibit significant changes over time. At 28 °C, the phycocyanin content first decreased and then increased, with a significant rise from 0.37 at 6 h to 0.61 on day 4 (p < 0.05) and further to 1.06 on day 7 compared to 0.61 on day 4 (p < 0.05). Additionally, on days 4 and 7, the phycocyanin contents in the 28 °C group (0.61, 1.06) were significantly higher than those in the 15 °C group (0.35, 0.50) (p < 0.05) (Figure 2C,D). At 15 °C, the Fv/Fm of B. fuscopurpurea exhibited an initial increase followed by stabilization: at 6 h, the Fv/Fm (0.48) was significantly higher than at 0 d (0.44) (p < 0.05) and thereafter showed no significant change over time. At 28 °C, the Fv/Fm showed a rise-and-fall pattern: at 1 d (0.51), it was significantly higher than at 6 h (0.42) (p < 0.05), then declined significantly to 0.46 at 4 d compared to 1 d (0.51) and further to 0.38 at 7 d compared to 4 d (0.46) (p < 0.05). Moreover, at 28 °C, the Fv/Fm values at 6 h, 4 d, and 7 d were 0.42, 0.46, and 0.38, respectively, which were significantly lower than the corresponding values at 15 °C (0.48, 0.51, and 0.50) (Figure 3).
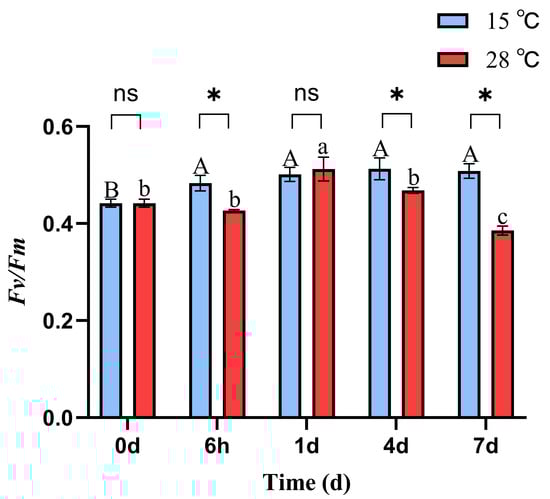
Figure 3.
Fv/Fm of B. fuscopurpurea at different temperatures. Note: The capital letters A, B represent the significant differences in the 15 °C treatment group under different culture times; the lowercase letters a, b, and c represent the significant differences in the 28 °C treatment group under different culture times; ns indicates that there is no significant difference between the 15 °C treatment group and the 28 °C treatment group at the same time point; * represents that there are statistical differences between the 15 °C treatment group and the 28 °C treatment group at the significance level of p = 0.05 at the same time point.
3.2. Data Quality
The transcriptome sequencing of twelve samples generated a total of 77.97 Gb of clean data, with each sample yielding at least 5.97 Gb and a Q30 base percentage of ≥85.50% (Supplementary Table S1). Assembly produced 47,609 unigenes in total. Of these, 6945 unigenes exceeded 1 kb in length. The functional annotation of the unigenes yielded annotations for 22,000 entries (Supplementary Table S2).
3.3. Gene Function Annotation
Currently, the whole-genome sequencing of B. fuscopurpurea remains incomplete; therefore, unigene sequences were compared against the NR, Swiss-Prot, COG, KOG, eggNOG4.5, and KEGG databases using DIAMOND (v2.0.4). KEGG Orthology assignments were obtained via KOBAS (v2.0), and GO Orthology annotations were derived by analyzing predicted gene sequences with InterProScan (5.34-73.0) against the integrated InterPro database. Following amino acid prediction, HMMER (v3.1b2) searches against the Pfam database were performed to retrieve comprehensive unigene annotation information. By applying BLAST with an E-value cutoff of ≤1 × 10⁻⁵ and HMMER with an E-value threshold of ≤1 × 10⁻¹⁰, this study ultimately obtained annotation information for 22,000 unigenes.
In the NR database, the top match was Porphyra umbilicalis (54.87%), which, like B. fuscopurpurea, belongs to the Bangiaceae family, consistent with their taxonomic relationship (Supplementary Figure S2). A total of 7701 genes were annotated in the COG database and grouped into 25 functional categories: the largest was “Translation, ribosomal structure and biogenesis” (1172), followed by “Posttranslational modification, protein turnover, and chaperones” (880), and the smallest was “RNA processing and modification” (3) (Supplementary Figure S3). The GO database annotated 14,577 genes, which were distributed among three main categories: Cellular Component, Molecular Function, and Biological Process. Within the Cellular Component category, the largest term was “cellular anatomical entity,” followed by “intracellular” and then “protein complex.” In the Molecular Function category, “binding” was predominant, followed by “catalytic activity” and then “structural molecule activity.” In Biological Process, “cellular process” was the most represented, followed by “metabolic process” and then “biological regulation” (Supplementary Figure S4). The number of genes annotated across all databases was 3397 (Supplementary Figure S5).
3.4. Differential Gene Analysis
3.4.1. Overview of Differentially Expressed Genes
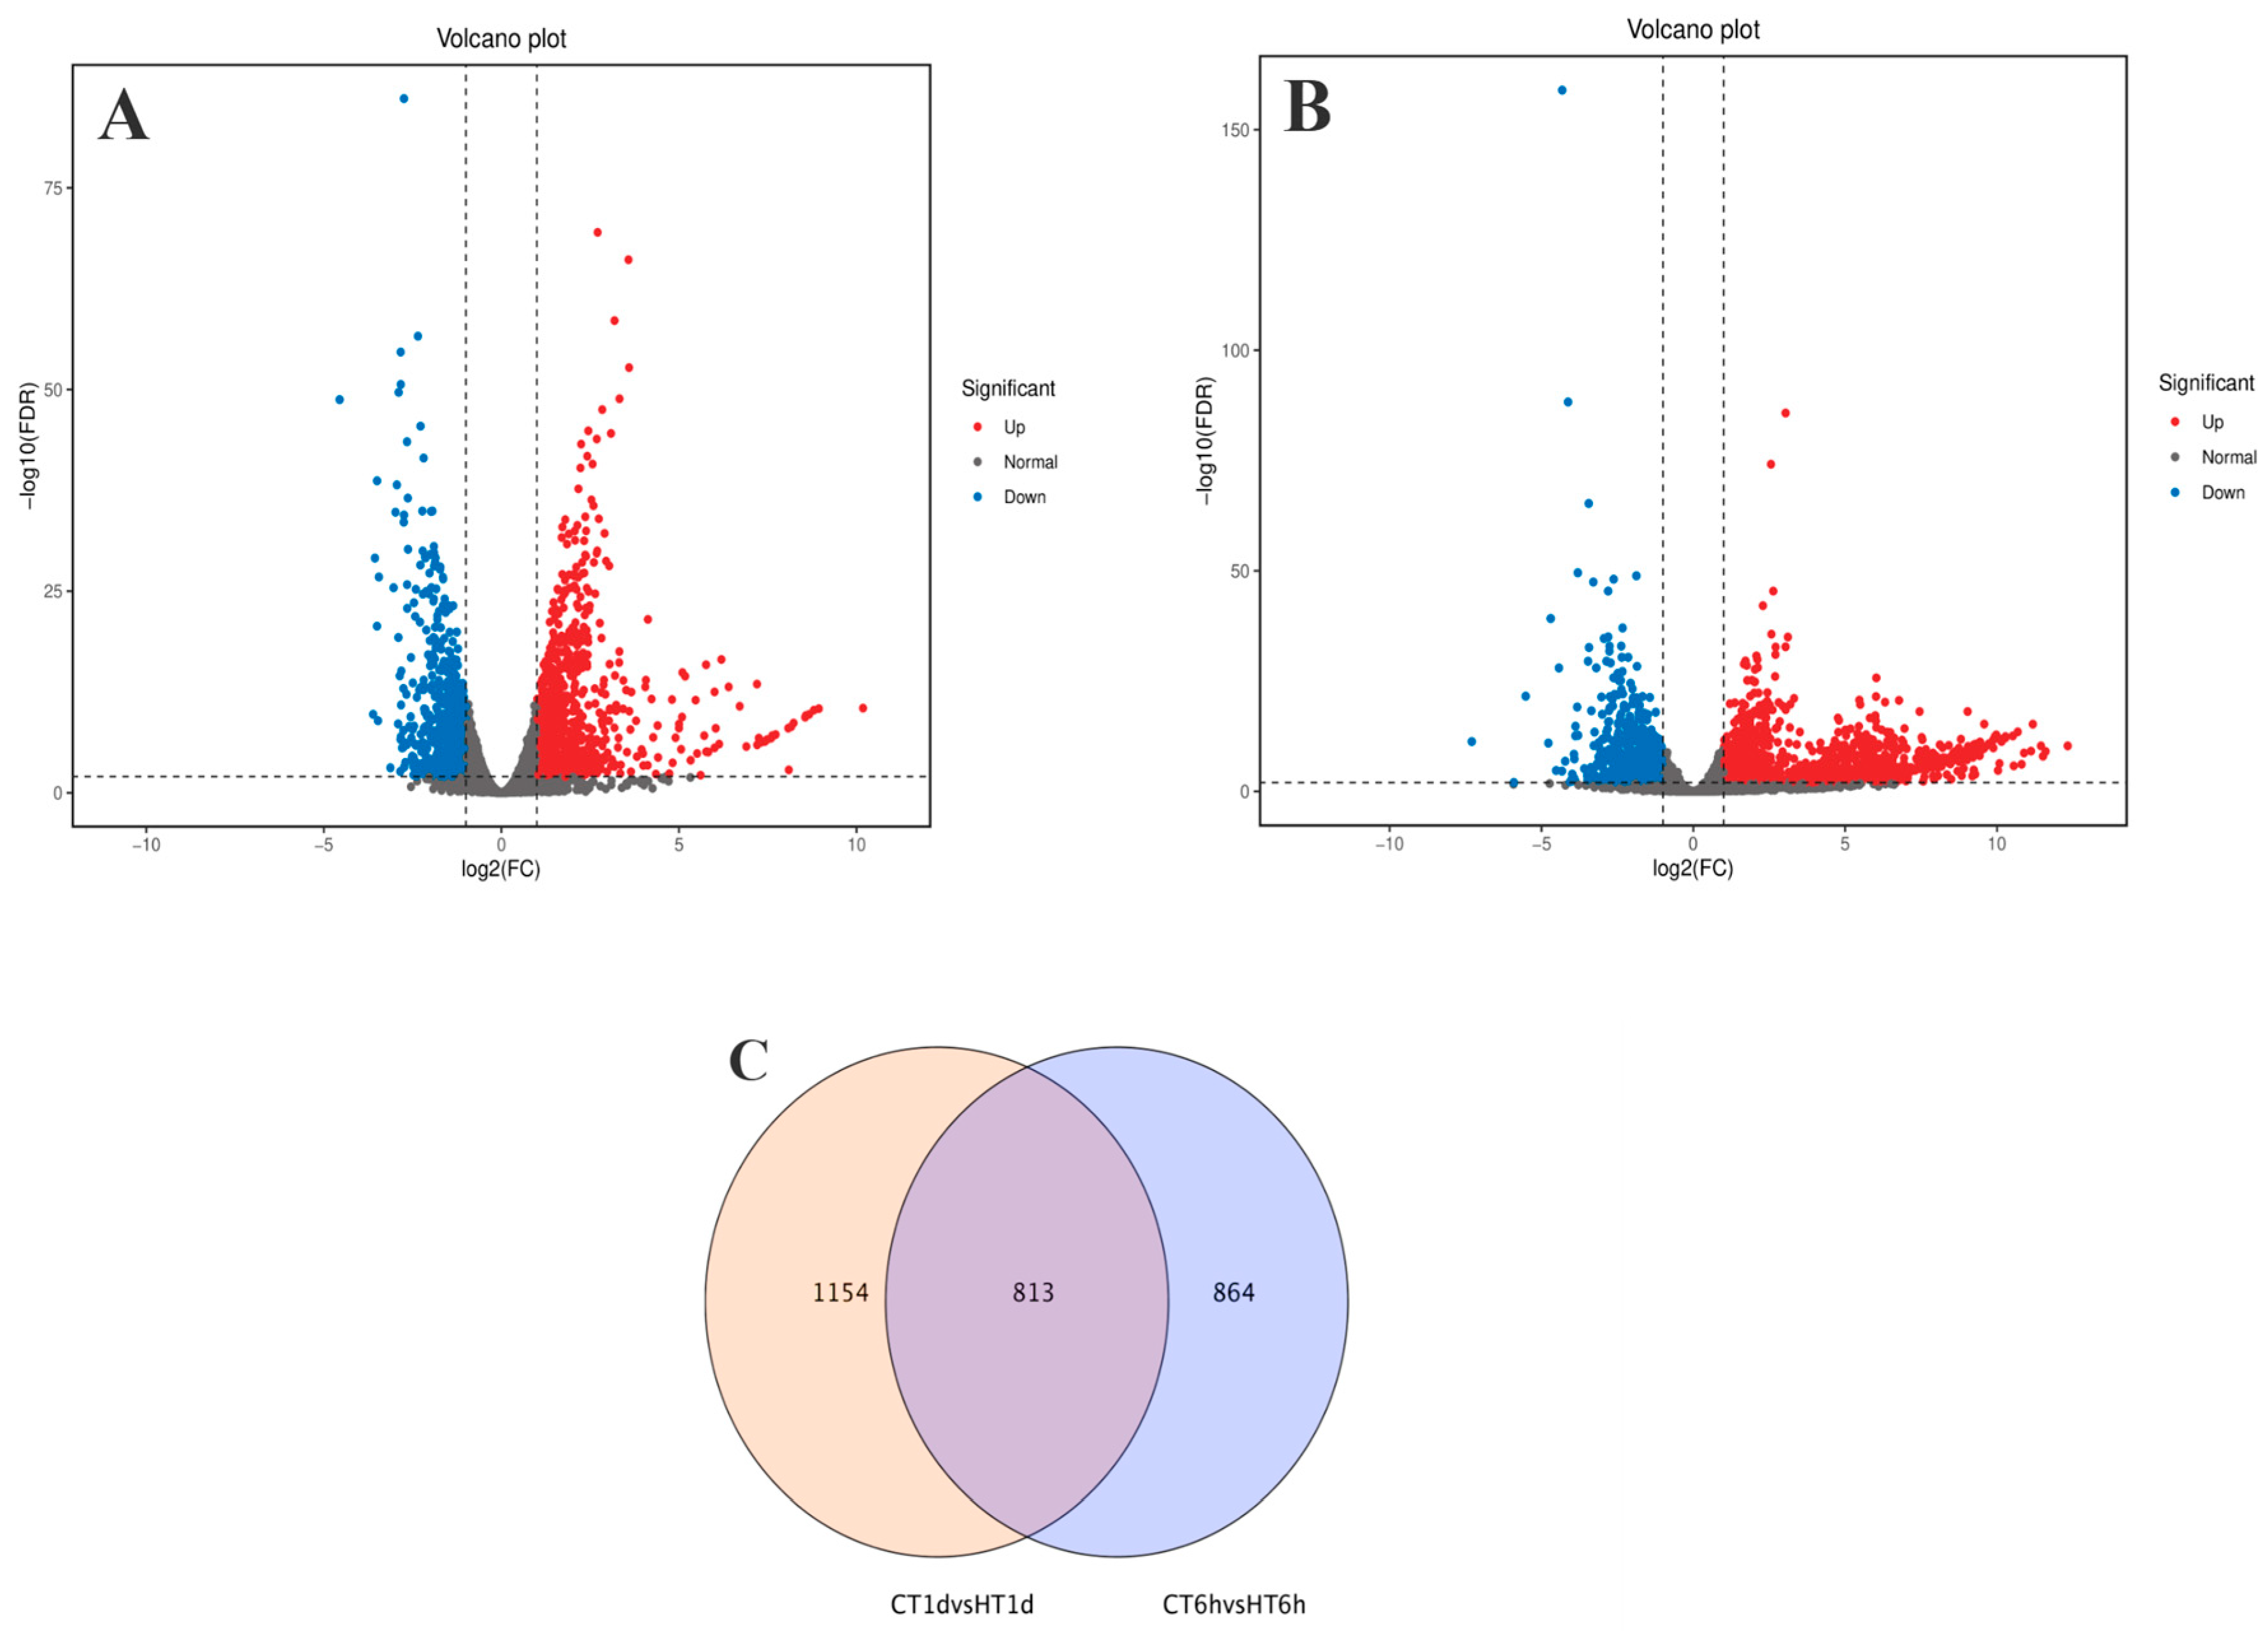
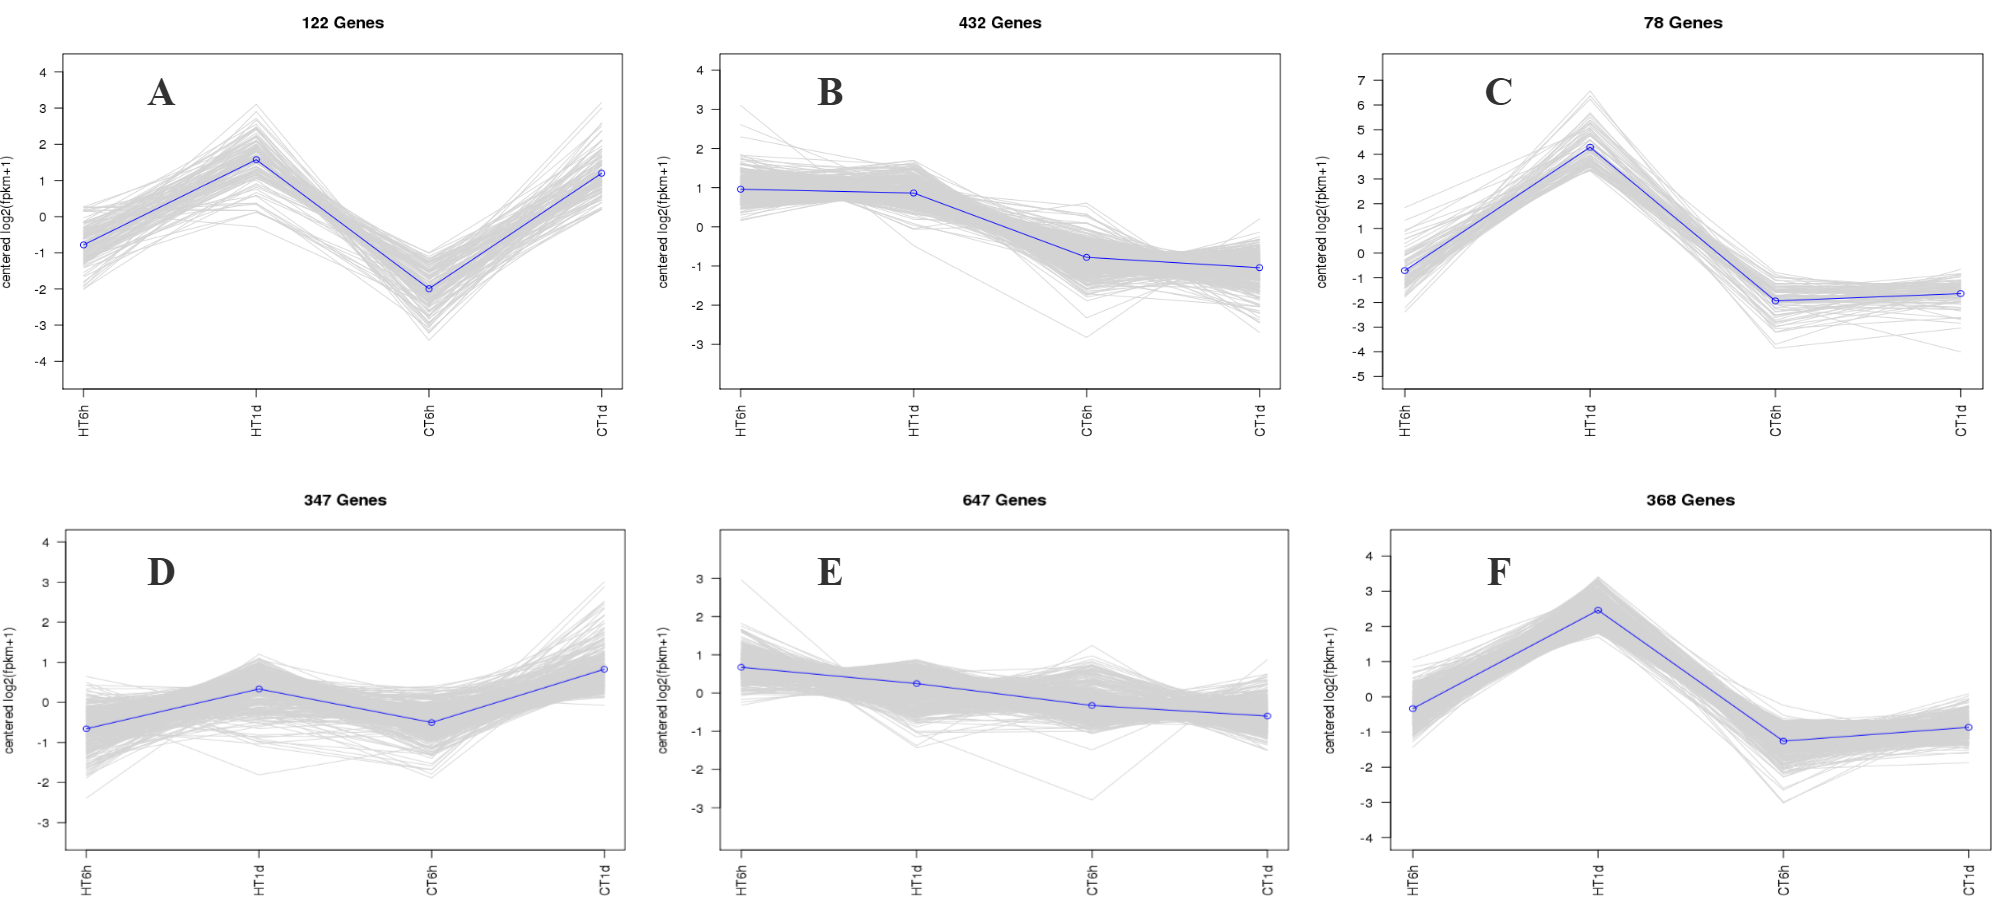
Using log2(FC) ≥ 2 and FDR < 0.01 as thresholds for differential gene screening, two comparisons were established, CT-6 h vs. HT-6 h and CT-1 d vs. HT-1 d, to investigate temporal changes in gene expression under heat stress. A total of 3644 DEGs were identified across time points: 1677 DEGs (979 up-regulated and 698 down-regulated) in CT-6 h vs. HT-6 h and 1967 DEGs (1261 up-regulated and 706 down-regulated) in CT-1 d vs. HT-1 d (Figure 4A,B). Among these, 813 DEGs were modulated by heat treatment at both 6 h and 1 d (Figure 4C). In addition, the trend analysis of DEG expression over time under heat stress in B. fuscopurpurea yielded eight clustered expression profiles (Figure 5). Profiles A and D (122 and 347 DEGs, respectively) showed expression up-regulation over time at both control and elevated temperatures. Clusters B and E (432 and 647 DEGs, respectively) were characterized by high expression under heat stress and low expression at the control temperature. Clusters C and F (78 and 368 DEGs, respectively) displayed increasing expression over time under heat stress, with minimal change at the control temperature.
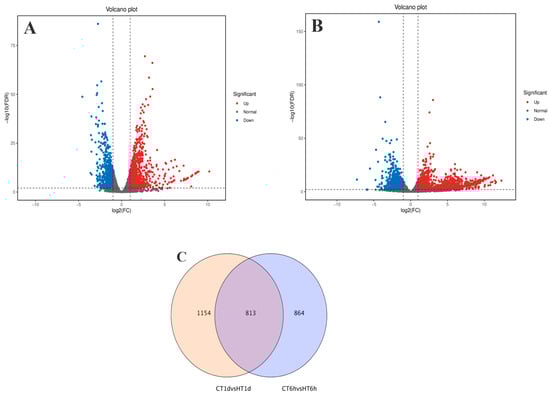
Figure 4.
Analysis results of differentially expressed genes between the control group and the high-temperature group (pairwise comparison). Note: (A,B) are volcano plots of differentially expressed genes in CT group at 6 h compared with HT group at 6 h and CT group at 1 d compared with HT group at 1 d, respectively. The red part represents the number of up-regulated genes, and the blue part represents the number of down-regulated genes. (C) is a Venn diagram drawn based on the results of differential expression analysis. The overlapping part refers to the differentially expressed genes that are enriched in both comparison groups. The non-overlapping part refers to the differentially expressed genes that are enriched in each individual group.
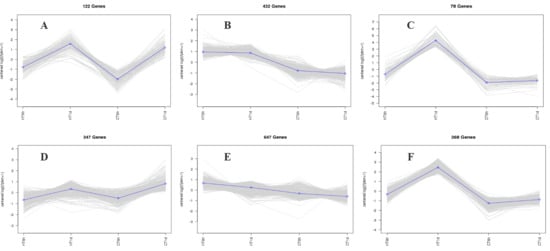
Figure 5.
Cluster trend profile chart. Note: The trend clustering curve graph showing similar expression trends for the selected stones (A–F) in the figure. In this cluster trend profile, the horizontal axis represents different sample treatment groups, and the vertical axis represents the expression trend of the differentially expressed genes that have been enriched. Positive values indicate an upward trend in expression, while negative values indicate a downward trend in expression.
3.4.2. Analysis of Differentially Expressed Genes Using GO and KEGG Databases
GO and KEGG functional annotations were performed for the DEGs. GO classification revealed that DEGs are involved in three categories, Biological Process, Molecular Function, and Cellular Component, and in both CT-6 h vs. HT-6 h and CT-1 d vs. HT-1 d comparisons, most genes were specifically assigned to metabolic processes, cellular processes, and biological regulation (Supplementary Figure S6). KEGG enrichment analysis showed that at 6 h DEGs were primarily enriched in carbon metabolism, amino acid biosynthesis, and protein processing in the endoplasmic reticulum; at 1 d, they were mainly enriched in ribosome, carbon metabolism, and amino acid biosynthesis (Supplementary Figure S7 and Table 1).

Table 1.
Significantly enriched KEGG pathways in CT_6_h vs. HT6h and CT_1_d vs. HT_1_d.
3.4.3. KEGG Differential Expression Pathway Analysis
Based on the KEGG enrichment of DEGs, eight pathways related to energy, carbohydrate, and lipid metabolism were selected to examine the temporal gene expression in B. fuscopurpurea under heat stress: photosynthesis (ko00195), photosynthesis antenna proteins (ko00196), carbon fixation in photosynthetic organisms (ko00710), glycolysis/gluconeogenesis (ko00010), the pentose phosphate pathway (ko00030), the Citrate cycle (ko00020), glycerophospholipid metabolism (ko00564), and glutathione metabolism (ko00480). The full gene names used in all heatmaps of DEGs are provided in Supplementary Table S3.
Photosynthesis Pathway
Comparative transcriptome analysis identified 13 DEGs involved in photosynthesis, participating in the assembly of PSII (PsbA, PsbC, PsbM, PsbO, PsbP, PsbQ, PsbS, PsbU), PSI (PsaO), the cytochrome b6/f complex (PetC), and photosynthetic electron transport (PetF, PetH) (Figure 6). All of these DEGs were significantly up-regulated at both 6 h and 1 d, with the two down-regulated genes (PsbA, PsbC) being enriched at 1 d. In addition, five DEGs related to light-harvesting antenna proteins were identified, involved in the synthesis of the allophycocyanin β subunit (ApcB), phycobilisome linker protein (ApcC), phycocyanin rod-linker protein (CpcC), phycobilin lyase α subunit (CpcE), and photosystem I light-harvesting complex (Lhca1). All of these antenna-related DEGs were significantly up-regulated at both 6 h and 1 d, with the single down-regulated gene (ApcB) enriched at 1 d.
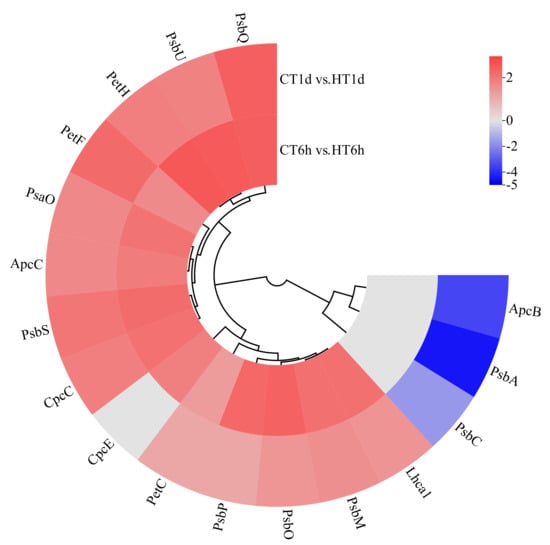
Figure 6.
Cluster heatmap of differentially expressed genes in photosynthesis. Note: The logarithmic values of fold change (Log2FC) of expression levels among the sample groups are shown in the legend, where red indicates significant up-regulation, blue indicates significant down-regulation, and gray indicates no significant difference.

Carbohydrate Synthesis and Energy Metabolism Pathways
Transcriptome analysis revealed that DEGs are significantly enriched in pathways related to carbon and energy metabolism and play roles in the temporal response of B. fuscopurpurea to heat stress. In our findings, the Calvin cycle was significantly enriched with 10 DEGs: SBPase was uniquely up-regulated at 6 h; RpiA, TK, TPI, and MDH2 were exclusively up-regulated at 1 d; RbcL was down-regulated at 1 d; and ALDO, FBP, PrkB, and RPE were significantly up-regulated at both time points (Figure 7A). The Calvin cycle intermediates glyceraldehyde-3-phosphate and dihydroxyacetone phosphate can funnel into glycolysis/gluconeogenesis for sucrose and starch synthesis, enter the tricarboxylic acid cycle to generate energy, or flow into the pentose phosphate pathway to produce NADPH. In this study, glycolysis/gluconeogenesis was significantly enriched with nine DEGs. TPI, FrmA, and ADH were exclusively up-regulated at 1 d; PK was significantly down-regulated at both time points; and FBP, Pgm, ALDO, PdhD, and G6PE were significantly up-regulated at both 6 h and 1 d (Figure 7B). The pentose phosphate pathway was significantly enriched with nine DEGs: PGD was down-regulated solely at 6 h; RpiA, G6PD, PGLS, and TK were up-regulated at both time points; and ALDO, FBP, Pgm, and RPE were significantly up-regulated at both 6 h and 1 d (Figure 7C). The TCA cycle was significantly enriched with seven DEGs: SucA was exclusively up-regulated at 6 h; CS, ACO, FumC, and MDH2 were up-regulated exclusively at 1 d; SucB was down-regulated at 1 d; and PdhD was significantly up-regulated at both time points (Figure 7D).
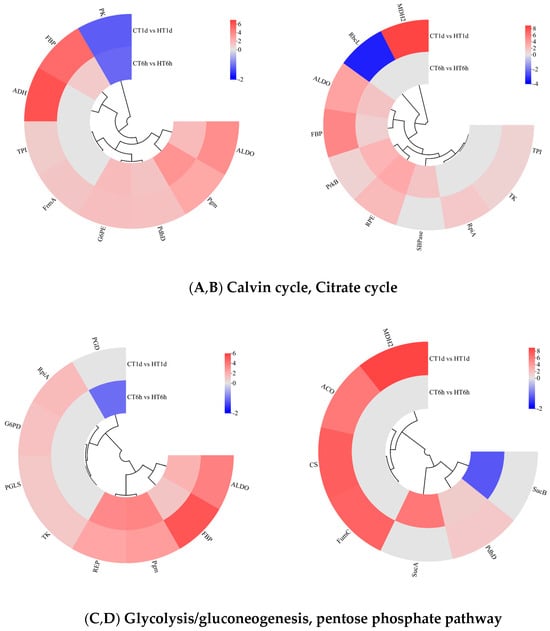
Figure 7.
Cluster heatmap of differentially expressed genes in Calvin cycle, Citrate cycle, glycolysis/gluconeogenesis, and pentose phosphate pathway. Note: In the figure, A, B, C, and D represent the cluster heatmaps of the Calvin cycle, Citrate cycle, glycolysis/gluconeogenesis, and pentose phosphate pathway.The logarithmic values of fold change (Log2FC) of expression levels among the sample groups are shown in the legend, where red indicates significant up-regulation, blue indicates significant down-regulation, and gray indicates no significant difference.
Glycerophospholipid Metabolism Pathway
Transcriptome analysis revealed the enrichment of eight DEGs involved in glycerophospholipid metabolism, encoding enzymes for glycerol-3-phosphate dehydrogenase (GPD1), another glycerol-3-phosphate dehydrogenase isoform (GlpA), diacylglycerol kinase (DgkA), acylglycerophosphate acyltransferase 8 (AGPAT8), phosphatidylethanolamine N-methyltransferase (PEMT), ethanolamine-phosphate transferase (EPT1), cytidine diphosphate–ethanolamine synthase (PCYT2), and phosphatidylserine decarboxylase (PSD). Specifically, GPD1 and GlpA were exclusively down-regulated at 6 h; PSD and PCYT2 showed exclusive up-regulation at 1 d; AGPAT8, DgkA, and EPT1 were significantly up-regulated at both time points; and PEMT exhibited down-regulation at 6 h followed by up-regulation at 1 d (Figure 8).
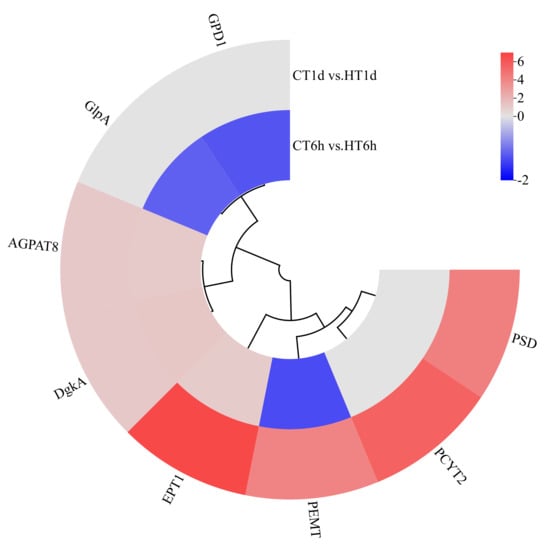
Figure 8.
Cluster heatmap of differentially expressed genes in glycerophospholipid metabolism pathway. Note: The logarithmic values of fold change (Log2FC) of expression levels among the sample groups are shown in the legend, where red indicates significant up-regulation, blue indicates significant down-regulation, and gray indicates no significant difference.
Glutathione Metabolism Pathway
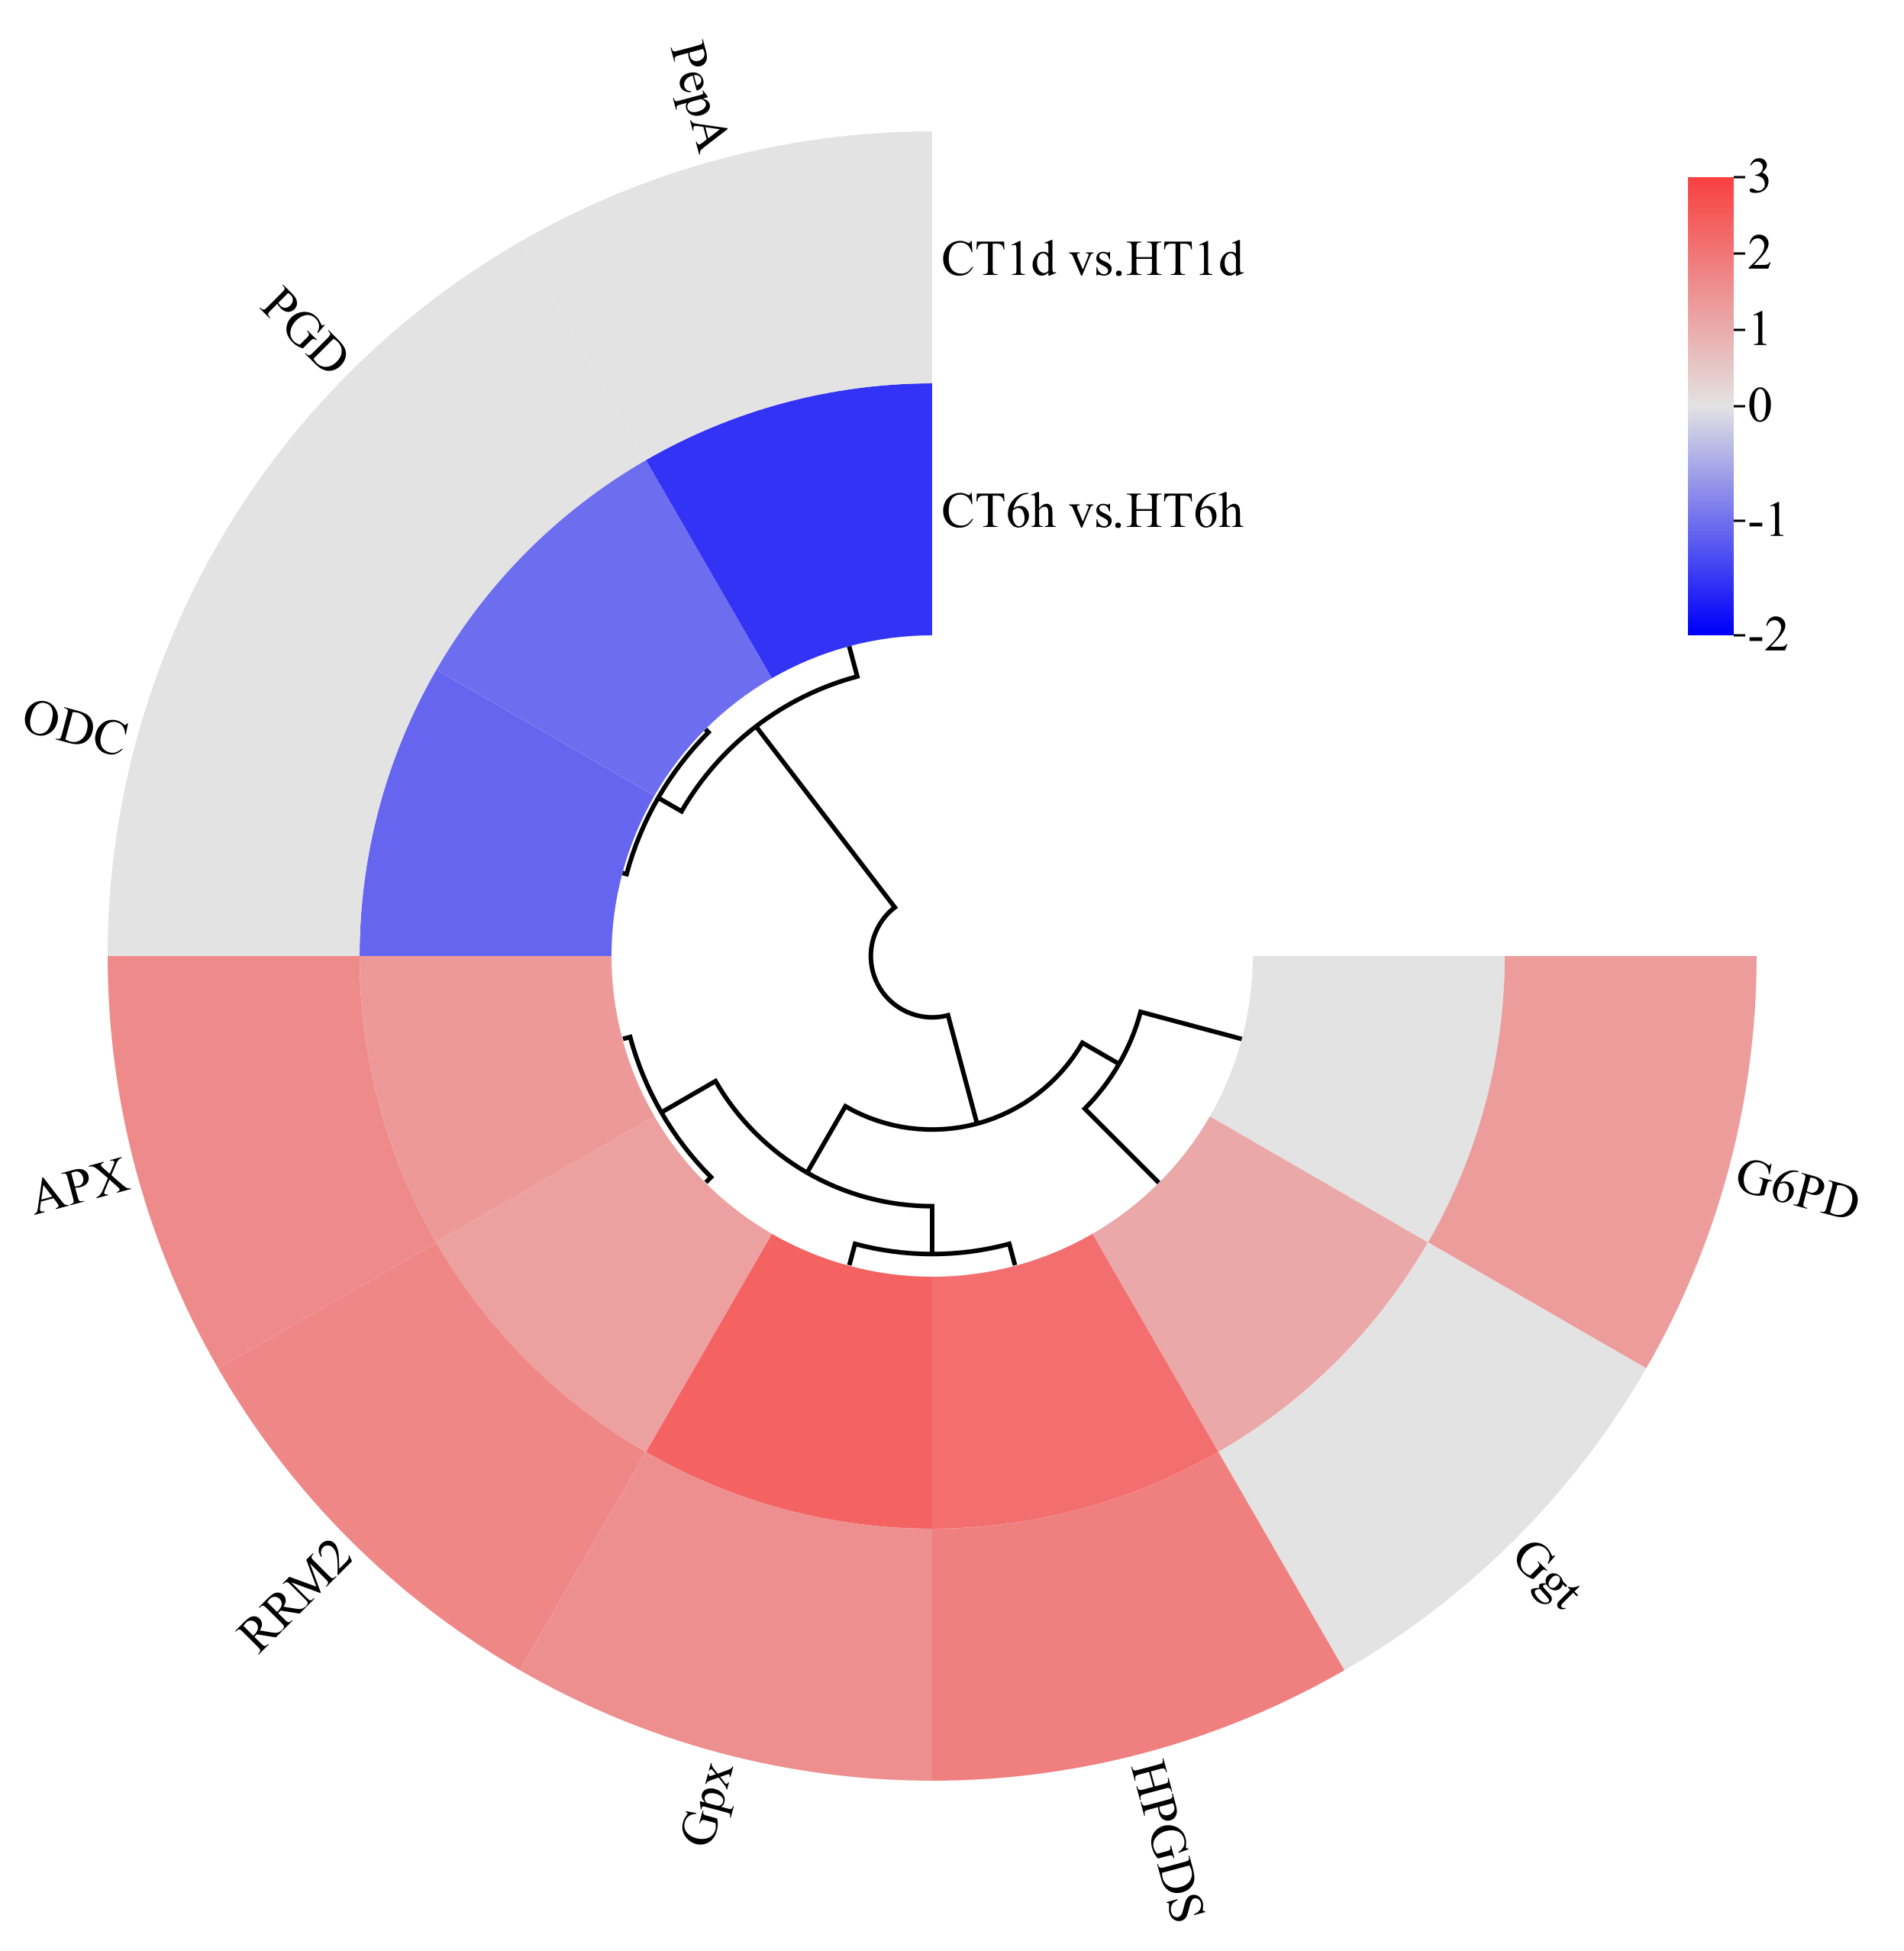
Transcriptome analysis revealed that heat stress induced the differential expression of nine DEGs involved in the glutathione cycle, encoding enzymes such as leucine aminopeptidase (PepA), γ-glutamyl transpeptidase (Ggt), 6-phosphogluconate dehydrogenase (PGD), glutathione peroxidase (Gpx), ornithine decarboxylase (ODC), glutathione S-transferase (HPGDS), glucose-6-phosphate dehydrogenase (G6PD), L-ascorbate peroxidase (APX), and ribonucleotide reductase subunit M2 (RRM2). Among these, Ggt was uniquely up-regulated at 6 h; PepA, PGD, and ODC were exclusively down-regulated at 6 h; G6PD was specifically up-regulated at 1 d; and HPGDS, Gpx, RRM2, and APX were significantly up-regulated at both time points (Figure 9).

Figure 9.
Cluster heatmap of differentially expressed genes in glutathione cycle pathway. Note: The logarithmic values of fold change (Log2FC) of expression levels among the sample groups are shown in the legend, where red indicates significant up-regulation, blue indicates significant down-regulation, and gray indicates no significant difference.
4. Discussion
As global warming intensifies, large-scale economically cultivated macroalgae are inevitably subjected to the adverse effects of elevated temperatures. Our results demonstrate that B. fuscopurpurea grows more favorably at 15 °C compared to at 28 °C. Short-term heat exposure (1 day) significantly increased the chlorophyll a and carotenoid contents while markedly reducing the Fv/Fm. Transcriptomic analysis uncovered the molecular mechanisms underlying heat tolerance in this alga. RNA-seq data indicate that these responses involve the regulation of carbohydrate metabolism, photosynthesis, glycerophospholipid metabolism, and the glutathione cycle.
4.1. The Influence of Temperature on Photosynthetic Pigments and Fluorescence Parameters
Photosynthesis and respiration in macroalgae are temperature-dependent, and fluctuations in temperature can alter algal growth performance [21]. Different algal taxa exhibit variable tolerance to temperature shifts, and the growth rate serves as a key metric that directly reflects their physiological condition [22]. Under heat stress, the Atlantic brown alga Fucus vesiculosus exhibited a 65% reduction in growth rate at 26 °C compared to at 12 °C [23]. Similarly, in our study, Bangia fuscopurpurea cultured at 28 °C displayed a significantly suppressed relative growth rate compared to that cultured at 15 °C. Chlorophyll a, the principal light-harvesting pigment, directly determines photosynthetic capacity and indirectly influences the growth rate; carotenoids protect chlorophyll from photodamage, and phycobiliproteins capture and transfer light energy to chlorophyll, all playing crucial roles in photosynthesis [24]. Studies have shown that under heat stress, Ulva prolifera attains peak chlorophyll a content after 4 days of cultivation [25]. Likewise, Gracilaria blodgettii shows significant increases in chlorophyll a and carotenoid levels under elevated temperatures, which then decline as the temperature rises further [26]. Phycoerythrin (PE), a major light-harvesting pigment found in red algae and cyanobacteria [27], also exhibits potent antioxidant activity by scavenging reactive oxygen species and alleviating oxidative stress [28]. In prolonged-heat-stress experiments with Neopyropia yezoensis, both the phycoerythrin and phycocyanin contents were found to increase significantly [29]. Data analysis revealed that in the 28 °C treatment, the chlorophyll a and carotenoid levels in B. fuscopurpurea decreased at 6 h and rose at 1 day (p < 0.05), while phycoerythrin and phycocyanin exhibited a progressive increase, significantly peaking on day 7 (p < 0.05), consistent with previous studies. Photosystem II (PSII) is regarded as one of the most temperature-sensitive components of the photosynthetic apparatus [30,31]. The Fv/Fm ratio represents the maximum quantum yield of PSII, reflecting the alga’s maximal photosynthetic efficiency and indirectly indicating its growth status [7]. Studies have shown the Fv/Fm to be a valuable metric for assessing macroalgal thermal tolerance [32]. Our results demonstrate that the Fv/Fm values in B. fuscopurpurea at 28 °C at 6 h, 4 d, and 7 d were significantly lower than those at 15 °C (p < 0.05), indicating initial photoinhibition at 6 h, consistent with the findings in Kappaphycus alvarezii [33]. Over the extended exposure periods (4 d and 7 d), heat stress progressively impaired the photosynthetic apparatus, further reducing the Fv/Fm (p < 0.05).
4.2. The Influence of Temperature on the Photosynthetic Pathway
Photosynthesis is one of the most temperature-sensitive biological processes in algae [34], relying on electron transport within the photosystems to supply the energy required for algal growth and development [35]. In red algae, phycobilisomes serve as the principal light-harvesting antennae in the photosynthetic mechanism. Red algal phycobilisomes consist of phycoerythrin (PE), phycocyanin (PC), and allophycocyanin (APC); the red coloration of these algae arises from APC masking the green color of chlorophyll and other pigments [36]. These phycobilisome structures are closely associated with Photosystem II (PSII) and Photosystem I (PSI), ensuring the efficient transfer of excitation energy to their reaction centers and promoting the conversion of light into chemical energy [37]. Studies have shown that in Sargassum horneri, the expression of photosynthesis-related genes is down-regulated during the early phase of heat stress [38]. In this study, genes encoding the PSII dimer subunit PsbM and oxygen-evolving enhancer proteins (PsbO/P/Q/U) were rapidly up-regulated to stabilize the oxygen-evolving complex and maintain water-splitting activity, ensuring sustained ATP and NADPH production. Concurrently, genes for photoprotective proteins such as PsbS and Lhca1, along with key electron transport components (PetC/F/H), were co-up-regulated, balancing the energy flow between PSII and PSI, preserving non-photochemical quenching and thermal dissipation, and preventing excessive ROS accumulation. At 6 h, the up-regulation of CpcE likely reinforces phycobilisome integrity, followed by the moderate down-regulation of core reaction-center proteins (PsbA/C, ApcB) to reduce light capture and mitigate photoinhibition risk—findings consistent with observations in Pyropia haitanensis under heat stress [39].
4.3. The Influence of Temperature on Carbohydrate Synthesis and Energy Metabolism Pathways
Studies have shown that algal metabolic processes are subject to gene-level regulation under stress conditions [40], with carbohydrate metabolism representing a critical component. Algae modulate carbohydrate concentrations and structural composition to optimize the use of endogenous carbon-derived energy and accumulate compatible solutes for molecular protection [41]. However, under excessive environmental stress, algae may experience energy deficits, prompting the up-regulation of intrinsic carbohydrate metabolic routes and the activation of alternative pathways such as glycolysis to sustain ATP supply and carbon skeleton provision for essential processes [42]. For example, G. lemaneiformis exhibits a significant accumulation of floridoside and isofloridoside after 1 and 2 days of heat stress [43]. In this study, we conducted an integrated analysis of four carbohydrate and energy metabolism pathways: the Calvin cycle, glycolysis/gluconeogenesis, the pentose phosphate pathway, and the tricarboxylic acid (TCA) cycle. We observed that the majority of Calvin cycle genes were up-regulated, consistent with the response reported in Saccharina latissima under elevated temperature [44]. However, RbcL was significantly down-regulated at 1 day; the differential temperature sensitivity of Rubisco has been reported across algal taxa [45], and our finding aligns with that of Huang, who observed RbcS down-regulation in G. bailinae under heat stress [7]. Previous studies suggest that the thermal lability of the electron transport chain may constrain energy metabolism under heat stress [46]. For instance, P. haitanensis shows a significant down-regulation of energy metabolism pathways, including the pentose phosphate pathway and TCA cycle, under heat stress [39], whereas G. lemaneiformis displays enhanced energy metabolism when exposed to high temperature, mirroring our observations [47]. The enhanced pentose phosphate pathway and glycolysis/gluconeogenesis generate abundant NADPH, supplying energy and supporting antioxidant defenses by maintaining enzyme activities to mitigate oxidative damage. While heat stress has been reported to inhibit the TCA cycle in Sargassum fusiforme [48], our study found an overall up-regulation of TCA cycle genes. Key intermediate-synthesizing enzymes (CS, MDH2, PdhD) were significantly induced, indicating that enhanced TCA activity under heat stress bolsters signal transduction, energy supply, and antioxidant defense to counteract thermal damage.
4.4. The Influence of Temperature on Glycerophospholipid Metabolism
Glycerophospholipids, as the principal lipid constituents of biological membranes, are essential for maintaining bilayer fluidity, a property fundamental to the proper function of membrane-bound proteins, ion channels, and receptors [49]. Under heat-stress conditions, the lipid composition and architecture of algal plasma membranes may be altered [50]; the regulation of glycerophospholipid metabolism is therefore critical for preserving membrane fluidity and integrity, which in turn protects cells from thermal damage. Studies have shown that chitosan oligosaccharide treatment enhances thermotolerance in Gracilariopsis lemaneiformis by significantly up-regulating genes involved in glycerophospholipid metabolism, increasing photosynthetic membrane lipid content, and promoting the accumulation of lipid signaling molecules such as phosphatidic acid (PA), thereby improving photosynthetic growth and heat resistance under high-temperature stress [51]. Similarly, exogenous arginine application in heat-stressed Sargassum fusiforme induces the up-regulation of arginine metabolism genes, leading to enhanced phosphatidic acid synthesis and improved thermotolerance [52]. Consistent with these findings, our data show that at 6 h of heat stress, B. fuscopurpurea limits excessive lipid synthesis or redirects carbon flux by reducing glycerol-3-phosphate production, while the sustained up-regulation of DgkA promotes the conversion of diacylglycerol (DAG) to phosphatidic acid (PA). PA not only fuels phospholipid biosynthesis but also acts as a signaling molecule to orchestrate membrane remodeling and stress-response pathways, facilitating rapid membrane repair and mitigating heat-induced cellular damage.
4.5. The Influence of Temperature on Glutathione Metabolism
Previous studies have demonstrated that plants deploy specific genetic responses to cope with environmental stresses, with glutathione (GSH) and hydrogen peroxide serving as central signaling molecules in both abiotic and biotic stress pathways [53]. The exogenous application of GSH can enhance antioxidant enzyme activities, mitigate oxidative damage, and improve thermotolerance in plants [54]. In macroalgae, the principal mechanism for counteracting excessive reactive oxygen species is the ascorbate–glutathione cycle [55]. Maintaining the dynamic equilibrium between reduced glutathione (GSH) and its oxidized form (GSSG), as well as between ascorbate (ASC) and dehydroascorbate (DHA), is essential for alleviating oxidative stress. Moreover, the activation of antioxidant enzymes—such as glutathione reductase (GR), ascorbate peroxidase (APX), and superoxide dismutase (SOD)—also plays a pivotal role in this defense system [56]. Previous research has shown that the ascorbate–glutathione cycle participates in the low-salinity stress response of B. fuscopurpurea [57]. Similarly, in our study, B. fuscopurpurea exhibited a significant up-regulation of the γ-glutamyl transpeptidase gene (Ggt) at 6 h of heat stress, enhancing GSH synthesis to rapidly scavenge intracellular ROS and ameliorate acute oxidative damage. After 1 day of stress, the thalli had reprogrammed their metabolic networks and engaged additional heat-response pathways, resulting in a normalization of Ggt expression. Throughout heat stress, glutathione peroxidase (GPX) and L-ascorbate peroxidase (APX) enzymes directly detoxifying H2O2 and other ROS must remain highly active; accordingly, GPX and APX genes were significantly up-regulated at both 6 h and 1 d to sustain cellular homeostasis.
4.6. The Gene Regulatory Mechanism Under High-Temperature Stress
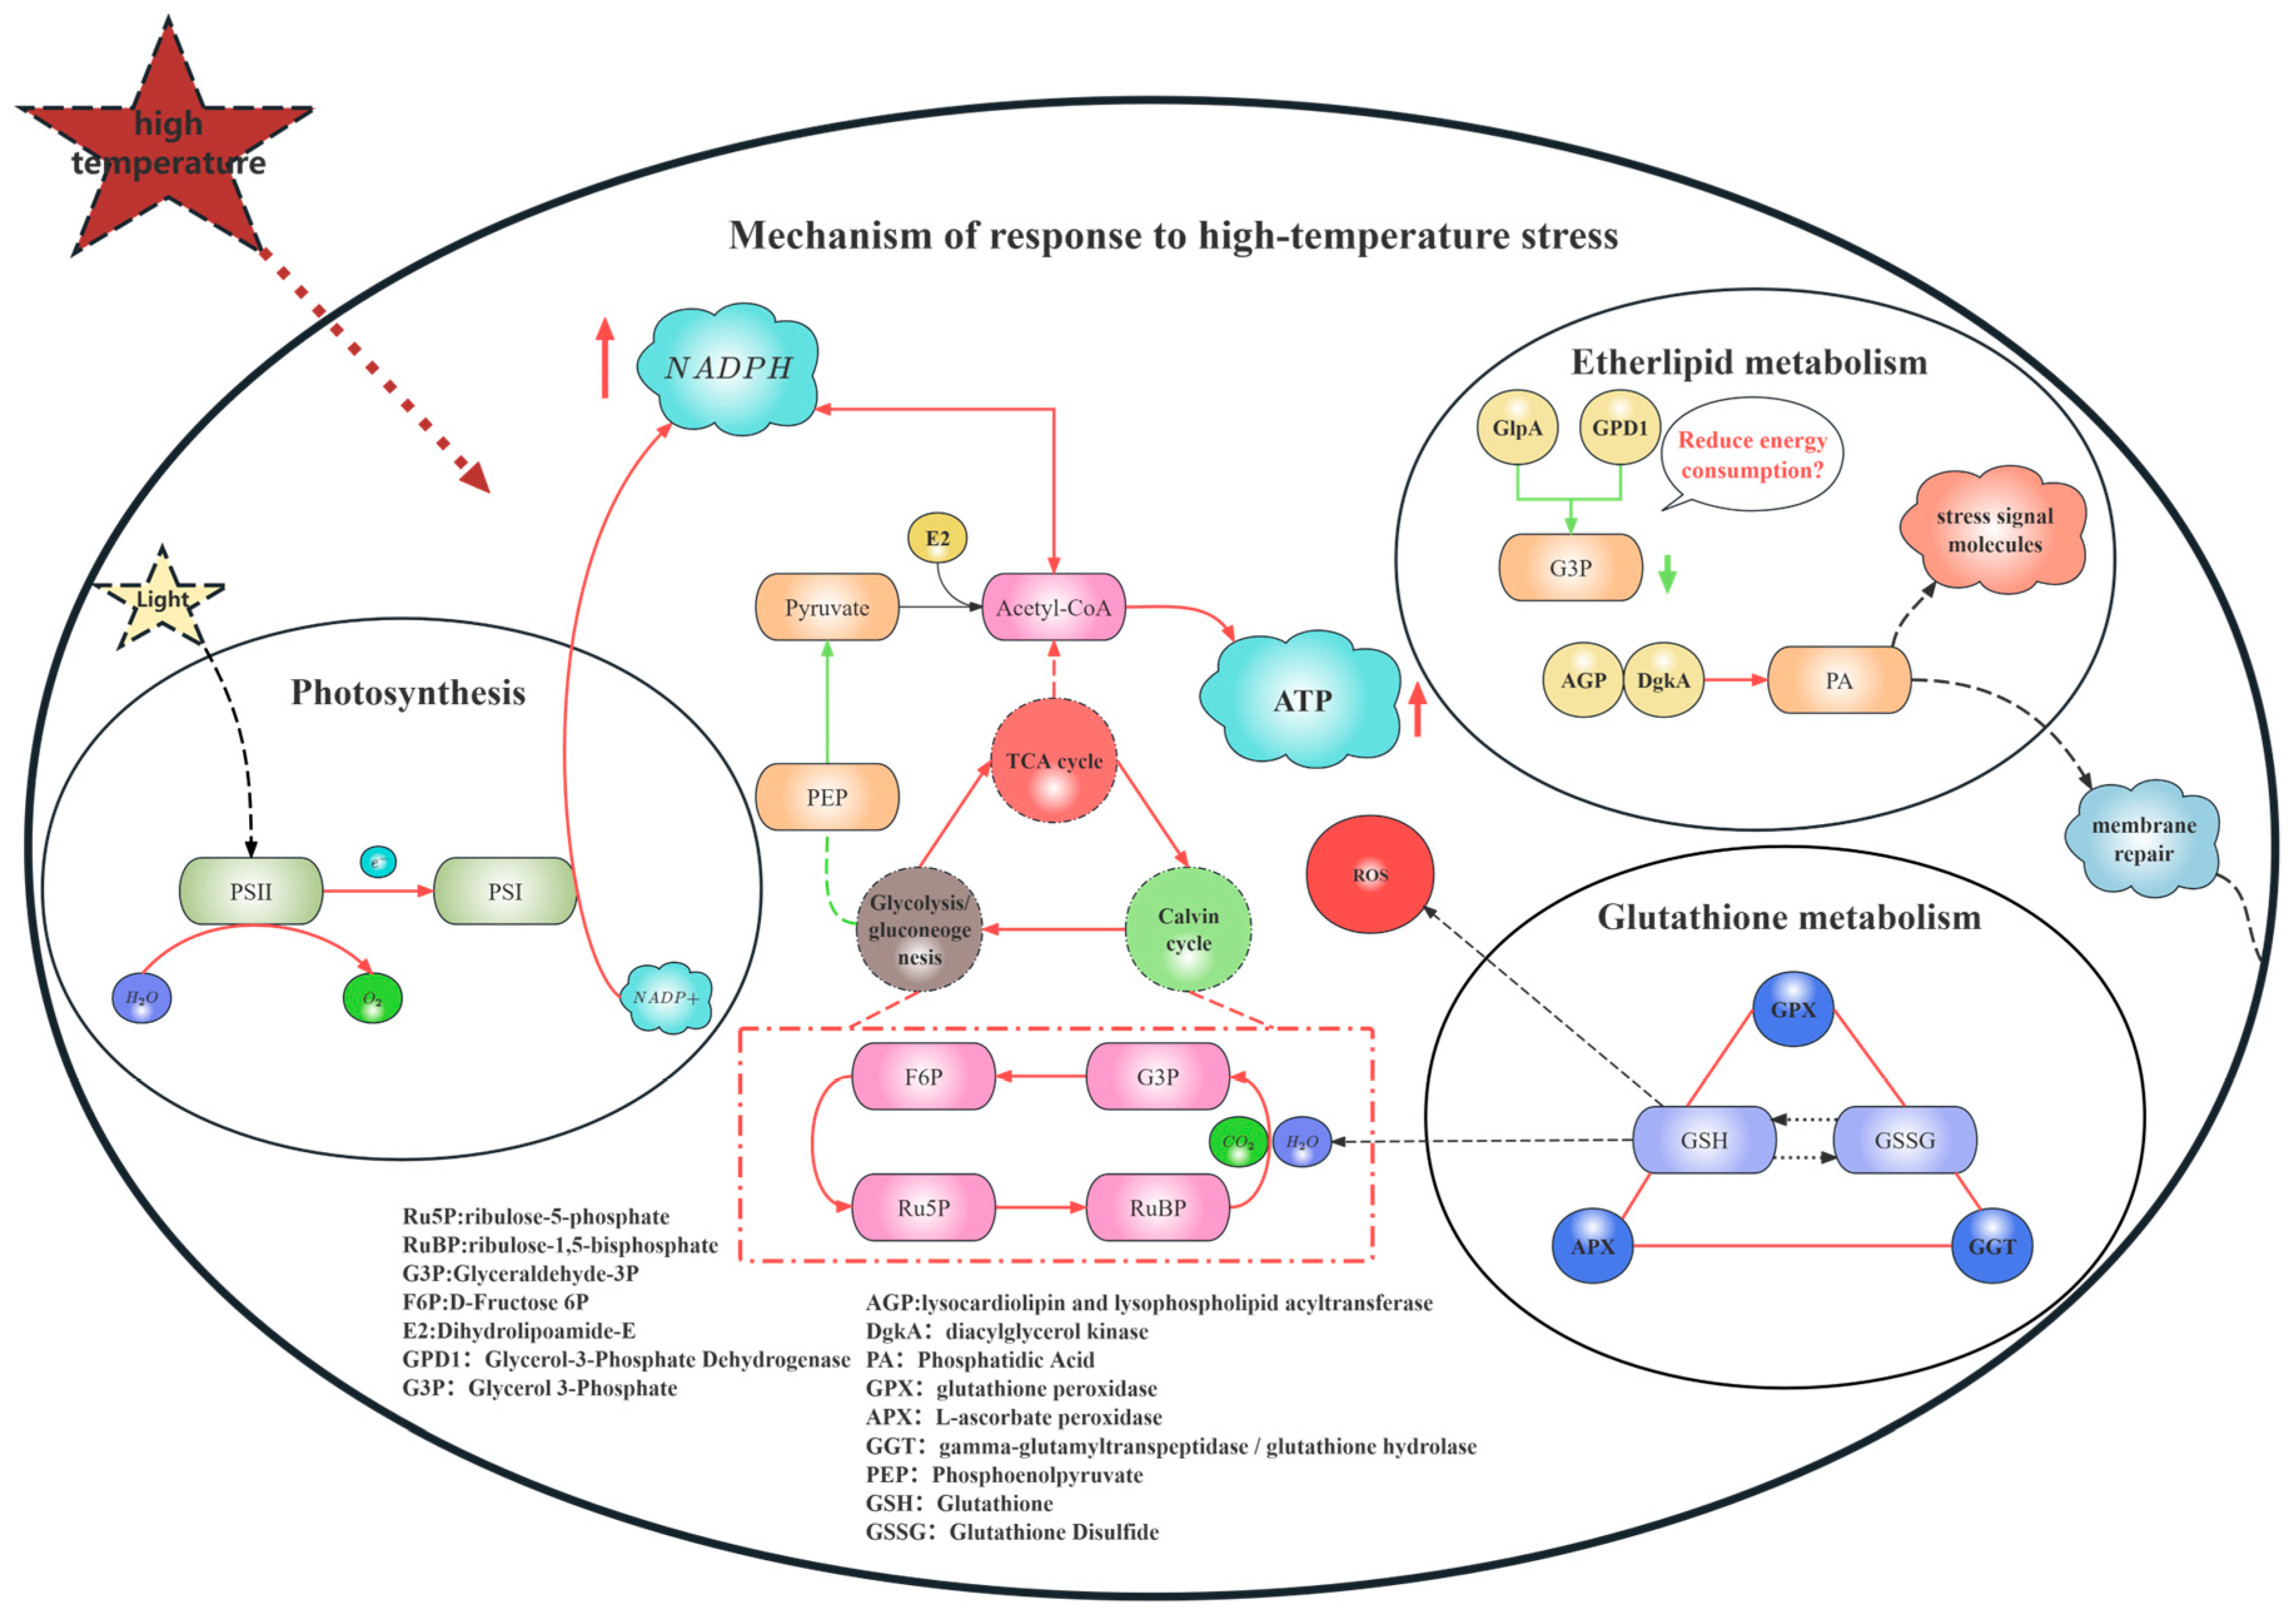
Integrating the foregoing pathway analyses, it can be concluded that under heat stress, B. fuscopurpurea orchestrates a complex adaptive response network via precise gene regulation. Transcriptome profiling indicates that heat stress induces the modulation of genes involved in energy transfer between PSII and PSI, light harvesting, and heat-shock proteins, thereby mitigating photodamage. Concurrently, it fine-tunes genes in the Calvin cycle, the TCA cycle, glycolysis/gluconeogenesis, and the pentose phosphate pathway to balance ATP production with carbon fixation while triggering antioxidant defenses. In glycerophospholipid metabolism, the sustained up-regulation of DgkA drives the conversion of diacylglycerol into phosphatidic acid, promoting membrane remodeling and repair. Moreover, within 6 h of heat exposure, Ggt is rapidly induced to sustain the glutathione cycle, followed by the persistent up-regulation of GPX and APX to scavenge ROS, collectively preserving cellular function and viability. Together, these coordinated regulatory events constitute the comprehensive response strategy of B. fuscopurpurea under heat stress (Figure 10).
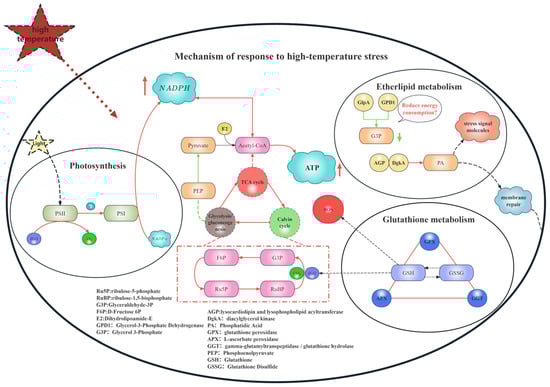
Figure 10.
Overall gene regulatory map. Note: In the regulatory diagram of this mechanism, the red arrows indicate that the related regulatory genes are up-regulated, while the green arrows indicate that the related genes are down-regulated.
5. Conclusions
In summary, this study conducted a preliminary investigation into the physiological and molecular mechanisms of B. fuscopurpurea under heat stress. Cultivation at 28 °C imposed thermal stress on B. fuscopurpurea, resulting in a significant reduction in the relative growth rate and Fv/Fm values. The chlorophyll a and carotenoid contents significantly increased on day 1, while the phycobiliprotein levels showed a marked rise on days 4 and 7. Transcriptomic analysis revealed that B. fuscopurpurea adapts to high-temperature stress by regulating eight metabolic pathways related to photosynthesis, energy and carbohydrate metabolism, glycerophospholipid metabolism, and the glutathione cycle. The alga mitigates heat-induced damage by enhancing the Calvin cycle, the TCA cycle, and glycolysis/gluconeogenesis pathways, thereby accelerating the synthesis of osmotic regulators and NADPH. Furthermore, this study found that B. fuscopurpurea may counteract the adverse effects of heat stress by up-regulating genes involved in glycerophospholipid and glutathione metabolism to alter membrane fluidity and improve the reactive oxygen species scavenging capacity. These findings provide a valuable reference for further research on stress resistance and the development of heat-tolerant cultivars of B. fuscopurpurea.
Supplementary Materials
The following supporting information can be downloaded at https://www.mdpi.com/article/10.3390/cimb47070484/s1.
Author Contributions
Conceptualization, W.C.; Methodology, M.Z.; Software, M.Z.; Validation, M.Z.; Formal analysis, M.Z.; Investigation, M.Z., H.Z. and Z.C.; Resources, W.C.; Data curation, M.Z.; Writing—original draft, M.Z.; Writing—review & editing, W.C.; Visualization, M.Z.; Supervision, H.Z. and W.C.; Project administration, W.C.; Funding acquisition, W.C. All authors have read and agreed to the published version of the manuscript.
Funding
This research was supported by the Research on Industrial Innovation Technology for Guangdong Modern Marine Ranching: 2024-MRI-001, China Agriculture Research System (CARS-50), and Science and Technology Project of Shantou City, Guangdong Province: STKJ2024003.
Institutional Review Board Statement
Not applicable
Informed Consent Statement
Not applicable.
Data Availability Statement
Data is contained within the article or Supplementary Material.
Acknowledgments
We sincerely thank all individuals who provided valuable assistance during the course of this study.
Conflicts of Interest
The authors declare no conflict of interest.
References
- Ji, Y.; Gao, K. Effects of climate change factors on marine macroalgae: A review. Adv. Mar. Biol. 2021, 88, 91–136. [Google Scholar] [PubMed]
- Masson-Delmotte, V.; Zhai, P.; Pirani, A.; Connors, S.L.; Péan, C.; Berger, S.; Caud, N.; Chen, Y.; Goldfarb, L.; Gomis, M. Climate change 2021: The physical science basis. In Contribution of Working Group I to the Sixth Assessment Report of the Intergovernmental Panel on Climate Change; Intergovernmental Panel on Climate Change: Geneva, Switzerland, 2021; Volume 2, p. 2391. [Google Scholar]
- Shuang, Y.; Kosuke, H.; Qian, A. Acceleration in the Global Mean Sea Level Rise: 2005–2015. Geophys. Res. Lett. 2017, 44, 11905–11913. [Google Scholar] [CrossRef]
- Arno von, K.; Andrew, S.; Gabriele, C.H. Marine heatwaves in global sea surface temperature records since 1850. Environ. Res. Lett. 2022, 17, 084027. [Google Scholar] [CrossRef]
- Polyakov, I.V.; Pnyushkov, A.V.; Alkire, M.B.; Ashik, I.M.; Baumann, T.M.; Carmack, E.C.; Goszczko, I.; Guthrie, J.; Ivanov, V.V.; Kanzow, T.; et al. Greater role for Atlantic inflows on sea-ice loss in the Eurasian Basin of the Arctic Ocean. Science 2017, 356, 285–291. [Google Scholar] [CrossRef]
- Gao, G.; Beardall, J.; Jin, P.; Gao, L.; Xie, S.; Gao, K. A review of existing and potential blue carbon contributions to climate change mitigation in the Anthropocene. J. Appl. Ecol. 2022, 59, 1686–1699. [Google Scholar] [CrossRef]
- Huang, Y.; Cui, J.; Wang, S.; Chen, X.; Liao, J.; Guo, Y.; Xin, R.; Huang, B.; Xie, E. Transcriptome analysis reveals the molecular mechanisms of adaptation to high temperatures in Gracilaria bailinae. Front. Plant Sci. 2023, 14, 1125324. [Google Scholar] [CrossRef]
- Kaori, M.; Yoko, Y.; Kanji, N.; Takato, F.; Naoya, S.; Tatsuo, U.; Yohko, S.-K.; Masayuki, K. Seasonal variation in the chemical composition of a marine brown alga, Sargassum horneri (Turner) C. Agardh. J. Food Compos. Anal. 2011, 24, 231–236. [Google Scholar] [CrossRef]
- Pang, S.J.; Jin, Z.H.; Sun, J.Z.; Gao, S.Q. Temperature tolerance of young sporophytes from two populations of Laminaria japonica revealed by chlorophyll fluorescence measurements and short-term growth and survival performances in tank culture. Aquaculture 2007, 262, 493–503. [Google Scholar] [CrossRef]
- Kumar, Y.N.; Poong, S.-W.; Gachon, C.; Brodie, J.; Sade, A.; Lim, P.-E. Impact of elevated temperature on the physiological and biochemical responses of Kappaphycus alvarezii (Rhodophyta). PLoS ONE 2020, 15, e0239097. [Google Scholar] [CrossRef]
- Liu, L.; Zou, D.; Jiang, H.; Chen, B.; Zeng, X. Effects of increased CO2 and temperature on the growth and photosynthesis in the marine macroalga Gracilaria lemaneiformis from the coastal waters of South China. J. Appl. Phycol. 2018, 30, 1271–1280. [Google Scholar] [CrossRef]
- Zou, D.; Gao, K. Temperature response of photosynthetic light- and carbon-use characteristics in the red seaweed Gracilariopsis lemaneiformis (Gracilariales, Rhodophyta). J. Phycol. 2014, 50, 366–375. [Google Scholar] [CrossRef]
- Broom, J.; Farr, T.; Nelson, W. Phylogeny of the Bangia flora of New Zealand suggests a southern origin for Porphyra and Bangia (Bangiales, Rhodophyta). Mol. Phylogenetics Evol. 2004, 31, 1197–1207. [Google Scholar] [CrossRef] [PubMed]
- Ma, J.-H.; Li, S.-J.; Ji, H.-H. An analysis of amino acids and fatty acids in Bangia. Chin. J. Mar. Drugs 2002, 21, 40–42. [Google Scholar]
- Shuijun, L.; Jiahai, M.; Huanhong, J.; Enyi, X. Evaluation of nutrient components of Bangia sp. Acta Oceanol. Sin. 2003, 22, 89–95. [Google Scholar]
- Wenjun, W.; Jianyi, Z.; Pao, X.; Jianrong, X.; Xiang-zhi, L.; Chun-Kai, H.; Weibin, S.; Guang, P.; Guangce, W. Characterization of the life history of Bangia fuscopurpurea (Bangiaceae, Rhodophyta) in connection with its cultivation in China. Aquaculture 2008, 278, 101–109. [Google Scholar] [CrossRef]
- Yong, Y.S.; Yong, W.T.L.; Anton, A. Analysis of formulae for determination of seaweed growth rate. J. Appl. Phycol. 2013, 25, 1831–1834. [Google Scholar] [CrossRef]
- Li, C.; Nong, Q.; Solanki, M.K.; Liang, Q.; Xie, J.; Liu, X.; Li, Y.; Wang, W.; Yang, L.; Li, Y. Differential expression profiles and pathways of genes in sugarcane leaf at elongation stage in response to drought stress. Sci. Rep. 2016, 6, 25698. [Google Scholar] [CrossRef]
- Porra, R.J. The chequered history of the development and use of simultaneous equations for the accurate determination of chlorophylls a and b. Photosynth. Res. 2002, 73, 149–156. [Google Scholar] [CrossRef]
- Beer, S.; Eshel, A. Determining phycoerythrin and phycocyanin concentrations in aqueous crude extracts of red algae. Mar. Freshw. Res. 1985, 36, 785–792. [Google Scholar] [CrossRef]
- Piñeiro-Corbeira, C.; Barreiro, R.; Cremades, J.; Arenas, F. Seaweed assemblages under a climate change scenario: Functional responses to temperature of eight intertidal seaweeds match recent abundance shifts. Sci. Rep. 2018, 8, 12978. [Google Scholar] [CrossRef]
- Yang, F.; Wei, Z.; Long, L. Transcriptomic and Physiological Responses of the Tropical Reef Calcified Macroalga Amphiroa fragilissima to Elevated Temperature1. J. Phycol. 2021, 57, 1254–1265. [Google Scholar] [CrossRef] [PubMed]
- Wilson, K.L.; Kay, L.M.; Schmidt, A.L.; Lotze, H.K. Effects of increasing water temperatures on survival and growth of ecologically and economically important seaweeds in Atlantic Canada: Implications for climate change. Mar. Biol. 2015, 162, 2431–2444. [Google Scholar] [CrossRef]
- Zulfiqar, S.; Sharif, S.; Saeed, M.; Tahir, A. Role of carotenoids in photosynthesis. In Carotenoids: Structure and Function in the Human Body; Springer: Berlin/Heidelberg, Germany, 2021; pp. 147–187. [Google Scholar]
- Yang, J.J.; Yu, D.C.; Ma, Y.F.; Yin, Y.; Shen, S.D. Antioxidative defense response of Ulva prolifera under high or low-temperature stimulus. Algal Res. 2019, 44, 101703. [Google Scholar] [CrossRef]
- Ma, C.; Qin, S.; Cui, H.; Liu, Z.; Zhuang, L.; Wang, Y.; Zhong, Z. Nitrogen enrichment mediates the effects of high temperature on the growth, photosynthesis, and biochemical constituents of Gracilaria blodgettii and Gracilaria lemaneiformis. Environ. Sci. Pollut. Res. 2021, 28, 21256–21265. [Google Scholar] [CrossRef] [PubMed]
- Ma, J.; Jiangnan, H.; Xinmei, S.; Demei, M.; Yang, R. Phycobiliproteins, the pigment-protein complex form of natural food colorants and bioactive ingredients. Crit. Rev. Food Sci. Nutr. 2024, 64, 2999–3017. [Google Scholar] [CrossRef]
- Kim, E.Y.; Choi, Y.H.; Nam, T.J. Identification and antioxidant activity of synthetic peptides from phycobiliproteins of Pyropia yezoensis. Int. J. Mol. Med. 2018, 42, 789–798. [Google Scholar] [CrossRef]
- Gao, T.; Tang, X.; Wang, D.; Yu, Y.; Mao, Y. Morpho-physiological and transcriptomic analyses reveal adaptive responses of Neopyropia yezoensis to long-term high temperature. Plant Stress. 2025, 15, 100778. [Google Scholar] [CrossRef]
- Muhammad, I.; Shalmani, A.; Ali, M.; Yang, Q.-H.; Ahmad, H.; Li, F.B. Mechanisms regulating the dynamics of photosynthesis under abiotic stresses. Front. Plant Sci. 2021, 11, 615942. [Google Scholar] [CrossRef]
- Zhang, L.; Chang, Q.; Hou, X.; Wang, J.; Chen, S.; Zhang, Q.; Wang, Z.; Yin, Y.; Liu, J. The effect of high-temperature stress on the physiological indexes, chloroplast ultrastructure, and photosystems of two herbaceous peony cultivars. J. Plant Growth Regul. 2023, 42, 1631–1646. [Google Scholar] [CrossRef]
- Wu, J.; Lian, W.; Liu, Z.; Zeng, X.; Jiang, J.; Wei, Y. High temperature response of chlorophy II fluorescence parameters and heat tolerance evaluation of different grape cultivars. J. Northwest A F Univ. 2019, 47, 80–88. [Google Scholar]
- Borlongan, I.A.G.; Gerung, G.S.; Nishihara, G.N.; Terada, R. Light and temperature effects on photosynthetic activity of Eucheuma denticulatum and Kappaphycus alvarezii (brown and green color morphotypes) from Sulawesi Utara, Indonesia. Phycol. Res. 2017, 65, 69–79. [Google Scholar] [CrossRef]
- Li, Q.; Zhang, L.; Pang, T.; Liu, J. Comparative transcriptome profiling of Kappaphycus alvarezii (Rhodophyta, Gigartinales) in response to two extreme temperature treatments: An RNA-seq-based resource for photosynthesis research. Eur. J. Phycol. 2019, 54, 162–174. [Google Scholar] [CrossRef]
- Qin, F.; Zang, X.; Shui, G.; Wang, Z. Transcriptome analysis of Gracilariopsis lemaneiformis at low temperature. J. Appl. Phycol. 2021, 33, 4035–4050. [Google Scholar] [CrossRef]
- Saluri, M.; Kaldmäe, M.; Tuvikene, R. Extraction and quantification of phycobiliproteins from the red alga Furcellaria lumbricalis. Algal Res. 2019, 37, 115–123. [Google Scholar] [CrossRef]
- You, X.; Zhang, X.; Cheng, J.; Xiao, Y.; Ma, J.; Sun, S.; Zhang, X.; Wang, H.-W.; Sui, S.-F. In situ structure of the red algal phycobilisome–PSII–PSI–LHC megacomplex. Nature 2023, 616, 199–206. [Google Scholar] [CrossRef]
- Dai, W.; Wang, X.; Zhuang, M.; Sun, J.; Shen, Y.; Xia, Z.; Wu, T.; Jiang, R.; Li, A.; Bi, F.; et al. Responses of photosynthesis-related genes in Sargassum horneri to high temperature stress. Mar. Pollut. Bull. 2024, 199, 115944. [Google Scholar] [CrossRef] [PubMed]
- Wang, W.; Lin, Y.; Teng, F.; Ji, D.; Xu, Y.; Chen, C.; Xie, C. Comparative transcriptome analysis between heat-tolerant and sensitive Pyropia haitanensis strains in response to high temperature stress. Algal Res. 2018, 29, 104–112. [Google Scholar] [CrossRef]
- Wang, T.; Gao, M.; Song, H.; Wang, C.; He, M. Low temperature modulates the carbon allocation in different metabolic pathways to improve the tolerance of Arctic Chlorella to high light stress. Algal Res. 2024, 80, 103562. [Google Scholar] [CrossRef]
- Barati, B.; Gan, S.Y.; Lim, P.E.; Beardall, J.; Phang, S.M. Green algal molecular responses to temperature stress. Acta Physiol. Plant. 2019, 41, 26. [Google Scholar] [CrossRef]
- Li, X.; Manuel, J.; Slavens, S.; Crunkleton, D.W.; Johannes, T.W. Interactive effects of light quality and culturing temperature on algal cell size, biomass doubling time, protein content, and carbohydrate content. Appl. Microbiol. Biotechnol. 2021, 105, 587–597. [Google Scholar] [CrossRef]
- Lv, Y.; Sun, P.; Zhang, Y.; Xuan, W.; Xu, N.; Sun, X. Response of trehalose, its degrading enzyme, sucrose, and floridoside/isofloridoside under abiotic stresses in Gracilariopsis lemaneiformis (Rhodophyta). J. Appl. Phycol. 2019, 31, 3861–3869. [Google Scholar] [CrossRef]
- Li, H.; Monteiro, C.; Heinrich, S.; Bartsch, I.; Valentin, K.; Harms, L.; Glöckner, G.; Corre, E.; Bischof, K. Responses of the kelp Saccharina latissima (Phaeophyceae) to the warming Arctic: From physiology to transcriptomics. Physiol. Plant. 2020, 168, 5–26. [Google Scholar] [CrossRef] [PubMed]
- Iñiguez, C.; Galmés, J.; Gordillo, F.J.L. Rubisco carboxylation kinetics and inorganic carbon utilization in polar versus cold-temperate seaweeds. J. Exp. Bot. 2019, 70, 1283–1297. [Google Scholar] [CrossRef]
- Lemieux, H.; Blier, P.U. Exploring thermal sensitivities and adaptations of oxidative phosphorylation pathways. Metabolites 2022, 12, 360. [Google Scholar] [CrossRef] [PubMed]
- Zhang, X.; Hu, C.; Sun, X.; Zang, X.; Zhang, X.; Fang, T.; Xu, N. Comparative transcriptome analysis reveals chitooligosaccharides-induced stress tolerance of Gracilariopsis lemaneiformis under high temperature stress. Aquaculture 2020, 519, 734876. [Google Scholar] [CrossRef]
- Liu, L.; Lin, L. Effect of Heat Stress on Sargassum fusiforme Leaf Metabolome. J. Plant Biol. 2020, 63, 229–241. [Google Scholar] [CrossRef]
- Gonzalez-Baro, M.R.; Coleman, R.A. Mitochondrial acyltransferases and glycerophospholipid metabolism. Biochim. Et Biophys. Acta (BBA)-Mol. Cell Biol. Lipids 2017, 1862, 49–55. [Google Scholar] [CrossRef]
- Liang, Y.; Huang, Y.; Liu, C.; Chen, K.; Li, M. Functions and interaction of plant lipid signalling under abiotic stresses. Plant Biol. 2023, 25, 361–378. [Google Scholar] [CrossRef]
- Zhang, X.; Wu, C.; Hu, C.; Li, Y.; Sun, X.; Xu, N. Lipid remodeling associated with chitooligosaccharides-induced heat tolerance of marine macroalgae Gracilariopsis lemaneiformis. Algal Res. 2020, 52, 102113. [Google Scholar] [CrossRef]
- Zhang, J.; Liu, S.; Hu, C.; Chen, X.; Sun, X.; Xu, N. Physiological and Transcriptome Analysis of Exogenous L-Arginine in the Alleviation of High-Temperature Stress in Gracilariopsis lemaneiformis. Front. Mar. Sci. 2021, 8, 784586. [Google Scholar] [CrossRef]
- Pandey, A.K.; Gautam, A. Stress responsive gene regulation in relation to hydrogen sulfide in plants under abiotic stress. Physiol. Plant. 2020, 168, 511–525. [Google Scholar] [CrossRef] [PubMed]
- Suliman, M.S.E.; Elradi, S.B.M.; Zhou, G.; Meng, T.; Zhu, G.; Xu, Y.; Nimir, N.E.A.; Elsiddig, A.M.I.; Awdelseid, A.H.M.; Ali, A.Y.A. Exogenous glutathione protected wheat seedling from high temperature and water deficit damages. Sci. Rep. 2024, 14, 5304. [Google Scholar] [CrossRef] [PubMed]
- Moenne, A.; González, A.; Sáez, C.A. Mechanisms of metal tolerance in marine macroalgae, with emphasis on copper tolerance in Chlorophyta and Rhodophyta. Aquat. Toxicol. 2016, 176, 30–37. [Google Scholar] [CrossRef] [PubMed]
- Celis-Plá, P.S.M.; Moenne, F.; Rodríguez-Rojas, F.; Pardo, D.; Lavergne, C.; Moenne, A.; Brown, M.T.; Huovinen, P.; Gómez, I.; Navarro, N.; et al. Antarctic intertidal macroalgae under predicted increased temperatures mediated by global climate change: Would they cope? Sci. Total Environ. 2020, 740, 140379. [Google Scholar] [CrossRef]
- Niu, C.; Wang, W.; Yao, H.; Liang, Z.; Zhang, P.; Lu, X. Ascorbate−glutathione cycle involving in response of Bangia fuscopurpurea (Bangiales, Rhodophyta) to hyposalinity. Front. Mar. Sci. 2023, 10, 1174472. [Google Scholar] [CrossRef]


Disclaimer/Publisher’s Note: The statements, opinions and data contained in all publications are solely those of the individual author(s) and contributor(s) and not of MDPI and/or the editor(s). MDPI and/or the editor(s) disclaim responsibility for any injury to people or property resulting from any ideas, methods, instructions or products referred to in the content. |
© 2025 by the authors. Licensee MDPI, Basel, Switzerland. This article is an open access article distributed under the terms and conditions of the Creative Commons Attribution (CC BY) license (https://creativecommons.org/licenses/by/4.0/).