Article

Microarray Analysis Reveals Sepsis Is a Syndrome with Hyperactivity of TH17 Immunity, with Over-Presentation of the Treg Cell Cytokine TGF-β †

1
Department of Laboratory Medicine, Taipei Tzu Chi Hospital, Buddhist Tzu Chi Medical Foundation, No. 289 Jianguo Road, Xindian District, New Taipei City 231, Taiwan
2
Department of Clinical Pathology, Taipei Tzu Chi Hospital, Buddhist Tzu Chi Medical Foundation, No. 289 Jianguo Road, Xindian District, New Taipei City 231, Taiwan
3
Department of Medical Research, Taipei Tzu Chi Hospital, Buddhist Tzu Chi Medical Foundation, No. 289 Jianguo Road, Xindian District, New Taipei City 231, Taiwan
4
Department of Biotechnology, Ming Chuan University, Taoyuan City 333, Taiwan
*
Authors to whom correspondence should be addressed.
This article was posted on a preprint server: Wan-Chung Hu. Sepsis is a Syndrome with Hyperactivity of TH17-like Innate Immunity and Hypoactivity of Adaptive Immunity. arXiv:1311.4747.
These authors contributed equally to this work.
Curr. Issues Mol. Biol. 2025, 47(6), 435; https://doi.org/10.3390/cimb47060435
Submission received: 13 May 2025 / Revised: 3 June 2025 / Accepted: 7 June 2025 / Published: 9 June 2025
(This article belongs to the Special Issue Genomic Analysis of Common Disease, 2nd Edition)

Abstract

Currently, there are two major theories regarding the pathogenesis of sepsis: hyperimmune and hypoimmune. The hyperimmune theory suggests that a cytokine storm causes the symptoms of sepsis. On the contrary, the hypoimmune theory suggests that immunosuppression causes the manifestations of sepsis. By conducting a microarray analysis on peripheral leukocytes from patients with sepsis, this study found that hyperactivity of TH17 immunity was noted in sepsis patients. Innate immunity-related genes are significantly upregulated, including CD14, TLR1,2,4,5,8, HSP70, CEBP proteins, AP1 (JUNB and FOSL2), TGFB1, IL6, TGFA, CSF2 receptor, TNFRSF1A, S100A binding proteins, CCR2, FPR2, amyloid proteins, pentraxin, defensins, CLEC5A, whole complement machinery, CPD, NCF, MMP, neutrophil elastase, caspases, IgG and IgA Fc receptors (CD64, CD32), ALOX5, PTGS, LTB4R, LTA4H, and ICAM1. The majority of adaptive immunity genes were downregulated, including MHC-related genes, TCR genes, granzymes/perforin, CD40, CD8, CD3, TCR signaling, BCR signaling, T and B cell-specific transcription factors, NK killer receptors, and TH17 helper-specific transcription factors (STAT3, RORA, and REL), as well as Treg-related genes, including TGFB1, IL15, STAT5B, SMAD2/4, CD36, and thrombospondin. The findings of this study show that Th17 with Treg over-presentation play an important role in the pathophysiology of sepsis.

1. Introduction

Despite the development of antibiotics, the mortality rate associated with sepsis remains high. However, the exact pathophysiology of sepsis remains unclear. Currently, there are two dominant theories explaining the etiology of sepsis: hyperimmune and hypoimmune theories. However, these two theories are mutually contradictory. The hyperimmune theory, proposed by Dr. Lewis Thomas, states that the hyperactivation of proinflammatory cytokines, known as the cytokine storm, is the actual cause of sepsis symptoms. These uncontrolled cytokines cause severe damage to several organs, leading to multiple organ failure. Based on this theory, clinical trials of therapeutic strategies, such as antibody-neutralizing TNF-α or anti-interleukin 1 therapies, were conducted in patients with sepsis. However, these antibodies do not improve the survival rate of patients with sepsis [1,2,3,4]. Furthermore, in a clinical trial, anti-TNF-α increased the mortality rate of patients with sepsis [2]. This created doubts regarding the hyperimmune theory. These failed clinical trials pointed out that hyperimmune is not the sole factor in the pathophysiology of sepsis. Thus, the hypoimmune theory emerged. Based on the observation that immunosuppressed patients are prone to developing sepsis, a hypoimmune status was suggested as the etiology of sepsis. However, the hypoimmune theory cannot satisfactorily explain the proinflammatory cytokine storm observed in sepsis. Both the hyperimmune and hypoimmune theories are supported by clinical and experimental evidence. This points out the complexity of the pathogenesis of sepsis. However, we still need to find an alternate theory to help explain the pathologic events of sepsis. In a previous study, we proposed an entire framework for host immunological pathways, including eradicable and tolerable immune reactions [5,6,7,8,9,10,11,12]. Here, we used a microarray study of whole blood from patients with sepsis to put forth a new theory that proposes that sepsis is a syndrome of Th17 immunity with the over-presentation of proinflammatory cytokines as well as Treg cells. Th17 immunity is a tolerable immune reaction against extracellular microorganisms, including extracellular bacteria [5]. It is triggered by both immune-stimulant interleukin-6 and immune-suppressor TGF-β. If Th17 is the key immune pathway related to sepsis, then we can combine both the hyperimmune and hypoimmune theories in the pathogenesis of sepsis [13,14]. The new theory addresses the existing controversy regarding the etiology of sepsis.

2. Materials and Methods

2.1. Microarray Dataset

In a study by Dr. J. A. Howrylak, total RNA was collected from the whole blood of patients with sepsis and sepsis-induced ARDS [15]. Patients were recruited from the Medical Intensive Care Unit of the University of Pittsburgh Medical Center between February 2005 and June 2007. Patients admitted to the Medical Intensive Care Unit for less than 48 h who were intubated and received mechanical ventilation were eligible for the study. The patients were classified as having sepsis if they met the criteria for sepsis, as defined by the Society of Critical Care Medicine Consensus statement [16]. This study attempted to identify the molecular signature of ARDS in comparison to patients with sepsis. This dataset is available from the Gene Expression Omnibus (GEO) www.ncbi.nlm.nih.gov/geo (accessed on 12 May 2025; accession number GSE 10474). Samples of patients with sepsis from this dataset were used for further microarray analysis. There was a total of 21 patients with a mortality rate of 35%. This further analytic study included patients with sepsis only and sepsis with ARDS.
The second dataset was obtained from GSE20189 of the Gene Expression Omnibus. This dataset was collected by Dr. Melissa Rotunno of the Cancer Prevention Research in 2011 [17]. The molecular signature of the early stages of lung adenocarcinoma was studied using microarray analysis. From this dataset, the data from whole blood RNA of the healthy controls (n = 21) was compared with those of patients with sepsis obtained from the previously mentioned dataset. In this study, further analysis was performed to analyze the peripheral leukocyte gene expression profiles of patients with sepsis compared with those of healthy controls. Although the above two datasets were from different studies, they both used Affymetrix HG-U133A 2.0 genechips under good quality control. In addition, the usage of RMAExpress software (version 1.2.0) can eliminate the possible batch effects for RMA normalization across these datasets.

2.2. Statistical Analysis

Affymetrix HG-U133A 2.0 genechip was used for both samples. RMAExpress software (UC Berkeley, Board Institute) was used for normalization and to rule out outliers in the dataset. Samples that exceeded the 99% line in the RLE-NUSE T2 plot were removed as potential outliers.
GeneSpring XI software (version 12) was used to analyze the significantly expressed genes between ARDS and healthy control leukocytes. Significance was set at p < 0.05. A fold-change cutoff of >2.0 was considered the cutoff for differential expression. The Benjamini–Hochberg-corrected false discovery rate (default value 0.05) was used during the analysis. These cutoff values are standardly used in microarray studies. In total, a list of 3277 genes was generated from the HGU133A2.0 chip, with 18,400 transcripts, including 14,500 well-characterized human genes.

2.3. RT-PCR Confirmation

Dr. J. A. Howrylak performed real-time PCR for the selected transcripts (cip1 and kip2) using TaqMan Gene Expression Assays (Applied Biosystems, Foster City, CA, USA). For the second dataset, Dr. Melissa Rotunno performed qRT-PCR to validate the microarray results. The RNA quantity and quality were determined using an RNA 600 LabChip-Aligent 2100 Bioanalyzer (Agilent, Santa Clara, CA, USA). RNA purification was performed using reagents from Qiagen (Hilden, Germany). All real-time PCRs were conducted using an ABI Prism 7000 Sequence Detection System (Waltham, MA, USA) with the designed primers and probes for the target genes, with GAPDH serving as the internal control gene. This confirmed that the microarray results were convincing compared to the RT-PCR results.

3. Results

3.1. RMA Analysis of Whole Blood

RMA was performed on RNA samples from the whole blood of the healthy controls from the lung adenocarcinoma dataset and from the whole blood of the patients from the sepsis dataset. A raw boxplot, a NUSE plot, an RLE value plot, an RLE-NUSE multiplot, and an RLE-NUSE T2 plot were generated. Samples were then included or excluded based on these graphs. Owing to a strong deviation in the T2 plot, sample GSM506435 from the lung adenocarcinoma dataset was excluded from further analyses. Similarly, GSM265024 and GSM265030 from the sepsis dataset were also excluded.

3.2. Toll-like Signaling and Heat Shock Protein Expression in Patients with Sepsis

Microarray analysis revealed that Toll-like receptors (TLRs) 1, 2, 4, 5, and 8 were upregulated in the patients with sepsis (Table 1). CD14 and downstream signaling molecules, such as IRAK4 and TAB2, were also upregulated. TLRs 1, 2, 4, 5, and 8 mediate antibacterial immune responses, thereby triggering TH17-like proinflammatory cytokines, such as IL-6. However, the negative TLR regulator IRAK3 was 21-fold upregulated. Thus, TLR 1, 2, 4, 5, and 8 signaling may not successfully trigger proinflammatory cytokines. Other pathways, such as CD14, may act as important alternative pathways that trigger IL-6 and other TH17-like cytokines. Other pattern recognition receptors, such as formyl peptide receptors (FPRs), which recognize specific bacterial antigens to trigger innate immunity, were also differentially expressed. FPR1 was 7.6-fold downregulated, whereas FPR2 was 4.7-fold upregulated.

3.3. Antigen Processing and Antigen Presentation Genes in Sepsis

All MHC-related genes were downregulated in the leukocytes of the patients with sepsis (Table 2). These downregulated genes included HLA-DPB, HLA-DQA, HLA-DRB, HLA-DOB, HLA-DRA, Tapasin, MHC-related transcripts, HLA-B, and HLA-DPA. Among these, HLA-B was more than 11-fold downregulated. MHC genes are key in antigen presentation to trigger adaptive immune reactions, such as B or T cell activation. As all MHC-related genes were downregulated, antigen presentation during sepsis is likely to be impaired. This agrees with previous observations [18].

3.4. TH17-like Innate Immune Transcription Factors in Sepsis

Many immune-related transcription factors were differentially regulated in the patients with sepsis (Table 3). First, several innate immunity-related transcription factors were upregulated in the patients with sepsis. These included AP1 (JUNB and FOSL2), NFIL3, ARNT, and CEBP (CEBPA, CEBPG, and CEBPD). The aryl hydrocarbon receptor nuclear translocator (ARNT) plays an important role in activating TH17-like innate immunity. The CEBP family of genes is related to the activity of myeloid cells and granulocytes. CEBP genes are also involved in the activation of acute response proteins. In addition, NFKBIA, an inhibitor of NF-κB, is downregulated in sepsis. This indicated that the activity of NF-κB, a key innate immunity mediator, was upregulated in the patients with sepsis. It is worth noting that two important transcription factors, i.e., High Mobility Group Box (HMGB) and Hypoxia-inducible factor alpha (HIFA1), are also upregulated during sepsis. HMGB, a vital innate immunity mediator, was upregulated by more than nine-fold.
STAT1, a key transcription factor for TH1 and THαβ immunity, is downregulated in sepsis. Additionally, TBX21 (T-bet), a key driver of the TH1 immune response, is also downregulated, whereas MafB, which can suppress IFNαβ in THαβ immunity, is upregulated [19]. Other TH2-related key transcription factors, such as GATA3 and C-MAF, are also downregulated [20]. This means that TH1, TH2, and THαβ are downregulated in sepsis. Interestingly, key TH17-related transcription factors, including REL, STAT3, and RORA, are also downregulated [21]. Moreover, SOCS3, a negative regulator of the central TH17 transcription factor STAT3, is upregulated, indicating that TH17 helper cells cannot be successfully triggered. On the other hand, Treg and TGFβ signaling molecules, including STAT5B, IL-15, SMAD2, and SMAD4, are upregulated [22,23]. TH17 and Treg-associated ARNT are also upregulated in sepsis [24]. Thus, Tregs are likely to be activated during sepsis. This is consistent with previous observations that Tregs are upregulated during sepsis.
The downregulated genes include B cell stimulatory transcription factor (PAX5), BCR signaling (FYN and LYN), and PI3K signaling (PIK3CB, PIK3IP1, PIK3CG, and PIK3R1) [25,26,27]. PTEN, a negative regulator of PI3K signaling, was 4.6-fold upregulated. BCL6 is a key transcription factor of follicular helper T cells in IgM-producing B cells. IBTK can inhibit B cell differentiation and activation. PI3K signaling is a downstream stimulatory pathway of B cell activation. Thus, BCR signaling appears to be suppressed during sepsis.

3.5. TH17-like and Treg-Related Cytokines Are Upregulated During Sepsis

Many TH17-like and Treg-related cytokines were upregulated in the patients with sepsis (Table 4). The whole TGFβ activation machinery was upregulated, including THBS1, CD36, and TGFB1 itself. TGFA and IL15 were also upregulated. IL6 was also upregulated in sepsis. Thus, both key TH17-driven cytokines, i.e., TGFβ and IL-6, are activated in patients with sepsis. However, the full activation of TH17 helper cells also requires TCR signaling. IL32, a TH1-related macrophage differentiation factor [28], was also downregulated. Among TH22 mediators, IL1A was downregulated, whereas IL1RN (an IL1 receptor antagonist) was upregulated. This indicated that TH22 is not activated during sepsis.
Cytokine receptors were differentially regulated during sepsis (Table 5). Contrary to what was observed with cytokines, cytokine receptors in a certain immunological pathway were downregulated. Thus, TH17-like immunity was activated, whereas TGFBR3, IL6R, and IL17RA were downregulated. TGFBR3 was downregulated by more than 11-fold, and IL6R was downregulated by more than 16-fold. Tregs were also activated, whereas TGFBR3, IL2RB, and IL7R were downregulated. TH1-related cytokine receptors IFNGR1 and IFNGR2 were upregulated. The TH2 cytokine receptor IL4R was also upregulated. With regard to TH-αβ immunity, IFNAR1 was upregulated, whereas IFNAR2 was downregulated. TH22 cytokine receptors IL1R1 and IL1R2 were upregulated. These findings indicate that TH1, TH2, TH-αβ, and TH22 are not activated during sepsis.

3.6. Upregulation of Th17-like Innate Immunity-Related Effector Molecules During Sepsis

Several acute response proteins were upregulated (Table 6). These acute phase proteins are upregulated by IL6 and CEBP. These genes included amyloid proteins (APP and APLP2), pentraxin (PTX3), transferrin receptor (TFRC), CLEC (CLEC5A and CLEC1B), and defensins (DEFA1, DEFA1B, DEFA3, and DEFA4). These are innate immunity effector proteins that attack bacterial antigens in a nonspecific manner. Defensin A4 (DEFA4) was upregulated by more than six-fold.
The entire complement machinery, an important effector component of innate immunity, was upregulated (Table 7). These included CD59, CD55, C1QB, ITGAM, CR1, CD46, C3AR1, ITGAX, C1QA, C1RL, C5AR1, and CD97. Therefore, complement molecules are activated during sepsis. These complement molecules attack bacterial cell walls and membranes, causing damage. However, complements may also have harmful effects on the host.
PMN matrix metallopeptidases (MMPs) and elastases were upregulated (Table 8). These enzymes can digest bacterial antigens as well as the extracellular matrix. These genes included MMP8, MMP9, MMP25, and ELANE (elastase). In addition, tissue inhibitors of MMP and TIMP2 and serum inhibitors of elastase or proteinase, SERPINA1, SERPINB1, and SERPINB2, were upregulated. This indicated that PMN proteinases are dysregulated during sepsis. It is worth noting that MMP8 was 32-fold upregulated and MMP9 was 10-fold upregulated.

3.7. Dysregulation of Coagulation-, Glycolysis-, Acidosis-, and Vasodilation-Related Genes in Sepsis

Many coagulation-related genes were dysregulated during sepsis (Table 9). Disseminated intracellular coagulopathy (DIC) is a common manifestation of human sepsis. The upregulated coagulation-related genes included F13A1, F5, F8, GP1BB, PROS1, PLAUR, MCFD2, TFPI, F2RL1, ITGA2B, PDGFC, ITGB3, and THBD. This indicates that both coagulation factors and coagulation inhibitors are dysregulated during sepsis.
All glycolytic pathway enzyme genes were upregulated during sepsis (Table 10). These included lactate dehydrogenase A, phosphoglycerate kinase 1, pyruvate kinase, 6-phosphofructo-2-kinase/fructose-2,6-biphosphatase 3, hexokinase 2, glycogen phosphorylase, 2,3-bisphosphoglycerate mutase, hexokinase 3, glucose-6-phosphate isomerase, 6-phosphofructo-2-kinase/fructose-2,6-biphosphatase 2, glyceraldehyde-3-phosphate dehydrogenase, enolase 1, and phosphoglycerate kinase 1. In addition, pyruvate dehydrogenase kinase, which prevents the conversion of pyruvate to acetyl-CoA, was upregulated. Pyruvate dehydrogenase phosphatase, which facilitates the conversion of pyruvate to acetyl-CoA to enter the aerobic citric acid cycle, was downregulated in sepsis. Therefore, the retention of pyruvate can facilitate lactate formation in the anaerobic pathway during sepsis.
Concurrently, H+-ATPases were upregulated in sepsis (Table 11). In a previous article, we determined the coupling between glycolytic enzymes and H+-ATPases during falciparum malarial infection. Consistently, this study also revealed upregulated expression of H+-ATPases, including ATP6V0B, ATP6V0E1, ATP6AP2, ATP6V1C1, TCIRG1, ATP6V1D, ATP11B, and ATP11A. In addition, carbonic anhydrases IV and II (CA4 and CA2), which produce H2CO3, were upregulated in sepsis. This can help explain acidosis during sepsis.

3.8. Failure of T-Lymphocyte Adaptive Immunity During Sepsis

Lymphocytes play important roles in adaptive immunity. In sepsis, the major lymphocyte populations, including T and B cells, were downregulated. Thus, adaptive lymphocyte immunity is not induced during sepsis. This is very important in the pathogenesis of sepsis.
Many T cell-related genes were also downregulated (Table 12). These downregulated genes included those associated with TCR (TRAC, TARP, TRBC1/C2, TRD@, TRGC2, and TRDV3), CD costimulatory molecules (CD3E, CD8A, CD3G, LY9, CD3D, and CD2), T cell-specific transcription factors (IKZF1, TCF7, NFAT5, NFATC3, TCF7L2, NFATC2IP, TBX21, ID2, and ID2B), granzyme/perforin (GZMA, GNLY, GZMK, GZMB, GZMH, and PRF1), and TCR downstream signaling (ZAP70 and LCK) [29]. Thus, the entire T cell activation machinery is suppressed. Both CD4 helper T cells and CD8+ cytotoxic T cells are inactivated and downregulated in patients with sepsis.

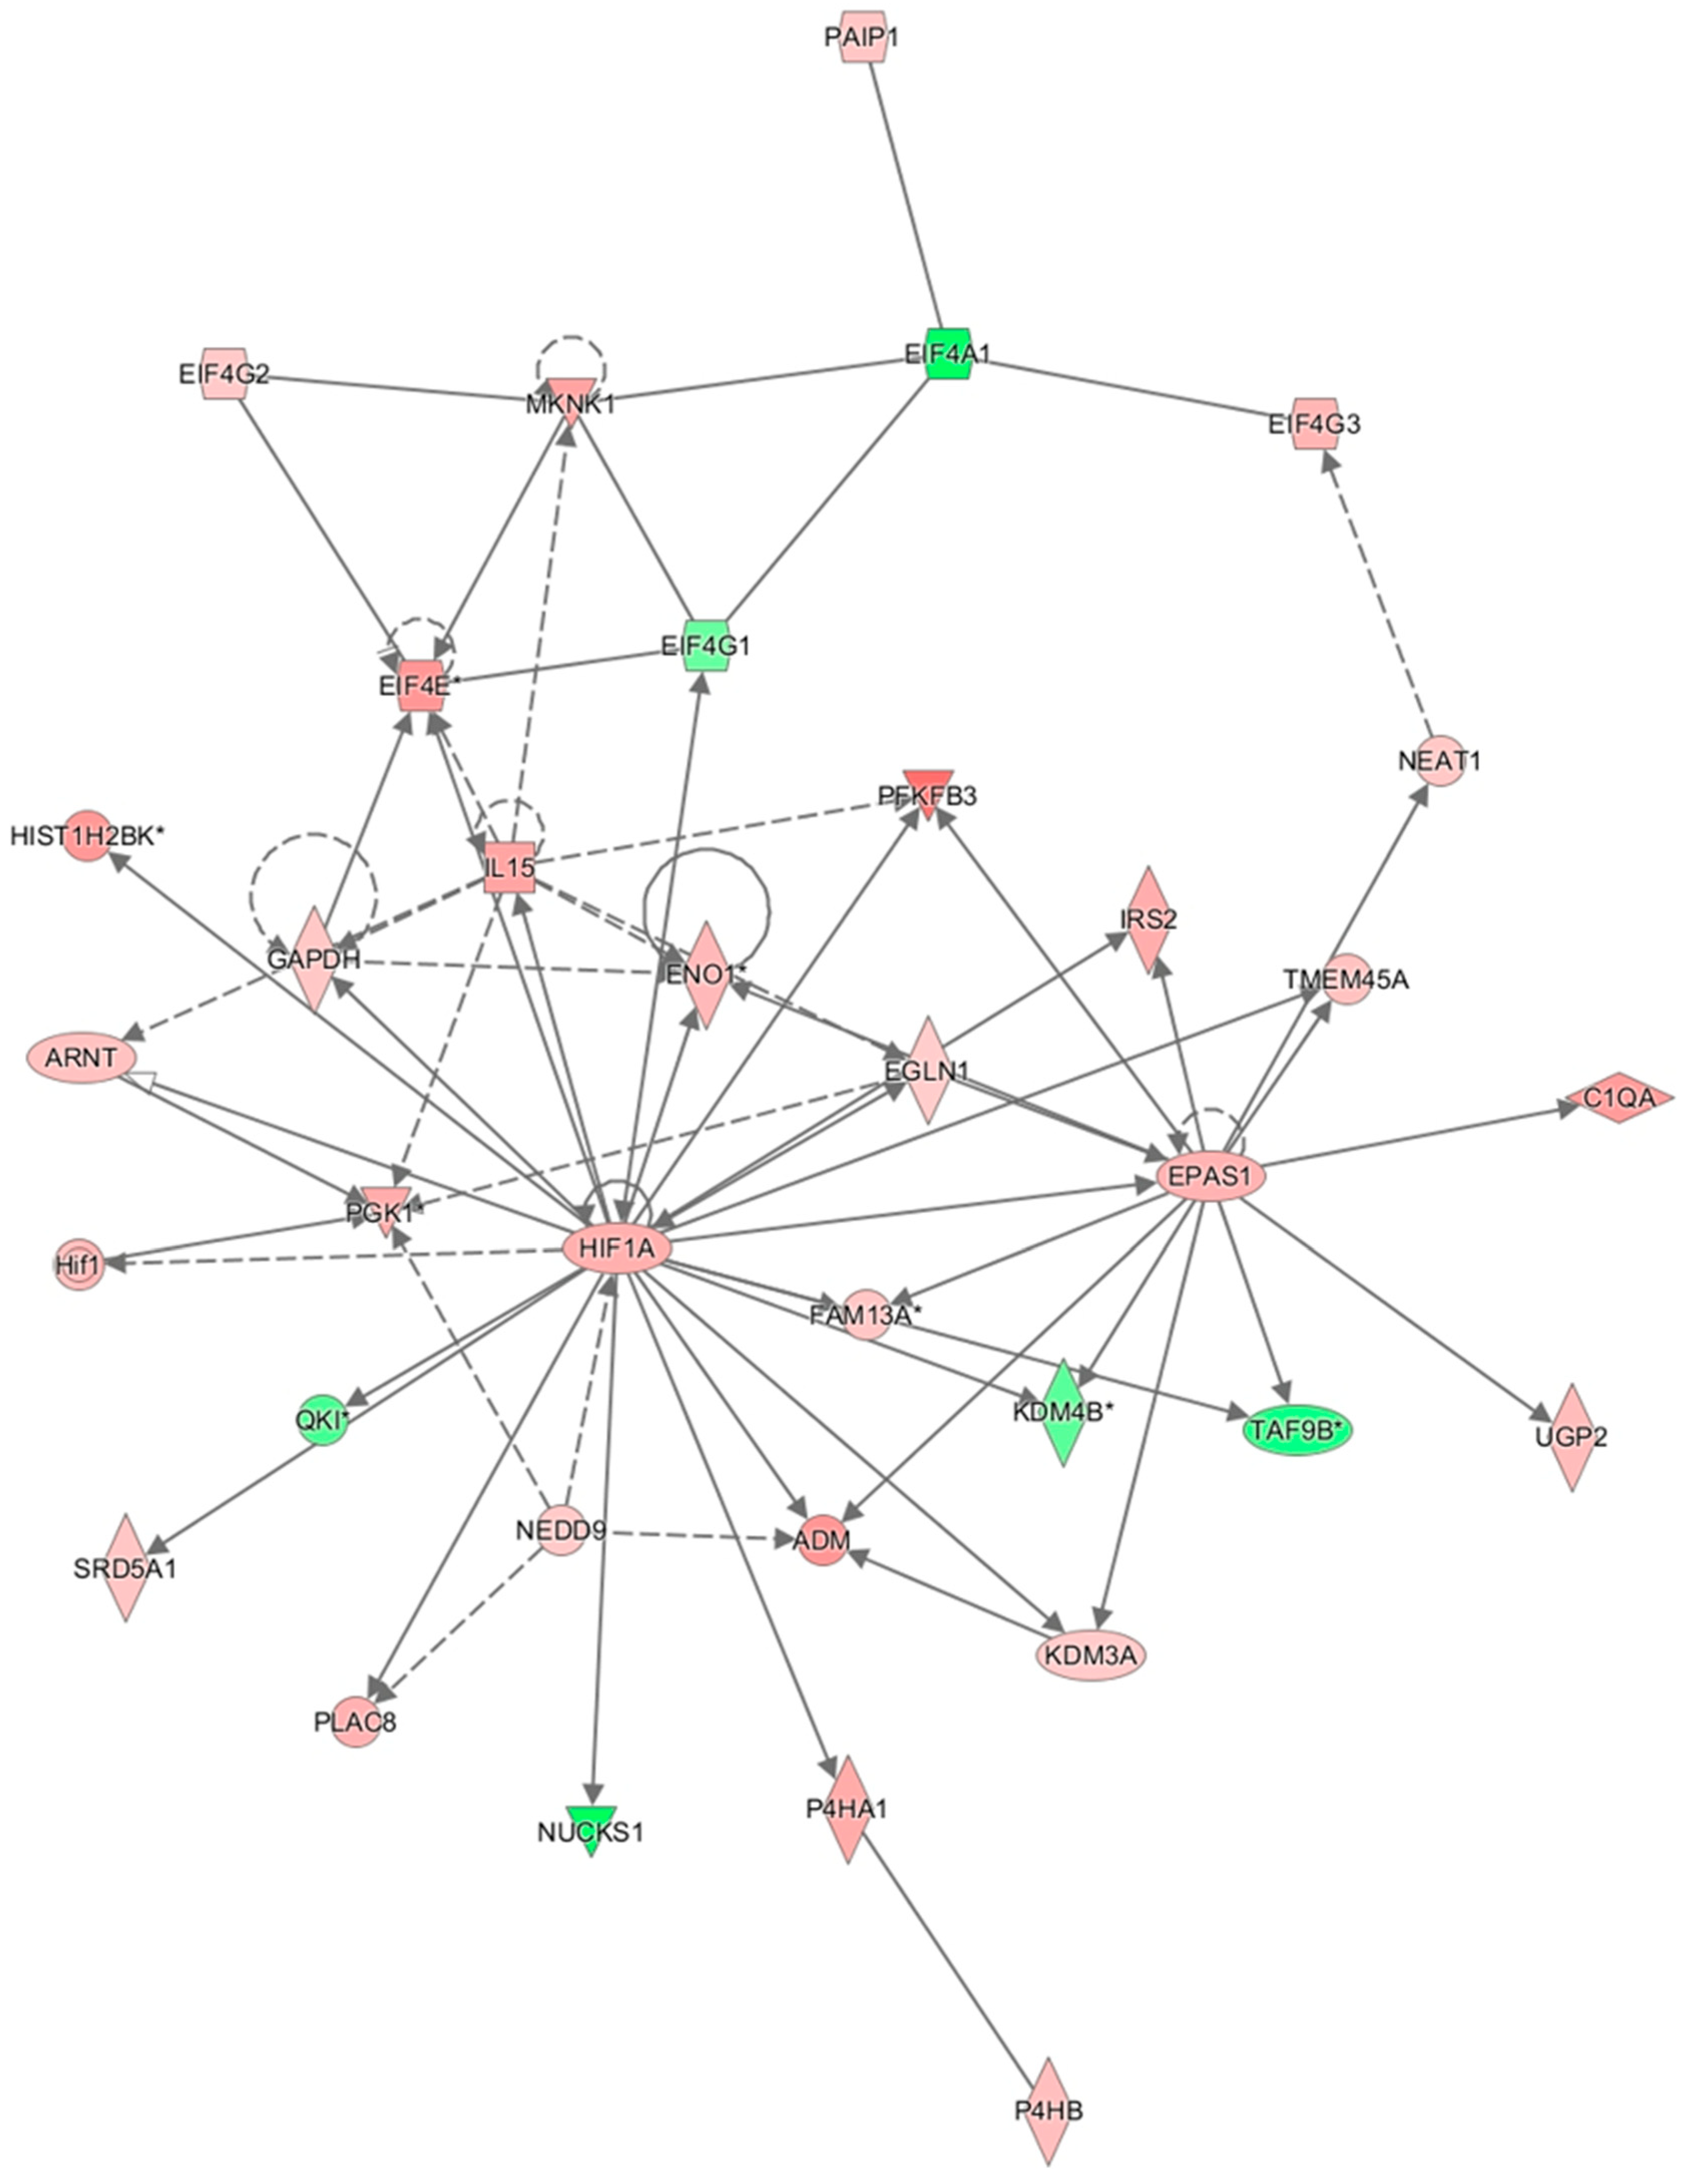
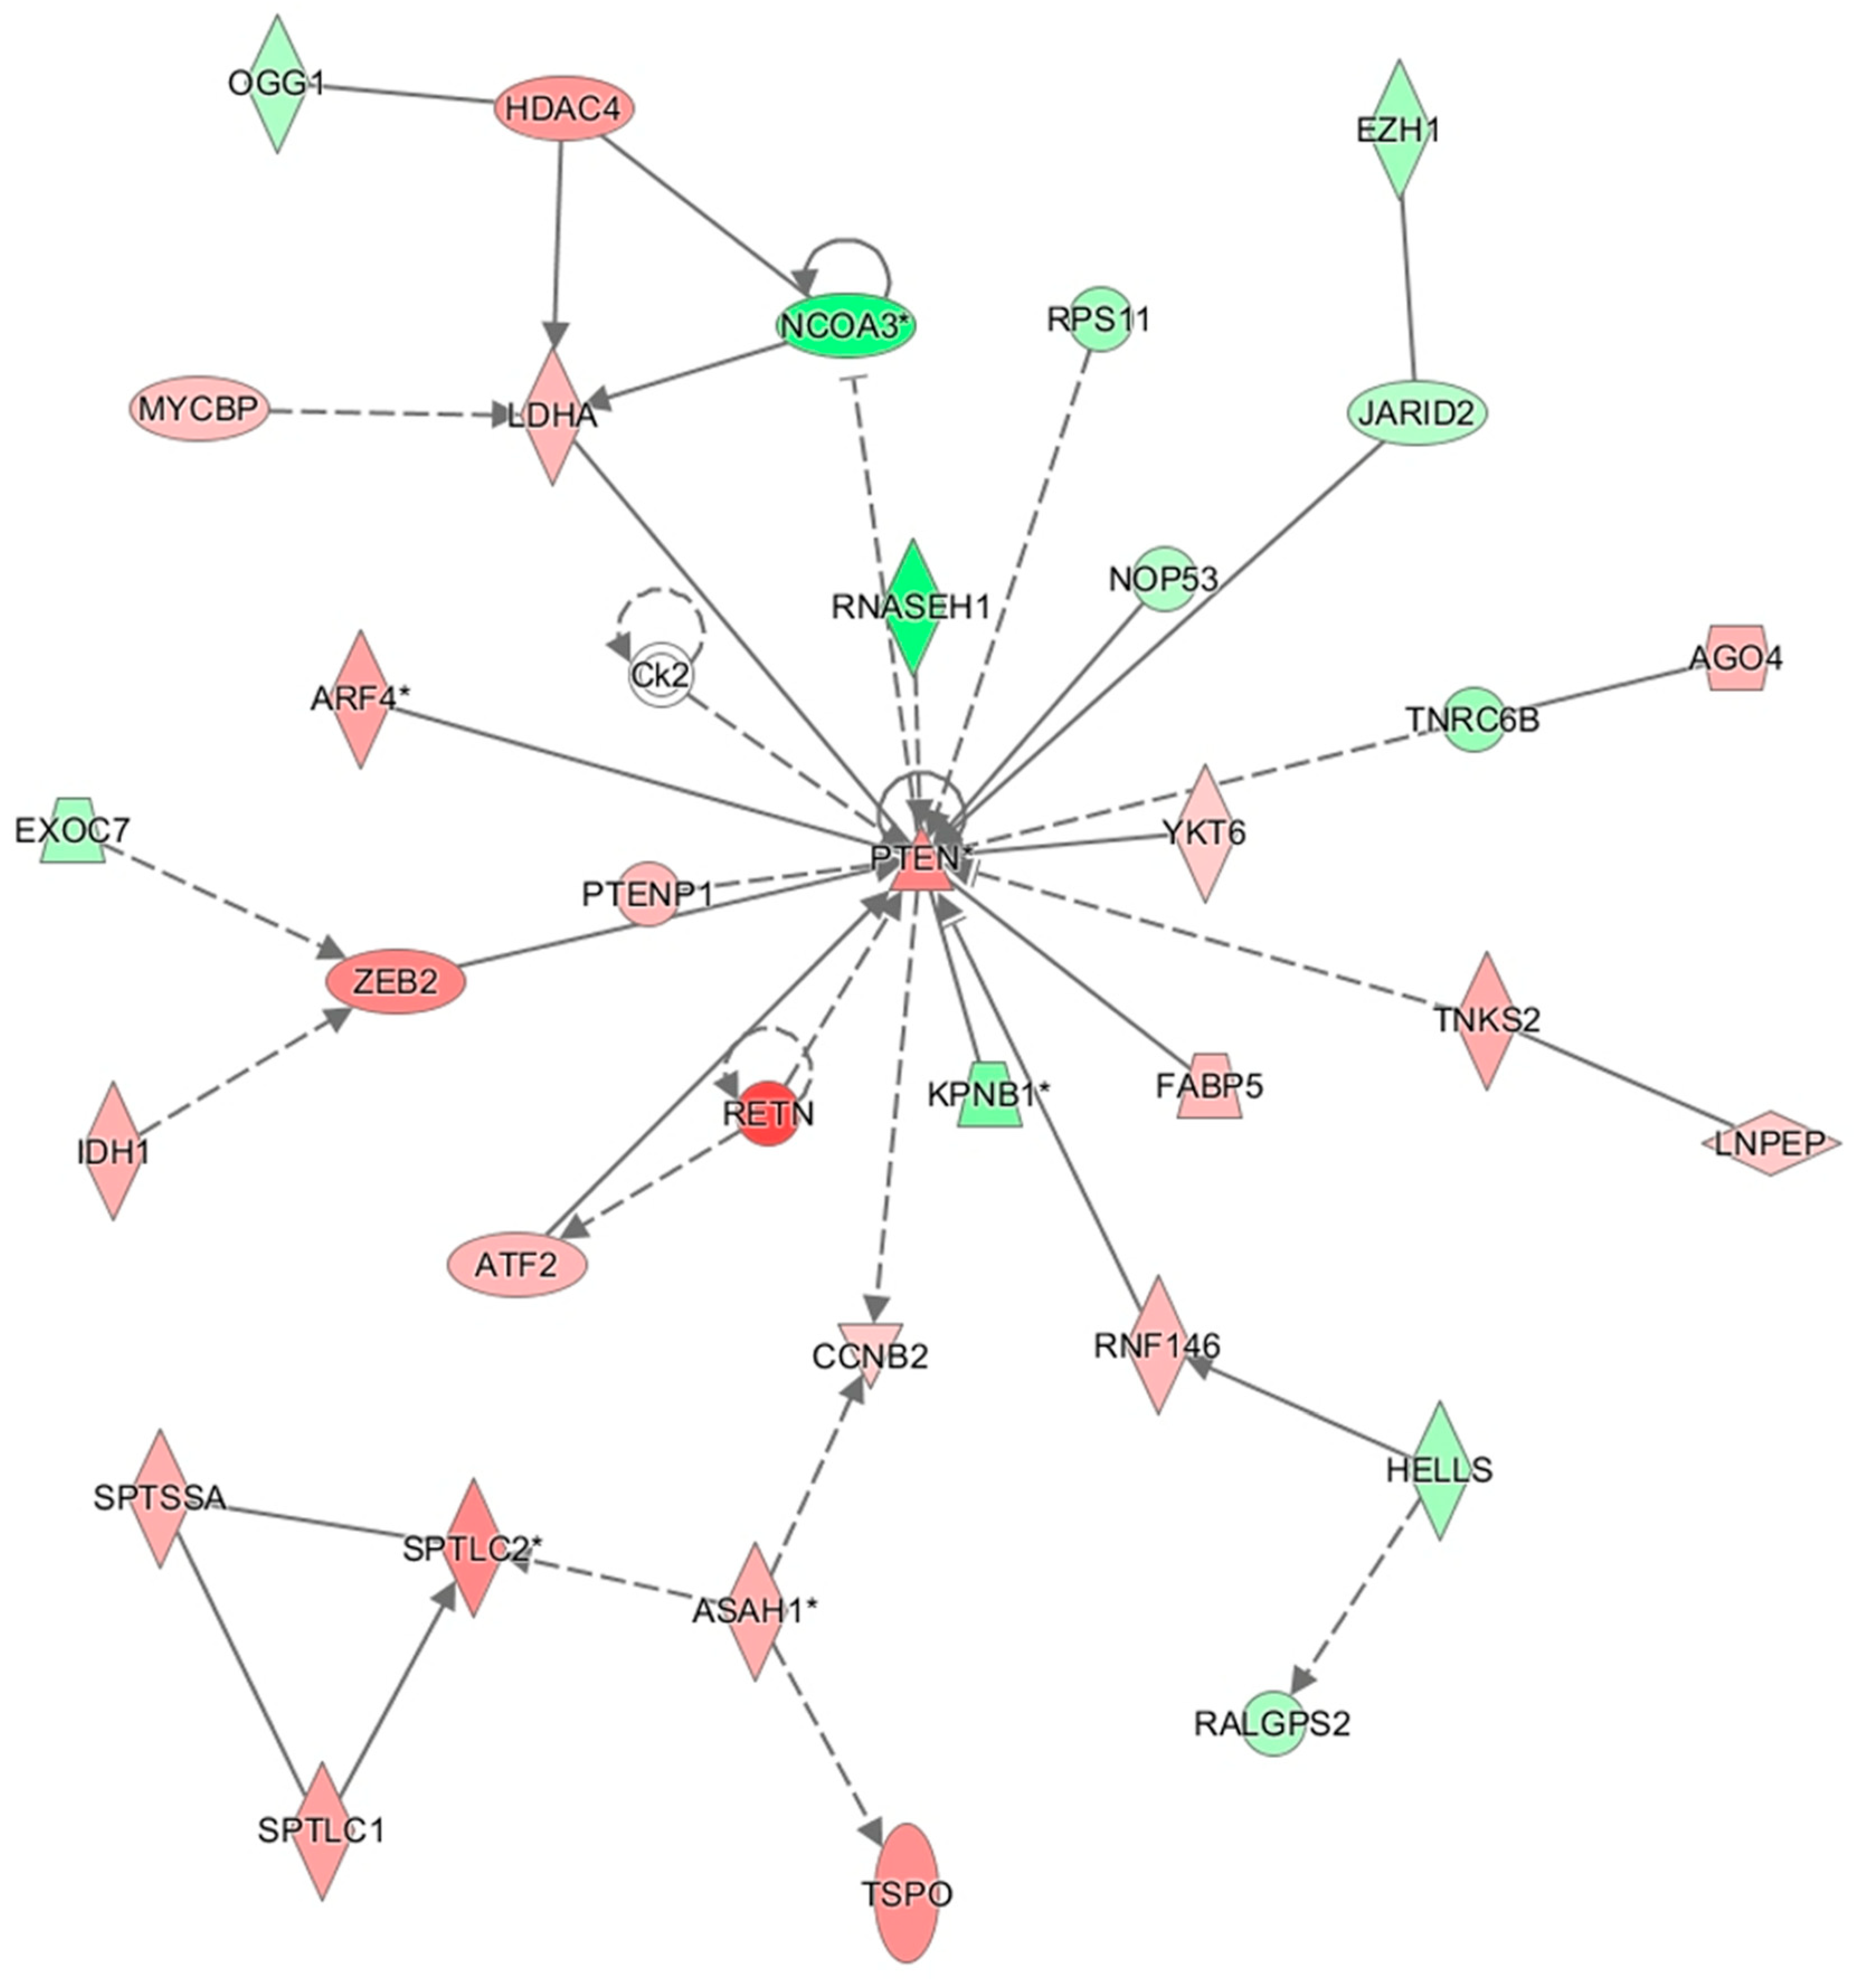
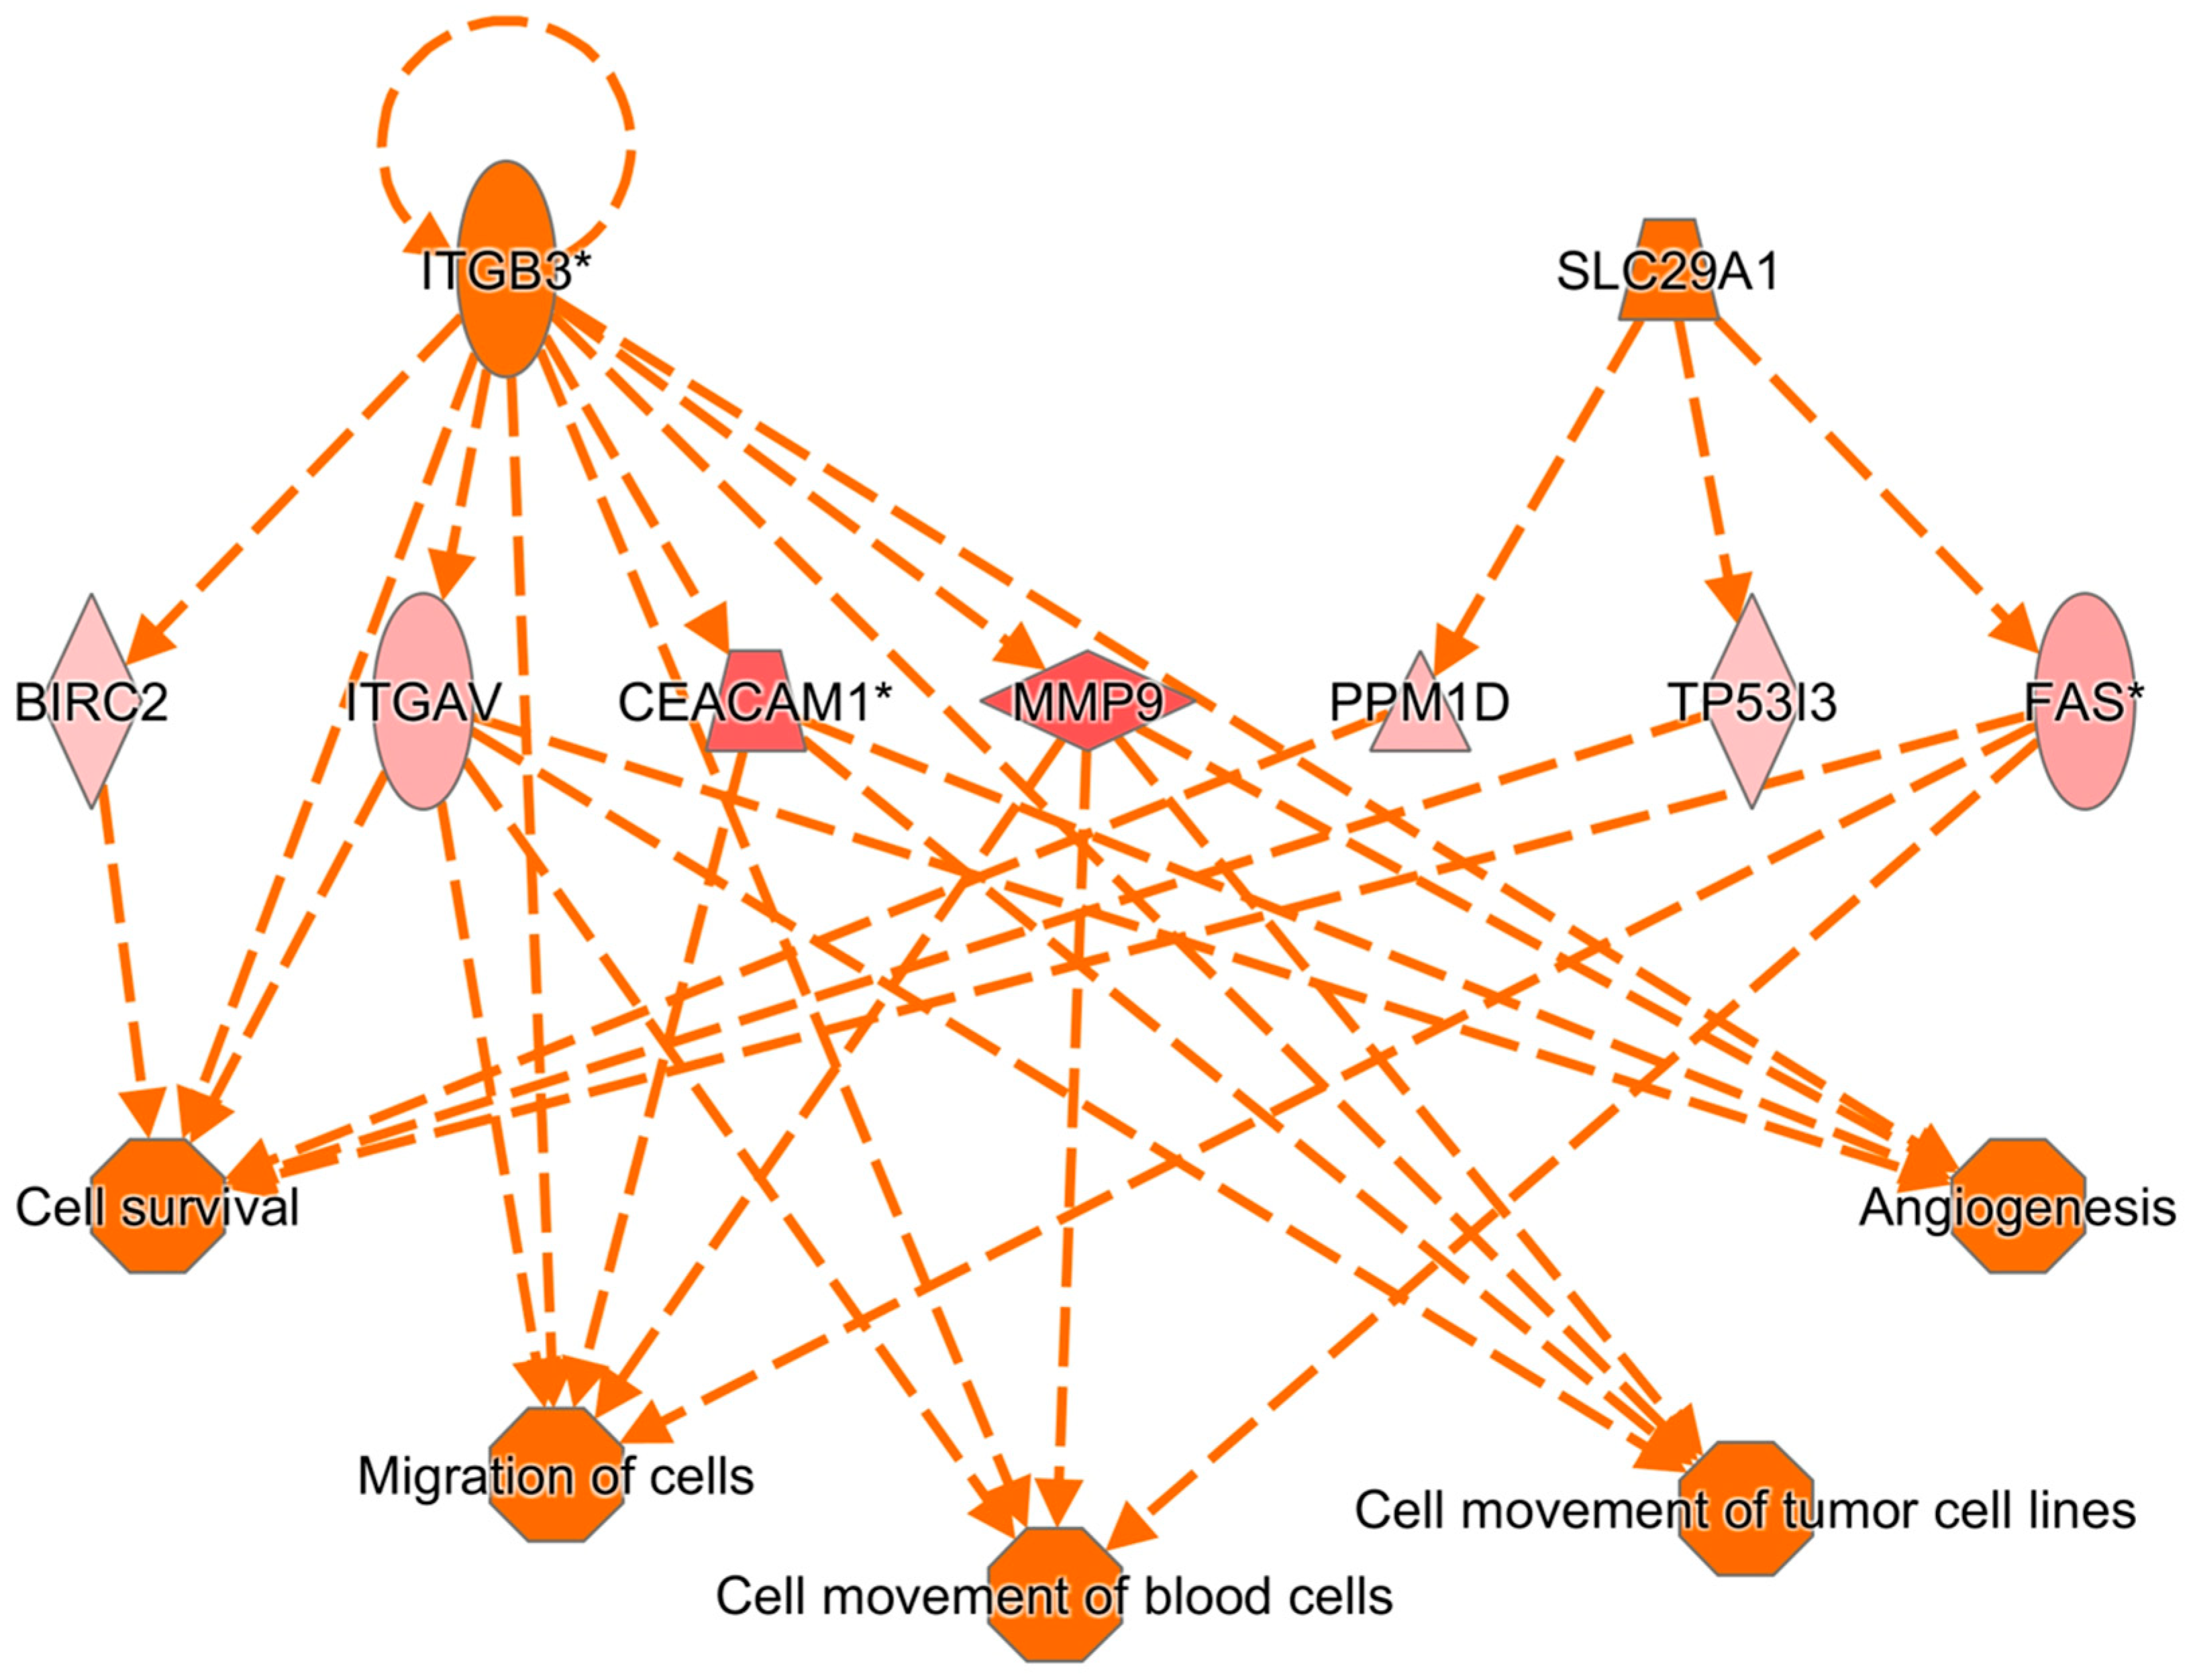
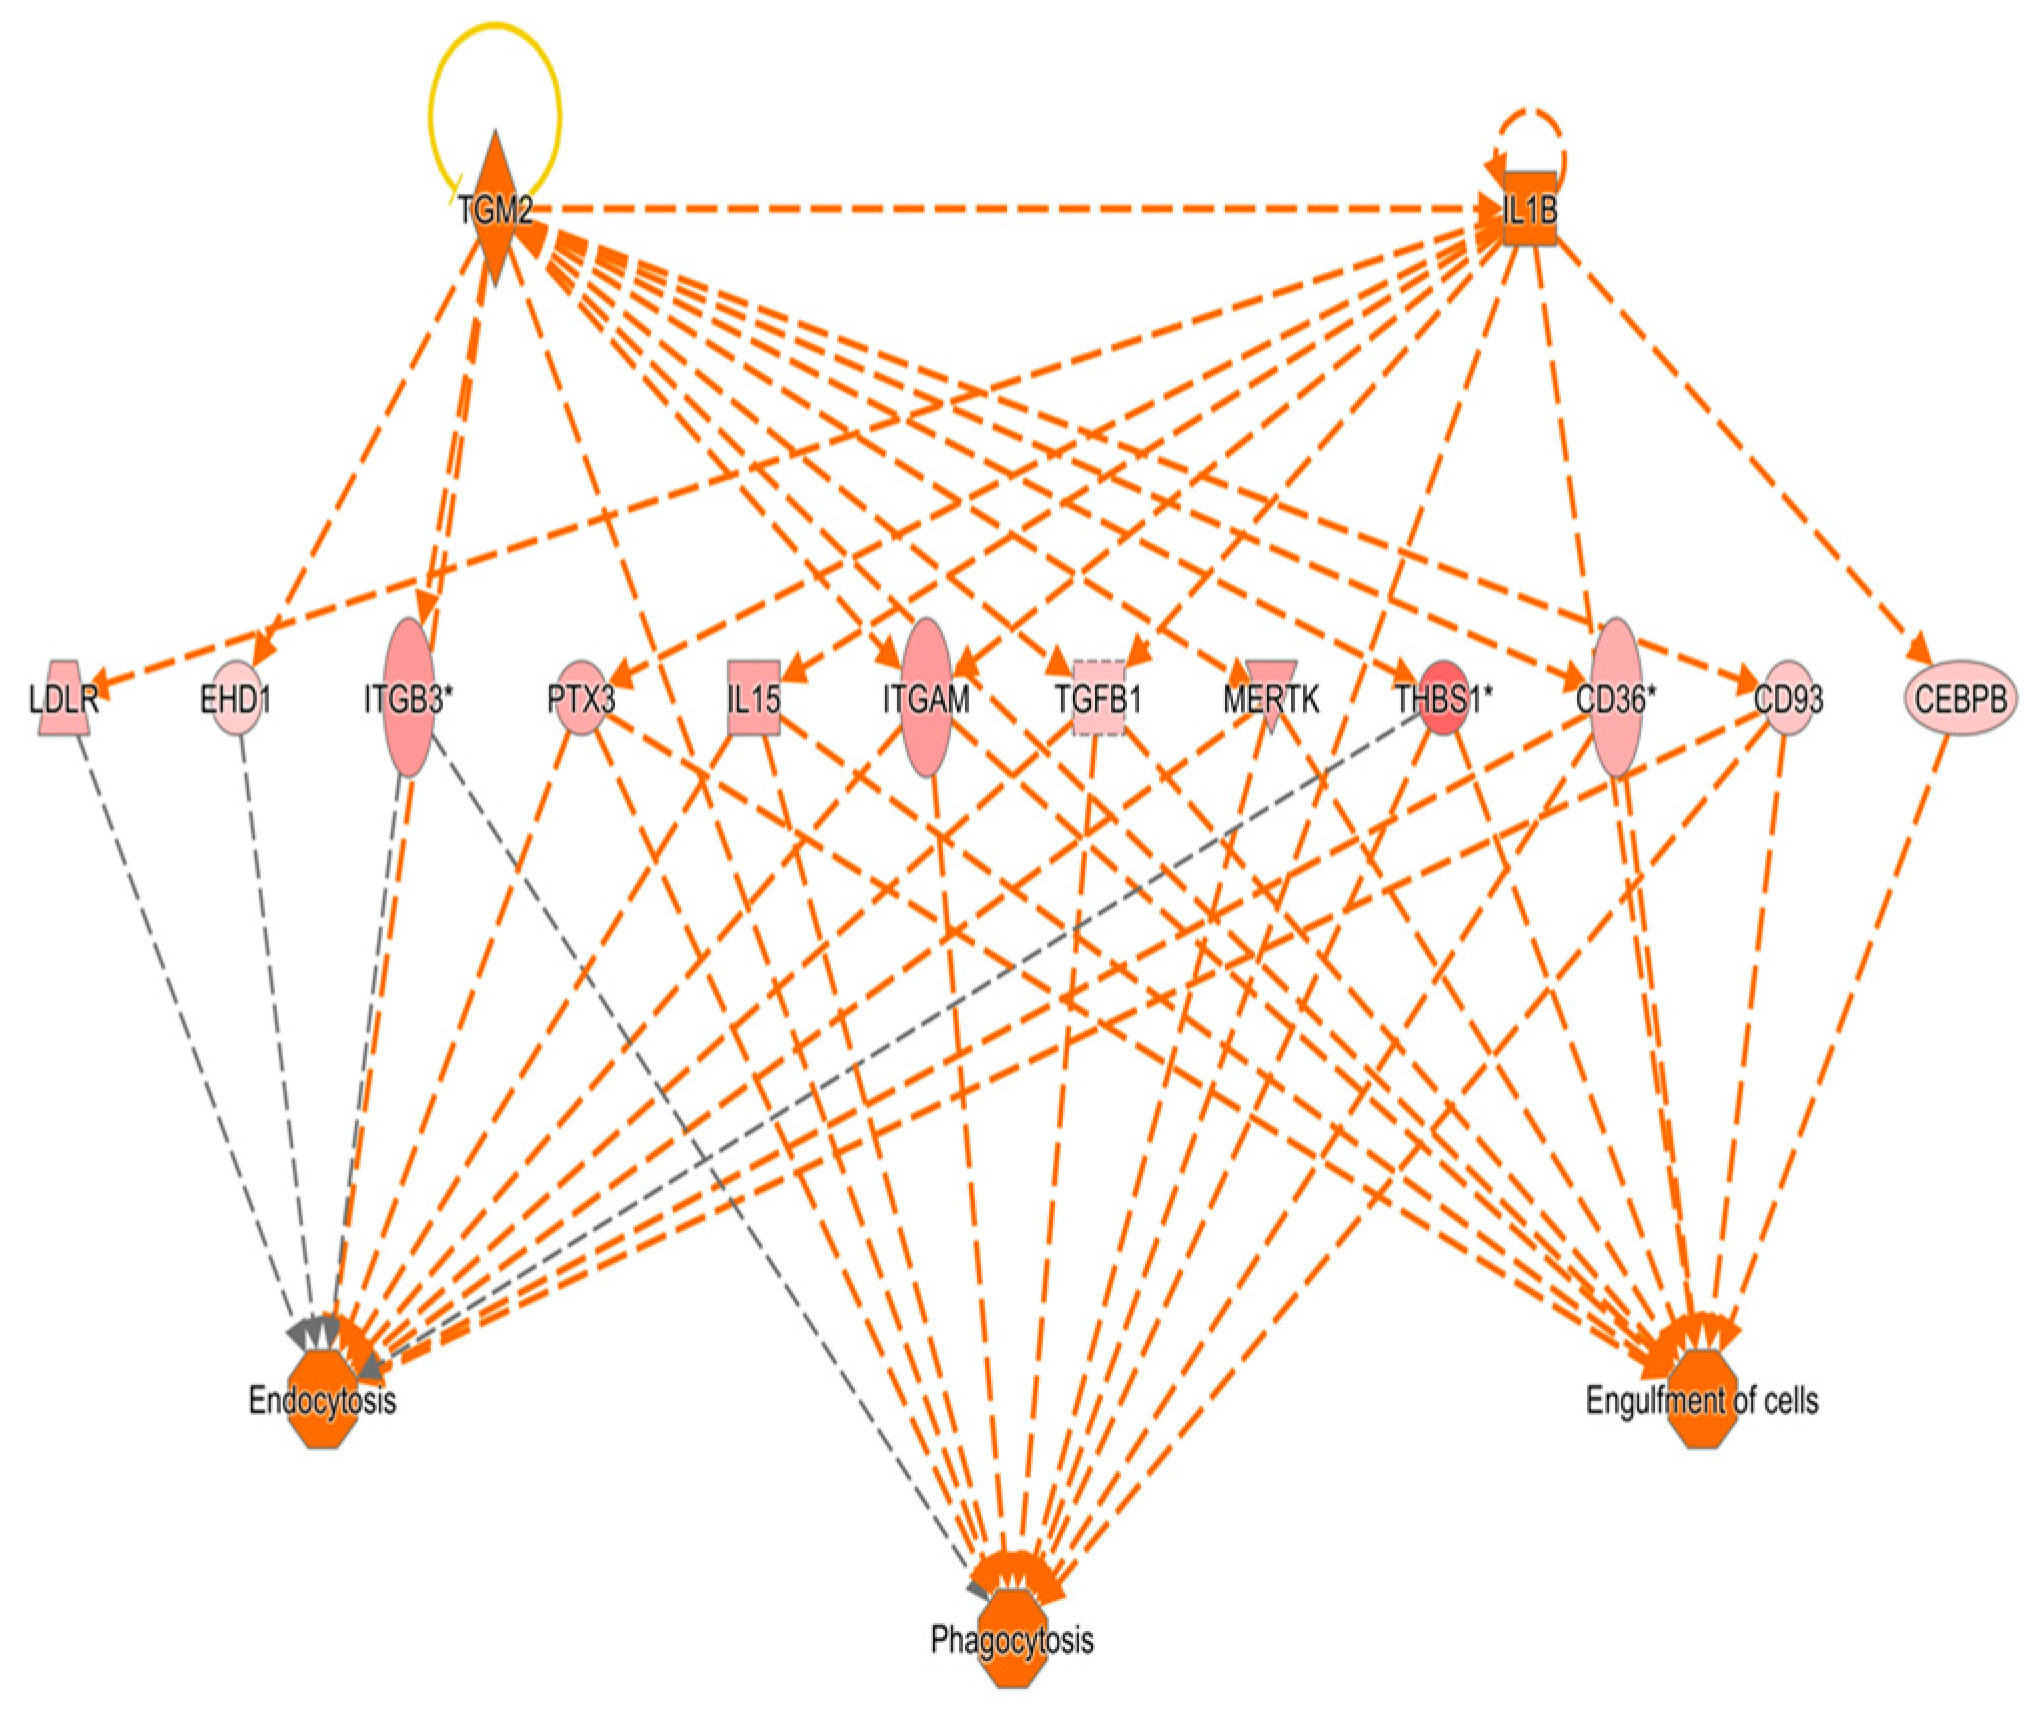
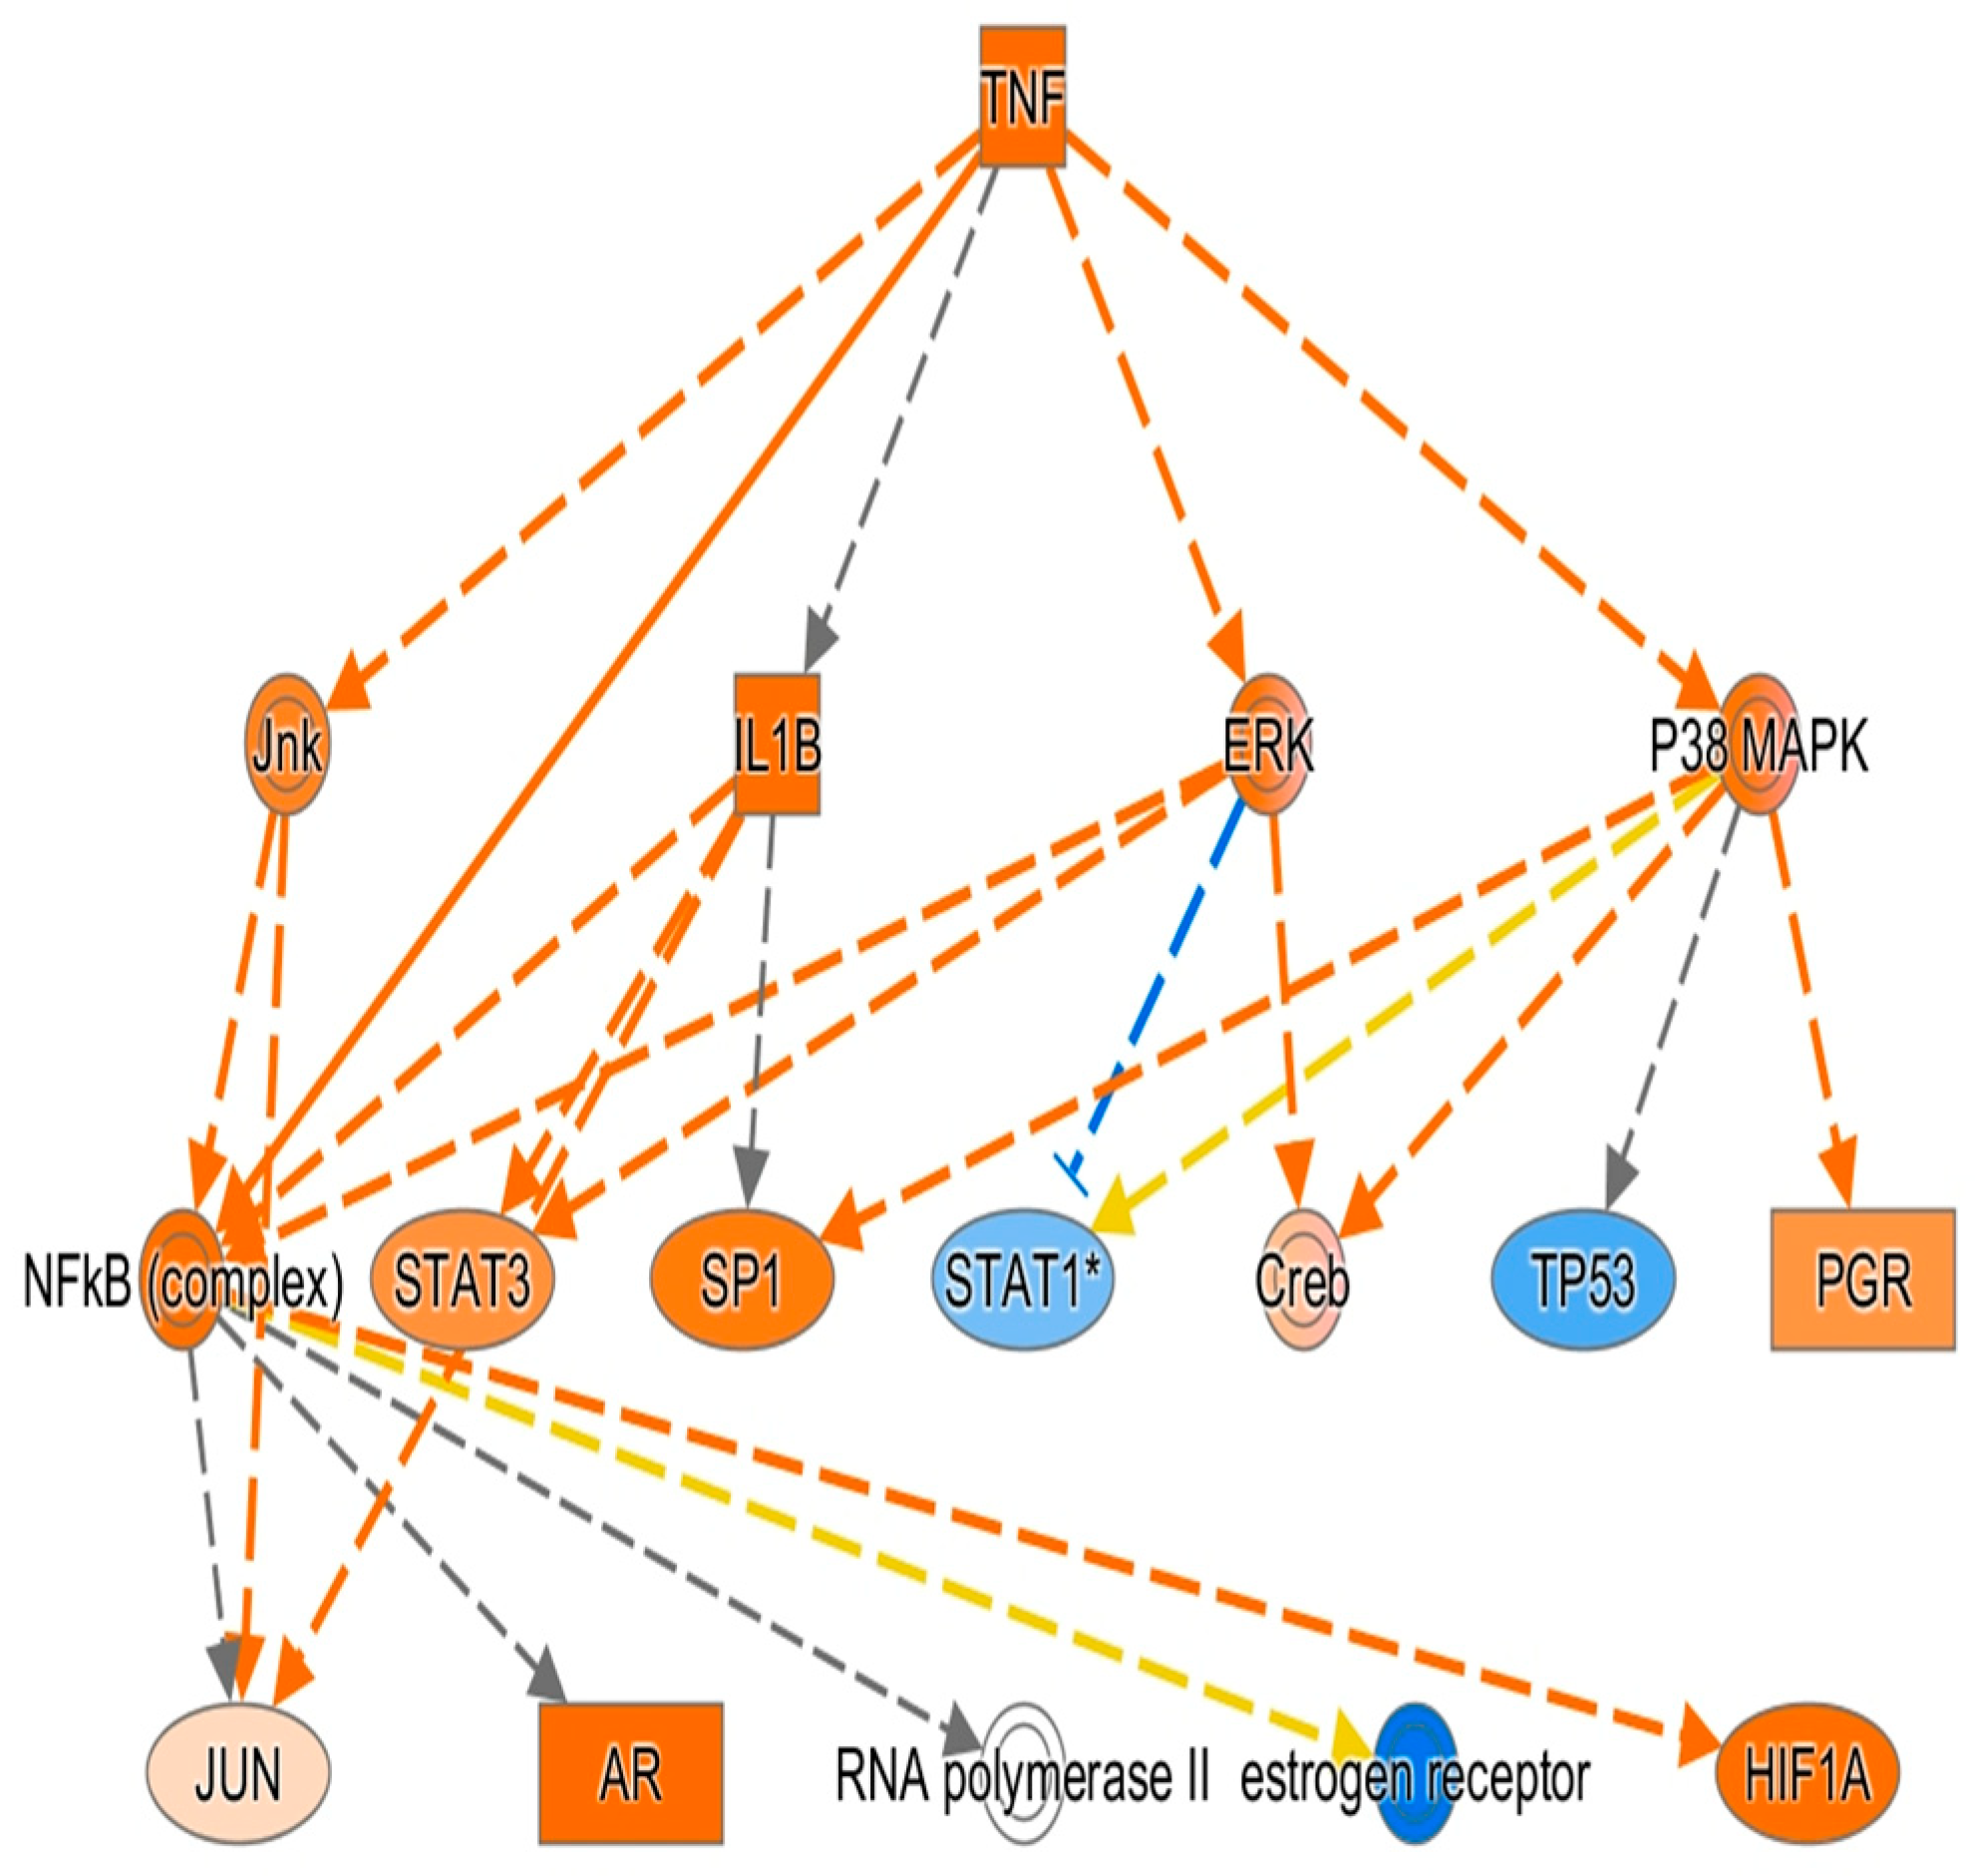
3.9. Results of Ingenuity Pathway Analysis

In the network analysis, the most over-represented network was the HIF1A-centered network, and the second-most over-represented network was the PTEN-centered network (Figure 1 and Figure 2). Sepsis is related to tissue hypoxia, and PTEN is related to immunosuppression. In Figure 3 and Figure 4, the top regulator effector networks are shown, including ITGB3, IL1B, and TGFB. ITGB3 and IL1B play important roles in innate immunity. TGFB also plays an important role in immunosuppression. TGFB is located at the center of the regulator effector network. Therefore, both innate immunity and immunosuppression are important in the pathogenesis of sepsis. As shown in Figure 5, the upstream regulator identified in sepsis was TNF, which also suggests that innate immunity is key to the pathophysiology of sepsis.

4. Discussion

Despite current antibiotic treatments, sepsis has a high mortality rate. However, its pathophysiology remains unclear [30,31]. The dominant theory regarding the mechanism of sepsis is the hyperimmune theory [32]. Hyperimmunity with a cytokine storm was observed in sepsis by Dr. Lewis Thomas [33]. He suggested that the symptoms and signs of sepsis were due to the overactivity of proinflammatory cytokines. This theory has been widely accepted. Based on the hyperimmune theory, many therapeutic strategies have been developed. The most well-known approach is the use of anti-TNF agents in clinical trials of sepsis. Because the proinflammatory cytokine TNFα is upregulated in sepsis, the use of anti-TNF agents should have contributed to the control of sepsis. However, the opposite results were observed. The use of anti-TNF agents has been shown to increase the mortality rate associated with sepsis [2,34,35]. This casts doubts over the sepsis hyperimmune theory.
Other theories on sepsis pathophysiology have also emerged, notably the hypoimmune theory. Because immunocompromised patients are prone to developing sepsis, hypoimmunity may be a cause of sepsis [36]. In addition, massive effector lymphocyte apoptosis, depletion of dendritic cells, and elevated Tregs have been observed during sepsis [37,38,39,40,41]. In previous reports, the downregulation of costimulatory molecules and MHC was noted in patients with sepsis [42]. In addition, B cells play important roles in the recovery from sepsis [43]. However, this hypothesis has not been accepted by most scientists because it does not explain the observed cytokine storm during sepsis. Thus, both theories are supported by some evidence and yet are only partially correct.
Thus, a third theory was proposed—the sequence theory. According to this theory, hyperimmunity occurs first during sepsis, followed by hypoimmunity. This theory attempts to integrate the two theories. However, it is unclear why such a sequential immune response occurs, and there is no existing immunological mechanism to explain this sequential effect. Why does hyperimmunity occur first, and why does hyperimmunity change into hypoimmunity? Furthermore, how do immunodeficient patients easily develop sepsis, and how do these patients easily develop a hyperimmune response initially? The current sepsis theory cannot explain this phenomenon.
In this study, we used microarray analysis to demonstrate that sepsis is characterized by hyperactivity of innate immunity and hypoactivity of adaptive immunity. This can explain the coexistence of hyperimmunity and hypoimmunity. Hypoactivity of adaptive immunity explains why immunocompromised patients tend to easily develop sepsis, while hyperactivity of innate immunity explains why a proinflammatory cytokine storm is observed in sepsis. Adaptive immune dysfunction, with a lack of T helper cells, is the key to the pathogenesis of sepsis. TH22 cells mediate eradicable immunity against extracellular bacteria, whereas TH17 cells mediate tolerable immunity against extracellular bacteria. Thus, blocking TH22-related cytokines, such as TNFα, can inhibit the further generation of TH22 helper cells to initiate adaptive immunity to combat or eradicate extracellular bacteria. This can explain why TNF blockade increases the mortality rate of patients with sepsis.
Previous studies have shown that TH22 immunity can successfully combat sepsis [44,45,46]. TH17 immunity comprises both IL-17-dominant proinflammatory cytokines and the TGF-β-dominant regulatory T cells. Thus, sepsis cannot activate host-eradicable immunity to completely kill the bacteria. On the other hand, sepsis triggers host-tolerable immunity with hyperimmune cytokine storms and hypoimmune TGF-β. The upregulation of TGF-β can cause multiorgan failure by promoting tissue fibrosis [11]. This explains why sepsis is usually associated with multiorgan failure. It is hypothesized that the TH17/Treg ratio determines the severity of sepsis [13,47]. However, this is unlikely because the TH17 immune response itself already includes a Treg cell component. TH17 is initiated by TGF-β plus IL-6 or other proinflammatory cytokines. It is possible that these pathogenic bacteria trigger the host TH17 rather than TH22 immunity. Importantly, eradicable TH22 immunity needs to be successfully induced to completely destroy extracellular bacteria.
This microarray study provided evidence to support our theory. Whole blood samples from patients with sepsis reflected leukocyte expression patterns. Innate immunity-related genes were significantly upregulated. These genes included CD14, TLR1, 2, 4, 5, and 8, HSP70, CEBP, AP1 (JUNB and FOSL2), TGFB1, IL6, TGFA, CSF2 receptor, FPR2, amyloid proteins, pentraxin, defensins, CLEC5A, whole complement machinery, CPD, NCF, MMP, and neutrophil elastase. We also found that the majority of adaptive immunity genes were downregulated, including MHC-related genes, TCR genes, granzymes/perforin, CD40, CD8, CD3, TCR signaling, BCR signaling, T and B cell-specific transcription factors, and TH22 helper-specific transcription factors (STAT3, RORA, and REL). In addition, Treg-related genes were upregulated, including TGFB, IL15, STAT5B, SMAD2/4, CD36, and thrombospondin. Upregulation of regulatory cells during sepsis has also been reported previously. Upregulation of Treg-related genes can also suppress adaptive immunity during sepsis. These findings support the proposed theory of sepsis pathogenesis. This analysis confirmed a two-hit model of sepsis. The first hit triggers over-activated innate immunity. The second hit suppresses MHC and T helper cells to upregulate immunosuppression by regulatory T cells. This study provides further insight into the pathophysiology of sepsis.
Sepsis is also associated with several complications, such as disseminated intravascular coagulation (DIC), hypotension/shock, and lactate acidosis [48]. In this microarray analysis, we found that many coagulation-related genes were upregulated during sepsis. including F5, F8, facto13, protein S, plasminogen receptor, ITGA2B, ITGB3, and thrombomodulin. This may help explain the mechanism of DIC during sepsis. The entire set of glycolytic enzymes, including LDHA, PGK1, PKM2, PFKFB3, HK2, PYGL, BPGM, HK3, PDK3, GPI, PFKFB2, GAPDH, and ENO1, were upregulated during sepsis. In addition, glycolytic enzyme-coupled H+-ATPase genes were upregulated. These findings explain the lactate acidosis observed during sepsis.
Bacteria have strategies to suppress host immunity for their survival, especially adaptive immunity [49]. In conclusion, after understanding the pathogenesis of sepsis, better preventive and therapeutic agents can be developed to control this disease. Impairment of adaptive immunity may be more important than the overactivation of innate immunity during sepsis. Medications to activate host adaptive immunity, such as T helper cells, can be potentially used to combat sepsis. In addition, therapeutic strategies can be developed to cope with sepsis-related complications, such as DIC and lactate acidosis. Hopefully, a day will come when sepsis will be overcome.
The limitation of this study is due to its methodology. First, the patient numbers are limited because of the original dataset collection from the Gene Expression Omnibus. A larger sample size in future work may help to confirm the analytic results of this study. Second, because this study is purely a microarray study, it can only reflect the functional genomic changes during sepsis. No DNA or protein data were used in this analysis. If we want to further confirm this research, we will need more methodological approaches, including proteomics research. This can be the future research direction of our research group. However, the RNA data from this microarray functional genomic analysis are still very informative. We believe this analysis can shed light on the pathogenesis of sepsis. However, because of the complexity of sepsis, we need more evaluations to further support this theory.

Author Contributions

Validation, C.-P.L. and W.-C.H.; Formal analysis, Y.-J.C.; Investigation, J.-J.L.; Writing—original draft, Y.-J.C. and J.-J.L.; Writing—review & editing, W.-C.H.; Supervision, C.-P.L. All authors have read and agreed to the published version of the manuscript.

Funding

The research received funding from Taipei Tzu Chi Hospital with grant numbers: TCRD-TPE-111-14, TCRD-TPE-112-05, and TCRD-TPE-113-09.

Informed Consent Statement

Not applicable.

Data Availability Statement

Data is contained within the article.

Acknowledgments

We thank J. A. Howrylak for providing the sepsis microarray dataset. We also thank the publicly available Gene Expression Omnibus website. We are also very grateful to the National Taiwan University microarray core for performing the ingenuity pathway analysis.

Conflicts of Interest

The authors declare no conflicts of interest.

References

  1. Abraham, E.; Anzueto, A.; Gutierrez, G.; Tessler, S.; San Pedro, G.; Wunderink, R.; Dal Nogare, A.; Nasraway, S.; Berman, S.; Cooney, R.; et al. Double-blind randomised controlled trial of monoclonal antibody to human tumour necrosis factor in treatment of septic shock. NORASEPT II Study Group. Lancet 1998, 351, 929–933. [Google Scholar] [CrossRef] [PubMed]
  2. Fisher, C.J., Jr.; Agosti, J.M.; Opal, S.M.; Lowry, S.F.; Balk, R.A.; Sadoff, J.C.; Abraham, E.; Schein, R.M.; Benjamin, E. Treatment of septic shock with the tumor necrosis factor receptor:Fc fusion protein. The Soluble TNF Receptor Sepsis Study Group. N. Engl. J. Med. 1996, 334, 1697–1702. [Google Scholar] [CrossRef] [PubMed]
  3. Opal, S.M.; Fisher, C.J., Jr.; Dhainaut, J.F.; Vincent, J.L.; Brase, R.; Lowry, S.F.; Sadoff, J.C.; Slotman, G.J.; Levy, H.; Balk, R.A.; et al. Confirmatory interleukin-1 receptor antagonist trial in severe sepsis: A phase III, randomized, double-blind, placebo-controlled, multicenter trial. The Interleukin-1 Receptor Antagonist Sepsis Investigator Group. Crit. Care Med. 1997, 25, 1115–1124. [Google Scholar] [CrossRef] [PubMed]
  4. Reinhart, K.; Karzai, W. Anti-tumor necrosis factor therapy in sepsis: Update on clinical trials and lessons learned. Crit. Care Med. 2001, 29, S121–S125. [Google Scholar] [CrossRef]
  5. Hu, W.C. A Framework of All Discovered Immunological Pathways and Their Roles for Four Specific Types of Pathogens and Hypersensitivities. Front. Immunol. 2020, 11, 1992. [Google Scholar] [CrossRef]
  6. Hu, W.C. Human immune responses to Plasmodium falciparum infection: Molecular evidence for a suboptimal THαβ and TH17 bias over ideal and effective traditional TH1 immune response. Malar. J. 2013, 12, 392. [Google Scholar] [CrossRef] [PubMed]
  7. Chu, Y.T.; Liao, M.T.; Tsai, K.W.; Lu, K.C.; Hu, W.C. Interplay of Chemokines Receptors, Toll-like Receptors, and Host Immunological Pathways. Biomedicines 2023, 11, 2384. [Google Scholar] [CrossRef]
  8. Huang, Y.M.; Shih, L.J.; Hsieh, T.W.; Tsai, K.W.; Lu, K.C.; Liao, M.T.; Hu, W.C. Type 2 hypersensitivity disorders, including systemic lupus erythematosus, Sjögren’s syndrome, Graves’ disease, myasthenia gravis, immune thrombocytopenia, autoimmune hemolytic anemia, dermatomyositis, and graft-versus-host disease, are THαβ-dominant autoimmune diseases. Virulence 2024, 15, 2404225. [Google Scholar] [CrossRef]
  9. Lee, Y.H.; Tsai, K.W.; Lu, K.C.; Shih, L.J.; Hu, W.C. Cancer as a Dysfunctional Immune Disorder: Pro-Tumor TH1-like Immune Response and Anti-Tumor THαβ Immune Response Based on the Complete Updated Framework of Host Immunological Pathways. Biomedicines 2022, 10, 2497. [Google Scholar] [CrossRef]
  10. Lu, K.C.; Tsai, K.W.; Wang, Y.K.; Hu, W.C. Types of cell death and their relations to host immunological pathways. Aging 2024, 16, 11755–11768. [Google Scholar] [CrossRef]
  11. Lu, K.C.; Tsai, K.W.; Hu, W.C. Role of TGFβ-producing regulatory T cells in scleroderma and end-stage organ failure. Heliyon 2024, 10, e35590. [Google Scholar] [CrossRef] [PubMed]
  12. Wen, T.H.; Tsai, K.W.; Wu, Y.J.; Liao, M.T.; Lu, K.C.; Hu, W.C. The Framework for Human Host Immune Responses to Four Types of Parasitic Infections and Relevant Key JAK/STAT Signaling. Int. J. Mol. Sci. 2021, 22, 3310. [Google Scholar] [CrossRef] [PubMed]
  13. Liu, X.; Chen, L.; Peng, W.; Deng, H.; Ni, H.; Tong, H.; Hu, H.; Wang, S.; Qian, J.; Liang, A.; et al. Th17/Treg balance: The bloom and wane in the pathophysiology of sepsis. Front. Immunol. 2024, 15, 1356869. [Google Scholar] [CrossRef] [PubMed]
  14. Rendon, J.L.; Choudhry, M.A. Th17 cells: Critical mediators of host responses to burn injury and sepsis. J. Leukoc. Biol. 2012, 92, 529–538. [Google Scholar] [CrossRef]
  15. Howrylak, J.A.; Dolinay, T.; Lucht, L.; Wang, Z.; Christiani, D.C.; Sethi, J.M.; Xing, E.P.; Donahoe, M.P.; Choi, A.M. Discovery of the gene signature for acute lung injury in patients with sepsis. Physiol. Genom. 2009, 37, 133–139. [Google Scholar] [CrossRef]
  16. American College of Chest Physicians/Society of Critical Care Medicine Consensus Conference: Definitions for sepsis and organ failure and guidelines for the use of innovative therapies in sepsis. Crit. Care Med. 1992, 20, 864–874. [CrossRef]
  17. Rotunno, M.; Hu, N.; Su, H.; Wang, C.; Goldstein, A.M.; Bergen, A.W.; Consonni, D.; Pesatori, A.C.; Bertazzi, P.A.; Wacholder, S.; et al. A gene expression signature from peripheral whole blood for stage I lung adenocarcinoma. Cancer Prev. Res. 2011, 4, 1599–1608. [Google Scholar] [CrossRef]
  18. Docke, W.D.; Randow, F.; Syrbe, U.; Krausch, D.; Asadullah, K.; Reinke, P.; Volk, H.D.; Kox, W. Monocyte deactivation in septic patients: Restoration by IFN-gamma treatment. Nat. Med. 1997, 3, 678–681. [Google Scholar] [CrossRef]
  19. Kim, H.; Seed, B. The transcription factor MafB antagonizes antiviral responses by blocking recruitment of coactivators to the transcription factor IRF3. Nat. Immunol. 2010, 11, 743–750. [Google Scholar] [CrossRef]
  20. Ho, I.C.; Lo, D.; Glimcher, L.H. c-maf promotes T helper cell type 2 (Th2) and attenuates Th1 differentiation by both interleukin 4-dependent and -independent mechanisms. J. Exp. Med. 1998, 188, 1859–1866. [Google Scholar] [CrossRef]
  21. Ruan, Q.; Kameswaran, V.; Zhang, Y.; Zheng, S.; Sun, J.; Wang, J.; DeVirgiliis, J.; Liou, H.C.; Beg, A.A.; Chen, Y.H. The Th17 immune response is controlled by the Rel-RORgamma-RORgamma T transcriptional axis. J. Exp. Med. 2011, 208, 2321–2333. [Google Scholar] [CrossRef] [PubMed]
  22. Asanuma, S.; Tanaka, J.; Sugita, J.; Kosugi, M.; Shiratori, S.; Wakasa, K.; Shono, Y.; Shigematsu, A.; Kondo, T.; Kobayashi, T.; et al. Expansion of CD4(+)CD25 (+) regulatory T cells from cord blood CD4(+) cells using the common gamma-chain cytokines (IL-2 and IL-15) and rapamycin. Ann. Hematol. 2011, 90, 617–624. [Google Scholar] [CrossRef] [PubMed]
  23. Cohen, A.C.; Nadeau, K.C.; Tu, W.; Hwa, V.; Dionis, K.; Bezrodnik, L.; Teper, A.; Gaillard, M.; Heinrich, J.; Krensky, A.M.; et al. Cutting edge: Decreased accumulation and regulatory function of CD4+ CD25(high) T cells in human STAT5b deficiency. J. Immunol. 2006, 177, 2770–2774. [Google Scholar] [CrossRef]
  24. Quintana, F.J.; Basso, A.S.; Iglesias, A.H.; Korn, T.; Farez, M.F.; Bettelli, E.; Caccamo, M.; Oukka, M.; Weiner, H.L. Control of T(reg) and T(H)17 cell differentiation by the aryl hydrocarbon receptor. Nature 2008, 453, 65–71. [Google Scholar] [CrossRef] [PubMed]
  25. Gonda, H.; Sugai, M.; Nambu, Y.; Katakai, T.; Agata, Y.; Mori, K.J.; Yokota, Y.; Shimizu, A. The balance between Pax5 and Id2 activities is the key to AID gene expression. J. Exp. Med. 2003, 198, 1427–1437. [Google Scholar] [CrossRef] [PubMed]
  26. Horikawa, K.; Nishizumi, H.; Umemori, H.; Aizawa, S.; Takatsu, K.; Yamamoto, T. Distinctive roles of Fyn and Lyn in IgD- and IgM-mediated signaling. Int. Immunol. 1999, 11, 1441–1449. [Google Scholar] [CrossRef]
  27. Kirstetter, P.; Thomas, M.; Dierich, A.; Kastner, P.; Chan, S. Ikaros is critical for B cell differentiation and function. Eur. J. Immunol. 2002, 32, 720–730. [Google Scholar] [CrossRef]
  28. Netea, M.G.; Azam, T.; Lewis, E.C.; Joosten, L.A.; Wang, M.; Langenberg, D.; Meng, X.; Chan, E.D.; Yoon, D.Y.; Ottenhoff, T.; et al. Mycobacterium tuberculosis induces interleukin-32 production through a caspase- 1/IL-18/interferon-gamma-dependent mechanism. PLoS Med. 2006, 3, e277. [Google Scholar] [CrossRef]
  29. Yang, C.Y.; Best, J.A.; Knell, J.; Yang, E.; Sheridan, A.D.; Jesionek, A.K.; Li, H.S.; Rivera, R.R.; Lind, K.C.; D’Cruz, L.M.; et al. The transcriptional regulators Id2 and Id3 control the formation of distinct memory CD8+ T cell subsets. Nat. Immunol. 2011, 12, 1221–1229. [Google Scholar] [CrossRef]
  30. Hotchkiss, R.S.; Karl, I.E. The pathophysiology and treatment of sepsis. N. Engl. J. Med. 2003, 348, 138–150. [Google Scholar] [CrossRef]
  31. Oberholzer, A.; Oberholzer, C.; Moldawer, L.L. Sepsis syndromes: Understanding the role of innate and acquired immunity. Shock 2001, 16, 83–96. [Google Scholar] [CrossRef]
  32. Girardin, E.; Grau, G.E.; Dayer, J.M.; Roux-Lombard, P.; Lambert, P.H. Tumor necrosis factor and interleukin-1 in the serum of children with severe infectious purpura. N. Engl. J. Med. 1988, 319, 397–400. [Google Scholar] [CrossRef]
  33. Thomas, L. Germs. N. Engl. J. Med. 1972, 287, 553–555. [Google Scholar] [CrossRef]
  34. Warren, H.S. Strategies for the treatment of sepsis. N. Engl. J. Med. 1997, 336, 952–953. [Google Scholar] [CrossRef]
  35. Zeni, F.; Freeman, B.; Natanson, C. Anti-inflammatory therapies to treat sepsis and septic shock: A reassessment. Crit. Care Med. 1997, 25, 1095–1100. [Google Scholar] [CrossRef]
  36. Ward, P.A. Immunosuppression in sepsis. JAMA 2011, 306, 2618–2619. [Google Scholar] [CrossRef]
  37. Kasten, K.R.; Tschop, J.; Adediran, S.G.; Hildeman, D.A.; Caldwell, C.C. T cells are potent early mediators of the host response to sepsis. Shock 2010, 34, 327–336. [Google Scholar] [CrossRef]
  38. Hein, F.; Massin, F.; Cravoisy-Popovic, A.; Barraud, D.; Levy, B.; Bollaert, P.E.; Gibot, S. The relationship between CD4+CD25+CD127-regulatory T cells and inflammatory response and outcome during shock states. Crit. Care 2010, 14, R19. [Google Scholar] [CrossRef]
  39. Ayala, A.; Chung, C.S.; Xu, Y.X.; Evans, T.A.; Redmond, K.M.; Chaudry, I.H. Increased inducible apoptosis in CD4+ T lymphocytes during polymicrobial sepsis is mediated by Fas ligand and not endotoxin. Immunology 1999, 97, 45–55. [Google Scholar] [CrossRef]
  40. Hotchkiss, R.S.; Tinsley, K.W.; Swanson, P.E.; Grayson, M.H.; Osborne, D.F.; Wagner, T.H.; Cobb, J.P.; Coopersmith, C.; Karl, I.E. Depletion of dendritic cells, but not macrophages, in patients with sepsis. J. Immunol. 2002, 168, 2493–2500. [Google Scholar] [CrossRef]
  41. Unsinger, J.; Herndon, J.M.; Davis, C.G.; Muenzer, J.T.; Hotchkiss, R.S.; Ferguson, T.A. The role of TCR engagement and activation-induced cell death in sepsis-induced T cell apoptosis. J. Immunol. 2006, 177, 7968–7973. [Google Scholar] [CrossRef] [PubMed]
  42. Manjuck, J.; Saha, D.C.; Astiz, M.; Eales, L.J.; Rackow, E.C. Decreased response to recall antigens is associated with depressed costimulatory receptor expression in septic critically ill patients. J. Lab. Clin. Med. 2000, 135, 153–160. [Google Scholar] [CrossRef] [PubMed]
  43. Kelly-Scumpia, K.M.; Scumpia, P.O.; Weinstein, J.S.; Delano, M.J.; Cuenca, A.G.; Nacionales, D.C.; Wynn, J.L.; Lee, P.Y.; Kumagai, Y.; Efron, P.A.; et al. B cells enhance early innate immune responses during bacterial sepsis. J. Exp. Med. 2011, 208, 1673–1682. [Google Scholar] [CrossRef]
  44. Hammer, A.M.; Morris, N.L.; Cannon, A.R.; Khan, O.M.; Gagnon, R.C.; Movtchan, N.V.; van Langeveld, I.; Li, X.; Gao, B.; Choudhry, M.A. Interleukin-22 Prevents Microbial Dysbiosis and Promotes Intestinal Barrier Regeneration Following Acute Injury. Shock 2017, 48, 657–665. [Google Scholar] [CrossRef] [PubMed]
  45. Liu, E.H.; Zheng, Z.N.; Xiao, C.X.; Liu, X.; Lin, X.Q. IL-22 relieves sepsis-induced liver injury via activating JAK/STAT3 signaling pathway. J. Biol. Regul. Homeost. Agents 2020, 34, 1719–1727. [Google Scholar] [CrossRef]
  46. Yu, C.; Ling, Q.; Jiao, J.; Liu, J.; Huang, Z.; Wang, F.; Sun, X.; Kong, X. Interleukin-22 protects from endotoxemia by inducing suppressive F4/80(+)Ly6G(hi)Ly6C(hi) cells population. BMC Immunol. 2022, 23, 45. [Google Scholar] [CrossRef]
  47. Wu, Y.; Wu, G.; Li, M.; Chang, Y.; Yu, M.; Meng, Y.; Wan, X. Prediction of Th17/Treg cell balance on length of stay in intensive care units of patients with sepsis. J. Intensive Med. 2024, 4, 240–246. [Google Scholar] [CrossRef]
  48. Naylor, J.M.; Kronfeld, D.S. In vivo studies of hypoglycemia and lactic acidosis in endotoxic shock. Am. J. Physiol. 1985, 248, E309–E316. [Google Scholar] [CrossRef]
  49. Hornef, M.W.; Wick, M.J.; Rhen, M.; Normark, S. Bacterial strategies for overcoming host innate and adaptive immune responses. Nat. Immunol. 2002, 3, 1033–1040. [Google Scholar] [CrossRef]
Figure 1. HIF-centered network in sepsis via ingenuity pathway analysis. Solid line means direct regulation and dot line means indirect regulation. * means this gene has high fold change value.
Cimb 47 00435 g001
Figure 2. PTEN-centered network for sepsis via ingenuity pathway analysis. Solid line means direct regulation and dot line means indirect regulation. * means this gene has high fold change value.
Cimb 47 00435 g002
Figure 3. ITGB3- and MMP9-dominant regulatory pathways in sepsis via ingenuity pathway analysis. Arrow means up-regulation and * sign means high fold change value.
Cimb 47 00435 g003
Figure 4. IL1B-, TGFB-, and TGM2-dominant regulatory pathways in sepsis via ingenuity pathway analysis. Arrow means up-regulation, yellow circle means auto-suppression, and * means high fold change value.
Cimb 47 00435 g004
Figure 5. TNF is the key upstream mediator during sepsis, as identified via ingenuity pathway analysis. Orange dotted line means activation, blue dotted line means inhibition, yellow dotted line means inconsistent with expression, and grey line means unclassified interaction. * sign means high value in fold change.
Cimb 47 00435 g005
Table 1. TLR.
Table 1. TLR.
Probe IDp-ValueArrowFoldGene
201743_at1.37 × 10−4up2.18CD14
204924_at1.45 × 10−10up3.38TLR2
210166_at9.16 × 10−8up2.40TLR5
210176_at0.001131up2.07TLR1
213817_at3.14 × 10−13up21.04IRAK3
219618_at1.89 × 10−9up2.69IRAK4
220832_at4.76 × 10−9up5.16TLR8
221060_s_at6.62 × 10−7up3.33TLR4
212184_s_at2.03 × 10−5up2.61TAB2
221705_s_at8.46 × 10−10down2.08SIKE1
205118_at1.05 × 10−10down7.61FPR1
210772_at2.06 × 10−8up4.78FPR2
Table 2. MHC.
Table 2. MHC.
Probe IDp-ValueArrowFoldGene
201137_s_at5.80 × 10−4down2.09HLA-DPB1
203290_at2.56 × 10−8down5.19HLA-DQA1
204670_x_at6.77 × 10−8down2.85HLA-DRB1/B4
205671_s_at1.27 × 10−4down2.02HLA-DOB
208306_x_at1.53 × 10−6down2.44HLA-DRB1
208894_at8.06 × 10−7down2.76HLA-DRA
209312_x_at1.24 × 10−6down2.67HLA-DRB1/B4/B5
209823_x_at8.65 × 10−4down2.08HLA-DQB1
210294_at7.08 × 10−10down2.25TAPBP
210528_at1.28 × 10−5down2.57MR1
211948_x_at3.66 × 10−28down11.75BAT2L2
211990_at5.10 × 10−6down3.19HLA-DPA1
212384_at8.83 × 10−15down2.98HLABAT1
212671_s_at0.002545down2.27HLA-DQA1/A2
214055_x_at1.16 × 10−24down9.42BAT2L2
215193_x_at2.90 × 10−6down2.52HLA-DRB1/B3/B4
221491_x_at1.50 × 10−6down2.25HLA-DRB1/B3/B4/B5
Table 3. Transcription factors.
Probe IDp-ValueArrowFoldGene
201473_at3.65 × 10−9up2.46JUNB
201502_s_at9.16 × 10−7down2.36NFKBIA
202527_s_at5.77 × 10−9up3.24SMAD4
203077_s_at4.90 × 10−7up2.37SMAD2
203574_at4.37 × 10−10up5.18NFIL3
204039_at4.62 × 10−8up2.06CEBPA
204203_at9.92 × 10−7up2.17CEBPG
205841_at1.02 × 10−13up4.66JAK2
206036_s_at8.46 × 10−12down4.75REL
206359_at3.22 × 10−7up2.09SOCS3
206363_at9.68 × 10−6down2.26MAF
208991_at1.49 × 10−13down3.22STAT3
209604_s_at2.74 × 10−19down6.55GATA3
209969_s_at2.12 × 10−8down4.75STAT1
210479_s_at5.21 × 10−15down7.85RORA
212501_at1.73 × 10−7up2.17CEBPB
212550_at7.19 × 10−10up2.52STAT5B
213006_at6.03 × 10−10up4.21CEBPD
218221_at1.49 × 10−11up2.35ARNT
218559_s_at9.49 × 10−7up3.35MAFB
218880_at5.34 × 10−11up3.75FOSL2
208808_s_at1.07 × 10−11up9.12HMGB
200989_at1.17 × 10−6up3.00HIF1A
221969_at9.96 × 10−13down4.20PAX5
203140_at3.09 × 10−10up3.69BCL6
210105_s_at9.37 × 10−10down3.32FYN
210754_s_at2.98 × 10−10down3.55LYN
217620_s_at4.31 × 10−12down2.79PIK3CB
221756_at5.52 × 10−10down2.62PIK3IP1
204054_at2.56 × 10−10up5.51PTEN
206370_at2.95 × 10−9down2.44PIK3CG
212240_s_at4.29 × 10−13down4.51PIK3R1
Table 4. Cytokines.
Table 4. Cytokines.
Probe IDp-ValueArrowFoldGene
201110_s_at2.02 × 10−9up8.27THBS1
203085_s_at1.57 × 10−8up2.33TGFB1
203828_s_at7.88 × 10−5down2.13IL32
205016_at8.33 × 10−10up4.86TGFA
205992_s_at4.40 × 10−6up3.58IL15
208114_s_at7.75 × 10−20down5.85ISG20L2
208200_at3.06 × 10−11down4.80IL1A
212195_at3.90 × 10−6up2.67IL6ST
209555_s_at2.87 × 10−5up3.18CD36
212657_s_at2.96 × 10−7up2.31IL1RN
Table 5. Cytokine receptors.
Probe IDp-ValueArrowFoldGene
201642_at1.42 × 10−9up2.32IFNGR2
202948_at5.77 × 10−10up6.46IL1R1
203233_at2.36 × 10−10up3.27IL4R
204191_at2.98 × 10−7up2.06IFNAR1
204731_at7.48 × 10−21down11.93TGFBR3
204786_s_at5.23 × 10−19down6.86IFNAR2
205227_at2.89 × 10−5up2.68IL1RAP
205291_at2.89 × 10−8down2.44IL2RB
205707_at1.73 × 10−9down2.41IL17RA
205798_at2.48 × 10−24down31.79IL7R
205926_at1.06 × 10−9down2.19IL27RA
205945_at1.49 × 10−22down16.69IL6R
206618_at4.70 × 10−9up12.92IL18R1
207072_at5.22 × 10−8up4.93IL18RAP
211372_s_at1.76 × 10−8up10.68IL1R2
211676_s_at6.66 × 10−9up4.61IFNGR1
205159_at1.17 × 10−6up2.51CSF2RB
210340_s_at4.36 × 10−10up2.30CSF2RA
Table 6. Acute response proteins.
Probe IDp-ValueArrowFoldGene
200602_at3.75 × 10−12up4.38APP
206157_at8.31 × 10−8up3.27PTX3
208691_at0.001264up2.49TFRC
208703_s_at1.26 × 10−7up3.05APLP2
219890_at1.43 × 10−12up7.83CLEC5A
220496_at2.59 × 10−7up3.33CLEC1B
205033_s_at1.17 × 10−5up4.79DEFA1/A1B/A3
207269_at2.87 × 10−5up6.67DEFA4
201943_s_at7.91 × 10−12up6.94CPD
204961_s_at7.26 × 10−8up2.02NCF1/1B/1C
207677_s_at5.88 × 10−10up2.66NCF4
214084_x_at1.31 × 10−8up2.25NCF1C
Table 7. Complements.
Probe IDp-ValueArrowFoldGene
200985_s_at4.85 × 10−11up6.59CD59
201925_s_at2.14 × 10−7up5.61CD55
202953_at7.01 × 10−6up2.53C1QB
205786_s_at5.02 × 10−13up4.05ITGAM
206244_at6.06 × 10−12up6.76CR1
208783_s_at0.004769up2.21CD46
209906_at7.48 × 10−9up4.34C3AR1
210184_at1.17 × 10−6up2.07ITGAX
218232_at1.52 × 10−8up3.97C1QA
218983_at7.83 × 10−8up2.64C1RL
220088_at9.13 × 10−8up2.49C5AR1
202910_s_at3.42 × 10−7up2.26CD97
Table 8. MMPs.
Table 8. MMPs.
Probe IDp-ValueArrowFoldGene
203167_at1.02 × 10−13up3.14TIMP2
203936_s_at2.89 × 10−16up10.59MMP9
206871_at1.04 × 10−6up5.39ELANE
207329_at3.41 × 10−11up32.06MMP8
207890_s_at1.30 × 10−11up3.11MMP25
202833_s_at2.83 × 10−9up2.78SERPINA1
204614_at5.64 × 10−8up3.07SERPINB2
212268_at8.64 × 10−11up5.64SERPINB1
Table 9. Coagulation.
Probe IDp-ValueArrowFoldGene
203305_at2.16 × 10−4up2.18F13A1
204714_s_at1.87 × 10−8up3.93F5
205756_s_at2.79 × 10−5up2.08F8
205871_at7.54 × 10−7down3.12PLGLA/B1/B2
206655_s_at2.25 × 10−8up5.37GP1BB/SEPT5
207808_s_at6.30 × 10−8up2.88PROS1
211924_s_at5.53 × 10−7up2.33PLAUR
212245_at6.18 × 10−7up2.30MCFD2
213258_at1.07 × 10−6up2.35TFPI
213506_at0.002877up2.35F2RL1
214415_at1.30 × 10−9down5.54PLGLB1/B2
216956_s_at4.64 × 10−5up2.39ITGA2B
218718_at2.79 × 10−10up9.39PDGFC
204627_s_at1.30 × 10−6up4.18ITGB3
203887_s_at8.66 × 10−9up4.53THBD
Table 10. Glycolysis.
Probe IDp-ValueArrowFoldGene
200650_s_at2.02 × 10−9up2.71LDHA
200737_at2.94 × 10−11up3.17PGK1
201030_x_at9.45 × 10−5down2.02LDHB
201251_at2.51 × 10−10up2.67PKM2
202464_s_at6.45 × 10−9up7.30PFKFB3
202934_at9.80 × 10−14up4.77HK2
202990_at2.15 × 10−12up4.20PYGL
203502_at1.24 × 10−4up3.67BPGM
205936_s_at5.17 × 10−12up4.99HK3
206348_s_at9.53 × 10−11up2.60PDK3
208308_s_at3.92 × 10−9up2.22GPI
209992_at3.99 × 10−9up11.77PFKFB2
213453_x_at2.13 × 10−12up2.18GAPDH
217294_s_at3.28 × 10−6up2.62ENO1
218273_s_at1.01 × 10−7down2.25PDP1
Table 11. H+-ATPases.
Probe IDp-ValueArrowFoldGene
200078_s_at6.15 × 10−13up2.53ATP6V0B
201171_at4.49 × 10−10up2.48ATP6V0E1
201443_s_at5.84 × 10−6up2.33ATP6AP2
201971_s_at4.45 × 10−13down5.21ATP6V1A
202872_at1.95 × 10−10up6.18ATP6V1C1
202874_s_at6.99 × 10−10up5.72ATP6V1C1
204158_s_at5.14 × 10−8up2.07TCIRG1
208898_at2.66 × 10−9up2.41ATP6V1D
213587_s_at1.13 × 10−8down2.07ATP6V0E2
206208_at1.00 × 10−11up3.51CA4
206209_s_at4.18 × 10−15up7.98CA4
209301_at2.78 × 10−6up3.42CA2
212536_at4.38 × 10−9up4.21ATP11B
213582_at1.89 × 10−8up2.24ATP11A
Table 12. T cell.
Table 12. T cell.
Probe IDp-ValueArrowFoldGene
205255_x_at3.09 × 10−8down2.96TCF7
205456_at5.31 × 10−8down2.88CD3E
205488_at1.01 × 10−5down2.87GZMA
205495_s_at5.33 × 10−10down4.38GNLY
205758_at1.20 × 10−7down3.26CD8A
206666_at1.84 × 10−7down3.45GZMK
206804_at1.10 × 10−15down5.12CD3G
207460_at3.78 × 10−9down2.50GZMM
208003_s_at5.52 × 10−18down12.04NFAT5
209671_x_at3.58 × 10−8down2.77TRAC
209813_x_at1.49 × 10−9down4.42TARP
210164_at8.91 × 10−9down3.76GZMB
210321_at8.94 × 10−10down5.80GZMH
210370_s_at1.34 × 10−7down2.48LY9
210556_at4.68 × 10−8down2.85NFATC3
210972_x_at1.78 × 10−7down2.88TRAC/J17/V20
211796_s_at6.35 × 10−6down2.93TRBC1/C2
212759_s_at3.98 × 10−16down3.93TCF7L2
213193_x_at2.53 × 10−6down2.92TRBC1
213539_at1.00 × 10−8down3.19CD3D
214617_at2.22 × 10−6down2.65PRF1
216191_s_at4.71 × 10−7down4.76TRDV3
216920_s_at2.28 × 10−10down5.34TARP/TRGC2
217143_s_at1.26 × 10−8down6.06TRD@
217527_s_at2.12 × 10−13down5.80NFATC2IP
220684_at7.39 × 10−9down2.08TBX21
220704_at2.15 × 10−10down5.69IKZF1
214032_at6.60 × 10−8down2.52ZAP70
204891_s_at4.58 × 10−8down3.31LCK
205831_at4.40 × 10−10down3.93CD2
201565_s_at8.13 × 10−13down4.17ID2
213931_at7.33 × 10−8down3.55ID2/2B
Disclaimer/Publisher’s Note: The statements, opinions and data contained in all publications are solely those of the individual author(s) and contributor(s) and not of MDPI and/or the editor(s). MDPI and/or the editor(s) disclaim responsibility for any injury to people or property resulting from any ideas, methods, instructions or products referred to in the content.

