Article

Genetic and Epigenetic Aberrations of SOX7 in Newly Diagnosed and Relapsed Multiple Myeloma as Well as Related Neoplasms

1
Department of Medical Biology, Faculty of Medicine, Dokuz Eylül University, 35340 İzmir, Türkiye
2
İzmir International Biomedicine and Genome Institute, Dokuz Eylül University, 35340 İzmir, Türkiye
3
İzmir Biomedicine and Genome Center, 35340 İzmir, Türkiye
4
Department of Medical Biochemistry, Faculty of Medicine, Dokuz Eylül University, 35340 İzmir, Türkiye
5
Department of Hematology, Faculty of Medicine, Dokuz Eylül University, 35340 İzmir, Türkiye
6
Department of Hematology, Faculty of Medicine, Gazi University, 06560 Ankara, Türkiye
7
Department of Otorhinolaryngology, Faculty of Medicine, Dokuz Eylül University, 35340 İzmir, Türkiye
*
Author to whom correspondence should be addressed.
Curr. Issues Mol. Biol. 2025, 47(4), 244; https://doi.org/10.3390/cimb47040244
Submission received: 26 February 2025 / Revised: 24 March 2025 / Accepted: 24 March 2025 / Published: 1 April 2025

Abstract

Multiple myeloma (MM) is one of the most frequent hematological malignancies. Most MM cases relapse, which is associated with poor prognosis. MM-related tumor suppressor genes are not totally known yet. SOX7 is one of the tumor suppressor candidates located in 8p23.1, a recurrently deleted region in MM. Here, we evaluated the genetic and epigenetic aberrancies of SOX7 in diagnostic or relapsed MM as well as smoldering MM (SMM) and plasma cell leukemia (PCL). Publicly available datasets were reanalyzed to evaluate SOX7 copy number, promoter methylation, transcript levels in MM or related neoplasms and to evaluate mutation rates in MM cases. qPCR and qRT-PCR with an in-house MM cohort were performed to cross-validate SOX7 copy number and transcript level estimates. SOX7 deletions were frequent in newly diagnosed and relapsed MM cases. SOX7 promoter hypermethylation was observed in MM cell lines, MM cases, and PCL cases. Importantly, SOX7 was transcriptionally silent in MM cell lines and underexpressed in MM and high-risk SMM cases. Integrative analyses of patient-matched diagnostic and relapsed MM tumor tissues revealed moderate positive correlations between SOX7 copy numbers. SOX7 deletion and promoter methylation levels had a tendency to be mutually exclusive. SOX7 promoter methylation levels were significantly higher in relapsed cases compared to the diagnostic ones. SOX7 mutations were rare in MM cases. SOX7 underexpression may be due to genetic and/or epigenetic alterations in newly diagnosed and relapsed MM. These genetic and epigenetic aberrations can serve as diagnostic or prognostic biomarkers for MM and allied neoplasms. Future research will reveal whether SOX7 inactivation has a role in development of these plasma cell neoplasms.

1. Introduction

Multiple myeloma is an incurable type of lymphoid cancer that develops as a result of the clonal proliferation of antibody-producing plasma cells in the bone marrow [1]. Clonal plasma cells in bone marrow of MM patients express CD138 and CD38 on their surface and lack expression of CD19 [2]. MM incidence and mortality rate have a globally increasing trend [3]. As a frequently observed hematological malignancy, it is responsible for ~2% of the cancer-related deaths [4]. It originates from smoldering multiple myeloma (SMM), which is a benign, asymptomatic neoplasm [5]. MM may transform into plasma cell leukemia (PCL), a more aggressive type of plasma cell malignancy [6].
The drugs effective for the treatment of MM mainly include bortezomib [7], as well as immunomodulatory drugs such as lenalidomide [8] or thalidomide [9]. Ten-year survival of MM patients doubled compared to the 1970s with the inclusion of these drugs in the early 2000s [10]. However, a relapse is observed in most patients after these treatments [11], which is associated with poor survival rates [12,13]. Consequently, the identification of molecular aberrations leading to therapy resistance is highly important for the development of effective therapeutics against relapsed MM patients.
Genetic and epigenetic alterations were proposed as diagnostic biomarkers for several different cancer types [14,15]. Genomic deletions are among genetic alterations that were shown to have diagnostic biomarker potential in certain cancer types such as non-small-cell lung cancer [16]. Among epigenetic biomarkers, several studies indicated diagnostic potential for DNA methylations, including but not limited to colorectal [17] or lung cancer [18]. Genetic and/or epigenetic diagnostic biomarkers can potentially be used to improve molecular diagnosis of MM and related plasma cell neoplasms.
Tumor suppressor genes located in recurrently deleted regions contributing to MM development and relapse have not been fully identified yet. In a comprehensive genome-wide study, copy number alterations of 153 MM patient samples were determined with Affymetrix SNP 6.0 arrays [19]. Interestingly, homozygous deletions of the 8p23.1 genomic locus that includes tumor suppressor candidates were identified in this study [19]. This bi-allelically deleted locus contains three tumor suppressor gene candidates (MSRA, PINX1, SOX7) [20,21,22].
Among these three tumor suppressor gene candidates in del8p23.1, a higher number of research articles supported the role of SOX7 as a tumor suppressor in a variety of cancer types compared to other tumor suppressor candidates. As a transcription factor, SOX7 was reported to transcriptionally regulate several genes related to its tumor suppressor functions in breast cancer cells [23]. In a study on colorectal cancer (CRC), SOX7 was shown in CRC cell lines and tumor tissues to be transcriptionally silenced through abnormal DNA methylation. In the same article, ectopic expression of SOX7 in CRC cells promoted apoptosis and inhibited proliferation [22]. SOX7 expression was reported to be silenced in tumor tissues and cell lines in non-small-cell lung cancer in another study, which also showed inhibition of cell growth and promotion of apoptosis after re-expression of SOX7 [24]. Importantly, reduced SOX7 expression in lung cancer cells was shown to be associated with shortened survival and lymph node metastasis [25]. The tumor-suppressive effects of SOX7 may occur through the regulation of activities in different signaling pathways, primarily Wnt/β-catenin. In gastric cancer tumors, SOX7 silencing was demonstrated to lead to dysregulated activation of the Wnt/β-catenin signaling pathway [26]. Similarly, SOX7 inactivation causing dysregulated activation of the Wnt/β-catenin signaling pathway was also reported in ovarian cancer [27]. The reason of SOX7-induced apoptosis in various cancer types may be owing to its activation of the MAPK/ERK-BIM apoptotic signaling pathway [28].
To the best of our knowledge, there has been no study performed until now investigating the presence of genetic or epigenetic aberrations specifically of SOX7 in newly diagnosed and relapsed MM besides related neoplasms (i.e., SMM and PCL). Based on the observations in other cancer types supporting the role of SOX7 as a tumor suppressor as well as a recent study showing SOX7 deletion in an MM case with double relapse [29], the genetic and/or epigenetic aberrations of SOX7 may be responsible for transcriptional downregulation of SOX7 in MM and allied neoplasms. In this study, we investigated the copy number status and promoter methylation levels of SOX7 in diagnostic or relapsed MM in addition to related neoplasms through different approaches with generally consistent results. We also provided evidence that deletion may decrease mRNA expression of PINX1 and MSRA, which are the other two tumor suppressor candidates located on del8p23.1.

2. Materials and Methods

2.1. Patient Information

Fifteen newly diagnosed and thirteen relapsed MM cases were included as the in-house patient cohort in this study. The summary of clinicopathologic and demographic characteristics of these MM cases is available in Table S1 for these newly diagnosed and relapsed MM cases.

2.2. Chemicals and Reagents

Ficoll-Paque Plus (cat. no: GE17-1440-02) was purchased from Cytiva (Uppsala, Sweden), and 10x PBS (cat. no: 70011-036) was obtained from Thermo Fisher Scientific (Waltham, MA, USA). A total of 500 ml of 10x ACK lysing buffer (pH 7.2) was prepared by dissolving 43 g 1.5 M ammonium chloride (NH4Cl) (Kimetsan, Ankara, Türkiye), 5 g 100 mM potassium bicarbonate (KHCO3) (Merck, Darmstadt, Germany), and 10 mM Triplex111 (EDTA-2Na) (Kimetsan, Ankara, Türkiye). DAPI (cat. no: 422801) was purchased from BioLegend (San Diego, CA, USA). β-Mercaptoethanol (cat. no: M6250-100 ML, purity: ≥99.0%) was purchased from Sigma-Aldrich (St. Louis, MO, USA) to be used in DNA and RNA isolations with the AllPrep DNA/RNA isolation kit (Qiagen, Hilden, Germany). dNTP mix (cat. no: N0447S), 100 bp DNA ladder (cat. no: N3231S) as well as Taq DNA polymerase and buffer (cat. no: M0273S) were purchased from New England Biolabs (Ipswich, MA, USA). Ethidium bromide (cat no: 4410-10ML) and concentrated TAE buffer solution (cat. no: TAE222.1) were purchased from Millipore (Waltham, MA, USA) and BioShop Canada (Burlington, ON, Canada), respectively.

2.3. FACS Sorting of Bone Marrow Tumor Cells

Mononuclear cells were separated from the MM patient bone marrow samples either through the Ficoll-Paque Plus method or through red blood cell lysis by addition of 1x ammonium–chloride–potassium (ACK) lysing buffer solution. Before deciding the amount of bone marrow and antibody amount to be used, test staining was performed according to the manufacturer’s recommendations by adding 5 µL of each antibody to 100 µL of bone marrow samples. The antibodies used in this study were anti-CD138-FITC, anti-CD38-PE, and anti-CD19-APC antibodies (BD Biosciences, San Jose, CA, USA). After that, cells were resuspended in 1x phosphate-buffered saline (PBS) followed by quantification of the percentages of tumor cells with the BD FACSCanto II instrument. In this FACS test, cells were gated based on the FSC and SSC values. Single cells (singlets) were selected followed by gating of the cells with the CD19 phenotype. Another gating was performed in the CD19 cell population for CD138+ and CD38+ phenotype cells so that the percentages of CD138+/CD38+/CD19 cells [30] were determined among all cells.
Bone marrow and antibody amounts to be used in FACS sorting were determined based on the calculated tumor cell percentages and total cell numbers. When the tumor cell percentages were sufficient, the experimental procedures were repeated the same way as above by sorting cells with the BD FACSAria III Cell Sorter. FACS sorting was not performed for the corresponding MM case when tumor cell numbers were low.

2.4. Isolation of DNA and RNA from MM Bone Marrow Tumor Cells

DNA and RNA were simultaneously isolated from MM bone marrow tumor cells with CD138+/CD38+/CD19 phenotype using AllPrep DNA/RNA Mini Kit (Qiagen Inc., Hilden, Germany) per manufacturer’s instructions. AllPrep DNA/RNA Micro Kit (Qiagen Inc., Hilden, Germany) was used when the FACS-separated cell numbers were low. To maximize the DNA and RNA yields, elution steps were repeated in different collection tubes.

2.5. Quality Control of the MM Bone Marrow Tumor Cell DNA and RNA

The initial quality check (QC) of the MM bone marrow tumor DNA and RNA samples was performed with NanoDrop 2000 spectrophotometer (Thermo Fisher Scientific, Waltham, MA, USA) to evaluate the 260/280 ratios to ensure lack of protein contamination, as well as the 260/230 ratios to ensure a lack of contamination from solvents, salts, or carbohydrates used during extraction. As MM BM DNA and RNA sample amounts were generally low, PCR-based methods were used for a secondary QC. The quality control for genomic DNA samples was performed with PCR by using the REL ex11-5 primer pair that was available from a previous study [31]. The specificity and size of the amplicons were evaluated by imaging the PCR products that were run in the TAE gel. As expected, 271 bp bands were obtained with the REL ex11-5 primer pair PCR amplifications. The QC of total RNA samples was performed with reverse transcriptase PCR (RT-PCR) experiments by using QuantiTect Reverse Transcription Kit (Qiagen Inc., Hilden, Germany). During reverse transcription reactions, ~30 ng RNAs were converted to cDNA biomolecules. Obtained cDNAs were then 1:10 diluted with RNase-free H2O for the subsequent PCR experiments. After that, PCRs were performed by using an RPL13A qRT-PCR primer pair designed in an exon–exon junction with an expected amplicon size of 149 bp.

2.6. Tonsil Samples from Control Cases

As control group samples, plasma cells (PCs) obtained through FACS from reactive tonsil tissues of tonsillitis (n = 3) or obstructive sleep apnea (n = 5) patients were used in this study. Based on previous reports describing CD38 bright (CD38++) cells in reactive tonsil tissues as PCs [32,33], CD38++ tonsil cells were sorted with flow cytometry as PCs. Fresh tonsil tissue samples used as control samples were obtained through routine tonsillectomy operations at the Department of Otorhinolaryngology in DEU. Half of the tonsil tissue pairs were delivered to the Department of Medical Pathology at DEU for sample registration. The remaining half of the tonsil tissues were placed into 1x PBS solution with/without EDTA for subsequent procedural steps. The tonsil tissues were processed as follows until FACS cell separations: Tonsil tissues were fractionated and homogenized using forceps followed by suspension of cells in 1x PBS as 50 mL volume. For the elimination of cell clumps and debris, tonsil cell suspensions were passed through 100 µm-pored cell filters (Corning Inc., Corning, NY, USA, cat no: 352360). After the addition of 15 mL Ficoll-Paque solution into 20 mL tonsil cell suspension, cells were centrifuged at 1000× g speed for 20 min at room temperature. After the centrifuge, the mononuclear cells present in the interphase were collected and counted by trypan blue exclusion assay.
Tonsil samples from 5 obstructive sleep apnea cases were prepared for FACS cell separations as follows: 50 mL cell suspensions were prepared inside 1x PBS + 5 mM EDTA solution after fractionation and homogenization of tonsil tissues with forceps. Tonsil cell suspensions were filtered through Falcon® 100 µm Cell Strainer (Corning Inc., cat no: 352360) to eliminate cell clumps and debris. Then, cell suspensions were incubated for 15 min inside 1x ACK lysis buffer solution added in a 1:4 ratio. Cells were centrifuged twice, the latter of which included the addition of 1x PBS + 5 mM EDTA solution for washing. Tonsil cells were then suspended in 20 mL of 1x PBS + 5 mM EDTA. After that, the number of tonsil cells was determined with the hemocytometer using a trypan blue exclusion assay.

2.7. Tonsil PC Separations Through FACS

After the determination of cell numbers, tonsil cells were stained with CD38-PE antibody and prepared for flow cytometry. In the first stage, 3 µL CD38-PE (Biolegend, San Diego, CA, USA) antibody was added into 100 µL volume cell suspension and incubated for 20 min in the dark. The cells were then washed by the addition of 2 mL 1x PBS followed by centrifugation at 400× g for 10 min at room temperature. After the removal of the supernatant, the cell pellet was resuspended in 500 µL of 1x PBS. Five microliter DAPI (50 µg/mL) was added to label dead cells. CD38-stained cells were analyzed with flow cytometry, and CD38++ (CD38 bright) cell ratios were determined. With this FACS test, PC ratios were determined among tonsil cells analyzed before the cell sorting process. For the cell sorting processes, 3.5 mL cell suspension was incubated with 100 µL CD38-PE and then washed with 1x PBS. After that, CD38++ phenotype cells were sorted with flow cytometry.

2.8. SOX7 Copy Number Analyses of Publicly Available SNP Array Data of Diagnostic MM Cases

Publicly available Affymetrix GeneChip Human Mapping 250K Nsp array data available in NCBI GEO database (accession no: GSE21349) were reanalyzed for 40 diagnostic MM tumor samples as well as patient-matched white blood cell (WBC) samples to evaluate the copy number status of SOX7. In this dataset, diagnostic MM tumor samples were pre-treatment CD138+ PC samples that were positively selected using MACS beads, and then stored in RLT buffer. DNA isolations were performed with the Qiagen AllPrep kit per the manufacturer’s instructions. Peripheral white blood cell pellets of the same MM patients were used as normal controls with respect to SOX7 copy number status. Genomic DNA of WBC samples was extracted from peripheral white blood cell pellets using the Qiagen FlexiGene kit, as per the manufacturer’s instructions. A total of 250 ng of DNA per each sample was digested with NspI/StyI and processed according to the Affymetrix 500K protocol. DNA samples were end-labeled with biotin using TdT. In all, 90 µg of fragmented labeled DNA samples were hybridized to the array for 16 h at 49 °C according to Affymetrix protocols. Genechips were scanned on an GeneChip Scanner 3000 7G/4 color (Early Access) (Affymetrix, Santa Clara, CA, USA) and processed using GCOS 1.4.0. SNP genotype calls were generated using Affymetrix Powertools v1.8.0 (apt-probeset-genotype). Calls were generated using the default parameters and the brlmm calling algorithm.
During SOX7 copy number analyses, values of each of the two different probesets for SOX7 (SNP_A-1859173 and SNP_A-1886065) were divided into the probeset values of RPL37A (SNP_A-1913649) followed by normalizations of SOX7 values in MM tumor samples to patient-matched WBC samples. MM tumors with copy number values ≤ 75% of the corresponding WBC samples for each SOX7 probeset were considered to have SOX7 deletion.

2.9. SOX7 Deletion Analyses in Diagnostic and Relapsed MM Cases with qPCR

The presence of SOX7 deletions was evaluated with qPCR in MM patient tumor samples. For normalization of SOX7 copy numbers, EMC7 and RPL37A genes that reside, respectively, in chromosomes 15 and 2 were chosen. Trisomy or gains of chromosome 15 were observed in some MM samples based on previous publications [34], whereas no chromosomal abnormality was detected for chromosome 2 that may generate false positive results. Therefore, MM cases with SOX7 copy numbers ≤ 0.75-fold of those of the average of control samples based on normalizations for both EMC7 and RPL37A were considered to have SOX7 deletion. Primer pairs for qPCR were designed with the PrimerQuest software (IDT DNA Technologies, Coralville, IA, USA) and then ordered from Sentebiolab Biotech (Ankara, Türkiye). Different primer pairs of SOX7 and EMC7 were optimized with gradient PCR for qPCR analyses. qPCR experiments were repeated twice. Copy numbers were evaluated with the ddCt method. Primers used for gene copy number analyses are shown in Table S2A.

2.10. Promoter Methylation Analyses of SOX7 Using Publicly Available Methylation Array Data of MM and PCL

SOX7 promoter methylation analyses of MM and PCL cases were performed by reanalyzing methylation profiling data publicly available and previously published [35] in the context of GSE21304 in the NCBI GEO database. This series includes methylation profiling data based on the HumanMethylation27_270596_v.1.2 BeadChip (Illumina San Diego, CA, USA) for 161 MM cases, 7 PCL cases, and 9 MM cell lines. Briefly, this dataset was generated as follows: PCs from non-myeloma patients (normal plasma cell controls, n = 3) and MM patients (n = 161) were selected to a purity of >90% using CD138 microbeads and MACS (Miltenyi Biotech, Bisley, UK). Samples from PCL patients (n = 7) were not CD138 selected; however, they had >90% PC infiltration as determined by microscopy. Some normal PC control samples were pooled to obtain a sufficient quantity of DNA. B cells (n = 6) from normal individuals were selected from peripheral blood using CD19. Genomic DNA biomolecules were extracted using the AllPrep protocol (Qiagen, Hilden, Germany). For labeling, hybridization, and scanning of bisulfite-modified genomic DNA, the manufacturer Illumina’s instructions were followed. For data processing, files were analyzed in GenomeStudio (Illumina, San Diego, CA, USA) as per manufacturer’s (Illumina) instructions using the methylation module v1.5.5 and were described as beta values.
SOX7 promoter methylation levels were analyzed using an approach similar to a previous publication [28] by determining the cg08056146 probe intensity levels through the ‘Profile graph’ option of the GEO2R bioinformatic tool. Methylation profiling data of peripheral blood B cell samples (n = 6) and PC samples (n = 3) from normal individuals available in this GEO series were used as controls.

2.11. Integrated Analyses of Copy Number, Promoter Methylation, and Transcript Expression of the Candidate Tumor Suppressors Located in del8p23.1 in Diagnostic and Relapsed MM Cases

Publicly available NCBI GEO SuperSeries (GSE77540) associated with a previously reported study [36] was used for integrated analyses of SOX7, PINX1, and MSRA copy number, promoter methylation, and transcript expression in the same MM tumor samples belonging to patient-matched diagnostic and relapsed MM cases.
For DNA copy number analyses, CD138+ PCs from the bone marrow of MM patients during diagnosis and relapse stages were collected. Total RNA from these cells was extracted using Buffer RLT plus (Qiagen, Hilden, Germany), followed by DNA and RNA purification with the AllPrep DNA/RNA Mini Kit (Qiagen, Hilden, Germany). Labeling and hybridizations for the CytoScan 750K Array (Affymetrix, Santa Clara, CA, USA) were performed according to Affymetrix protocol. The hybridization protocol included restriction digestion of DNA, PCR amplification, fragmentation, labeling, and hybridization of each array according to the manufacturer’s instructions. The scanning protocol consisted of an array washing step using Affymetrix fluidics stations and scanning using the GeneChip Scanner 3000. For data processing, the ChAS console from Affymetrix was used to assess genome-wide copy number frequencies. The normalized data matrix contained weighted log2 ratios. The *cychp files were generated as follows: affymetrix-algorithm-name = CYTO2, affymetrix-algorithm-version = 1.16.0 program-name = apt-copynumber-cyto.exe program-version = 1.16.0. Normalized probeset values for SOX7, PINX1, and MSRA genes generated with the Affymetrix CytoScan 750K Array were used to evaluate the copy number of these genes in 19 patient-matched diagnostic and relapsed MM tumor samples. MM cases with values ≤ 0.75 were considered to have a deletion of the gene of interest. The probeset IDs for SOX7, PINX1, and MSRA genes are, respectively, as follows: C-6DUBL, C-4YZRZ, and C-4CMDY.
For DNA methylation analyses, genomic DNA from CD138+ PCs was extracted from frozen bone marrow samples with QIAmp DNA Mini Kit (Qiagen, Valencia, CA, USA) following the manufacturer’s instructions. Samples were denatured and labeled in parallel with Cy3 for the test group and Cy5 for the control group, each of which was via a random priming method, and by using Klenow fragments (NimbleGen Dual-Color DNA Labeling Kit, Roche NimbleGen, Inc., Madison, WI, USA) according to the manufacturer’s protocol. Hybridization and scanning were performed according to the instructions in the NimbleGen Array User Guide. Data processing of the arrays was conducted by using Nimblegen’s standard protocol. Batch effects were removed with the ComBat R package. Quantile normalization was performed through the affy R package. During promoter methylation analyses of these three genes, normalized probeset values of the NimbleGen Human DNA Methylation 3x720K CpG Island Plus RefSeq Promoter Array (100718_HG18_CpG_Refseq_Prom_MeDIP) were used. For SOX7, normalized values of 39 probes located in chr8:10624714-10628519 (based on hg18) were summed for each of the diagnostic and relapse tumor samples for 20 MM cases to estimate promoter methylation levels. PINX1 and MSRA promoter methylation analyses were performed similarly by summing normalized values of 29 probes (chr8:10734099-10737149) and 31 probes (chr8:9946799-9950043), respectively.
The RNA samples obtained from total DNA/RNA isolations for DNA copy number analysis were used for transcript expression analysis. Labeling and hybridizations were performed according to protocols from Affymetrix. Briefly, 100–300 ng of total RNA was amplified and labeled using the WT Sense Target labeling and control reagents kit (Affymetrix Inc., Santa Clara, CA, USA). Labeled RNA samples were then hybridized into the Human Gene 1.0 ST Array. After that, washing and scanning were performed using the GeneChip System (i.e. GeneChip Hybridization Oven 640, GeneChip Fluidics Station 450, and GeneChip Scanner 7G) (Affymetrix, Santa Clara, CA, USA). The expression value for each probe set was calculated using the Affymetrix Expression Console that uses the RMA (Robust Multi-Array Average) algorithm. Gene expression values generated with the Affymetrix Human Gene 1.0 ST arrays were utilized to identify mRNA expression values of these three genes. The array IDs for SOX7, PINX1, and MSRA mRNAs used for expression analyses are, respectively, as follows: 8149289, 8149296, and 8144557.

2.12. Evaluation of SOX7 mRNA Expression Levels Through Reanalyses of the Publicly Available GEP Data of Plasma Cell Neoplasms and Normal Plasma Cells

Gene expression profiling (GEP) data based on DNA microarray were assessed by using the NCBI GEO DataSet Browser (https://www.ncbi.nlm.nih.gov/gds, accessed on 16 April 2024). The experimental procedure and data processing are as follows: CD138-positive PCs were isolated using the AutoMACS separation system (Miltenyi-Biotec, Bergisch Gladbach, Germany) with the following purities: >95% for all MM and SMM cases, and >90% for MGUS patients as well as healthy donors. Total RNA was extracted from normal and tumor PCs using miRNeasy Mini Kit (Qiagen, Hilden, Germany) following the manufacturer’s protocol. The RNA integrity was assessed using an Agilent 2100 Bioanalyzer (Agilent, Palo Alto, CA, USA). Labeling and hybridizations were performed according to protocols from Affymetrix. Briefly, 100–300 ng of total RNA was amplified and labeled using the WT Sense Target labeling and control reagents kit (Affymetrix Inc., Santa Clara, CA, USA), followed by hybridization into the Human Gene 1.0 ST Array. Washing and scanning were then performed via the GeneChip System of Affymetrix (GeneChip Hybridization Oven 640, GeneChip Fluidics Station 450, and GeneChip Scanner 7G). During data processing, normalization was carried out by using the expression console (Affymetrix) with an RMA algorithm that involved background correction, normalization, and calculation of log2 converted expression values. As the myeloid contamination signature can be detected even in samples with high purity, those probes identifying genes exclusive of myeloid lineage were subtracted from the analysis at the beginning. The expression levels of SOX7 for MM (n = 44) and high-risk SMM (n = 33) cases, as well as those of normal plasma cells of a previous publication [37], were obtained by searching this browser with the following dataset record: GDS4968. In this study (GSE47552), [HuGene-1_0-st] Affymetrix Human Gene 1.0 ST Array was used to measure the transcript expression profiles. During comparative analyses of gene expression data with the ‘Profile graph’ option of GEO2R (https://www.ncbi.nlm.nih.gov/geo/geo2r/, accessed on 16 April 2024), log2 transformed values were converted back to anti-log2 values. SOX7 transcript expression was normalized to that of RPL37A or EMC7 for each sample.

2.13. Evaluation of SOX7 mRNA Levels in Diagnostic and Relapsed MM Tumor Samples with qRT-PCR

Similar to the primers used for genomic qPCR, the qRT-PCR primer pairs were designed with the PrimerQuest software and obtained from Sentebiolab Biotech (Table S2B). After the testing of SOX7 and RPL37A qRT-PCR primer pairs with gradient PCR, primer pairs that did not generate primer dimers and that gave specific bands were chosen. RNA samples isolated from diagnostic and relapsed MM patient samples were converted to cDNAs by using Quantitect Reverse Transcription Kit (Qiagen, Hilden, Germany). The specificity and efficiency of amplifications were evaluated with melting curve analyses and by running the amplicons in TAE agarose gels whenever needed. The following filtering criteria were applied during qRT-PCR analyses: If no amplification was observed with the SOX7 primer pairs, and the Ct value of the housekeeping gene (i.e., RPL37A) amplifications was >30, these amplifications were not taken into account during calculations. If the Ct value of RPL37A amplifications was <30, SOX7 Ct values were assumed as the latest cycle (i.e., 45) of the qPCR amplifications. If dimers were detected in any amplification, they were excluded from analyses. Relative levels of SOX7 transcript expression in MM samples were normalized to those of the average of OSA-sorted PC samples.

2.14. Mutation Data of MM Samples

MM (Broad, Cancer Cell 2014) dataset related to a previously reported manuscript [19] was used in the cBioPortal website (https://www.cbioportal.org) to evaluate SOX7 mutation(s) in MM cases. The type and frequency of SOX7 mutations in MM cases (assessed on 3 April 2024) were visualized by generating a heatmap with the OncoPrint function. As an alternative mutation database, COSMIC browser (https://cancer.sanger.ac.uk/cosmic) was used to determine the frequency and type of SOX7 mutations in MM. SOX7 gene name was searched in COSMIC v99 (GRCh38). From the ‘Tissue distribution section’, ‘Hematopoietic and lymphoid’ option was chosen. After that, SOX7 mutation information in MM was obtained by clicking on the ‘plasma cell myeloma’ link (assessed on 26 April 2024).

2.15. Evaluation of SOX7 mRNA Expression Levels in MM Cell Lines

RNA-Seq data of 1019 human cancer cell lines were assessed from the Cancer Cell Line Encyclopedia RNA-Seq data available in the Expression Atlas database (https://www.ebi.ac.uk/gxa/home). RNA-Seq expression data of SOX7, CD38, and CD138 were visualized as FPKM for 29 MM cell lines available among these 1019 human cancer cell lines (assessed on 14 April 2024 and 22 April 2024). The raw data provider for this database is the NIH Genomic Data Commons.

2.16. Generation of Graphs and Statistical Analyses

The Excel application of Microsoft 365 (version 2403) (Microsoft Corp., Redmond, WA, USA) was used to generate bar graphics and box-whisker and scatter plots and perform statistical analyses. Pearson product moment correlation coefficient (r) values were calculated with the Pearson function. Statistical significances between different sample groups were evaluated by applying Student’s t-tests. p values less than 0.05 were considered statistically significant.

3. Results

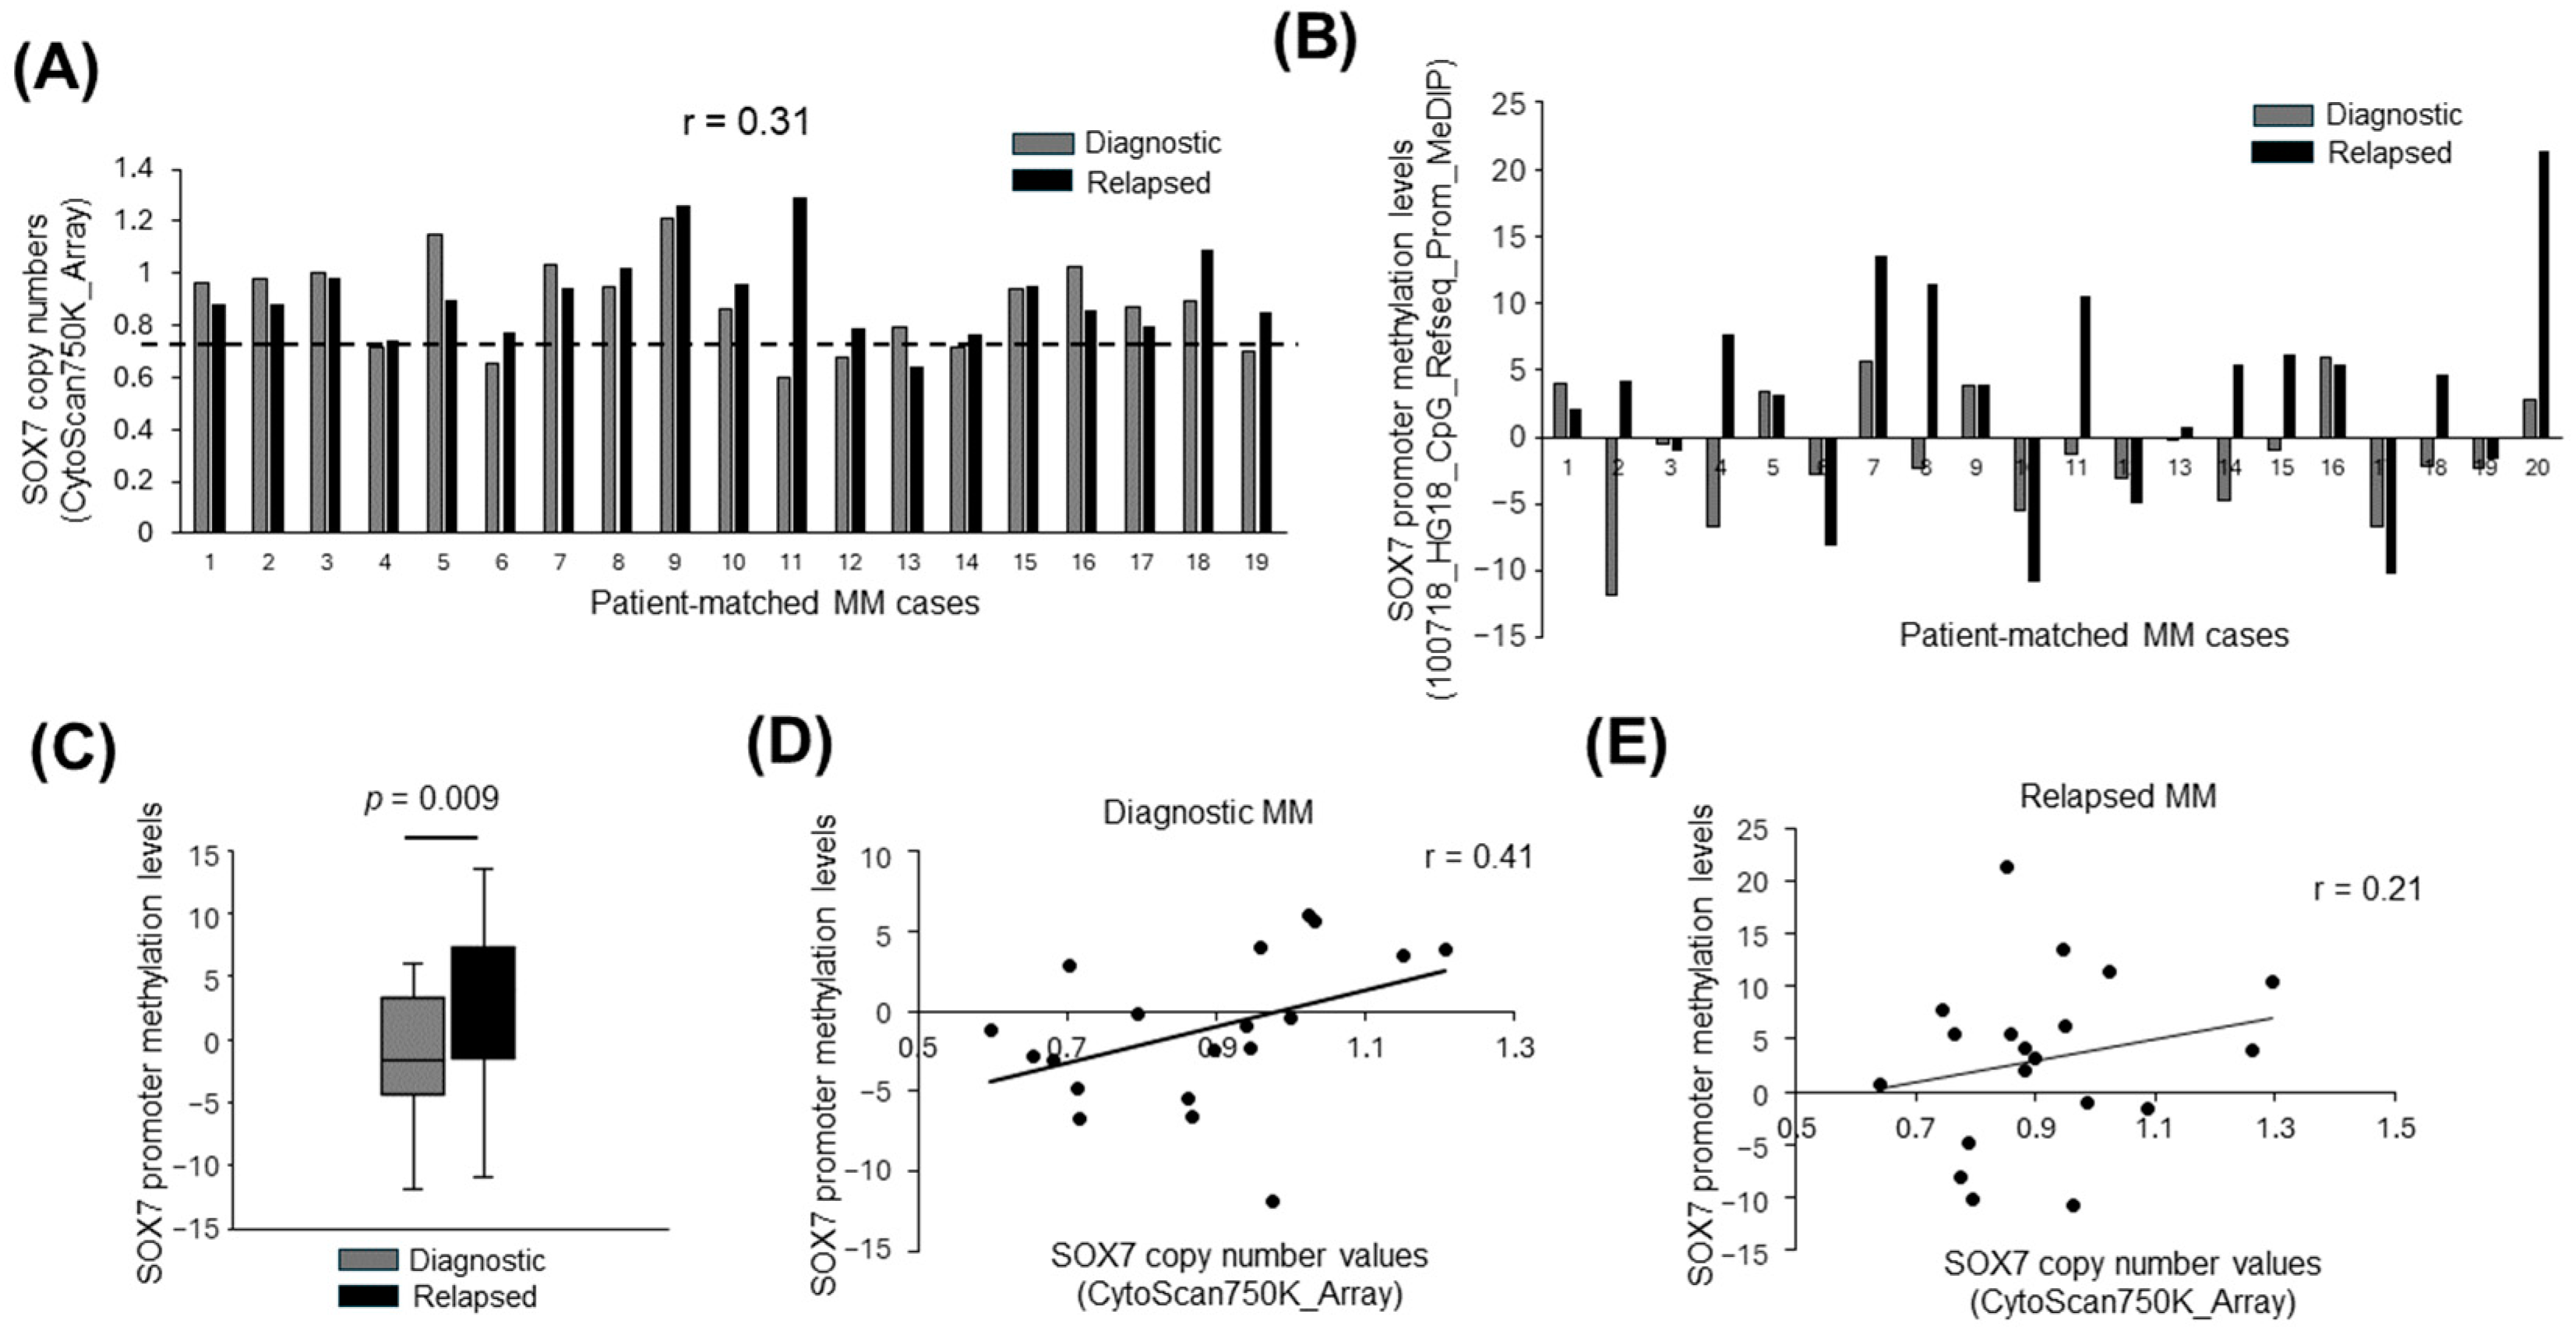
3.1. SOX7 Deletions Are Frequent in Diagnostic and Relapsed MM Samples

To evaluate SOX7 copy number status in MM cases, we analyzed SOX7 copy number values based on SNP arrays in 40 newly diagnosed MM cases. Based on this analysis, SOX7 deletion was present in at least 6 of 40 (15%) of the cases (Figure 1A). We also evaluated SOX7 copy number status with qPCR of the in-house diagnostic and relapsed MM patient cohort. When each of two different reference genes located in different chromosomes (i.e., EMC7 and RPL37A) were used for copy normalizations of the qPCR results, SOX7 deletions were observed in 5 of 15 (33%) newly diagnosed MM samples compared to control PC samples (Figure 1B and Figure S1A). In tumor samples obtained at the relapse stage, 3 of 11 (27.3%) cases showed the presence of SOX7 deletions in MM cases (Figure 1C and Figure S1B).

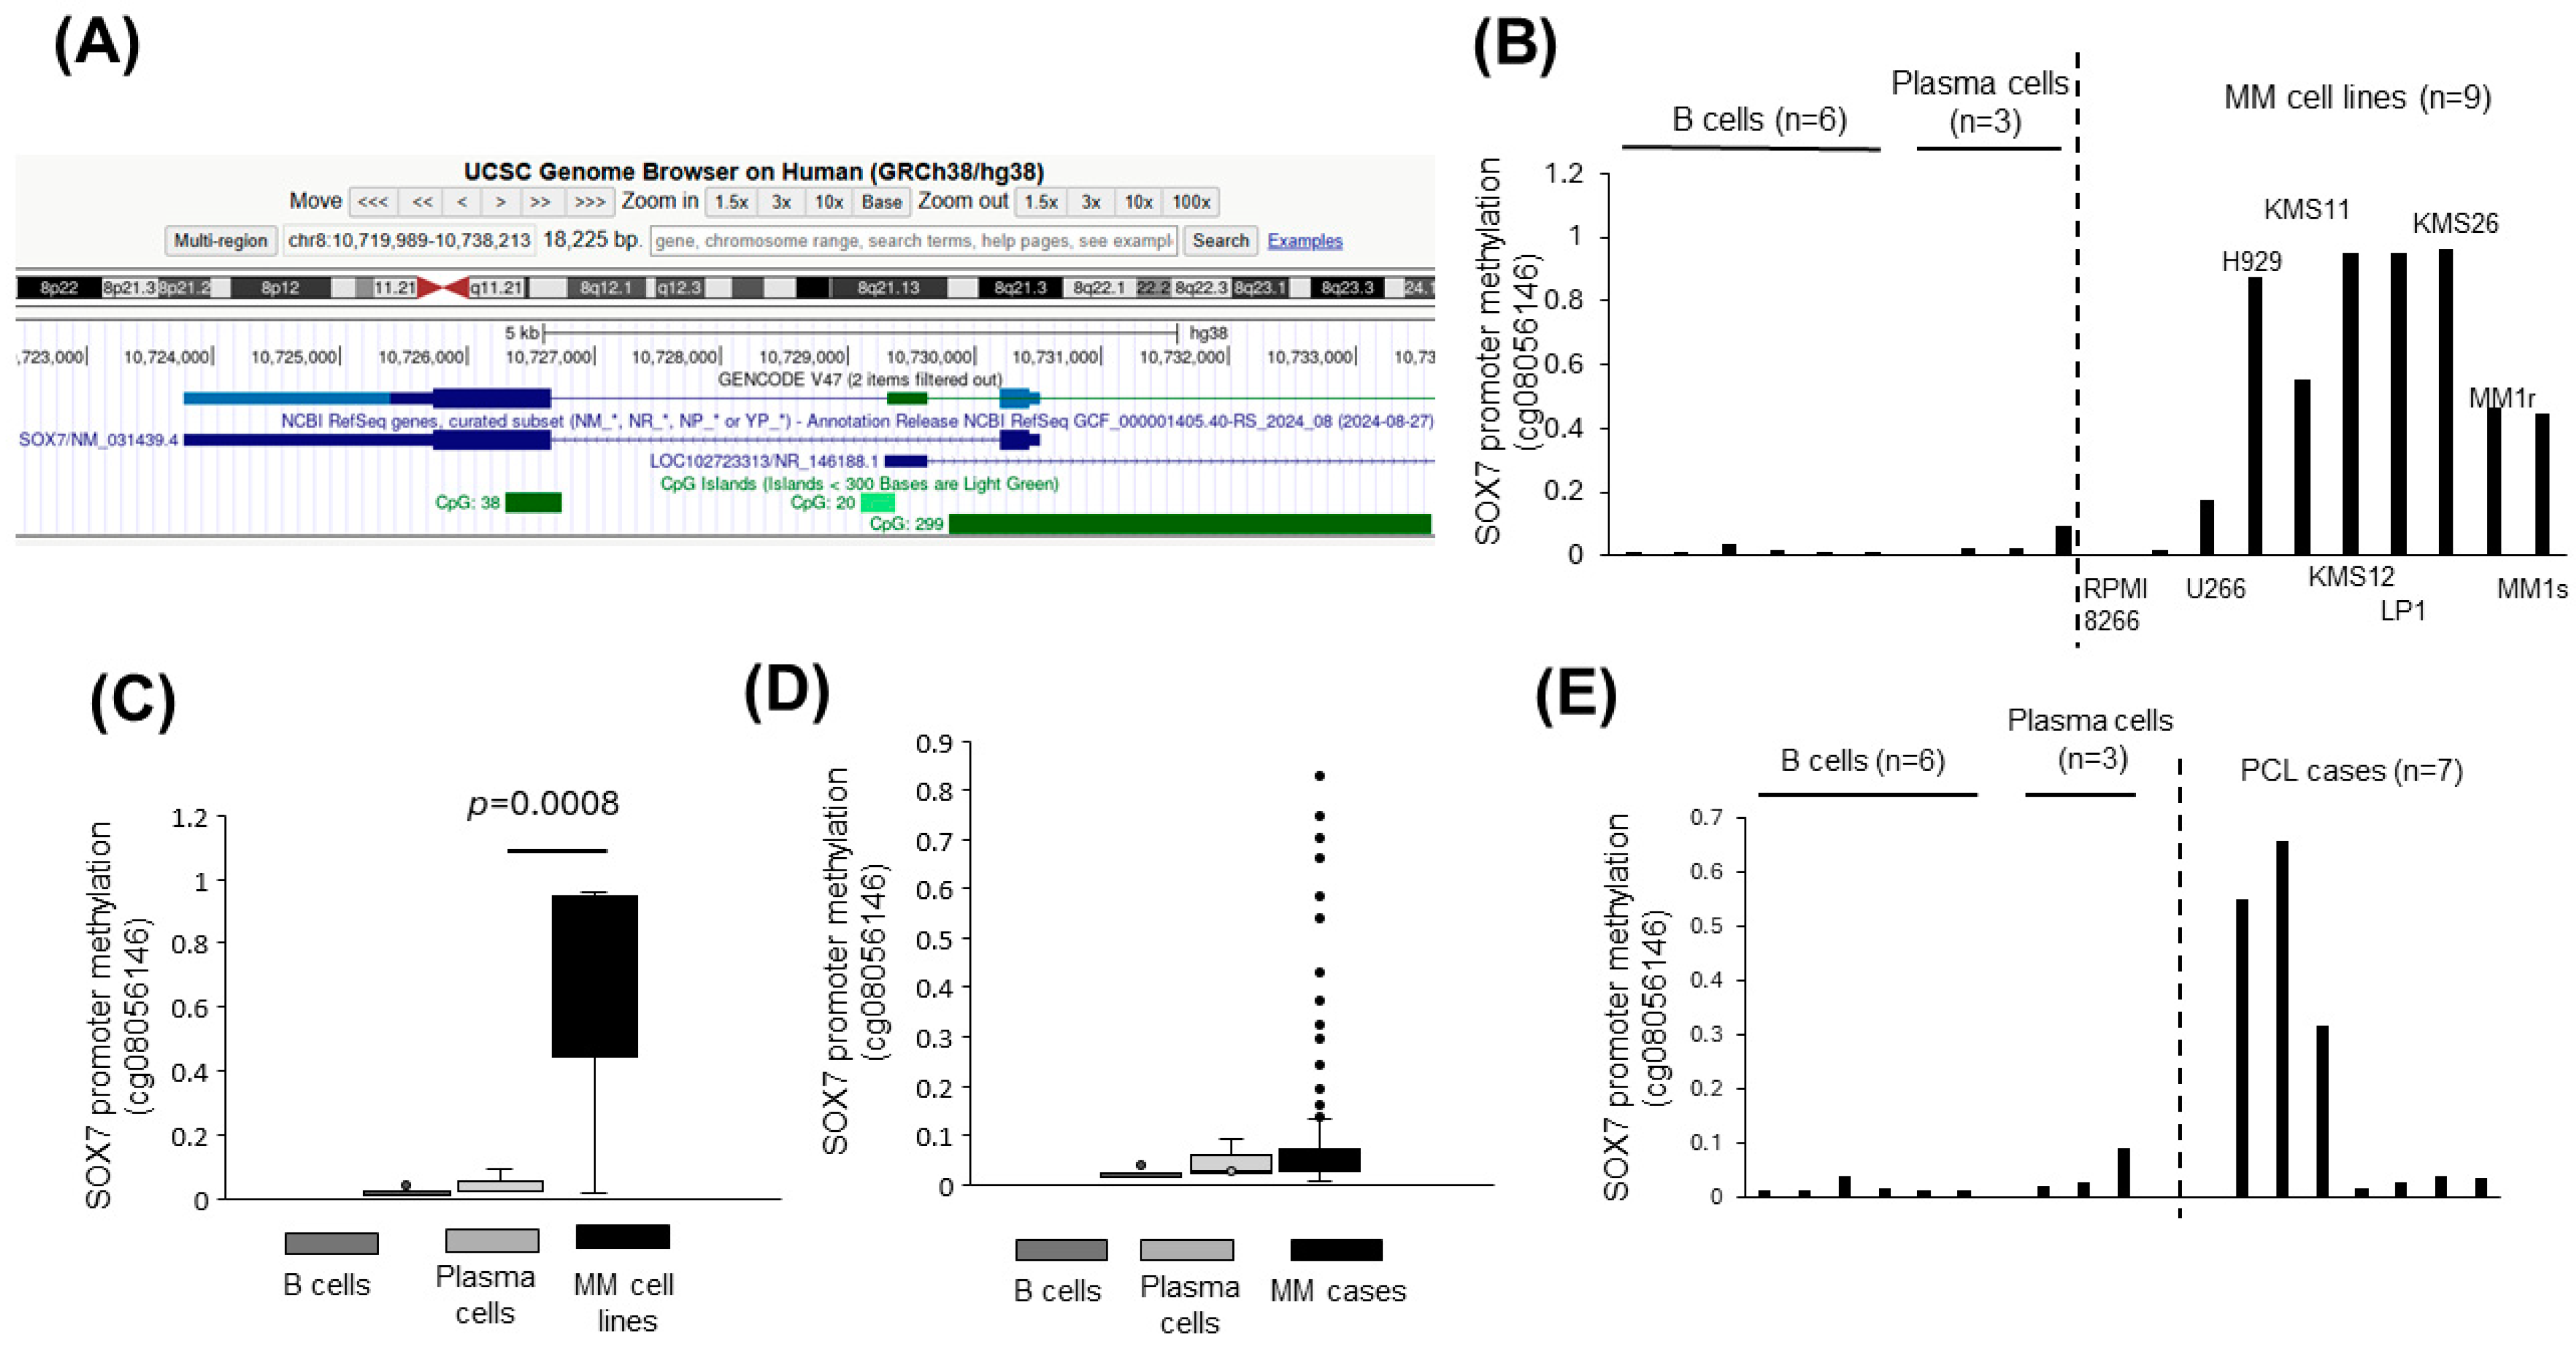
3.2. SOX7 Promoter Is Hypermethylated in Plasma Cell Malignancies

Based on the UCSC genome browser, there is a CpG island around the transcription start site of the human SOX7 promoter (Figure 2A) raising the possibility of epigenetic downregulation of SOX7 in MM. First, we analyzed the promoter methylation status of SOX7 in MM cell lines and observed hypermethylation in 7 of 9 (77.8%) cell lines compared with that of normal PC or B cell samples (Figure 2B). Consistent with this observation, SOX7 hypermethylation of MM cell lines was overall statistically significant (Figure 2C). At least, 13% (21 of 161) of the newly diagnosed MM cases showed hypermethylation of the SOX7 promoter compared with that of the normal plasma or B cells (Figure 2D and Figure S2). Importantly, 3 of 7 (42.9%) of the PCL cases had hypermethylation of SOX7 (Figure 2E).

3.3. Deletion and Promoter Methylation of SOX7 Tend to Occur in Different MM Cases

Next, we evaluated SOX7 deletion status in MM tumor samples obtained during the diagnosis or relapse stage. The copy number values of SOX7 showed moderate levels of positive correlation between patient-matched diagnostic and relapsed MM samples (Figure 3A). SOX7 promoter was methylated in 6 of 20 (30%) of the diagnostic MM cases, and 13 of 20 (65%) of the MM tumor samples obtained at relapse (Figure 3B). In fact, promoter methylation levels of SOX7 were significantly higher in relapsed MM cases (Figure 3C). To address whether deletion and promoter hypermethylation of SOX7 occur in the same or different cases, we analyzed the relationship between SOX7 copy number and promoter methylation levels. Interestingly, SOX7 copy number and promoter methylation values were positively correlated in diagnostic (Figure 3D) as well as relapsed (Figure 3E) MM cases.

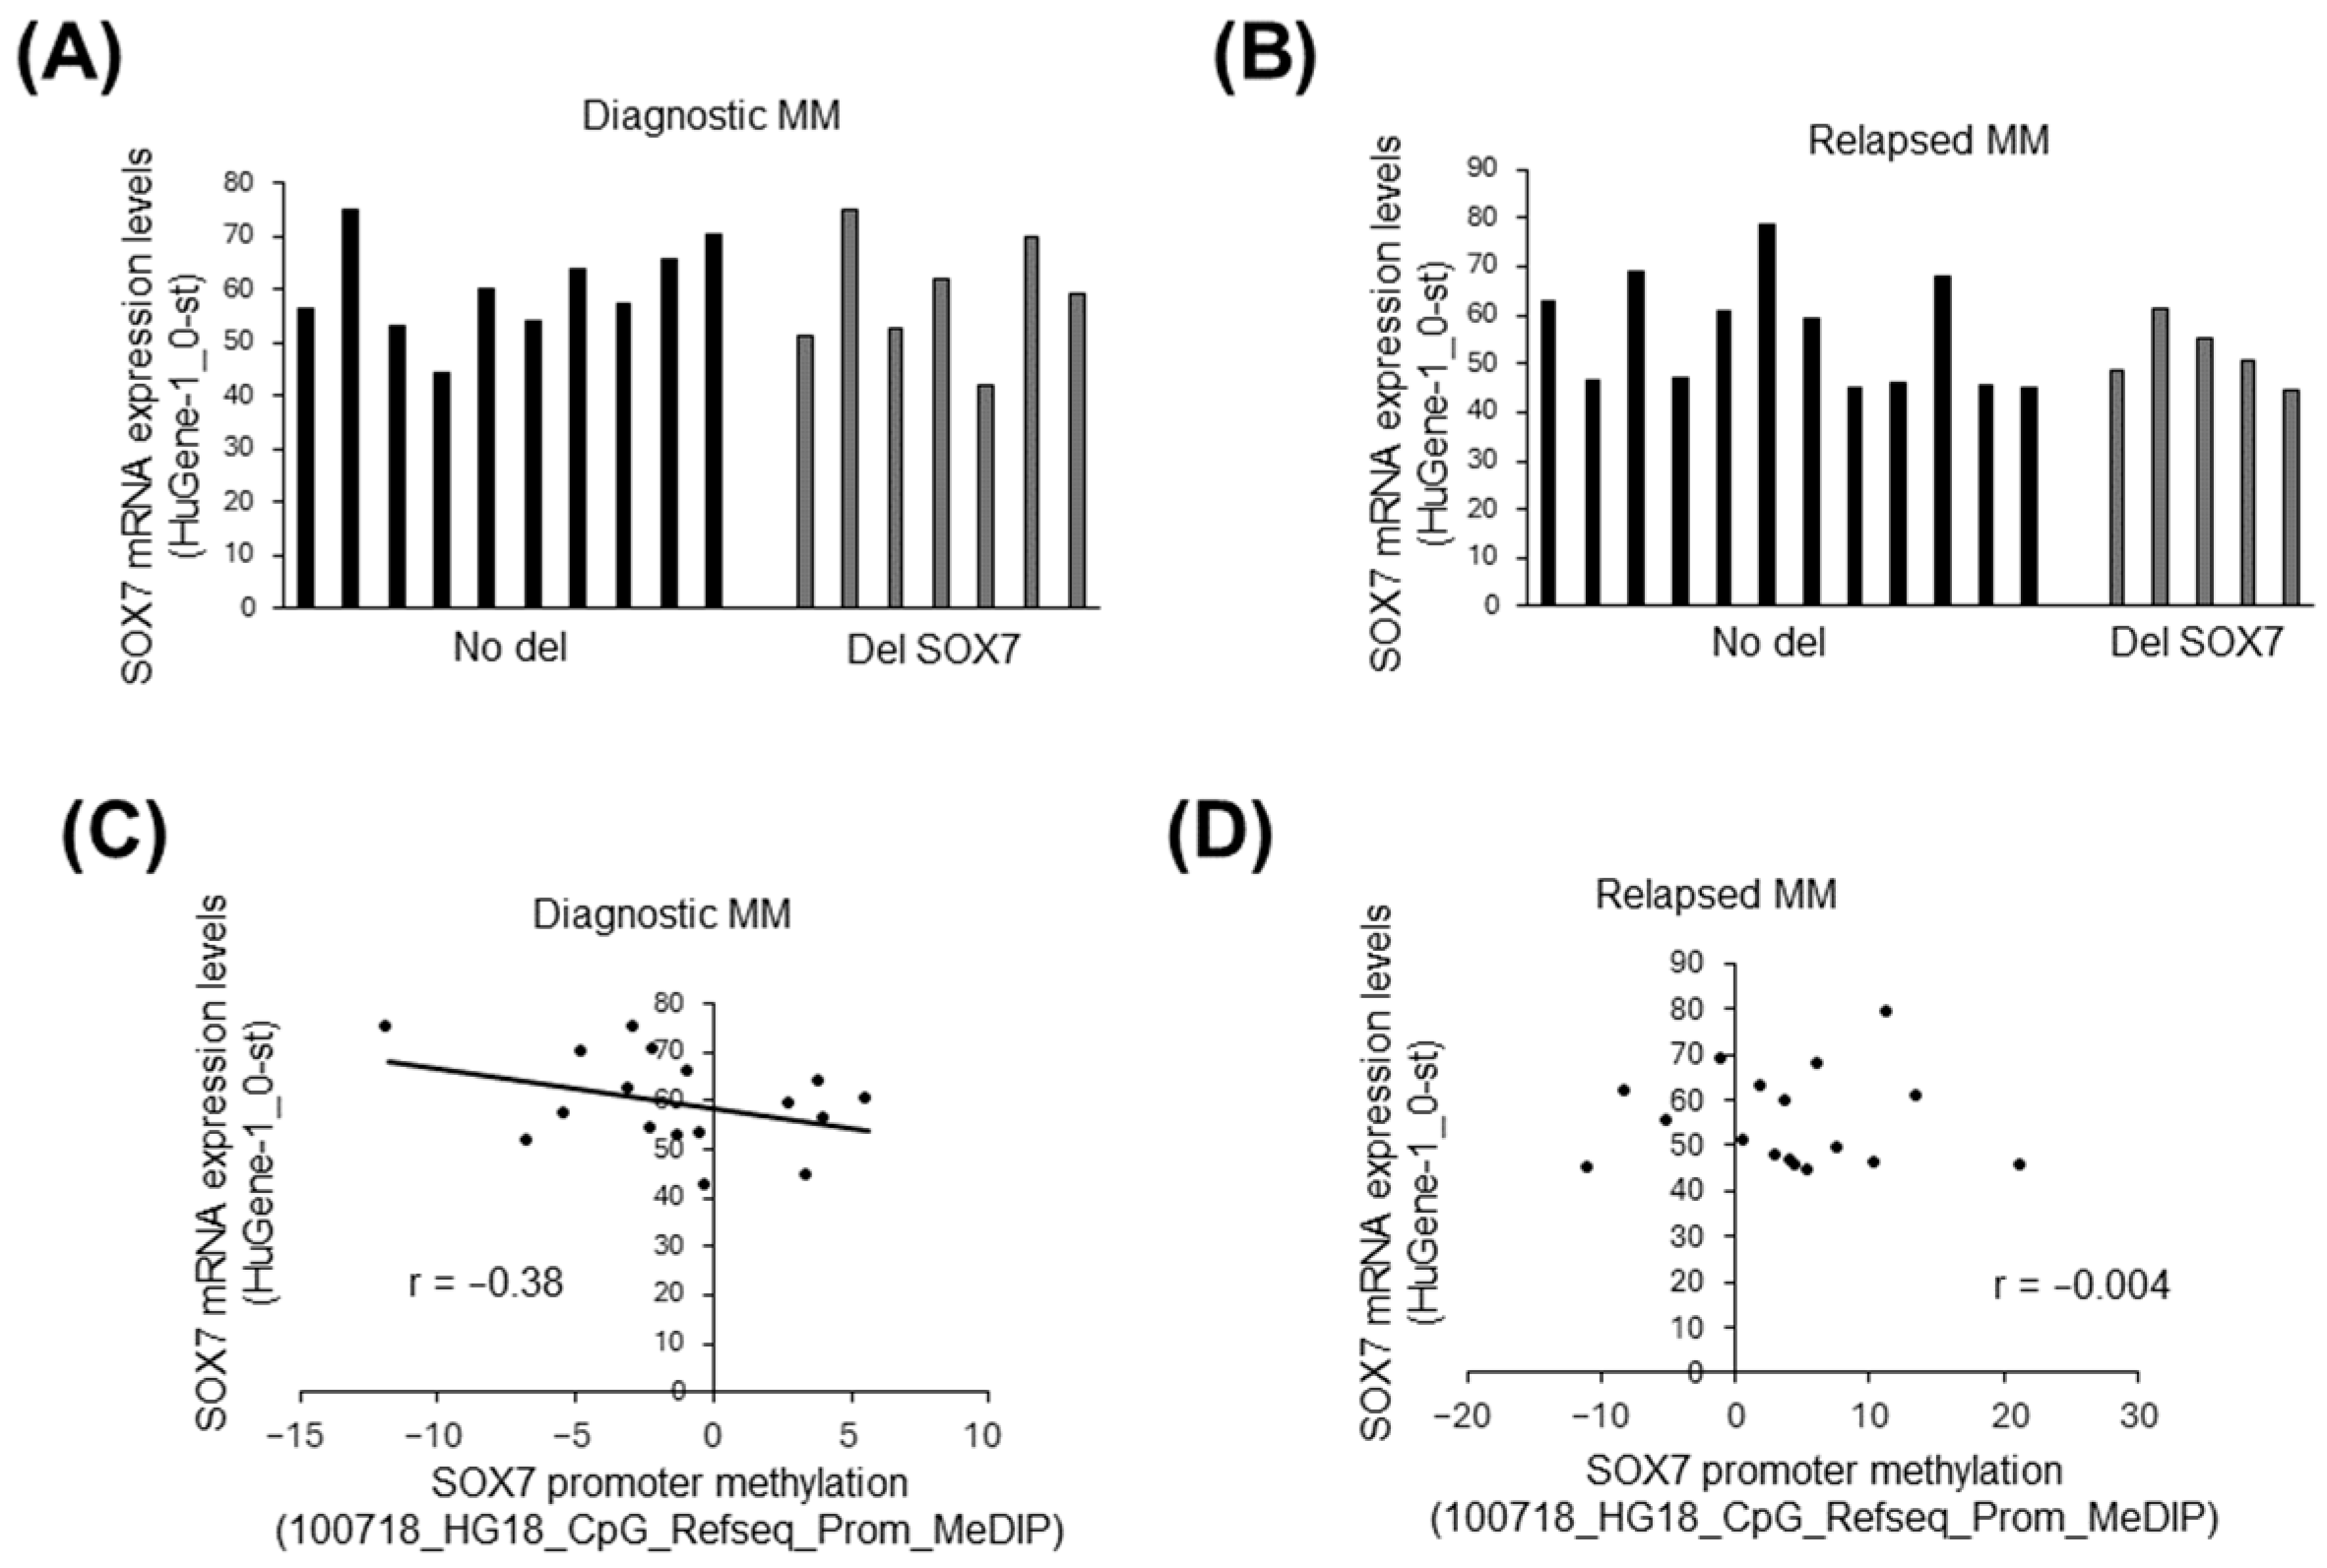
3.4. The Influence of Deletion and Methylation on Expression of Candidate Tumor Suppressors in 8p23.1

To address whether deletion or methylation affects mRNA expression levels of SOX7 as well as other two tumor suppressor candidates located in del8p23.1, we first compared mRNA expression levels of SOX7 with/without del8p23.1 in patient-matched diagnostic and relapsed MM samples. There was a marginal difference in terms of mRNA expression levels of diagnostic MM cases with/without SOX7 deletion (Figure 4A and Figure S3A), whereas relapsed MM cases with SOX7 deletion tended to have lower SOX7 mRNA expression levels (Figure 4B and Figure S3B). We then compared promoter methylation and mRNA expression levels of SOX7 in diagnostic and relapsed MM cases. There was an inverse correlation between promoter methylation and SOX7 mRNA expression levels in diagnostic MM cases (Figure 4C); whereas, we did not observe any relationship in tumor samples obtained at relapse (Figure 4D).
When we repeated the same analyses for PINX1, we observed that some MM cases without deletion have higher mRNA expression (Figure 5A). Of note, there was a moderate level of inverse correlation between promoter methylation and transcript expression (Figure 5B). The third candidate tumor suppressor gene (MSRA) evaluated showed lower mRNA expression in MM cases with deletion (Figure 5C), whereas there was no inverse correlation between methylation and expression (Figure 5D).

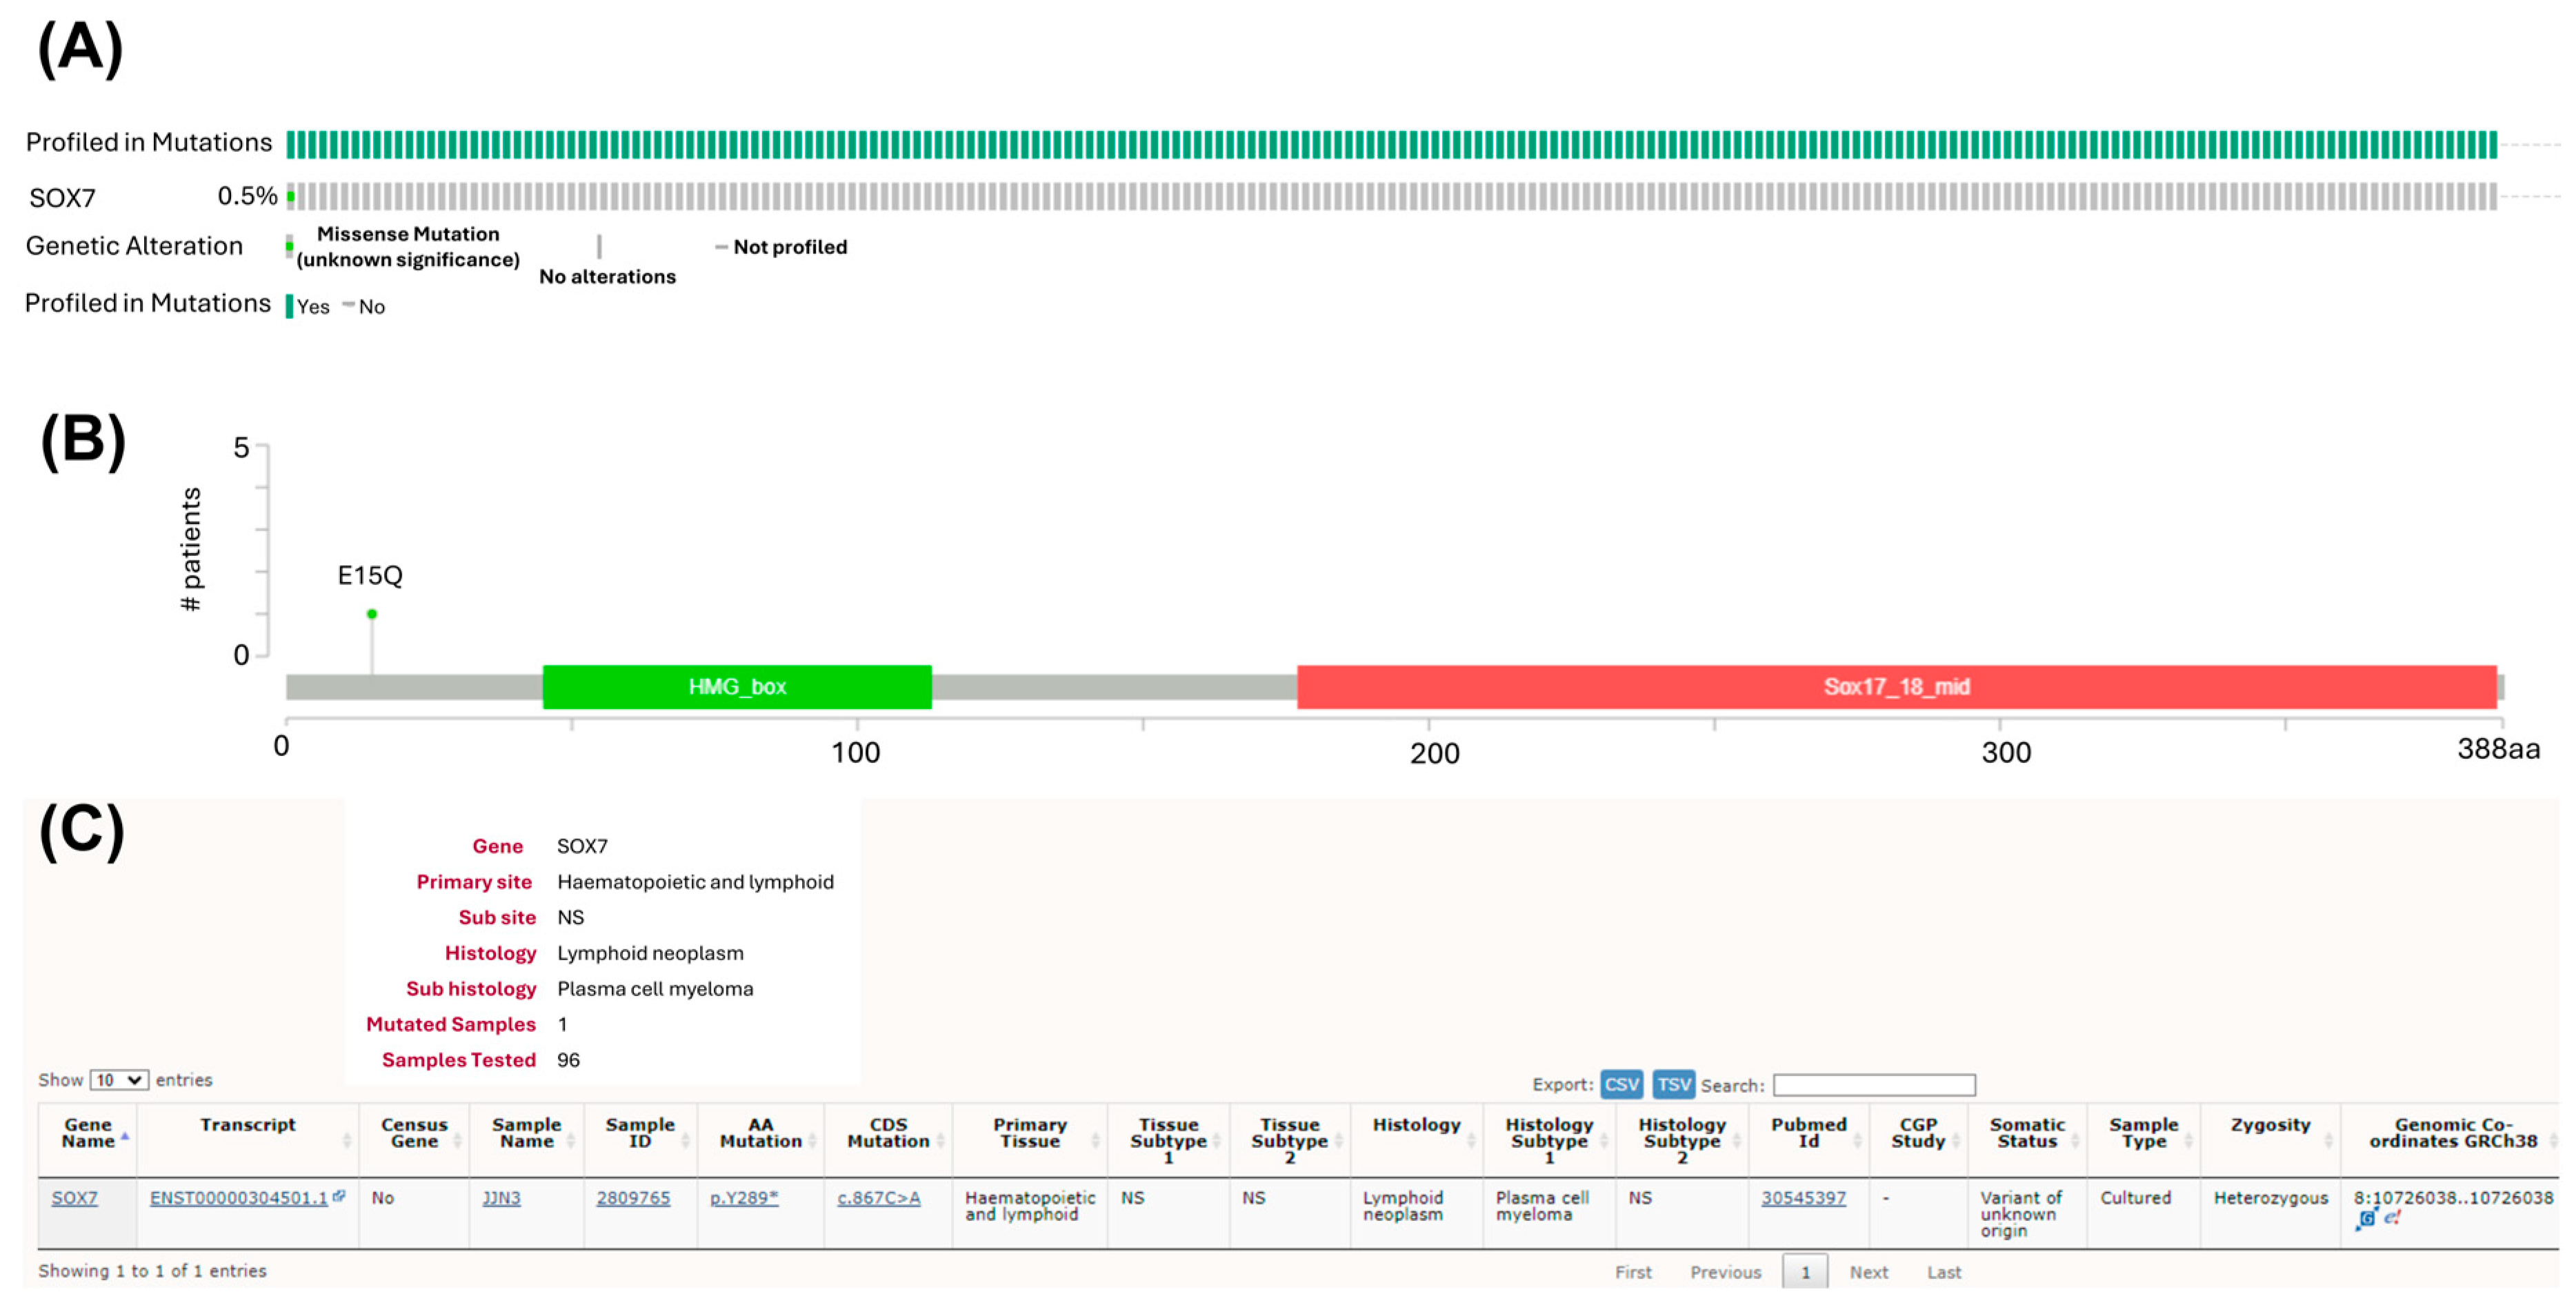
3.5. Mutations of SOX7 Are Infrequent in MM Tumor Samples

Next, we investigated whether small mutations (e.g., point mutations, indels) of SOX7 were observed frequently in MM. To address this question, we first visualized the available SOX7 mutation data in the cBioPortal database. Only one of the 205 MM samples (0.5%) evaluated contained a small mutation (Figure 6A), which was a missense mutation (p.E15Q) located close to the N-terminus in an MM case (Figure 6B). Next, we observed the SOX7 mutation status of MM samples by browsing the COSMIC website. Similar to the available data in the cBioPortal database, the incidence of SOX7 mutations in MM samples was quite low with a frequency of 1% (1 of 96 samples) (Figure 6C). The point mutation (c.867C>A) was located within the coding sequence of the JJN3 cell line with an expected alteration of p.Y289* in the SOX7 protein [38].

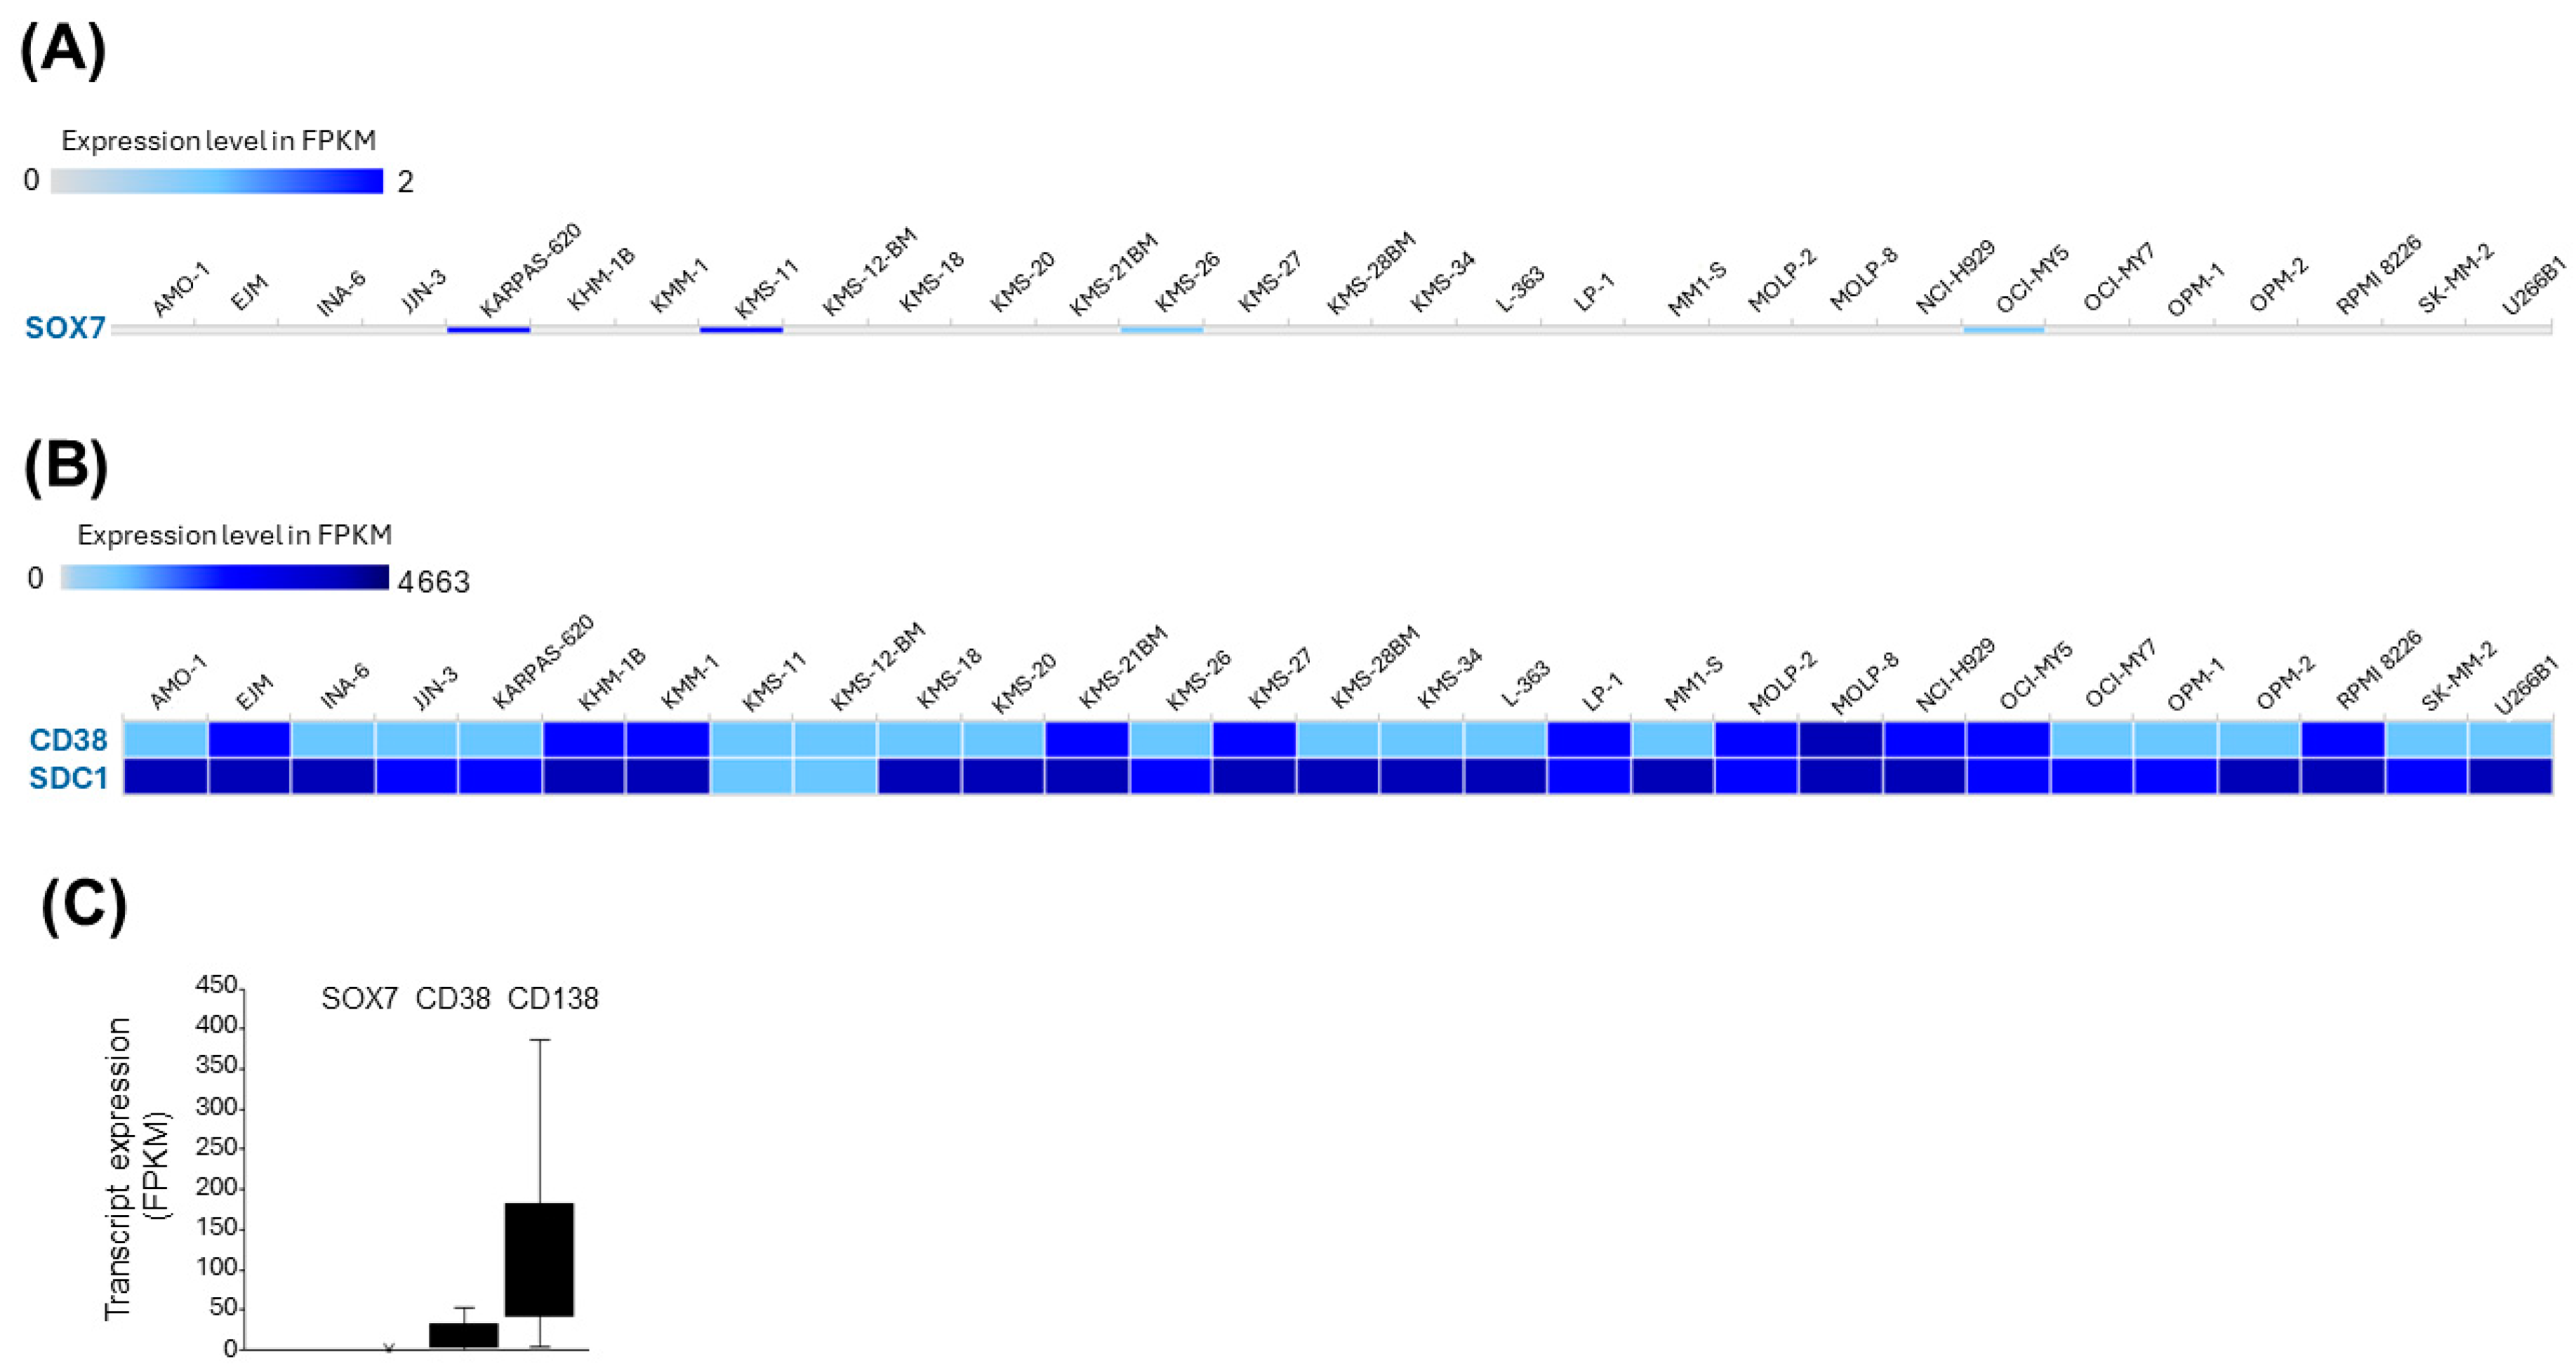
3.6. SOX7 Is Transcriptionally Silent in MM Cell Lines

When RNA-seq expression levels of 29 MM cell lines from the Cancer Cell Line Encyclopedia were visually analyzed in the Expression Atlas database, we observed that 25 of 29 (86.2%) MM cell lines did not have SOX7 transcript expression, whereas other MM cell lines also had quite low expression (Figure 7A). By contrast, two specific markers of MM, CD38 and CD138 (SDC1), were expressed in all MM cell lines (Figure 7B). Compared with the expression levels of CD38 and CD138 (SDC1), SOX7 can be considered transcriptionally silent in all MM cell lines (Figure 7C).

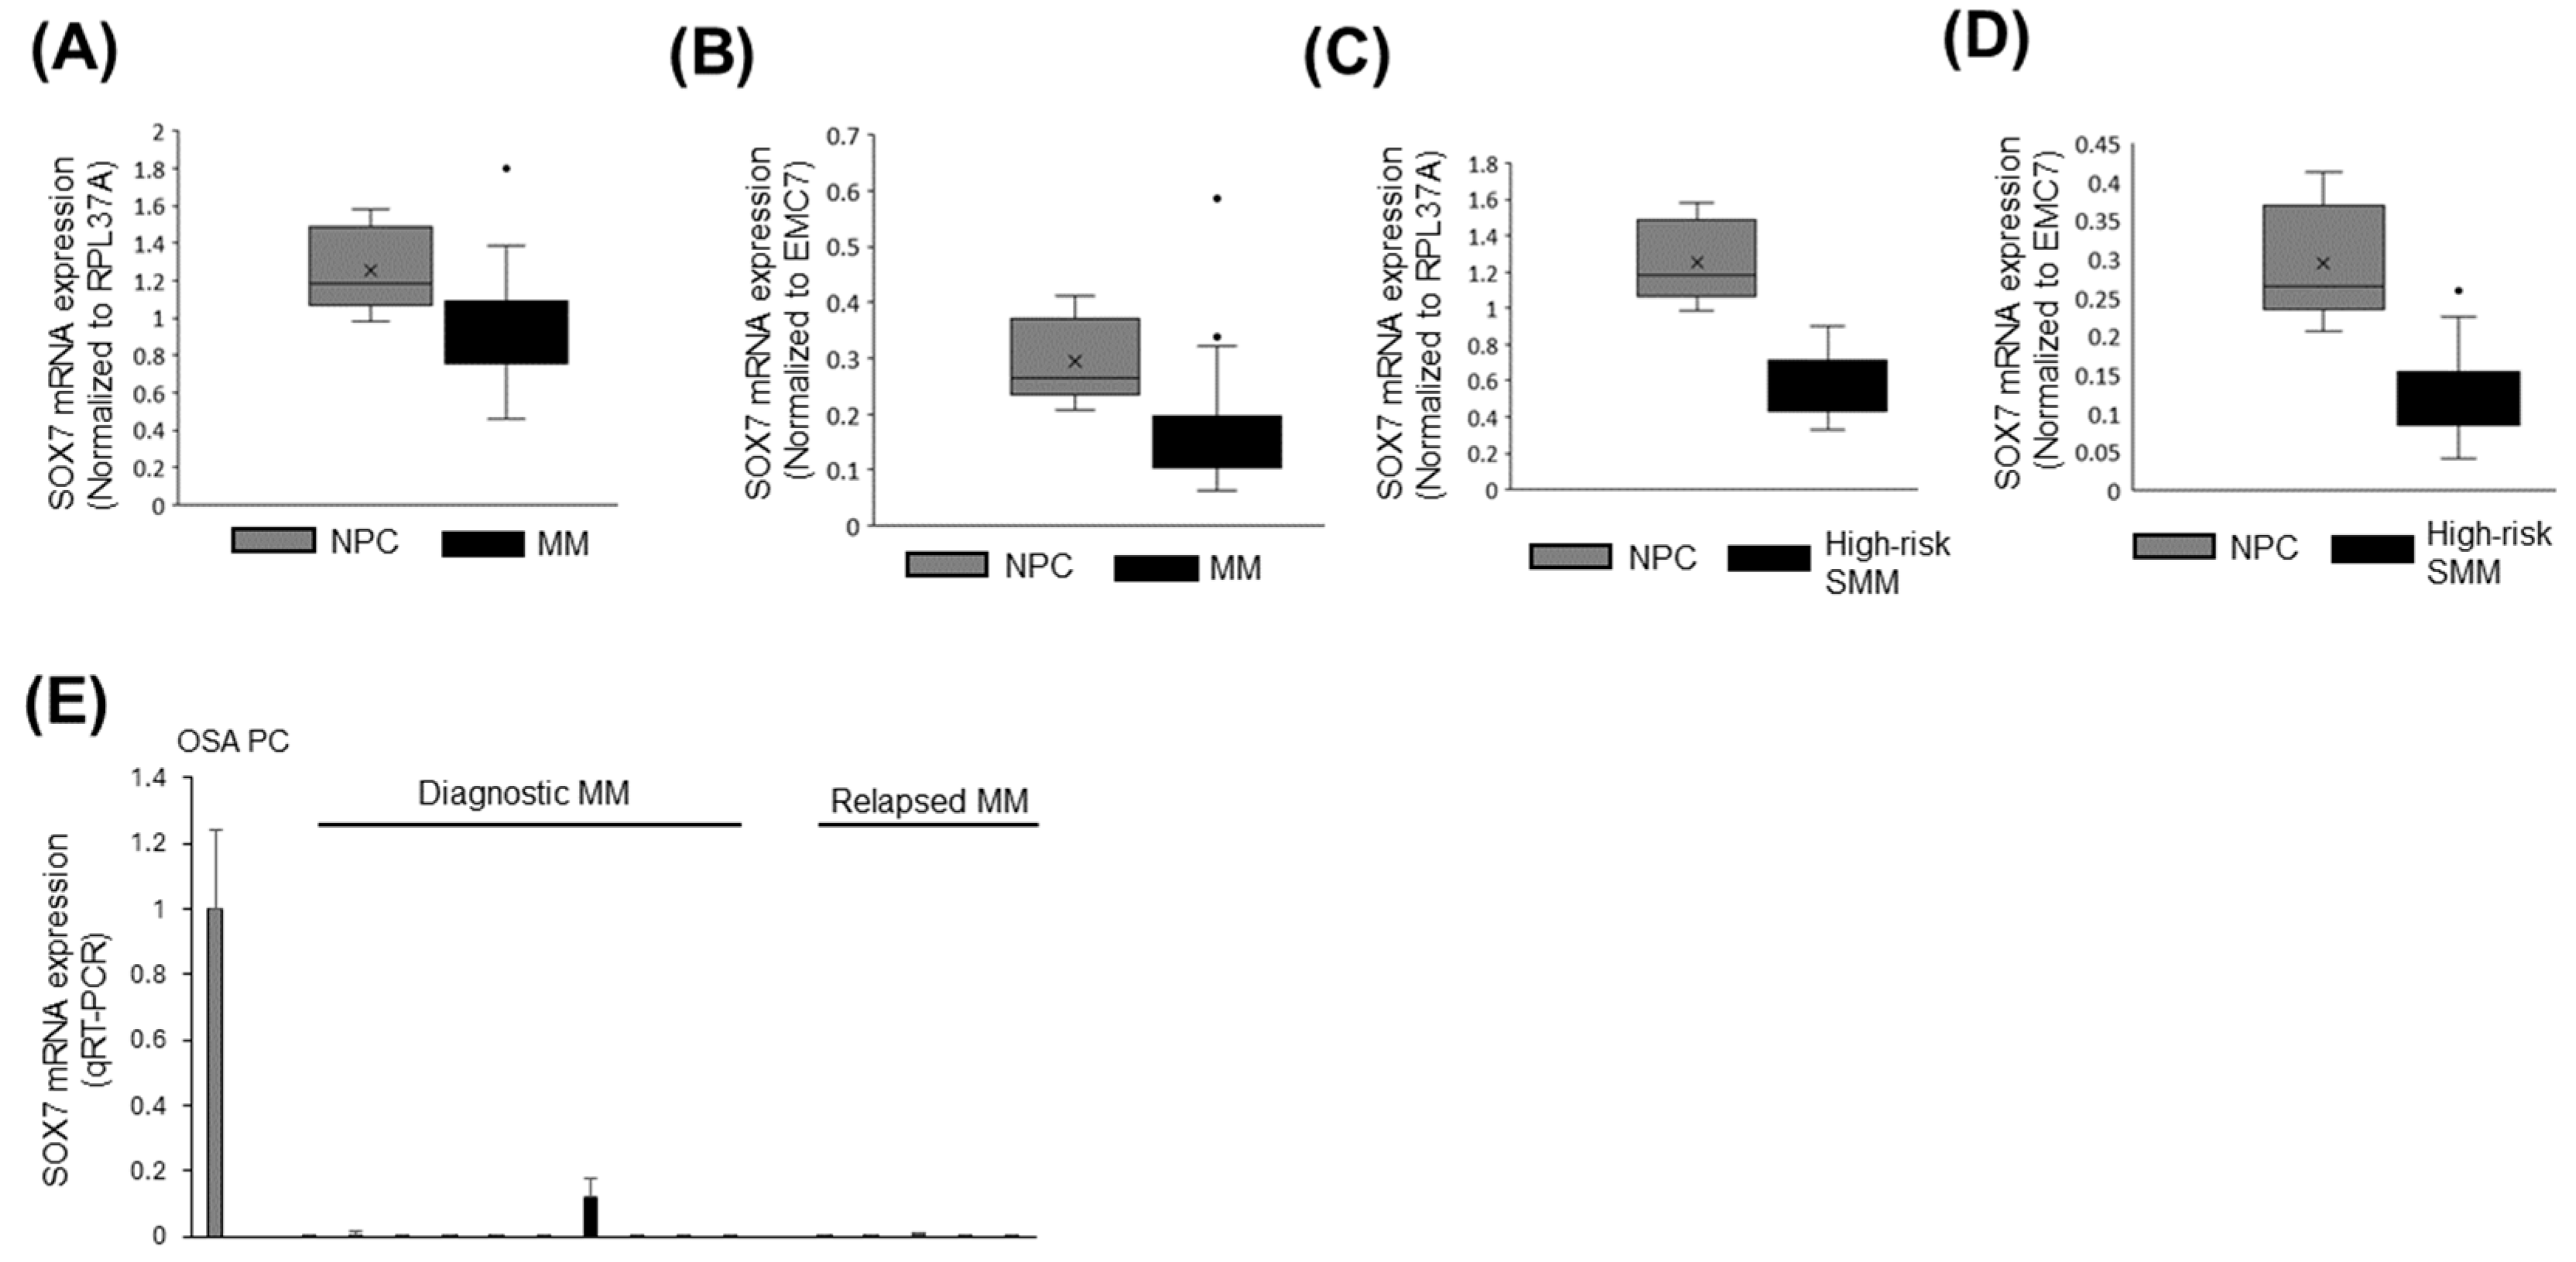
3.7. SOX7 Was Underexpressed in MM and High-Risk SMM Compared to Normal PCs

Next, we analyzed previously reported DNA microarray data to evaluate whether SOX7 is differentially expressed in MM cases compared to normal PCs. We observed significant downregulation of SOX7 expression in MM bone marrow tumor samples compared to normal bone marrow PC samples when expression levels of RPL37A (Figure 8A) or EMC7 (Figure 8B) housekeeping gene were used to obtain normalized expression of each sample. Using the same DNA microarray data, we also analyzed SOX7 transcript expression in high-risk SMM cases. Similar to the results of MM cases, SOX7 transcript levels were significantly lower in high-risk SMM cases compared with control samples regardless of whether RPL37A (Figure 8C) or EMC7 (Figure 8D) was used for normalization of the SOX7 gene expression across the samples. Similar to the results of the DNA microarray, we observed underexpression of SOX7 by qRT-PCR in diagnostic and relapsed MM cases compared with the control group samples (Figure 8E).

4. Discussion

Genomic regions with recurrent deletions are enriched in tumor suppressor genes [39]. Identification of these deleted regions by conducting genome-wide copy number analyses [40] generates a short list of candidate tumor suppressors for further studies and functional characterization [41,42]. Similar to other high-throughput genome-wide approaches, the copy number alterations identified by CGH or SNP arrays [43] need to be cross-validated with locus-specific approaches such as qPCR or FISH [44] before proceeding with further characterization.
Both SNP array and quantitative PCR results provided support for the presence of SOX7 deletions in a fraction of MM cases (Figure 1), which is in line with a previous study reporting homozygous deletions of 8p23.1 genomic locus in certain MM cases [19]. The fact that SOX7 deletions are also frequent in relapsed MM cases supports a previous study that reported SOX7 to be deleted in an MM case during two consecutive relapses [29]. Given that lower expression levels were observed in many relapsed MM cases with SOX7 deletion both in the public data (Figure 4B) and the in-house cohort (Figure S3B), SOX7 underexpression due to this deletion may be one of the contributing factors for clonal selection associated with MM relapse. Tumor heterogeneity due to the presence of multiple genetic clones [45] together with the presence of variable degrees of promoter hypermethylation among MM tumor samples may be responsible for the less obvious difference in SOX7 transcript expression in MM cases with/without delSOX7.
Epigenetic silencing through promoter-associated CpG island hypermethylation is a commonly observed alteration leading to silencing of tumor suppressor genes in a variety of different lymphoid cancer types such as diffuse large B cell lymphoma [46], natural killer cell lymphoma [47], and mantle cell lymphoma [48]. In general, hypermethylation-mediated silencing occurs through the recruitment of histone deacetylases [49] or nucleosome remodeling complexes [50], which, in turn, generate transcriptionally repressive chromatin.
Since SOX7 promoter hypermethylation is frequently observed in MM cell lines (Figure 2B,C) and MM cases (Figure 2D), SOX7 inactivation in MM may be mainly through the cooperation of deletion and promoter hypermethylation instead of small mutations that are infrequent. The observation that promoter-associated SOX7 hypermethylation is also frequent in PCL cases (Figure 2E) suggests SOX7 as a mainly epigenetically silenced tumor suppressor not only in MM but also in PCL. Future research focusing on the role of SOX7 promoter methylation-related transcriptional cofactors in the SOX7 locus may reveal epigenetic regulators as therapy targets for plasma cell malignancies. Given the positive correlation between copy numbers and methylation (Figure 3D), promoter hypermethylation may be responsible for SOX7 underexpression in newly diagnosed MM cases without deletion. However, we cannot totally exclude the contribution of other mechanisms leading to the underexpression of SOX7 observed in most of the MM cases (Figure 8).
Although these observations provide further evidence that SOX7 is, probably, the most likely candidate gene deserving further investigation in del8p23.1 as a tumor suppressor, we cannot exclude the possibility that PINX1 or MSRA may also have tumor suppressor role owing to their downregulation through deletion and/or promoter methylation in MM cases (Figure 5). Future studies will elucidate whether these genes play a role in MM tumorigenesis or relapse.
There are certain limitations of this study that can be summarized as follows: Firstly, the number of MM cases evaluated for SOX7 copy number with qPCR is relatively small. Secondly, the promoter hypermethylation results are based on microarray data, which may need validation with a locus-specific approach such as pyrosequencing [41] for more refined values. Thirdly, the number of patient-matched samples of MM cases used for integrative analyses of copy number, methylation, and transcription is relatively low. Given the heterogeneity of tumor samples, analyses of SOX7 copy number, promoter methylation, and transcript levels integratively at the single cell level with NGS-based methodologies [51] may yield more refined results regarding the relationship between these genetic or epigenetic aberrations and SOX7 mRNA expression. Finally, other possible mechanisms, such as miRNA-mediated silencing leading to lower expression of SOX7, were not investigated in this study. Future studies may include comprehensive functional characterization of SOX7 in MM cell lines with ectopic SOX7 expression through cell cycle and apoptosis assays. It will also be interesting to identify transcriptional targets of SOX7 in MM cell lines through methodologies such as ChIP-Seq and RNA-Seq to address whether SOX7 targets genes related to tumor suppression.

5. Conclusions

In conclusion, genetic and/or epigenetic inactivation of SOX7 may play a role during the development of MM and allied diseases such as SMM or PCL. Future functional studies will shed light on not only the role of SOX7 in MM cancerogenesis but also on its role as a potential diagnostic or prognostic biomarker. If sufficient evidence for SOX7 can be obtained supporting a tumor suppressive role through functional studies, re-expression of silenced SOX7 through the administration of epi-drugs such as HDAC inhibitors [52] can be considered as a targeted therapy option for MM and allied neoplasms.

Supplementary Materials

The following supporting information can be downloaded at: https://www.mdpi.com/article/10.3390/cimb47040244/s1.

Author Contributions

Conceptualization, C.K.; data curation, C.K. and B.A.; formal analysis, B.A., X.H., T.H., A.C. and B.Y.; funding acquisition, C.K.; investigation, B.A., X.H., T.H., A.C. and B.Y.; methodology, C.K.; resources, A.Ş., O.C.Ö., T.K.E. and G.H.Ö.; validation, X.H. and A.C.; writing—original draft, C.K.; writing—review and editing, C.K., A.C. and B.Y. All authors have read and agreed to the published version of the manuscript.

Funding

This research was funded by the Turkish Society of Hematology Research Project Support Program, grant number 2016-06.

Institutional Review Board Statement

The study was conducted in accordance with the Declaration of Helsinki, and the in-house research involving human participants was approved by the Ethics Committee of Dokuz Eylül University (protocol code: 2530-GOA, date of approval: 14 April 2016). There is no need for ethical approval with respect to the usage of the publicly available data.

Informed Consent Statement

Informed consent was obtained from in-house human participants involved in the study.

Data Availability Statement

The accession numbers of publicly available data used in this study are available in the Section 2. The raw data of the in-house experiments can be requested as long as there is a reasonable justification.

Acknowledgments

We thank Aybüke Olgun and Doğuş Türkyılmaz for their initial assistance during project writing.

Conflicts of Interest

The authors declare no conflicts of interest. The funder had no role in the design of the study; in the collection, analyses, or interpretation of data; in the writing of the manuscript; or in the decision to publish the results.

Abbreviations

The following abbreviations are used in this manuscript:
MMMultiple myeloma
SMMSmoldering multiple myeloma
PCLPlasma cell leukemia
CRCColorectal cancer
QCQuality check
ACKAmmonium–chloride–potassium
MACSMagnetic-activated cell sorting
GEPGene expression profiling
OSAObstructive sleep apnea
HDACHistone deacetylase
NGSNext-generation sequencing

References

  1. Raab, M.S.; Podar, K.; Breitkreutz, I.; Richardson, P.G.; Anderson, K.C. Multiple Myeloma. Lancet 2009, 374, 324–339. [Google Scholar] [CrossRef]
  2. Flores-Montero, J.; Sanoja-Flores, L.; Paiva, B.; Puig, N.; García-Sánchez, O.; Böttcher, S.; van der Velden, V.H.J.; Pérez-Morán, J.-J.; Vidriales, M.-B.; García-Sanz, R.; et al. Next Generation Flow for Highly Sensitive and Standardized Detection of Minimal Residual Disease in Multiple Myeloma. Leukemia 2017, 31, 2094–2103. [Google Scholar] [CrossRef] [PubMed]
  3. Cowan, A.J.; Allen, C.; Barac, A.; Basaleem, H.; Bensenor, I.; Curado, M.P.; Foreman, K.; Gupta, R.; Harvey, J.; Hosgood, H.D.; et al. Global Burden of Multiple Myeloma: A Systematic Analysis for the Global Burden of Disease Study 2016. JAMA Oncol. 2018, 4, 1221–1227. [Google Scholar] [CrossRef]
  4. Kuehl, W.M.; Bergsagel, P.L. Multiple Myeloma: Evolving Genetic Events and Host Interactions. Nat. Rev. Cancer 2002, 2, 175–187. [Google Scholar] [CrossRef]
  5. Ho, M.; Patel, A.; Goh, C.Y.; Moscvin, M.; Zhang, L.; Bianchi, G. Changing Paradigms in Diagnosis and Treatment of Monoclonal Gammopathy of Undetermined Significance (MGUS) and Smoldering Multiple Myeloma (SMM). Leukemia 2020, 34, 3111–3125. [Google Scholar] [CrossRef]
  6. Albarracin, F.; Fonseca, R. Plasma Cell Leukemia. Blood Rev. 2011, 25, 107–112. [Google Scholar] [CrossRef] [PubMed]
  7. Richardson, P.G.; Sonneveld, P.; Schuster, M.W.; Irwin, D.; Stadtmauer, E.A.; Facon, T.; Harousseau, J.-L.; Ben-Yehuda, D.; Lonial, S.; Goldschmidt, H.; et al. Bortezomib or High-Dose Dexamethasone for Relapsed Multiple Myeloma. N. Engl. J. Med. 2005, 352, 2487–2498. [Google Scholar] [CrossRef]
  8. McCarthy, P.L.; Owzar, K.; Hofmeister, C.C.; Hurd, D.D.; Hassoun, H.; Richardson, P.G.; Giralt, S.; Stadtmauer, E.A.; Weisdorf, D.J.; Vij, R.; et al. Lenalidomide after Stem-Cell Transplantation for Multiple Myeloma. N. Engl. J. Med. 2012, 366, 1770–1781. [Google Scholar] [CrossRef] [PubMed]
  9. Barlogie, B.; Tricot, G.; Anaissie, E.; Shaughnessy, J.; Rasmussen, E.; van Rhee, F.; Fassas, A.; Zangari, M.; Hollmig, K.; Pineda-Roman, M.; et al. Thalidomide and Hematopoietic-Cell Transplantation for Multiple Myeloma. N. Engl. J. Med. 2006, 354, 1021–1030. [Google Scholar] [CrossRef]
  10. Thorsteinsdottir, S.; Dickman, P.W.; Landgren, O.; Blimark, C.; Hultcrantz, M.; Turesson, I.; Björkholm, M.; Kristinsson, S.Y. Dramatically Improved Survival in Multiple Myeloma Patients in the Recent Decade: Results from a Swedish Population-Based Study. Haematologica 2018, 103, e412–e415. [Google Scholar] [CrossRef]
  11. Siegel, D.S.; Dimopoulos, M.A.; Ludwig, H.; Facon, T.; Goldschmidt, H.; Jakubowiak, A.; San-Miguel, J.; Obreja, M.; Blaedel, J.; Stewart, A.K. Improvement in Overall Survival With Carfilzomib, Lenalidomide, and Dexamethasone in Patients With Relapsed or Refractory Multiple Myeloma. J. Clin. Oncol. 2018, 36, 728–734. [Google Scholar] [CrossRef] [PubMed]
  12. Kumar, S.K.; Therneau, T.M.; Gertz, M.A.; Lacy, M.Q.; Dispenzieri, A.; Rajkumar, S.V.; Fonseca, R.; Witzig, T.E.; Lust, J.A.; Larson, D.R.; et al. Clinical Course of Patients with Relapsed Multiple Myeloma. Mayo Clin. Proc. 2004, 79, 867–874. [Google Scholar] [CrossRef]
  13. Robak, P.; Drozdz, I.; Szemraj, J.; Robak, T. Drug Resistance in Multiple Myeloma. Cancer Treat. Rev. 2018, 70, 199–208. [Google Scholar] [CrossRef]
  14. Esmeray, E.; Küçük, C. Genetic Alterations in b Cell Lymphoma Subtypes as Potential Biomarkers for Noninvasive Diagnosis, Prognosis, Therapy, and Disease Monitoring. Turk. J. Biol. 2020, 44, 1–14. [Google Scholar] [PubMed]
  15. Cao, Q.; Tian, Y.; Deng, Z.; Yang, F.; Chen, E. Epigenetic Alteration in Colorectal Cancer: Potential Diagnostic and Prognostic Implications. Int. J. Mol. Sci. 2024, 25, 3358. [Google Scholar] [CrossRef] [PubMed]
  16. Li, R.; Todd, N.W.; Qiu, Q.; Fan, T.; Zhao, R.Y.; Rodgers, W.H.; Fang, H.-B.; Katz, R.L.; Stass, S.A.; Jiang, F. Genetic Deletions in Sputum as Diagnostic Markers for Early Detection of Stage I Non-Small Cell Lung Cancer. Clin. Cancer Res. 2007, 13, 482–487. [Google Scholar] [CrossRef]
  17. Müller, D.; Győrffy, B. DNA Methylation-Based Diagnostic, Prognostic, and Predictive Biomarkers in Colorectal Cancer. Biochim. Biophys. Acta Rev. Cancer 2022, 1877, 188722. [Google Scholar] [CrossRef]
  18. Wei, B.; Wu, F.; Xing, W.; Sun, H.; Yan, C.; Zhao, C.; Wang, D.; Chen, X.; Chen, Y.; Li, M.; et al. A Panel of DNA Methylation Biomarkers for Detection and Improving Diagnostic Efficiency of Lung Cancer. Sci. Rep. 2021, 11, 16782. [Google Scholar] [CrossRef]
  19. Lohr, J.G.; Stojanov, P.; Carter, S.L.; Cruz-Gordillo, P.; Lawrence, M.S.; Auclair, D.; Sougnez, C.; Knoechel, B.; Gould, J.; Saksena, G.; et al. Widespread Genetic Heterogeneity in Multiple Myeloma: Implications for Targeted Therapy. Cancer Cell 2014, 25, 91–101. [Google Scholar] [CrossRef]
  20. Lei, K.-F.; Wang, Y.-F.; Zhu, X.-Q.; Lu, P.-C.; Sun, B.-S.; Jia, H.-L.; Ren, N.; Ye, Q.-H.; Sun, H.-C.; Wang, L.; et al. Identification of MSRA Gene on Chromosome 8p as a Candidate Metastasis Suppressor for Human Hepatitis B Virus-Positive Hepatocellular Carcinoma. BMC Cancer 2007, 7, 172. [Google Scholar] [CrossRef]
  21. Zhou, X.Z.; Huang, P.; Shi, R.; Lee, T.H.; Lu, G.; Zhang, Z.; Bronson, R.; Lu, K.P. The Telomerase Inhibitor PinX1 Is a Major Haploinsufficient Tumor Suppressor Essential for Chromosome Stability in Mice. J. Clin. Investig. 2011, 121, 1266–1282. [Google Scholar] [CrossRef] [PubMed]
  22. Zhang, Y.; Huang, S.; Dong, W.; Li, L.; Feng, Y.; Pan, L.; Han, Z.; Wang, X.; Ren, G.; Su, D.; et al. SOX7, down-Regulated in Colorectal Cancer, Induces Apoptosis and Inhibits Proliferation of Colorectal Cancer Cells. Cancer Lett. 2009, 277, 29–37. [Google Scholar] [CrossRef]
  23. Zhang, Y.; Stovall, D.B.; Wan, M.; Zhang, Q.; Chou, J.W.; Li, D.; Sui, G. SOX7 Target Genes and Their Contribution to Its Tumor Suppressive Function. Int. J. Mol. Sci. 2018, 19, 1451. [Google Scholar] [CrossRef] [PubMed]
  24. Hayano, T.; Garg, M.; Yin, D.; Sudo, M.; Kawamata, N.; Shi, S.; Chien, W.; Ding, L.-W.; Leong, G.; Mori, S.; et al. SOX7 Is Down-Regulated in Lung Cancer. J. Exp. Clin. Cancer Res. 2013, 32, 17. [Google Scholar] [CrossRef]
  25. Li, B.; Ge, Z.; Song, S.; Zhang, S.; Yan, H.; Huang, B.; Zhang, Y. Decreased Expression of SOX7 Is Correlated with Poor Prognosis in Lung Adenocarcinoma Patients. Pathol. Oncol. Res. 2012, 18, 1039–1045. [Google Scholar] [CrossRef]
  26. Cui, J.; Xi, H.; Cai, A.; Bian, S.; Wei, B.; Chen, L. Decreased Expression of SOX7 Correlates with the Upregulation of the Wnt/β-Catenin Signaling Pathway and the Poor Survival of Gastric Cancer Patients. Int. J. Mol. Med. 2014, 34, 197–204. [Google Scholar] [CrossRef]
  27. Liu, H.; Yan, Z.-Q.; Li, B.; Yin, S.-Y.; Sun, Q.; Kou, J.-J.; Ye, D.; Ferns, K.; Liu, H.-Y.; Liu, S.-L. Reduced Expression of SOX7 in Ovarian Cancer: A Novel Tumor Suppressor through the Wnt/β-Catenin Signaling Pathway. J. Ovarian Res. 2014, 7, 87. [Google Scholar] [CrossRef]
  28. Sun, Q.-Y.; Ding, L.-W.; Johnson, K.; Zhou, S.; Tyner, J.W.; Yang, H.; Doan, N.B.; Said, J.W.; Xiao, J.-F.; Loh, X.-Y.; et al. SOX7 Regulates MAPK/ERK-BIM Mediated Apoptosis in Cancer Cells. Oncogene 2019, 38, 6196–6210. [Google Scholar] [CrossRef] [PubMed]
  29. Seyhanli, A.; Hatipoglu, T.; Akman, B.; Hu, X.; Ozsan, G.H.; Kucuk, C. Genetic and Epigenetic Analyses Reveal Transcriptional Silencing of SOX7 Due to Deletion in a Multiple Myeloma Case with Double Relapse. UHOD—Uluslar. Hematol.-Onkol. Derg. 2023, 33, 54–56. [Google Scholar]
  30. Kim, D.; Park, C.Y.; Medeiros, B.C.; Weissman, I.L. CD19-CD45 Low/- CD38 High/CD138+ Plasma Cells Enrich for Human Tumorigenic Myeloma Cells. Leukemia 2012, 26, 2530–2537. [Google Scholar] [CrossRef]
  31. Hu, X.; Baytak, E.; Li, J.; Akman, B.; Okay, K.; Hu, G.; Scuto, A.; Zhang, W.; Küçük, C. The Relationship of REL Proto-Oncogene to Pathobiology and Chemoresistance in Follicular and Transformed Follicular Lymphoma. Leuk. Res. 2017, 54, 30–38. [Google Scholar] [CrossRef]
  32. Zhang, J.; Jima, D.D.; Jacobs, C.; Fischer, R.; Gottwein, E.; Huang, G.; Lugar, P.L.; Lagoo, A.S.; Rizzieri, D.A.; Friedman, D.R.; et al. Patterns of MicroRNA Expression Characterize Stages of Human B-Cell Differentiation. Blood 2009, 113, 4586–4594. [Google Scholar] [CrossRef]
  33. Medina, F.; Segundo, C.; Brieva, J.A. Purification of Human Tonsil Plasma Cells: Pre-Enrichment Step by Immunomagnetic Selection of CD31(+) Cells. Cytometry 2000, 39, 231–234. [Google Scholar] [CrossRef]
  34. Kjeldsen, E. Identification of Prognostically Relevant Chromosomal Abnormalities in Routine Diagnostics of Multiple Myeloma Using Genomic Profiling. Cancer Genom. Proteom. 2016, 13, 91–127. [Google Scholar]
  35. Walker, B.A.; Wardell, C.P.; Chiecchio, L.; Smith, E.M.; Boyd, K.D.; Neri, A.; Davies, F.E.; Ross, F.M.; Morgan, G.J. Aberrant Global Methylation Patterns Affect the Molecular Pathogenesis and Prognosis of Multiple Myeloma. Blood 2011, 117, 553–562. [Google Scholar] [CrossRef] [PubMed]
  36. Krzeminski, P.; Corchete, L.A.; García, J.L.; López-Corral, L.; Fermiñán, E.; García, E.M.; Martín, A.A.; Hernández-Rivas, J.M.; García-Sanz, R.; San Miguel, J.F.; et al. Integrative Analysis of DNA Copy Number, DNA Methylation and Gene Expression in Multiple Myeloma Reveals Alterations Related to Relapse. Oncotarget 2016, 7, 80664–80679. [Google Scholar] [CrossRef] [PubMed]
  37. López-Corral, L.; Corchete, L.A.; Sarasquete, M.E.; Mateos, M.V.; García-Sanz, R.; Fermiñán, E.; Lahuerta, J.-J.; Bladé, J.; Oriol, A.; Teruel, A.I.; et al. Transcriptome Analysis Reveals Molecular Profiles Associated with Evolving Steps of Monoclonal Gammopathies. Haematologica 2014, 99, 1365–1372. [Google Scholar] [CrossRef]
  38. Tessoulin, B.; Moreau-Aubry, A.; Descamps, G.; Gomez-Bougie, P.; Maïga, S.; Gaignard, A.; Chiron, D.; Ménoret, E.; Le Gouill, S.; Moreau, P.; et al. Whole-Exon Sequencing of Human Myeloma Cell Lines Shows Mutations Related to Myeloma Patients at Relapse with Major Hits in the DNA Regulation and Repair Pathways. J. Hematol. Oncol. 2018, 11, 137. [Google Scholar] [CrossRef]
  39. Dong, J.T. Chromosomal Deletions and Tumor Suppressor Genes in Prostate Cancer. Cancer Metastasis Rev. 2001, 20, 173–193. [Google Scholar] [CrossRef]
  40. Iqbal, J.; Kucuk, C.; Deleeuw, R.J.; Srivastava, G.; Tam, W.; Geng, H.; Klinkebiel, D.; Christman, J.K.; Patel, K.; Cao, K.; et al. Genomic Analyses Reveal Global Functional Alterations That Promote Tumor Growth and Novel Tumor Suppressor Genes in Natural Killer-Cell Malignancies. Leukemia 2009, 23, 1139–1151. [Google Scholar] [CrossRef]
  41. Küçük, C.; Iqbal, J.; Hu, X.; Gaulard, P.; De Leval, L.; Srivastava, G.; Au, W.Y.; McKeithan, T.W.; Chan, W.C. PRDM1 Is a Tumor Suppressor Gene in Natural Killer Cell Malignancies. Proc. Natl. Acad. Sci. USA 2011, 108, 20119–20124. [Google Scholar] [CrossRef] [PubMed]
  42. Dong, G.; Li, Y.; Lee, L.; Liu, X.; Shi, Y.; Liu, X.; Bouska, A.; Gong, Q.; Kong, L.; Wang, J.; et al. Genetic Manipulation of Primary Human Natural Killer Cells to Investigate the Functional and Oncogenic Roles of PRDM1. Haematologica 2021, 106, 2427–2438. [Google Scholar] [CrossRef]
  43. Bouska, A.; McKeithan, T.W.; Deffenbacher, K.E.; Lachel, C.; Wright, G.W.; Iqbal, J.; Smith, L.M.; Zhang, W.; Kucuk, C.; Rinaldi, A.; et al. Genome-Wide Copy-Number Analyses Reveal Genomic Abnormalities Involved in Transformation of Follicular Lymphoma. Blood 2014, 123, 1681–1690. [Google Scholar] [CrossRef]
  44. Küçük, C.; Hu, X.; Iqbal, J.; Gaulard, P.; Klinkebiel, D.; Cornish, A.; Dave, B.J.; Chan, W.C. HACE1 Is a Tumor Suppressor Gene Candidate in Natural Killer Cell Neoplasms. Am. J. Pathol. 2013, 182, 49–55. [Google Scholar] [CrossRef]
  45. Schinke, C.; Rasche, L.; Raab, M.S.; Weinhold, N. Impact of Clonal Heterogeneity in Multiple Myeloma. Hematol. Oncol. Clin. North Am. 2024, 38, 461–476. [Google Scholar] [CrossRef]
  46. Schmid, C.A.; Robinson, M.D.; Scheifinger, N.A.; Müller, S.; Cogliatti, S.; Tzankov, A.; Müller, A. DUSP4 Deficiency Caused by Promoter Hypermethylation Drives JNK Signaling and Tumor Cell Survival in Diffuse Large B Cell Lymphoma. J. Exp. Med. 2015, 212, 775–792. [Google Scholar] [CrossRef]
  47. Küçük, C.; Hu, X.; Jiang, B.; Klinkebiel, D.; Geng, H.; Gong, Q.; Bouska, A.; Iqbal, J.; Gaulard, P.; McKeithan, T.W.; et al. Global Promoter Methylation Analysis Reveals Novel Candidate Tumor Suppressor Genes in Natural Killer Cell Lymphoma. Clin. Cancer Res. 2015, 21, 1699–1711. [Google Scholar] [CrossRef] [PubMed]
  48. Leshchenko, V.V.; Kuo, P.Y.; Shaknovich, R.; Yang, D.T.; Gellen, T.; Petrich, A.; Yu, Y.; Remache, Y.; Weniger, M.A.; Rafiq, S.; et al. Genomewide DNA Methylation Analysis Reveals Novel Targets for Drug Development in Mantle Cell Lymphoma. Blood 2010, 116, 1025–1034. [Google Scholar] [PubMed]
  49. Ballestar, E.; Wolffe, A.P. Methyl-CpG-Binding Proteins. Targeting Specific Gene Repression. Eur. J. Biochem. 2001, 268, 1–6. [Google Scholar] [CrossRef]
  50. Leighton, G.; Williams, D.C. The Methyl-CpG-Binding Domain 2 and 3 Proteins and Formation of the Nucleosome Remodeling and Deacetylase Complex. J. Mol. Biol. 2020, 432, 1624–1639. [Google Scholar] [CrossRef]
  51. O’Neill, H.; Lee, H.; Gupta, I.; Rodger, E.J.; Chatterjee, A. Single-Cell DNA Methylation Analysis in Cancer. Cancers 2022, 14, 6171. [Google Scholar] [CrossRef] [PubMed]
  52. Lu, Y.; Chan, Y.-T.; Tan, H.-Y.; Li, S.; Wang, N.; Feng, Y. Epigenetic Regulation in Human Cancer: The Potential Role of Epi-Drug in Cancer Therapy. Mol. Cancer 2020, 19, 79. [Google Scholar] [CrossRef] [PubMed]
Figure 1. Recurrent SOX7 deletions in newly diagnosed and relapsed MM tumors. (A) SOX7 copy number in newly diagnosed MM cases based on the Affymetrix Mapping 250K Nsp SNP Array. The upper and lower panels show the results with the SNP_A-1859173 and SNP_A-1886065 probesets, respectively. The sample orders are the same for both panels. SOX7 copy numbers were normalized to those of RPL37A, and each sample was normalized to patient-matched non-tumor DNA. MM cases having SOX7 deletion based on both probesets are indicated with red stars in panel A (top and bottom). SOX7 gene copy numbers in newly diagnosed (B) or relapsed (C) MM patient tumor samples based on qPCR. EMC7 was used for normalization of SOX7 gene copy numbers in qPCR reactions. Red stars in panels B and C indicate MM cases with SOX7 deletion based on both EMC7 and RPL37A (Figure S1) normalisations. Reactive tonsil PC samples were used as controls for normal copy number SOX7. RT: reactive tonsil.
Cimb 47 00244 g001
Figure 2. SOX7 promoter is hypermethylated in MM. (A) The screen view showing the human SOX7 gene locus with a blue color in the UCSC genome browser based on the current human reference genome. The direction of SOX7 transcription is indicated in its intron from right to left according to NCBI RefSeq. Horizontal green bars indicate the CpG islands around the SOX7 gene locus. Bar graphs (B) and the box-whisker (C) plot showing the SOX7 promoter methylation status of normal B cell and PC samples as well as MM cell lines. (D) The box-whisker plot displaying the SOX7 promoter methylation status in normal B cell samples (n = 6), PC samples (n = 3), and MM cases (n = 161). Outlier points are shown. (E) Bar graphs showing SOX7 promoter methylation status in control (normal B cell and PC) samples and PCL cases. Dashed vertical lines in panels B and E separate cancer and normal samples. All the data are based on the Illumina HumanMethylation27 BeadChip probeset value for SOX7 in the GSE21304 series. Plasma cells: CD138+ bone marrow cells; B cells: CD19+ peripheral blood cells. MM: multiple myeloma. PCL: plasma cell leukemia.
Cimb 47 00244 g002
Figure 3. Deletion and promoter methylation as cooperative aberrations affecting different diagnostic or relapsed MM cases. Bar graphs showing the normalized gene copy number (A) or promoter hypermethylation (B) for SOX7 in tumor samples obtained during diagnosis or relapse of patient-matched MM cases. The dashed horizontal line in panel A indicates the threshold for SOX7 deletions. (C) The box-whisker plot of promoter methylation levels in diagnostic and relapsed MM cases. Scatter plots showing the correlation between SOX7 copy numbers and promoter methylation levels in diagnostic (D) or relapsed (E) MM tumor samples. Pearson correlation r values indicate copy number correlations for patient-matched diagnostic and relapsed MM samples in panel A and correlations between SOX7 copy numbers and promoter methylation values in panels (D,E).
Cimb 47 00244 g003
Figure 4. The relationship between deletion, methylation, and mRNA expression of SOX7 in diagnostic and relapsed MM cases. Bar graphs showing SOX7 mRNA expression levels in diagnostic (A) or relapsed (B) MM cases with or without SOX7 deletion. Black bars represent cases with no deletion (No del), whereas gray bars represent MM cases with SOX7 deletion based on CytoScan 750K arrays. Scatter plots comparing promoter methylation and mRNA expression levels of SOX7 in patient-matched diagnostic (C) and relapsed (D) MM tumor samples. The trendline is shown in panel C. The array types relevant to each of these analyses are indicated within parentheses.
Cimb 47 00244 g004
Figure 5. The relationship between deletion or promoter methylation with expression of PINX1 and MSRA in MM cases. (A) Bar graphs showing PINX1 mRNA expression levels of diagnostic (left) and relapsed (right) MM cases with/without PINX1 deletion. (B) Scatter plots comparing promoter methylation and mRNA expression levels in diagnostic (left) and relapsed (right) MM cases. (C) Bar graphs showing MSRA mRNA expression levels of diagnostic (left) and relapsed (right) MM cases with/without MSRA deletion. (D) Scatter plots comparing promoter methylation and mRNA expression levels of MSRA in diagnostic (left) and relapsed (right) MM cases.
Cimb 47 00244 g005
Figure 6. SOX7 mutations are very rare in MM cases. (A) The oncoprint graph showing the only MM case with a SOX7 mutation based on cBioPortal. (B) The lollipop plot showing the type and location of the identified SOX7 mutation in the context of the primary protein structure. cBioPortal website was assessed on 3 April 2024 and 26 April 2024. The graphics are based on the mutation data in the Broad Cancer Cell 2014 manuscript. (C) A SOX7 mutation identified in 1 of 96 plasma cell myeloma (multiple myeloma) samples based on the COSMIC database.
Cimb 47 00244 g006
Figure 7. Lack of SOX7 mRNA expression in MM cell lines. (A) Heatmap showing SOX7 transcript levels in MM cell lines. (B) Heatmap showing CD38 and SDC1 (CD138) transcript levels in MM cell lines. (C) The box-whisker graphic showing SOX7 transcript levels in comparison to CD38 and CD138. FPKM: fragments per kilobase of transcript per million mapped reads.
Cimb 47 00244 g007
Figure 8. SOX7 is downregulated in MM and high-risk SMM cases. Box-whisker plots comparing SOX7 mRNA expression in normal PC samples and MM case tumor samples normalized to that of RPL37A (A) or EMC7 (B) as the housekeeping gene. Box-whisker plots comparing SOX7 mRNA expression in normal PC samples and high-risk SMM case tumor samples normalized to that of RPL37A (C) or EMC7 (D) as the housekeeping gene. Means and outlier samples are indicated with crossmarks and dots, respectively, in box-whisker plots. NPC: normal plasma cell. MM: multiple myeloma. SMM: smoldering multiple myeloma. (E) The bar plot showing relative SOX7 mRNA expression in OSA plasma cells as well as diagnostic and relapsed MM cases based on qRT-PCR analysis. RPL37A was used as the housekeeping gene for the normalization of SOX7 mRNA expression. Means ± std of replicates are shown. OSA: obstructive sleep apnea. PC: plasma cell.
Cimb 47 00244 g008
Disclaimer/Publisher’s Note: The statements, opinions and data contained in all publications are solely those of the individual author(s) and contributor(s) and not of MDPI and/or the editor(s). MDPI and/or the editor(s) disclaim responsibility for any injury to people or property resulting from any ideas, methods, instructions or products referred to in the content.

