Article

Biodiversity and Evaluation of Genetic Resources of Some Coffee Trees Grown in Al-Baha, Saudi Arabia

by
Fatima Omari Alzahrani
1,*,
Mohammed Obeid Alshaharni
2,
Gamal Awad El-Shaboury
2 and
Abdelfattah Badr
3
1
Department of Biology, Faculty of Sciences, Al-Baha University, Al-Baha 65729, Saudi Arabia
2
Biology Department, College of Science, King Khalid University, Abha 61413, Saudi Arabia
3
Botany and Microbiology Department, Faculty of Science, Helwan University, Cairo 11795, Egypt
*
Author to whom correspondence should be addressed.
Curr. Issues Mol. Biol. 2025, 47(3), 136; https://doi.org/10.3390/cimb47030136
Submission received: 22 January 2025 / Revised: 9 February 2025 / Accepted: 18 February 2025 / Published: 20 February 2025
(This article belongs to the Special Issue Genetics and Natural Bioactive Components in Beverage Plants)

Abstract

The biodiversity of 12 coffee (Coffea arabica L.) cultivars collected from the Al-Baha region in the southwest of Saudi Arabia was evaluated using 25 morphological variations and genetic diversity as demonstrated by molecular polymorphism generated by eight Inter Simple Sequence Repeats (ISSRs) and nine Start Codon Targeted (SCoT) primers. Substantial variations were scored in the morphological traits reflected in the clustering of the examined cultivars in PCA of the coffee cultivars. The examined cultivars were grouped in two groups, one included the cultivars coded Y5, Y6, R113, and Y7 and the other group comprised two clusters; one comprised cultivars coded R8 and R4 and the other comprised cultivars R112, R114, and Y2. In the meantime, the cultivars coded R9 and R111 were differentiated together from other cultivars, while the Y3 cultivar was confirmed by the analysis of ISSR data and SCoT data, which also support the grouping of R9 and R111 cultivars. Principle Component Analysis (PCA) of morphological, ISSR, and SCoT data as a combined set differentiated the examined species into four groups in a scatter plot in agreement with their separation in the cluster trees. The diversity profile among the examined C. arabica cultivars proved that R111 and R4 cultivars are highly diverse, while R8 and Y5 cultivars exhibit low diversity. Alpha diversity indices indicated that R9 and R111 cultivars are the most dominant and stable C. arabica cultivars among the examined samples in the study region.

1. Introduction

Coffea arabica L. belongs to the Coffea genus within the Rubiaceae family, comprising around 124 species. Only two species, C. arabica (Arabian coffee L.) and C. canephora Pierre (Robusta), possess commercial importance [1]. Arabian coffee originated in Ethiopia but is currently expanding globally. In Saudi Arabia, Arabian coffee is predominantly cultivated in the Al-Baha region, Asir (Hada Mountain region), and Jazan provinces (Al-Dayer Bani Malek), where trees exceeding 100 years in age are located [2]. High-quality coffee from these regions, known as Khoulani coffee, is well-known worldwide. Saudi Arabia produces some of the best coffees in the world as coffee is grown under mostly organic conditions without the use of pesticides, herbicides, and artificial fertilizers [3]. Nonetheless, the insufficiency of water resources for irrigation and the degradation of terraces may result in damage to coffee’s genetic resources, owing to climate change. Furthermore, producers have replaced coffee with other monoculture crops deemed of greater importance [4]. Khoulani and Tufahi cultivars exhibited notable responses to the impacts of drought on gas exchange, water relations, and osmotic adjustment, as studied by Tounekti et al. (2018) in four Arabica coffee cultivars grown in southwestern Saudi Arabia [3]. Genetic variation is an essential component of biodiversity, necessary for species reproduction, and it is vital for the adaptation of species to changing environments [5]. Consequently, genetic variation is essential for the development of novel types via plant breeding. Advantageous genetic traits can be included into cultivars to enhance agricultural productivity and attributes related to crop quality, disease resistance, etc. Tounekti et al. (2017) assessed the genetic diversity of Arabian coffee cultivars from southwest Saudi Arabia using physical traits and proposed four cultivars for breeding initiatives [6]. Such germplasms may demonstrate significant characteristics, including resilience to abiotic and biotic stressors. Nonetheless, the genetic basis, origins, and magnitude of this divergence remain unidentified. The germplasm gathered from the southwestern regions of Saudi Arabia, characterized by adverse conditions, may serve as a foundational material for the development of cultivars resilient to environmental challenges.
Molecular markers are currently recommended for quantifying and verifying genetic diversity at both species and cultivar levels [5,7]. Molecular characterization of wild cultivars and cultivated variants of C. arabica in Ethiopia revealed adequate polymorphism among the germplasm [8]. The integration of molecular marker analysis and phytochemical profiling can yield a thorough comprehension of the genetic diversity and chemical composition of C. arabica cultivars in Saudi Arabia [9]. This information can inform conservation initiatives, pinpoint unique characteristics for breeding programs, and perhaps facilitate the creation of distinctive Saudi Arabian coffee products with appealing flavor and aroma profiles. However, the biodiversity research on C. arabica in southwest Saudi Arabia has been restricted to either morphological differences [10] or polymorphisms of molecular markers [11].
Al-Ghamedi et al. (2023) demonstrated that it is vital to begin with an evaluation of genetic diversity to develop significant breeding programs for the country. Identifying and describing genotypes can improve breeding effectiveness over direct selection of desired traits and genes. The use of molecular markers can enhance crop development efforts significantly. These markers have a direct connection to the genotype’s qualities, allowing for the rapid development of new genotypes compared to traditional selection practices, particularly when measuring traits is difficult [11].
This study is crucial for establishing a foundational baseline to improve the newly established coffee city in Al-Baha, an investment initiative focused on advancing coffee farming in the area. The city comprises an area of 1,600,000 square meters. The city intends to cultivate 300,000 coffee trees and provide over 1000 employment possibilities, thus enhancing the local agricultural economy (personal communication). The development of the coffee city project is integral to Saudi Arabia’s Vision 2030, which focuses on improving local coffee production. The initiative depends on the cultivation of local coffee varieties; hence, identifying these varieties is deemed crucial for the support of this city. The choice of Al-Baha for the coffee city initiative is influenced by substantial factors such as the area’s climate compatibility and its rich history of coffee cultivation.
So, our study aims to evaluate the coffee tree biodiversity in the Al-Baha region using morphological differences and molecular markers, specifically utilizing the profiling of Inter Simple Sequence Repeats (ISSRs) and Start Codon Targeted (SCoT) markers.

2. Materials and Methods

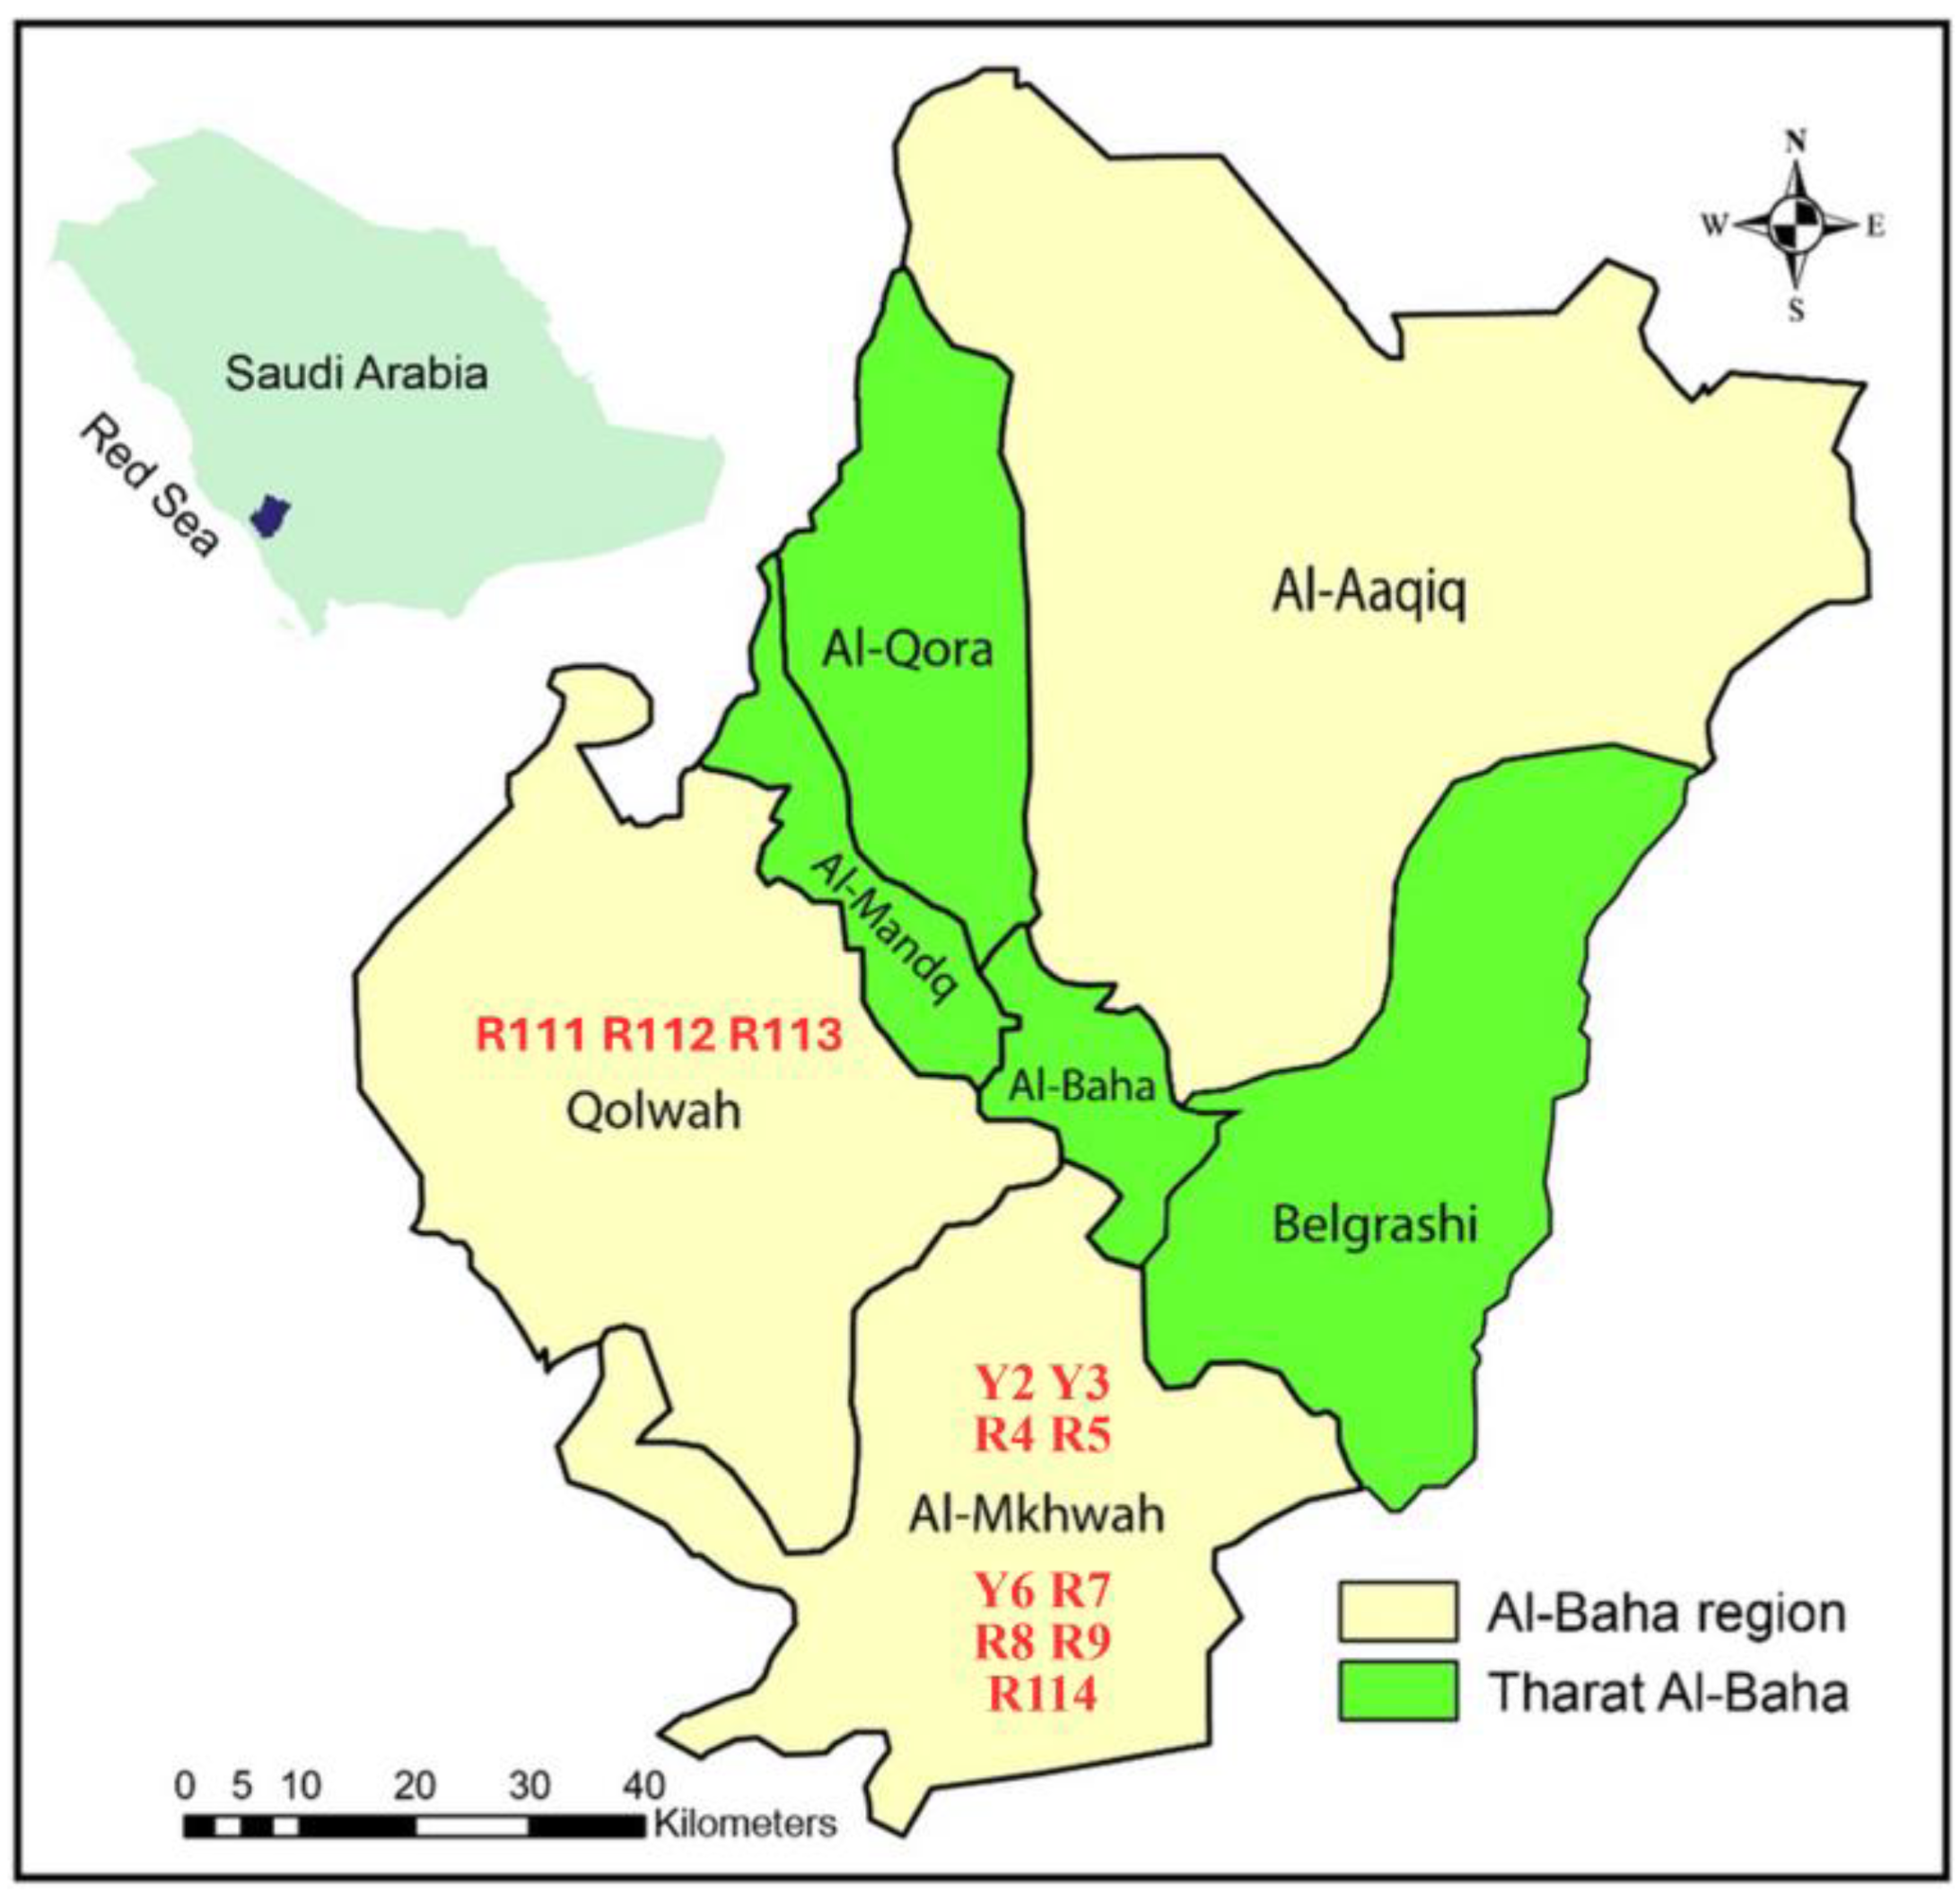
2.1. Plant Material and Morphological Measurements

Samples of mature flowering Arabian coffee plants were collected from 12 cultivars in two areas (five samples for each accession) from their natural habitats in the Al-Baha region, southwest of Saudi Arabia in the summer of two successive years (2022–2023). The names and sites of collection of the collected cultivars are given in Table 1 and a map of the study region is shown in Figure 1. A detailed description of 25 morphological traits for each accession including quantitative, qualitative, and presence/absence of characters was performed. The average value of every quantitative character ± standard deviation was calculated. The state of the qualitative and the present character is recorded in Table 2 based on the species description of Migahid in 1996 [12], Collenette in 1999 [13], and Chaudhary in 2001 [14]. Voucher specimens of the 12 C. arabica cultivars have been deposited in the Herbarium of the Biology Department, Faculty of Science, Al-Baha University, Saudi Arabia.

2.2. DNA Extraction and ISSR Fingerprinting

DNA was extracted and purified from the young leaves of mature plants of the collected samples of the Arabian coffee plants representing all the collected cultivars using Qiagen DNeasy™ Plant Minikit following the manufacturer’s protocol (Qiagen Inc, Valencia, CA, USA). Eight ISSR and nine SCoT primers were used for DNA fingerprinting. The selection of ISSR and SCoT primers was guided by their established effectiveness in earlier genetic diversity investigations. These primers are known for their capacity to generate polymorphic and reproducible bands, making them particularly suitable for analyzing the coffee genome, as evidenced by previous studies [15,16,17].
The name, sequence, number of polymorphic bands, and percentage of polymorphism of the 17 primers are given in the online Supplementary Table S1. In the amplification reactions of genomic DNA, a total of 25 µL reaction mix was prepared (12.5 µL Thermo Scientific Maxima Hot Start PCR Master Mix (2×, 0.5 µL primer, 0.5 µL template DNA and 11.5 µL nuclease-free water-R0581). Amplification conditions were improved using a gradient Biometra Uno thermal cycler, Germany. In total, 20 µL of the PCR products of each primer and 2 µL of loading buffer were mixed and loaded into the wells of 1.7% agarose gel. The DNA fingerprinting of the studied primers was visualized and photographed using a Gel Works 1D advanced gel documentation system (UVP, Cambridge, UK). Figure 2 shows the ISSR and SCoT fingerprinting profile produced by three of each ISSR and SCoT primers for the examined Arabian coffee cultivars. For data analysis, each ISSR and SCoT band was considered a single locus and scored as 1 for presence and 0 for absence (ISSR and SCoT fingerprinting scoring is given in the online Supplementary Table S2).

2.3. Data Analysis

The morphological traits were assigned codes from 0 to 3 for data analysis. The descriptor states and codes for data analysis of the examined morphological traits can be found in the online Supplementary Table S3. Leaf length and width were recorded using a leaf area meter (CI-202 Portable Laser Leaf Area Meter). To determine the coffee fruits’ fresh weight, the fruits were first cleaned and dried using blotting papers. The weight of the fruits was then measured using an electronic balance. The fruits and seeds were left to dry in an oven set at 70 °C for three days. Once completely dry, the weight of the dry fruits and seeds was measured using an electronic balance.
The relationships between Arabian coffee cultivars were evaluated separately and together based on variations in the morphological traits and molecular fingerprinting polymorphism. Two software programs were used for data analysis; the NTSYS-pc software version 2.2. [18] was utilized to construct trees showing the relationships and to calculate the similarity level among the examined Arabian coffee cultivars using a simple matching coefficient [19]. Clustering of the examined cultivars was also carried out based on squared Euclidean distance to create a distance tree using PAST-pc Version 4.11 [20]. Principal Component Analysis (PCA) was used to build a scatter diagram of the examined cultivars and diversity profile curve, and alpha diversity plots were generated using the PAST-pc using Shannon diversity index [21]. It is important to note that PCA is sensitive to the relative scaling of the original variables in the scatter plot visualization [20]. Alpha diversity means the diversity of cultivars within a specific local area, indicating species richness in a particular community. For instance, alpha diversity measures the observed species diversity within a defined plot or ecological unit, such as a field, a pond, or a rainforest [22]. All morphological measurements were conducted three times independently, and the results are shown as the average value ± standard deviation (SD). A one-way analysis of variance (ANOVA) was applied to the data using Statistica 7.1.

2.4. iMEC Analysis

According to Amiryousefi et al. [23], the Online Marker Efficiency Calculator (iMEC software) is an easy-to-use program that computes fundamental polymorphism indices for individual markers, including the heterozygosity index (H), polymorphism information content (PIC), discriminating power (D), effective multiplex ratio (E), marker index (MI), arithmetic mean heterozygosity (Havp), and resolving power (R) [23]. The iMEC application is obtainable at https://irscope.shinyapps.io/iMEC/, accessed on 17 February 2025. The multiplex ratio (MR) = total bands/total primers used = 132/17 = 7.76. The iMEC analysis involved the assessment of 17 molecular markers, comprising 8 ISSR and 9 SCoT primers in 12 Arabian coffee cultivars using the online iMEC software application. The results of the calculations are summarized in Table 3. The effectiveness of the primers in distinguishing between different collected cultivars was assessed based on the D parameter (discriminating power of primer), as described by Ahmed et al. (2019) [24].

3. Results

3.1. Morphological Variation Among Coffea arabica Cultivars

Twenty-five morphological traits were utilized for the 12 collected C. arabica cultivars (Table 2). The morphological qualitative characteristics exhibited significant variance among the analyzed cultivars, particularly in all assessed attributes, with the exception of a cherry color, which was consistently light red across all tested cultivars, except for the Y7 accession, which displayed a tint of orange. All investigated cultivars had a lanceolate leaf shape, except for cultivars R111, R112, and R114, which displayed an ovate leaf shape, while R113 exhibited an elliptic shape. The quantitative characteristics indicate that cultivars from high-elevation sites with mild temperatures typically exhibit higher plant sizes compared to those from lower elevations in arid regions. For instance, the plant height of samples obtained from elevated regions is much greater; specifically, R4, Y3, Y5, R8, Y6, Y2, and Y7, collected from the Al-Mehkwa region at an elevation of 1684 m asl, exhibited a range from long to moderate plant height (Table 1 and Table 2). The short cultivars, such as R9 and R114, were gathered from the Al-Mehkwa region at lower elevations of 1104 m and 1107 m above sea level, respectively. Despite the R111 accession having considerable heights, it was obtained from an intermediate elevation of 1321 m above sea level in the Qalwa region. Each gathered accession possesses distinct characteristics derived from our observations and insights provided by experienced growers: R4, Y5, and R111 exhibit high-quality cherries; Y3 demonstrates early yield; R8 is noted for great cherry output; and R9 and R114 are recognized for both high yield and good quality cherries. R112 exhibits robust vegetative growth, R113 and Y2 demonstrate commendable growth and yield, Y6 trees exhibit tolerance to water scarcity, and Y7 produces large cherries.

3.2. Diversity of Cultivars Based on Morphological Variations

Based on the simple matching coefficient among the studied C. arabica cultivars, the UPGMA-NTSYS-pc cluster tree (Figure 3) separated the examined cultivars into two main groups. The first group compressed two clusters, the R4 accession clustered with R111. However, R8, R114, and Y2 were found in the other cluster. In contrast, R112 delaminated from this group at a very low similarity level. The other group comprised Y3 and Y5 at the highest similarity level with the Y6 and R9 accessions in one cluster. The R113 and Y7 cultivars were separated individually from this group.

3.3. ISSR and SCoT Fingerprinting Polymorphism in Coffea arabica Cultivars

The ISSR and SCoT fingerprinting profiles produced 132 bands (markers); 95 are polymorphic, 16 are monomorphic, and 21 are unique. The highest number of bands (12) was produced by primer SCoT-14 and the lowest number (3) was produced by primer HB-8. The percentage of polymorphism of all primers was calculated and is given in Online Supplementary Table S1. Data generated by the ISSR and SCoT fingerprinting of the 12 Coffea arabica cultivars are scored in Online Supplementary Table S2.
The polymorphism indices for individual primers were determined using iMEC software as basic metrics. More detailed information about the fundamental measurement of polymorphism indices for primers is provided in Table 3. The average heterozygosity index (H) was found to be 0.495. Additionally, the polymorphism information content (PIC) for each primer averaged 0.373. The primer SCoT-16 had an effective multiplex ratio (E) of 5.417, while primer HB-8 had a ratio of 2.5, with an average ratio of 4.754. The primer resolving power (R) ranged from 1.00 (HB-8) to 6.00 (SCoT-7) with an average of 4.13. The arithmetic means H (Havp) varied from 0.003 with primer SCoT-14 to 0.008 with primer HB-8 with an average of 0.004. Primer SCoT-13 showed the lowest value for marker index (MI) at 0.01, while primer HB-10 had a value of 0.026 with an average of 0.023. The primer discriminating power (D) ranged from 0.310 for primer HB-8 to 0.914 for SCoT-13, with an average of 0.777 (Table 3).

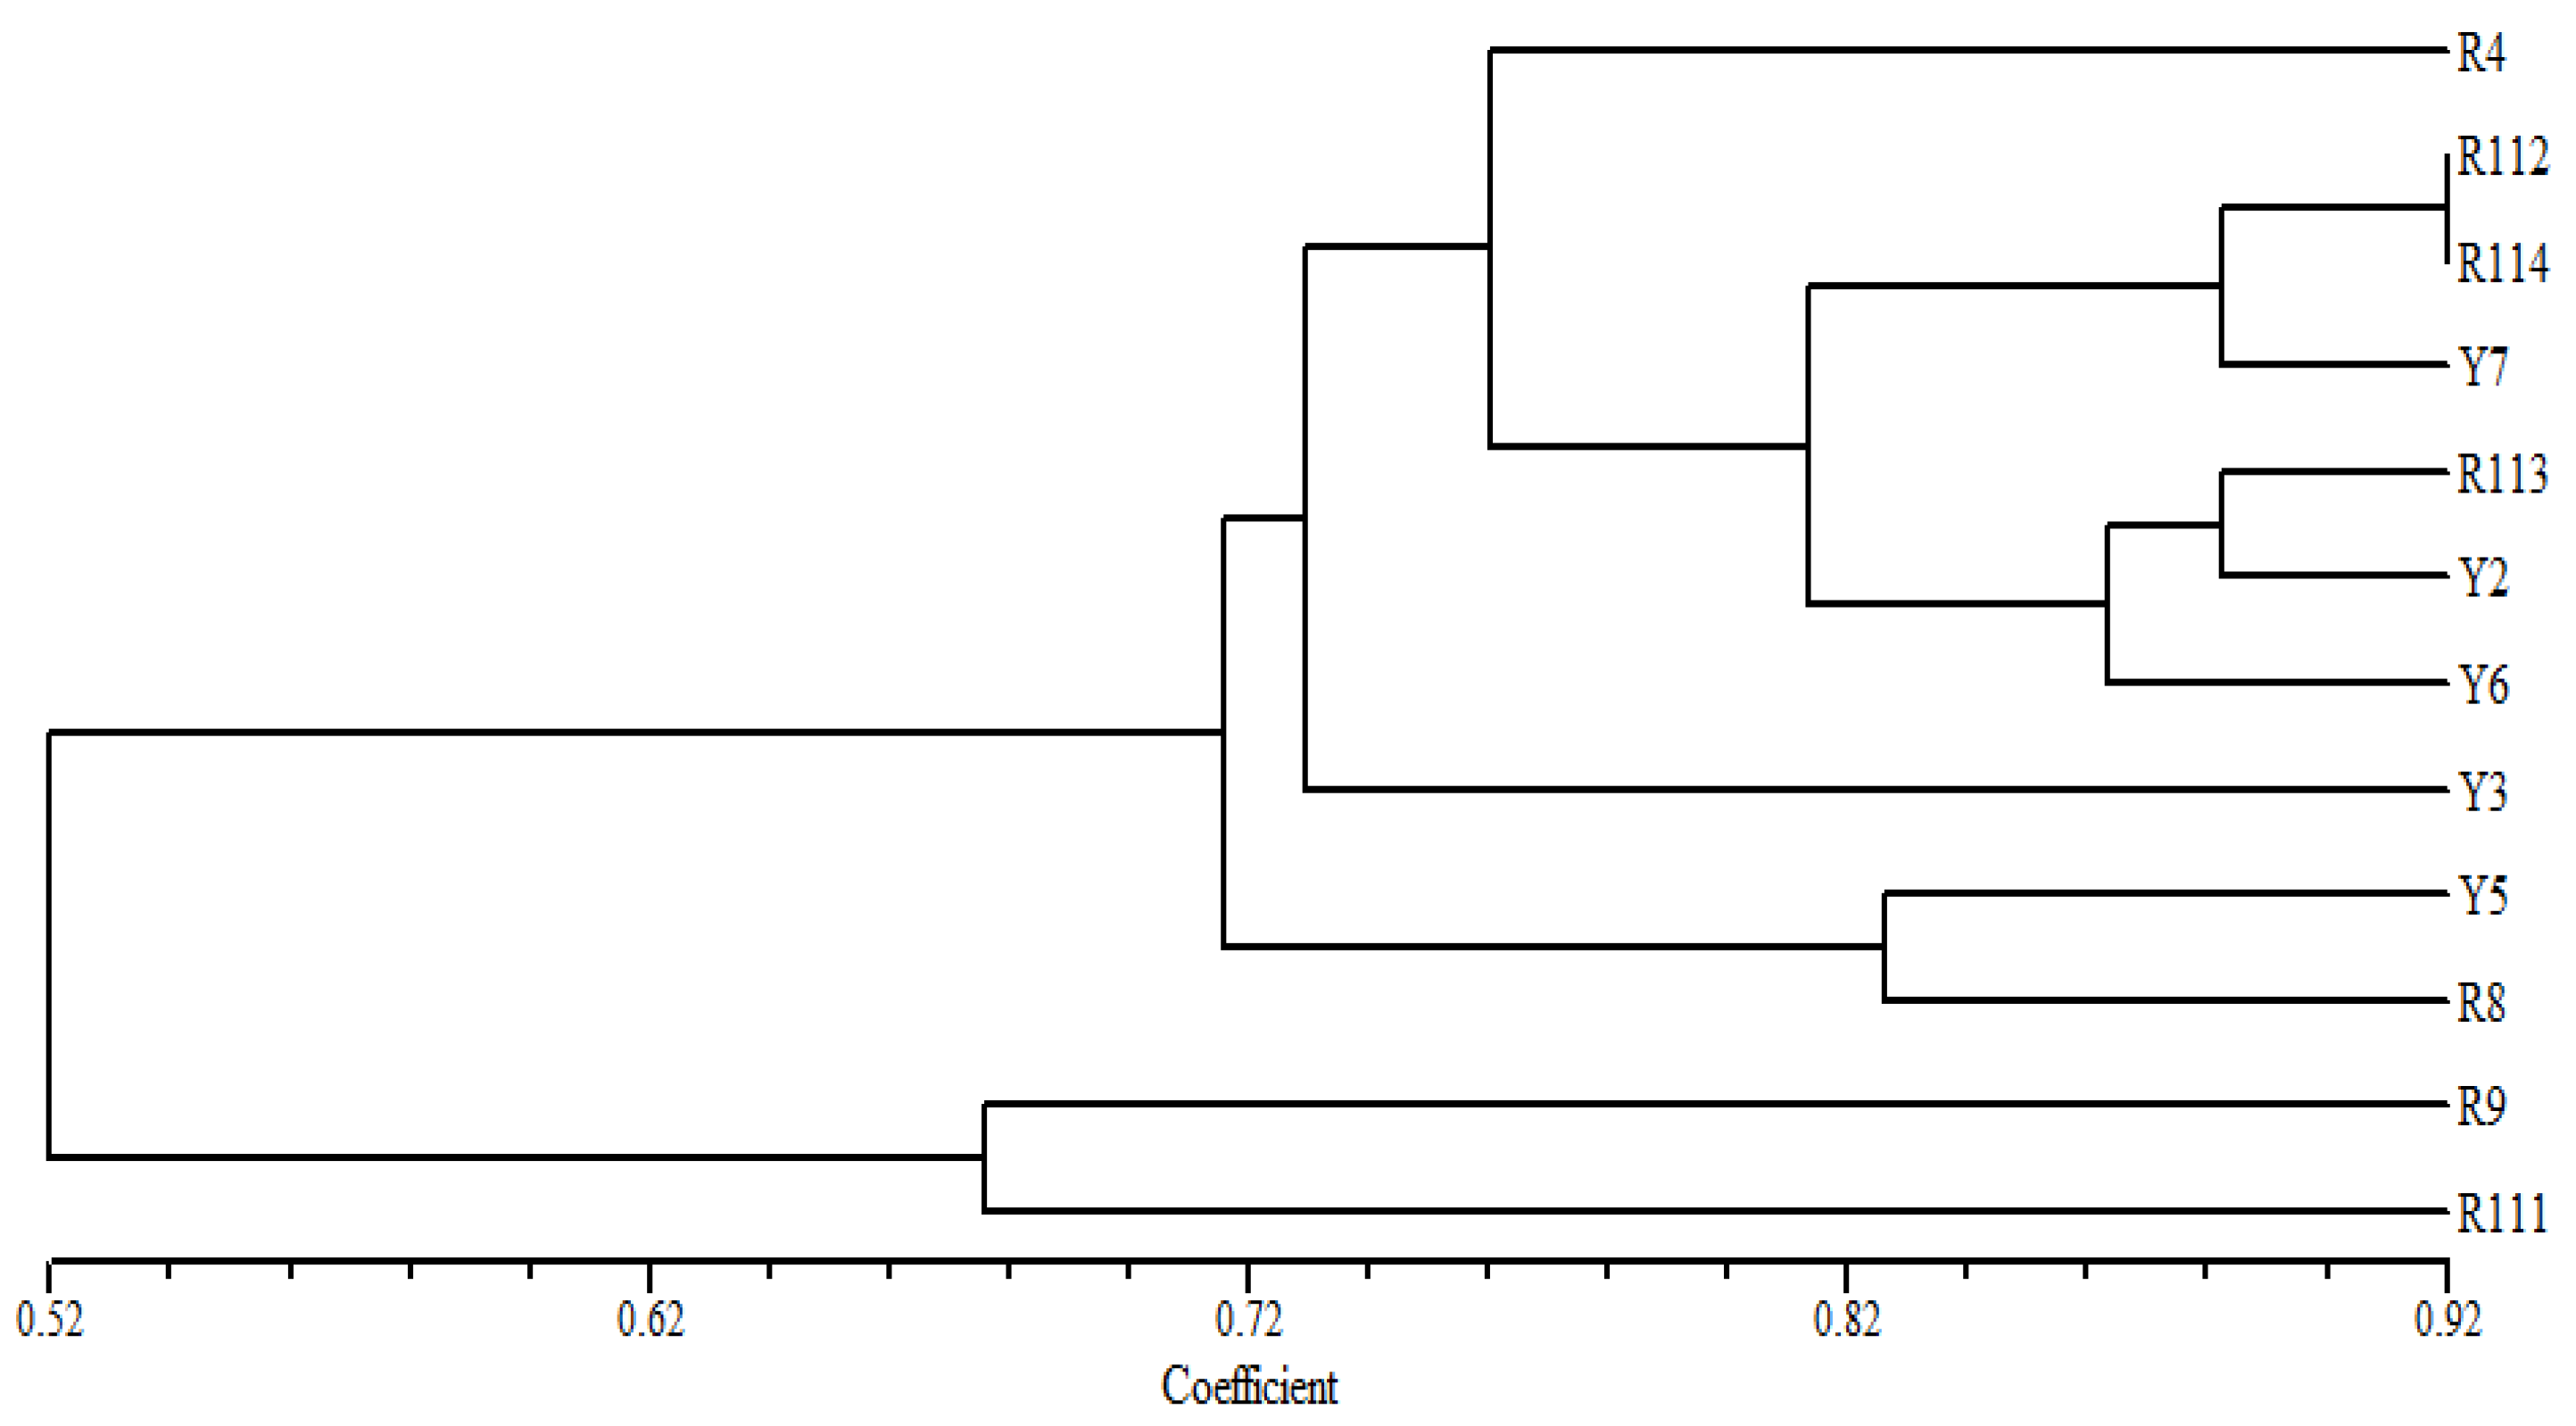
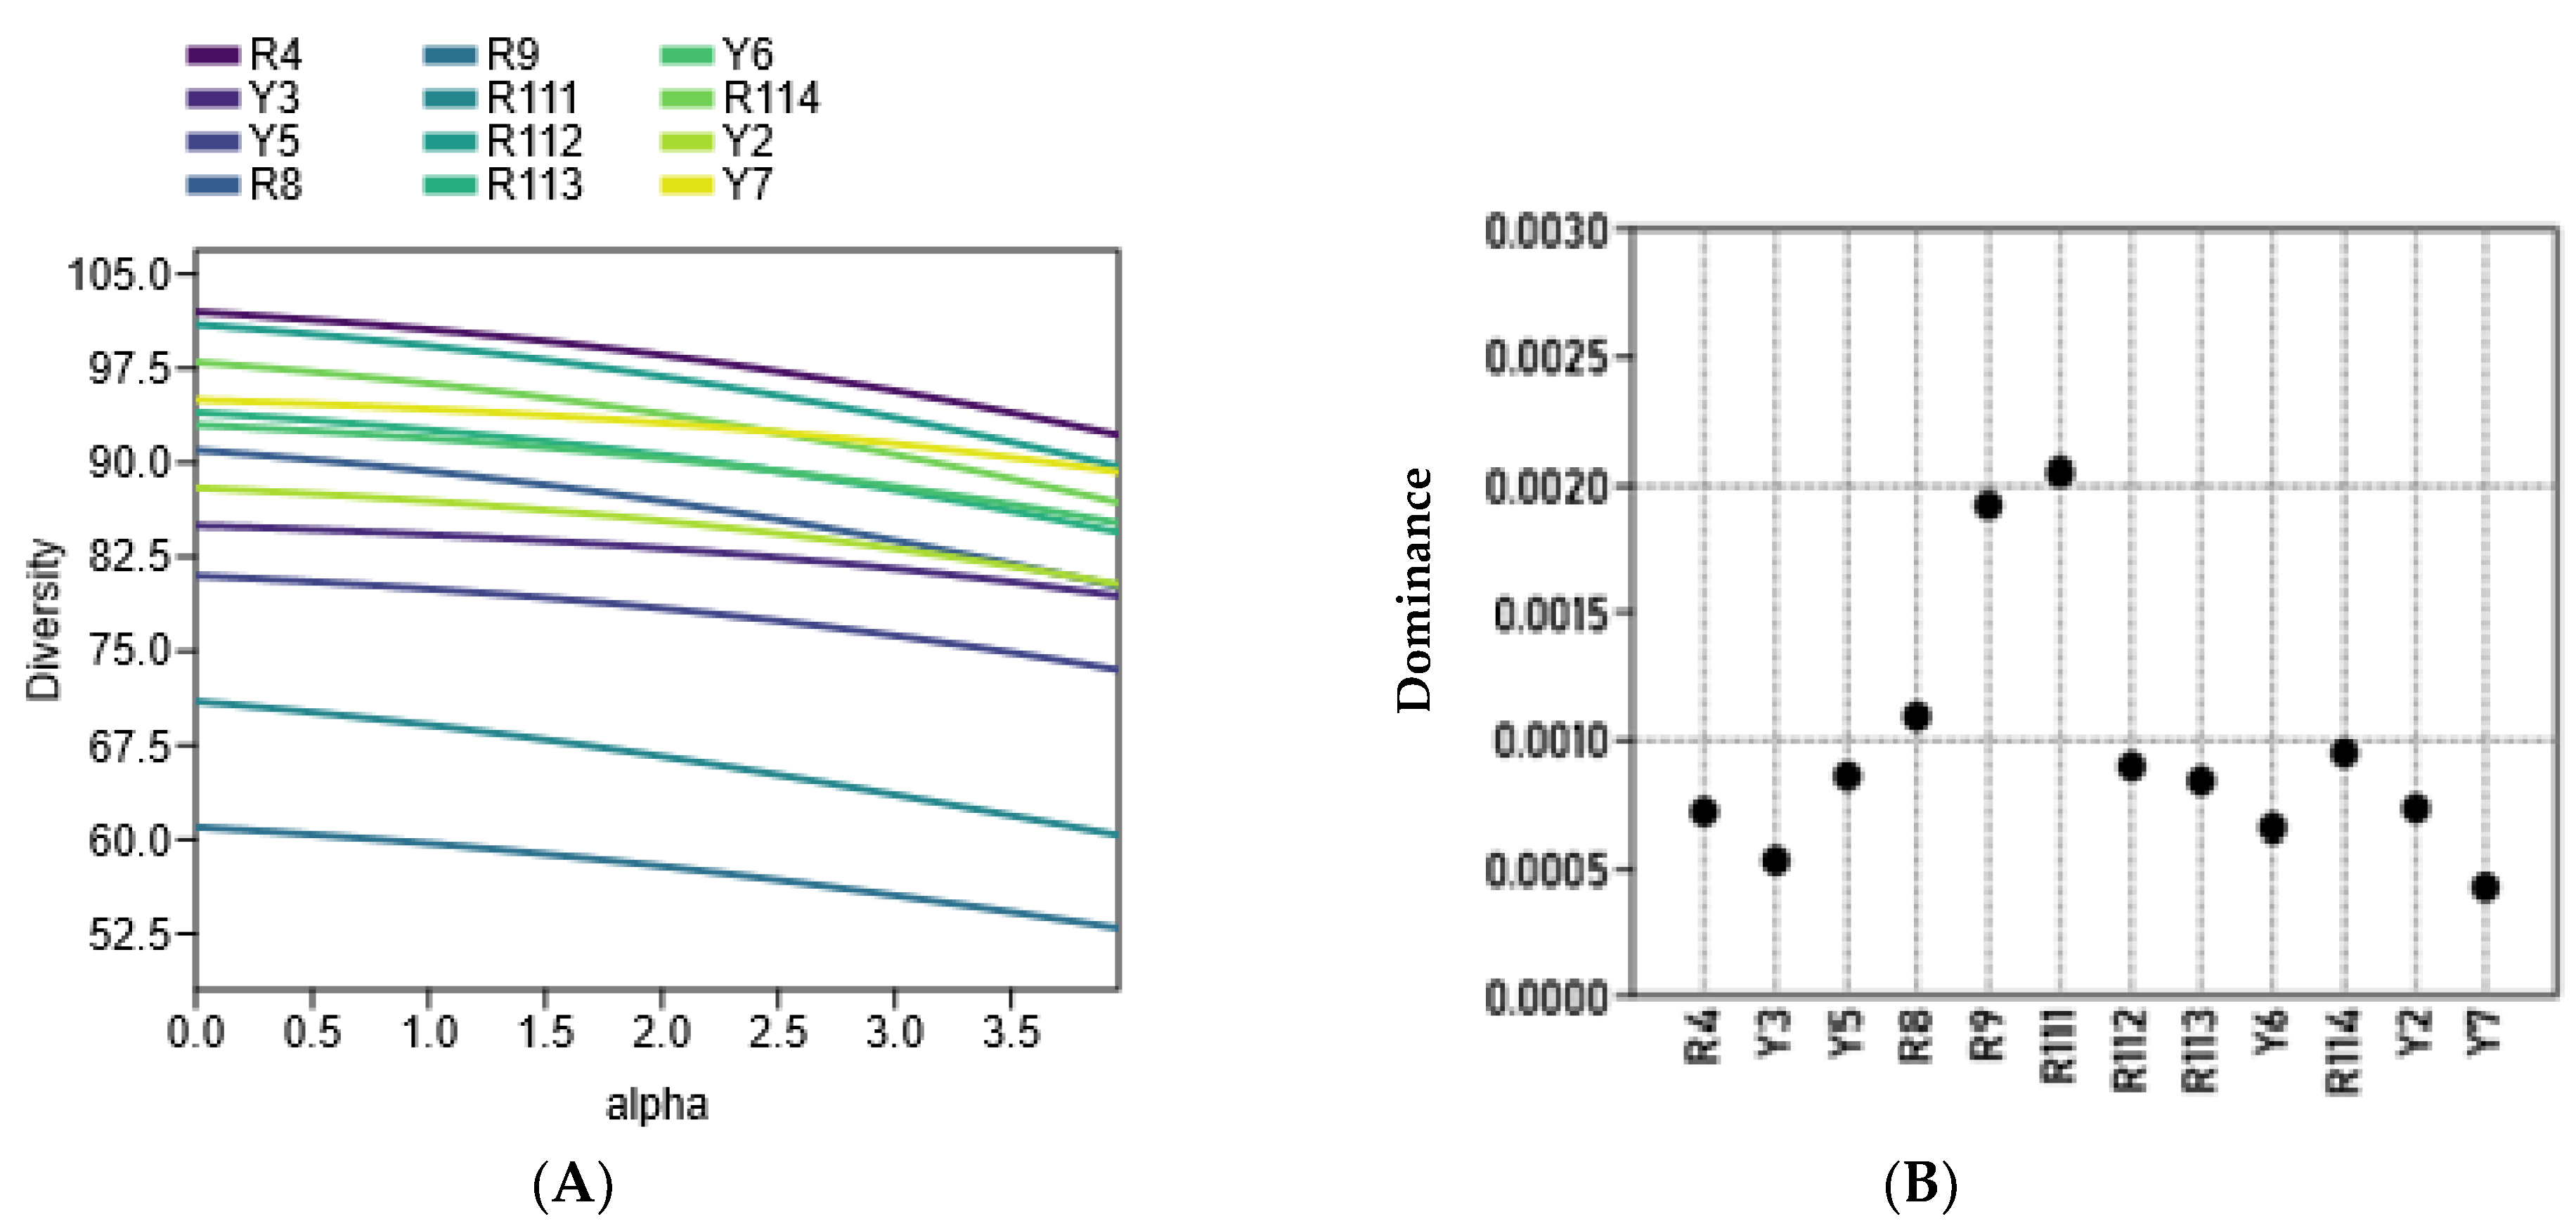
3.4. Diversity of Coffea arabica Cultivars Based on ISSR Markers

In the cluster tree, based on the ISSR fingerprinting analysis (Figure 4), the examined Coffea arabica cultivars are divided into two groups; a small group of the R9 and R111 cultivars is clearly differentiated, as two separate identities can be found at a relatively low similarity level from the other examined cultivars. In the second main group, the cultivars Y5 and Y8 are clustered at a relatively high similarity, while R4 and Y3 are delaminated individually in this group. The remaining cultivars R112 and R114 are found at the highest similarity level in one cluster with the Y7. Likewise, the R113 and Y2 cultivars are grouped in one cluster with the Y6 cultivar.

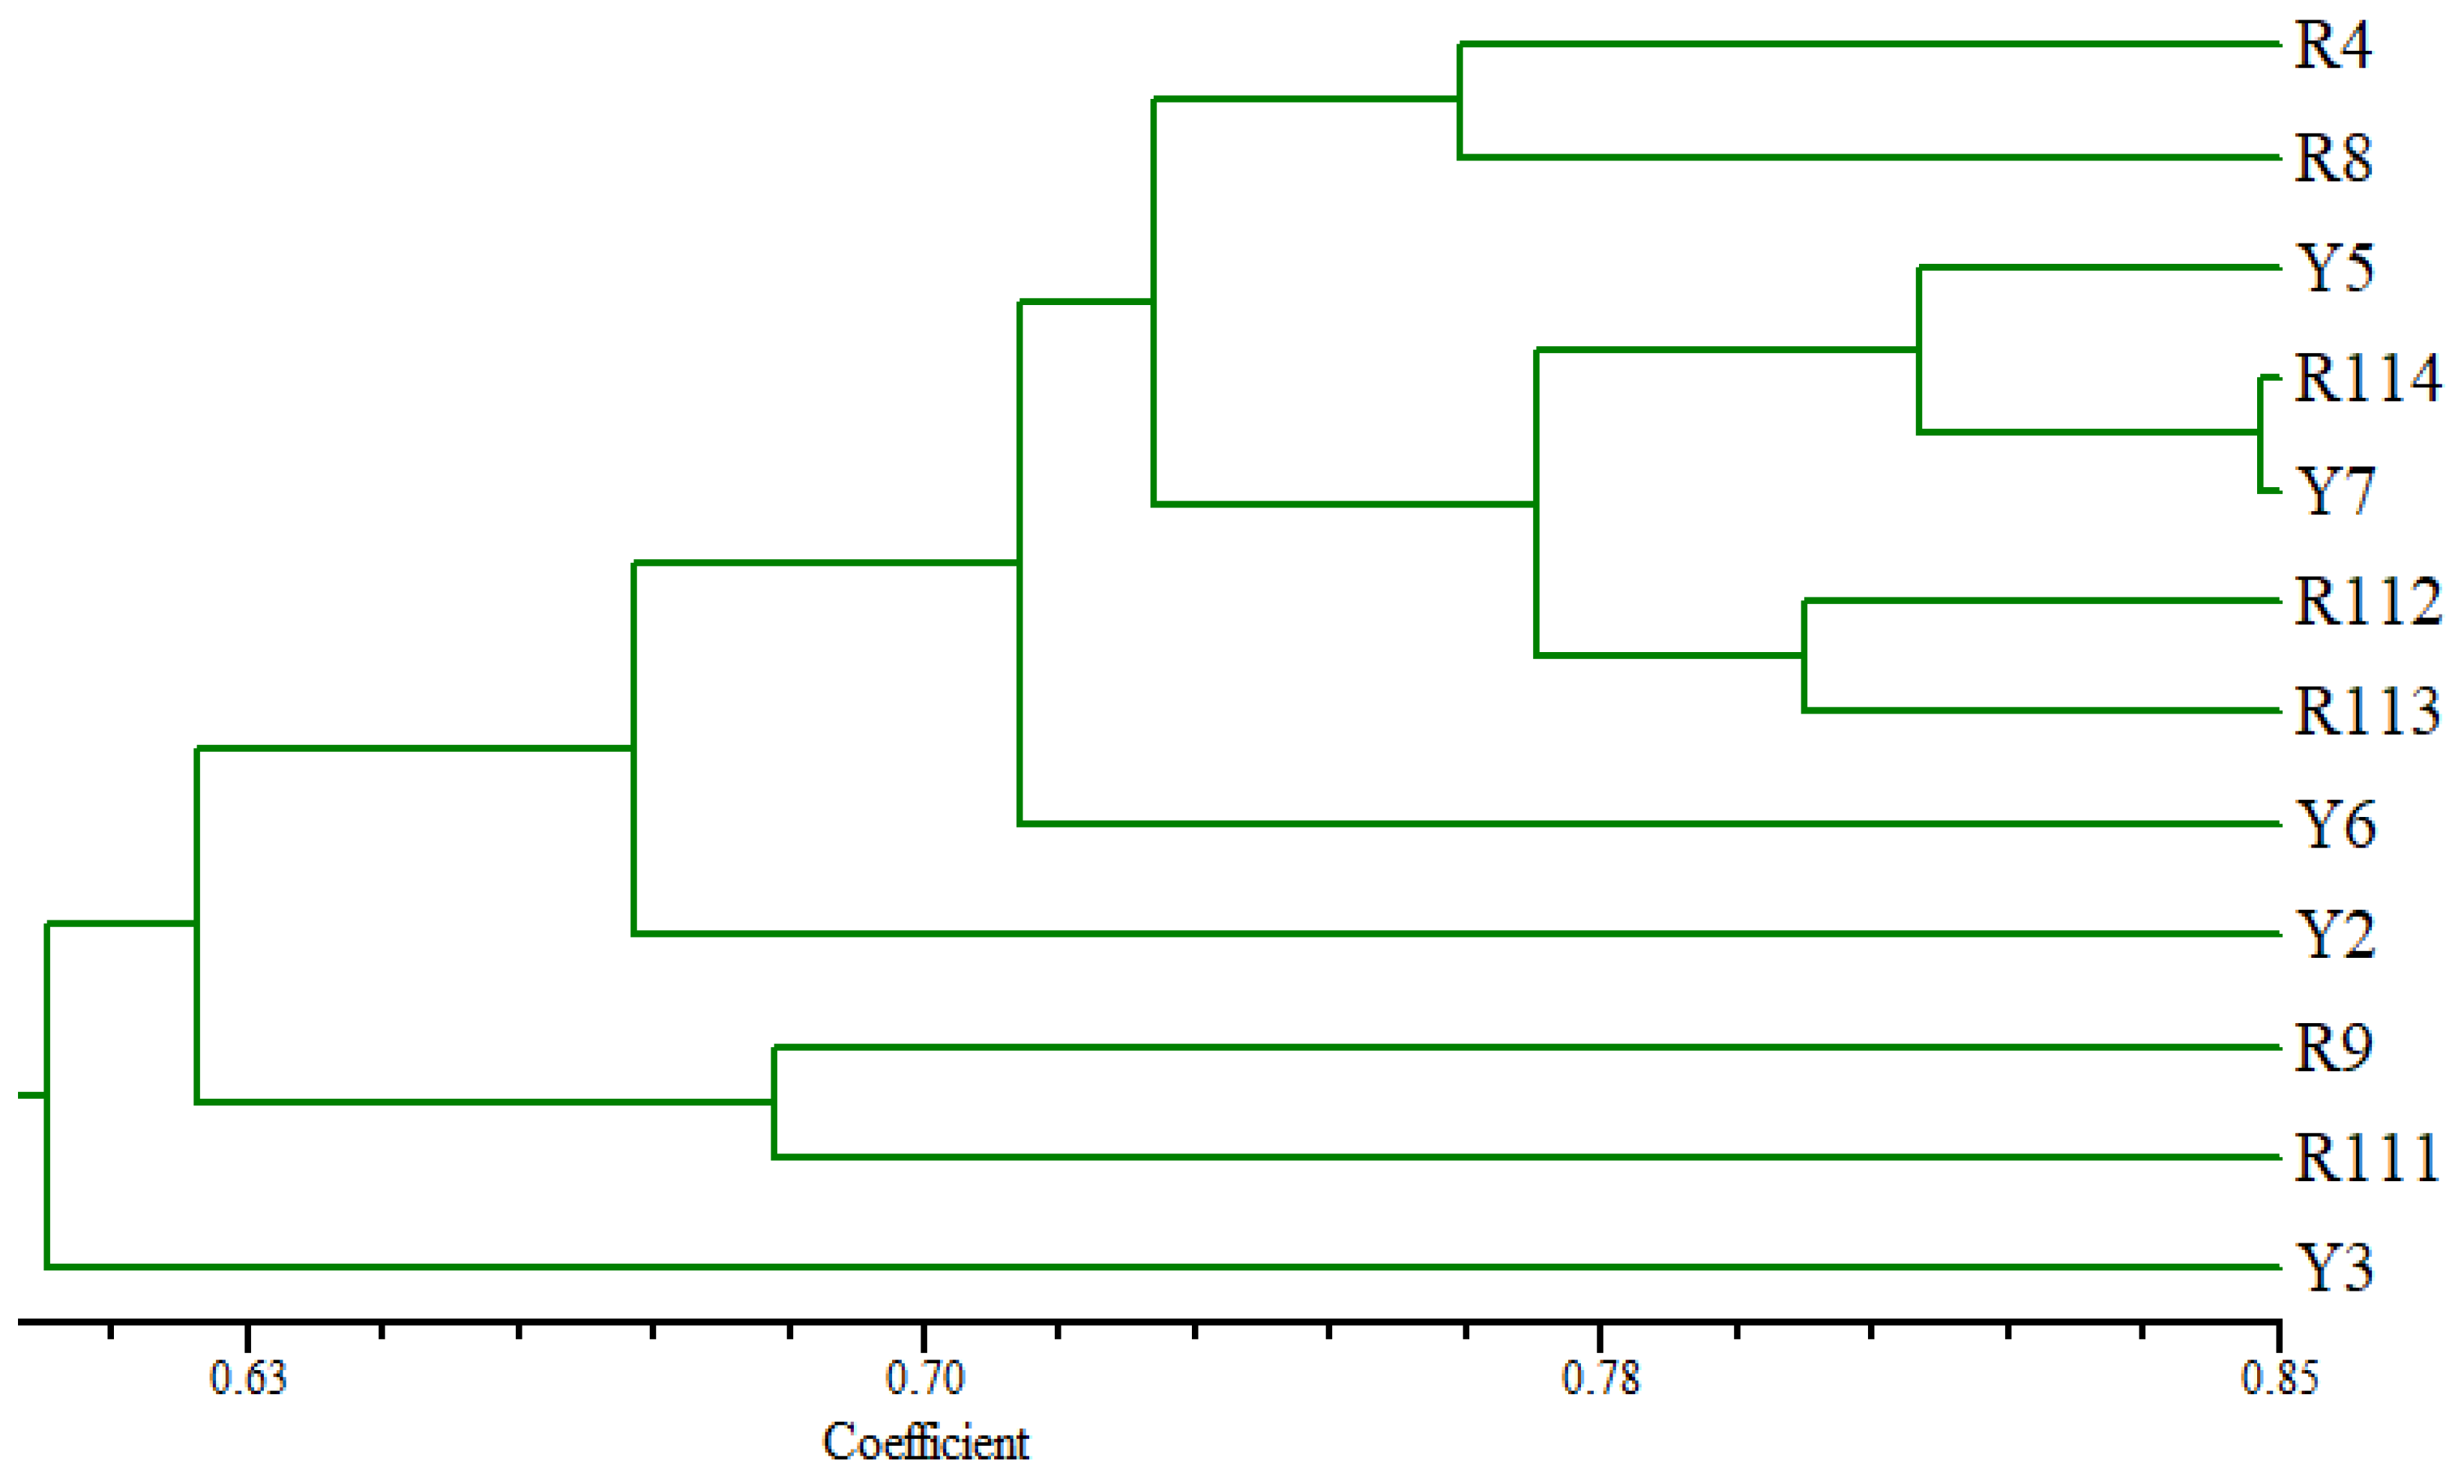
3.5. Diversity of the Arabian Coffee Cultivars Based on SCoT Markers

The tree based on the SCoT fingerprinting analysis (Figure 5) revealed that the Arabian coffee cultivars are grouped into three main groups, where the Y3 cultivar was differentiated as a separate identity at the lowest similarity level from the examined cultivars. R9 and R111 separated at a relatively low similarity level in one group. The second group consisted of two clusters, where R114 and Y7 cultivars clustered at a high similarity level with Y5 accession; the second cluster contained R112 and R113 at a relatively low similarity level. R4 and R8 cultivars were clustered in the other group. The Y6 and Y2 cultivars were distinguished individually from the other examined cultivars.

3.6. Relationships of Arabian Coffee Cultivars Based on Morphological Variations Combined with ISSR and SCoT Markers

The diversity of the examined cultivars based on morphological variations and molecular markers’ (ISSR and SCoT) polymorphism was assessed using clustering analysis, based on the Euclidean equation using the PAST software version 4.13 (Figure 6A) and a PCA scatter plot (Figure 6B). The cluster tree confirmed the separation of R9 and R111 cultivars as separate identities in one group. The cluster tree indicated more differentiation between the rest of the examined cultivars where Y5 and Y6 were clustered together, and the R4 and R8 cultivars and R112 and R114 cultivars were also clustered together. The examined cultivars are clearly differentiated into four groups by the PCA scatter plot (Figure 6B), which agrees mostly with their separation in the cluster tree. The four groups are 1. R4, R8, and R111; 2. R112, R113, R114, and Y2; 3. Y5, Y6, and Y7; and 4. R9, and Y3. Principal Component Analysis (PCA) results among the examined coffee arabica accessions are shown in in Online Supplementary Table S4. Figure 7A shows that the R4, R9, and Y6 cultivars were highly diverse C. arabica cultivars, while the R8 and Y5 cultivars exhibited low diversity. The alpha diversity indices (Figure 7B) indicated that the R9 and R111 cultivars were the most dominant and stable C. arabica cultivars among the examined samples. Additionally, the analysis revealed that the Y3 and Y7 cultivars were the least dominant C. arabica cultivars.

4. Discussion

Genetic diversity, both within and between plant cultivars, in natural settings may be influenced by changes in environmental conditions. Cultivars with elevated genetic diversity have greater resilience to habitat degradation and environmental alterations [25]. The assessment and measurement of genetic diversity and its distribution throughout time and space can be facilitated by studies on the species’ genetics [26]. Genetic variability can be assessed using phenotypic and molecular levels of analysis [27]; however, recently, molecular markers have become more widely accessible for use in molecular taxonomy, cultivar identification, and marker-assisted selection in plants due of developments in DNA fingerprinting techniques [28,29].
The analysis of the studied morphological traits revealed significant variation among the Arabica coffee cultivars for most of the morphological traits. Part of the variation was likely due to the influence of environmental factors such as rainfall, soil fertility, differences in agricultural practices, and the altitude of the collection site from sea level. Most qualitative traits such as plant shape, growth habit, leaf petiole color, and leaf and fruit shape vary between the examined cultivars. For example, the plant shape was pyramidal in four cultivars (R4, R8, R111, and R114) but ellipsoid in the Y5, R9, R112, Y6, and Y2 cultivars, and it was conical in the two cultivars R113 and Y7 only (Table 2). This may be correlated with the wide morphological variation in Arabica coffee species in different geographical regions under different environmental conditions [10]. Phenotypic variation in some morphological characters, like plant heights, could be related to variations in the elevation and landscape topography of the area in which the plants grow.
As for the quantitative characteristics in our study, the cultivars collected from sites at high elevations and moderate temperatures generally have larger plant sizes, canopy diameter, leaf width, and leaf petiole length than cultivars at lower elevations in more arid areas. The Arabica coffee productivity is also affected by the site of collection, where samples collected at high elevations have a higher weight for 100 fruit fresh and dry weight than those collected at lower elevations (Table 2). The cluster tree generated based on a simple matching coefficient among the studied Arabica coffee cultivars separated the R112 and Y7 cultivars from the other cultivars, indicating that these two cultivars have unique morphometric characteristics. Based on our observations and information shared by Arabica coffee growers in study areas, the Y7 cultivar has a large cherry and R112 has good vegetation growth. Previous studies using morphometric traits reported that it is often difficult to differentiate Arabica coffee cultivars based only on a limited number of traits [30,31]. In the current study, 25 traits related to tree canopy structure, fruit and seed morphology, mass and color, leaf properties, and internode length were used to identify the cultivars and provided more information on the morphological variation among the examined cultivars, but they indicated a low level of genetic differentiation of cultivars based on their geographic distribution in the study area.
The polymorphic information content (PIC) provides an estimate of a locus’ discriminatory power by considering the number and relative frequencies of alleles [24,25]. The PIC values range from 0 to 1 and indicate the probability of detecting a polymorphism between individuals. The current study used 17 different ISSR and SCoT marker combinations to determine the genetic diversity among 12 local Arabica coffee cultivars. The 17 primers produced 95 polymorphic bands with a high-level polymorphism percentage, averaging 85.83% in the 12 Arabica coffee cultivars (Table 3 and Table S1), where a high percentage of polymorphism indicates a high level of genetic diversity within the population or species. Our results agree with Yunita et al. (2020), who reported comparable findings in their study of genetic diversity in Arabica coffee in Indonesia, utilizing 16 combinations of molecular markers [22]. The average number of polymorphic loci was found to range from 19 to 23, while the information on polymorphic loci varied from 82.6% to 100% with an average of 95%. The MR was 7.76 bands per primer, EMR was 4.754, MI was 0.023, PIC was 0.373 and the average RP of all studied primer combinations was 4.13 (Table 3). Using genetic markers, Kumar et al. (2019) recorded comparable findings for a Jojoba cultivar (EMR = 5.36, PIC = 0.47, RP = 8.07 and I = 2.59) [31]. A higher value of MI, which assesses the performance of a molecular marker system, shows that the molecular markers are reliable in identifying genetic variations among several cultivars [32].
The cluster tree generated for the examined Arabica coffee cultivars based on the analysis of ISSR data (Figure 4) grouped the 12 cultivars into three groups. The R9 and R11 cultivars clustered in one group, representing the most divergent cultivars, collected from Al-Mehkwa and Qalwa, respectively. The second group comprised Y5 and R8 cultivars collected from the Al-Mehkwa region but from different GPS locations. The R112 and R114 cultivars clustered at a high similarity level, which were also collected from Qalwa and Al-Mehkwa, respectively. However, the results indicate that the cultivars of the Arabica coffee harvested from the same area were grouped into different clusters except for the Y5 and Y6 cultivars, which were found in the same cluster based on the combined analysis of morphological variations and the molecular polymorphism of the ISSR and SCoT markers (Table 1), indicating substantial genetic diversity within the cultivars of each region. This is not consistent with the results of Yunita et al. (2020), who reported that molecular data allowed for the grouping of the Arabica cultivars into three clusters correlated with their geographic distribution [22]. However, other studies have suggested a strong influence of geographic origin on diversity among the Arabica coffee cultivars [33,34].
The clustering of the studied Arabica coffee cultivars, based on the analysis of the SCoT fingerprinting profile, resulted in a grouping of the 12 cultivars that shows substantial differences compared to their groupings based on the analysis of ISSR data (Figure 5). However, the clustering of R9 and R111 cultivars together agrees with the grouping based on ISSR data analysis. These results indicate that these two cultivars share unique characteristics that distinguish them from the other studied cultivars. They are characterized by good vegetation growth and large cherry size. The R9 accession is also characterized by high productivity (Table 2). Figure 5 also illustrates that the Y3, Y2, and Y6 cultivars were distinctly separated from the other cultivars, confirming a high level of biodiversity among the examined cultivars. This is supported by the grouping of R4 and R8. The PCA scatter plot, generated using the Euclidean coefficient based on the analysis of morphological trait variations, ISSR, and SCoT fingerprinting polymorphism (Figure 6B), confirmed the grouping of the studied Arabica coffee cultivars and confirmed that the cultivars have high genetic diversity.
The diversity profile and alpha diversity analysis of the examined cultivars are depicted in Figure 7A,B. Alpha diversity pertains to the diversity on a local scale and describes the species diversity within a community, such as within a defined plot or ecological unit like a pond, field, or patch of forest [22]. In the current study, the diversity profile and alpha diversity among the examined Arabian coffee cultivars proved that the R4, R9, and Y6 cultivars are highly diverse, while the R8 and Y5 cultivars exhibit low diversity (Figure 7A). The alpha diversity indices (Figure 7B) indicate that the R9 and R111 cultivars are the most dominant and stable Arabian coffee cultivars among the examined cultivars. Characters exhibiting significant diversity are expected to facilitate substantial gene transfer in breeding programs [35]. In plants, alpha diversity is frequently associated with the number of species recorded during the assessment of a vegetation plot of specified dimensions [36]. Alpha diversity can be used to compare genetic diversity between different populations of the same species. This helps identify populations that are genetically depauperate and may require conservation interventions. For example, a population with higher alpha diversity might be prioritized as a source for genetic rescue efforts to bolster diversity in other populations [21]. A diversity profile illustrates a curve that represents the associated values of a substantial array of diversity indices. Thus, the profile portrays the views of diversity from many different vantage points simultaneously [37]. Ovalle-Rivera et al. (2015) suggested that Arabian coffee growers might face numerous difficulties as environmental conditions could become increasingly unfavorable for Arabica coffee production in the main producing nations because of climate change [38]. This is particularly applicable to the southwest Arabian Peninsula region and the Middle East [11]. The current study suggests that the local Arabian coffee cultivars have relatively diverse genetic traits and have evolved in mostly semi-arid environments and are frequently influenced by drought. This shows that these genetic resources may hold valuable genes that confer resistance to abiotic stress [3]. It is recommended to preserve and utilize these genetic resources in future coffee breeding programs to improve the coffee crop’s resilience to environmental challenges.
Previous research has confirmed substantial genetic variation across Arabica coffee cultivars in Saudi Arabian and Yemeni varietals [11,39,40,41]. It was documented that most Yemeni coffee varieties originated from ancient “heirloom” cultivars of C. arabica that were initially naturalized centuries ago [41,42]. The findings of the current study and several others addressing genetic diversity in Arabica coffee cultivars in Saudi Arabia and Yemen bolster the proposition that the Arabian Peninsula constitutes the most significant hub of coffee diversity beyond the species’ original center in Ethiopia and South Sudan [6,41,42].

5. Conclusions

The biodiversity of 12 Arabian coffee cultivars from Al-Baha region was evaluated using morphological variations in 25 morphological traits and the molecular polymorphism generated by eight ISSR and nine SCoT primers. The PCA of morphological, ISSR data, and SCoT data differentiated the examined species into four groups in a scatter plot. The differentiation of the cultivars in the PCA scatter diagram agrees with their separation in the cluster trees. The diversity profile among the examined Arabian coffee cultivars indicated that the R4, R9, and Y6 cultivars are highly diverse, while the R8 and Y5 cultivars have low diversity. Alpha diversity indices indicated that the R9 and R111 cultivars are the most dominant and stable Arabian coffee cultivars. Preserving this material and incorporating it into breeding programs is likely to increase the genetic diversity of coffee in the future, helping the crop to better withstand environmental challenges. Additionally, molecular and taxonomical studies may reveal new varieties or subvarieties of Arabian coffee arabica in the Al-Baha region. The molecular biodiversity of coffee is a critical resource for ensuring the resilience, quality, and sustainability of coffee production. It offers significant potential for scientific research, economic development, and cultural preservation, making it essential for the future of coffee and the broader food industry.

Supplementary Materials

The following supporting information can be downloaded at: https://www.mdpi.com/article/10.3390/cimb47030136/s1.

Author Contributions

The author F.O.A. participated in all stages of the research study, involving conceptualization, design, data collection, analysis, and manuscript writing. M.O.A. participated in the conceptualization and design of the study, G.A.E.-S. participated in conceptualization, design, data analysis, and manuscript writing, and A.B. participated in topic proposal and manuscript writing and revision. All authors have read and agreed to the published version of the manuscript.

Funding

This research was funded by the Ministry of Culture.

Institutional Review Board Statement

Not applicable.

Informed Consent Statement

Not applicable.

Data Availability Statement

All the data in this study are available upon request.

Acknowledgments

We thank Abd El-Fattah Kheder from the Seed and Seedling Center for his contributions in the samples’ collection.

Conflicts of Interest

The authors declare no conflicts of interest.

References

  1. Legesse, A. Assessment of coffee (Coffea arabica L.) genetic erosion and genetic resources management in Ethiopia. Int. J. Agric. Ext. 2020, 7, 223–229. [Google Scholar] [CrossRef]
  2. Pohlan, H.A.J.; Janssens, M.J. Growth and production of coffee. In Soils, Plant Growth and Crop Production; Eolss Publishers: Oxford, UK, 2010; Volume 3, p. 101. [Google Scholar]
  3. Tounekti, T.; Mahdhi, M.; Al-Turki, T.A.; Khemira, H. Water relations and photo-protection mechanisms during drought stress in four coffee (Coffea arabica) cultivars from southwestern Saudi Arabia. South Afr. J. Bot. 2018, 117, 17–25. [Google Scholar] [CrossRef]
  4. Lewin, B.; Giovannucci, D.; Varangis, P. Coffee Markets: New Paradigms in Global Supply and Demand; Agriculture and Rural Development Discussion Paper 3; Agriculture and Rural Development Department, World Bank: Washington, DC, USA, 2004; pp. 1–150. [Google Scholar]
  5. Al-Turki, T.A. An initiative in exploration and management of plant genetic diversity in Saudi Arabia. In Managing Plant Genetic Diversity; Engels, J.M.M., Rao, V.R., Brown, A.H.D., Jackson, M.T., Eds.; CABI Publishing: Wallingford, UK, 2002; pp. 339–349. [Google Scholar]
  6. Tounekti, T.; Mahdhi, M.; Al-Turki, T.A.; Khemira, H. Genetic diversity analysis of coffee (Coffea arabica L.) germplasm accessions growing in the southwestern Saudi Arabia using quantitative traits. Nat. Resour. 2017, 8, 321–336. [Google Scholar]
  7. Badr, A. Molecular approaches in plant systematics and evolution. Taeckholmia 2008, 28, 127–167. [Google Scholar]
  8. Dida, G.; Bantte, K.; Disasa, T. Molecular characterization of Arabica coffee (Coffea arabica L.) germplasms and their contribution to biodiversity in Ethiopia. Plant Biotechnol. Rep. 2021, 15, 791–804. [Google Scholar] [CrossRef]
  9. Mannino, G.; Kunz, R.; Maffei, M.E. Discrimination of green coffee (Coffea arabica and Coffea canephora) of different geographical origin based on antioxidant activity, high-throughput metabolomics, and DNA RFLP fingerprinting. Antioxidants 2023, 12, 1135. [Google Scholar] [CrossRef] [PubMed]
  10. Khemira, H.; Mahdhi, M.; Tounekti, T.; Oteef, M.D.; Afzal, M.; Alfaifi, Z.; Sharma, M.; Alsolami, W.; Shargi, D. Diversity among Coffea arabica cultivars in southwestern Saudi Arabia as revealed by their morphometric features. Not. Bot. Horti Agrobot. Cluj-Napoca 2024, 52, 13452. [Google Scholar] [CrossRef]
  11. Al-Ghamedi, K.; Alaraidh, I.; Afzal, M.; Mahdhi, M.; Al-Faifi, Z.; Oteef, M.D.; Tounekti, T.; Alghamdi, S.S.; Khemira, H. Assessment of genetic diversity of local coffee cultivars in southwestern Saudi Arabia using SRAP markers. Agronomy 2023, 13, 302. [Google Scholar] [CrossRef]
  12. Migahid, A.M. Flora of Saudi Arabia; Riyadh University Publications: Riyadh, Saudi Arabia, 1996; Volume 1. [Google Scholar]
  13. Collenette, S. Wildflowers of Saudi Arabia; National Commission for Wildlife Conservation and Development (NCWCD): Riyadh, Saudi Arabia, 1999. [Google Scholar]
  14. Chaudhary, S.A. Flora of the Kingdom of Saudi Arabia; Ministry of Agriculture and Water: Riyadh, Saudi Arabia, 2001. [Google Scholar]
  15. Prakash, N.S.; Marques, D.V.; Varzea, V.; Silva, M.C.; Combes, M.; Lashermes, P. Introgression molecular analysis of a leaf rust resistance gene from Coffea liberica into C. arabica L. Theor. Appl. Genet. 2004, 109, 1311–1317. [Google Scholar] [CrossRef]
  16. Collard, B.C.; Mackill, D.J. Start codon targeted (SCoT) polymorphism: A simple, novel DNA marker technique for generating gene-targeted markers in plants. Plant Mol. Biol. Report. 2009, 27, 86–93. [Google Scholar] [CrossRef]
  17. Bornet, B.; Branchard, M. Nonanchored inter simple sequence repeat (ISSR) markers: Reproducible and specific tools for genome fingerprinting. Plant Mol. Biol. Rep. 2001, 19, 209–215. [Google Scholar] [CrossRef]
  18. Rohlf, F.J. Geometric morphometrics and phylogeny. In Morphology, Shape, and Phylogeny; MacLeod, N., Forey, P.L., Eds.; Taylor & Francis: London, UK, 2002; pp. 175–193. [Google Scholar]
  19. Sokal, R.R.; Michener, C.D. A statistical method for evaluating systematic relationships. Univ. Kans. Sci. Bull. 1958, 38, 1409–1438. [Google Scholar]
  20. Hammer, Ø. PAST: Paleontological statistics software package for education and data analysis. Palaeontol. Electron. 2001, 4, 9. [Google Scholar]
  21. Konopiński, M.K. Shannon diversity index: A call to replace the original Shannon’s formula with unbiased estimator in the population genetics studies. PeerJ 2020, 8, e9391. [Google Scholar] [CrossRef]
  22. Yunita, R.; Oktavioni, M.; Chaniago, I.; Syukriani, L.; Setiawan, M.A.; Jamsari, J. Analysis of genetic diversity of Arabica coffee (Coffea arabica L.) in Solok Regency by SRAP molecular markers. In IOP Conference Series: Earth and Environmental Science; IOP Publishing: Bristol, UK, 2020; p. 012018. [Google Scholar]
  23. Amiryousefi, A.; Hyvönen, J.; Poczai, P. iMEC: Online marker efficiency calculator. Appl. Plant Sci. 2018, 6, e01159. [Google Scholar] [CrossRef] [PubMed]
  24. Ahmed, M.Z.; Masoud, I.M.; Zedan, S.Z. Molecular characterization and genetic relationships of cultivated flax (Linum usitatissimum L.) genotypes using ISSR markers. Middle East J. Agric. Res. 2019, 8, 898–908. [Google Scholar]
  25. Hopley, T.; Byrne, M. Gene flow and genetic variation explain signatures of selection across a climate gradient in two riparian species. Genes 2019, 10, 579. [Google Scholar] [CrossRef]
  26. Chown, S.L.; Hodgins, K.A.; Griffin, P.C. Biological invasions, climate change, and genomics. In Crop Breeding; Springer: Berlin, Germany, 2016; pp. 59–114. [Google Scholar]
  27. Luo, Y.; Zhang, X.; Xu, J.; Zheng, Y.; Pu, S.; Duan, Z.; Li, Z.; Liu, G.; Chen, J.; Wang, Z. Phenotypic and molecular marker analysis uncovers the genetic diversity of the grass Stenotaphrum secundatum. BMC Genet. 2020, 21, 86. [Google Scholar] [CrossRef]
  28. Hasan, N.; Choudhary, S.; Naaz, N.; Sharma, N.; Laskar, R.A. Recent advancements in molecular marker-assisted selection and applications in plant breeding programmes. J. Genet. Eng. Biotechnol. 2021, 19, 128. [Google Scholar] [CrossRef]
  29. Al-Murish, T.M.; Elshafei, A.A.; Al-Doss, A.A.; Barakat, M.N. Genetic diversity of coffee (Coffea arabica L.) in Yemen via SRAP, TRAP, and SSR markers. J. Food Agric. Environ. 2013, 11, 411–416. [Google Scholar]
  30. Kebede, M.; Bellachew, B. Phenotypic diversity in the Hararge coffee (Coffea arabica L.) germplasm for quantitative traits. East Afr. J. Sci. 2008, 2, 13–18. [Google Scholar] [CrossRef]
  31. Kumar, J.; Heikrujam, M.; Sharma, K.; Agrawal, V. SRAP and SSR marker-assisted genetic diversity, cultivar structure analysis, and sex identification in Jojoba (Simmondsia chinensis). Ind. Crops Prod. 2019, 133, 118–132. [Google Scholar] [CrossRef]
  32. Wintgens, J.N. Coffee Bean Quality Assessment; Springer: Berlin, Germany, 2009. [Google Scholar]
  33. Kathurima, C.; Ghosh, K.; Bandar, A.; Alwshigry, A.; Alojaimi, A.; Kimemia, J. Unveiling physical and sensory quality of Arabica coffee produced in the Kingdom of Saudi Arabia, Jazan Region. 2022. Available online: https://saudiarabia.un.org/en/download/118640/203992 (accessed on 9 January 2024).
  34. Andermann, T.; Antonelli, A.; Barrett, R.L.; Silvestro, D. Estimating alpha, beta, and gamma diversity through deep learning. Front. Plant Sci. 2022, 13, 839407. [Google Scholar] [CrossRef] [PubMed]
  35. Gana, A.S.; Shaba, S.Z.; Tsado, E.K. Principal component analysis of morphological traits in thirty-nine accessions of rice (Oryza sativa L.) grown in a rainfed lowland ecology of Nigeria. J. Plant Breed. Crop Sci. 2013, 5, 120–126. [Google Scholar]
  36. Revermann, R.; Finckh, M.; Stellmes, M.; Strohbach, B.J.; Frantz, D.; Oldeland, J. Linking land surface phenology and vegetation-plot databases to model terrestrial plant α-diversity of the Okavango Basin. Remote Sens. 2016, 8, 370. [Google Scholar] [CrossRef]
  37. Wickramasinghe, H.K.J.P. Nutritional interventions for dairy calves undergoing weaning and heat stresses. J. Anim. Sci. 2022, 100, skac247. [Google Scholar]
  38. Ovalle-Rivera, O.; Läderach, P.; Bunn, C.; Obersteiner, M.; Schroth, G. Projected shifts in Coffea arabica suitability among major global producing regions due to climate change. PLoS ONE 2015, 10, e0124155. [Google Scholar] [CrossRef]
  39. Montagnon, C.; Sheibani, F.; Benti, T.; Daniel, D.; Bote, A.D. Deciphering early movements and domestication of Coffea arabica through a comprehensive genetic diversity study covering Ethiopia and Yemen. Agronomy 2022, 12, 3203. [Google Scholar] [CrossRef]
  40. Montagnon, C.; Rossi, V.; Guercio, C.; Sheibani, F. Vernacular names and genetics of cultivated coffee (Coffea arabica) in Yemen. Agronomy 2022, 12, 1970. [Google Scholar] [CrossRef]
  41. Montagnon, C.; Mahyoub, A.; Solano, W.; Sheibani, F. Unveiling a unique genetic diversity of cultivated Coffea arabica L. in its main domestication center: Yemen. Genet. Resour. Crop Evol. 2021, 68, 2411–2422. [Google Scholar] [CrossRef]
  42. Eskes, A.B.; Mukred, A. Coffee Survey in PDR Yemen; FAO: Rome, Italy, 1990. [Google Scholar]
Figure 1. Map of Al-Baha region, southwest of Saudi Arabia, illustrating the areas and sites of collection of the 12 Arabian coffee cultivars; plotted and coded as given in Table 1.
Cimb 47 00136 g001
Figure 2. Photographs illustrating (A): ISSR and (B): SCoT fingerprinting profiles produced by three primers for C. arabica cultivars as coded in Table 1. M: 100 bp marker DNA ladder. Cultivar codes as given in Table 1.
Cimb 47 00136 g002
Figure 3. UPGMA and NTSYS distance tree, based on the analysis of morphological traits, computed with the SM coefficient, showing the relationships among the examined Arabica coffee cultivars.
Cimb 47 00136 g003
Figure 4. UPGMA distance tree computed using NTSYS-pc version 2.2, based on the analysis of ISSR data, showing the relationships among the examined C. arabica cultivars in the study area.
Cimb 47 00136 g004
Figure 5. UPGMA distance tree computed using NTSYS-pc version 2.2, showing the relationships among the examined C. arabica cultivars based on the analysis of SCoT data.
Cimb 47 00136 g005
Figure 6. UPGMA distance tree (A) and PCA scatter diagram (B) of the examined Arabian coffee cultivars, constructed using the PAST-pc software version 4.13, showing the relationships among cultivars based on the analysis of variation in the morphological traits and ISSR–SCoT fingerprinting polymorphism.
Cimb 47 00136 g006
Figure 7. (A): The diversity profile and (B): alpha diversity, which were calculated using the Pasta pc program version 4.13, among the twelve studied C. arabica cultivars.
Cimb 47 00136 g007
Table 1. The 12 cultivars of the Arabian coffee plants collected from three areas in the Al-Baha region, as well as GPS location and elevation of sites from which the cultivars were collected.
No.Cultivars
Code
AreaGPS LocationElevation (m) Asl
1R4Al-Mehkwa19°50′32.002″ N41°18′29.08″ E1685
2Y3Al-Mehkwa19°50′9.74″ N41°18′49.038″ E1684
3Y5Al-Mehkwa19°50′9.74″ N41°18′49.038″ E1684
4R8Al-Mehkwa19°50′32.002″ N41°18′29.08″ E1684
5R9Al-Mehkwa19°44′44.623″ N41°21′19.939″ E1104
6R111Qalwa19°55′40.242″ N41°9′15.18″ E1321
7R112Qalwa19°55′40.242″ N41°9′15.18″ E1321
8R113Qalwa19°55′41.242″ N41°9′18.18″ E1351
9Y6Al-Mehkwa19°50′9.74″ N41°18′49.038″ E1684
10R114Al-Mehkwa19°50′32.91″ N41°18′28.693″ E1107
11Y2Al-Mehkwa19°50′9.74″ N41°18′44.068″ E1684
12Y7Al-Mehkwa19°50′19.74″ N41°18′39.038″ E1684
Table 2. A list of morphological traits and the measurements of quantitative traits and state of qualitative traits of the Arabian coffee plants in the 12 cultivars, coded as given in Table 1.
No.CharacterArabian Coffee Cultivars
R4Y3Y5R8R9R111
Qualitative Characters1Plant ShapePyramidalEllipsoidEllipsoidPyramidalEllipsoidPyramidal
2Growth HabitTreeShrubShrubTreeShrubTree
3Young Leaf Anthocyanin ColorationWeek or absentStrongStrongStrongStrongStrong
4Leaf Petiole ColorGreenDark BrownDark BrownGreenDark BrownGreen
5Inflorescence PositionAxillaryTerminalTerminalAxillaryTerminalAxillary
6Inflorescence on Old WoodAbsentPresentPresentAbsentPresentAbsent
7Fruit adherence to branchStrongStrongStrongStrongWeakWeak
8Cherry ColorLight redLight redLight redLight redLight redLight red
9Leaf ShapelanceolateLanceolatelanceolatelanceolatelanceolateOvate
10Fruit ShapeCircularEllipticEllipticCircularEllipticCircular
Quantitative Characters11Plant HeightLongLongLongIntermediateShortLong
12Canopy DiameterNarrowWideWideWideIntermediateWide
13Internode Length on Primary BranchIntermediateShortShortShortShortShort
14Leaf LengthShortShortIntermediateIntermediateShortShort
15Leaf WidthIntermediateIntermediateNarrowIntermediateIntermediateNarrow
16Leaf Margin UndulationIntermediateStrongIntermediateWeek or absentIntermediateStrong
17Leaf Petiole Length cm4.5 ± 0.244.6 ± 0.326.7 ± 0.025.7 ± 0.444.8 ± 0.294.4 ± 0.22
18No. of Flowers251814191822
19No. of Flower Fascicles118710811
20Fruit Size cm1.5 ± 0.691.5 ± 0.601.5 ± 0.541.9 ± 0.931.8 ± 0.190.8 ± 0.32
21Fruit ThicknessIntermediateIntermediateIntermediateThinIntermediateIntermediate
22Seed widthIntermediateIntermediateIntermediateIntermediateBroadIntermediate
23100 Fruit fresh weight163 ± 4.28147 ± 5.24112 ± 2.39258 ± 9.73256 ± 7.09176 ± 4.51
24100 Fruit dry weight49.7 ± 1.7444.6 ± 0.2456 ± 4.3345.2 ± 5.6446.9 ± 3.2340 ± 3.63
25100Seed dry weight27 ± 0.9322 ± 0.2424 ± 1.0435 ± 1.3538 ± 2.5330 ± 6.37
Qualitative Characters1Plant ShapeEllipsoidConicalEllipsoidPyramidalEllipsoidConical
2Growth HabitTreeShrubShrubTreeTreeShrub
3Young Leaf Anthocyanin ColorationWeek or absentStrongStrongWeek or absentStrongWeek or absent
4Leaf Petiole ColorDark BrownGreenDark BrownGreenGreenDark Brown
5Inflorescence PositionAxillaryTerminalAxillaryTerminalTerminalAxillary
6Inflorescence on Old WoodPresentAbsentPresentAbsentAbsentPresent
7Fruit adherence to branchWeakStrongStrongStrongStrongWeak
8Cherry ColorLight redLight redLight redLight redLight redOrang
9Leaf ShapeOvateEllipticlanceolateOvateLanceolatelanceolate
10Fruit ShapeCircularEllipticCircularEllipticEllipticCircular
Quantitative Characters11Plant HeightShortShortIntermediateShortLongIntermediate
12Canopy DiameterWideNarrowIntermediateWideIntermediateNarrow
13Internode Length on Primary BranchLongShortShortShortShortShort
14Leaf LengthIntermediateLongIntermediateShortIntermediateShort
15Leaf WidthIntermediateWideIntermediateIntermediateIntermediateNarrow
16Leaf Margin UndulationStrongStrongStrongStrongStrongIntermediate
17Leaf Petiole Length cm3.7 ± 1.294.1 ± 1.826.1 ± 1.224.3 ± 1.045.1 ± 1.394.9 ± 1.27
18No. of Flowers/plant191713181814
19No. of Flower Fascicles1086786
20Fruit Size cm1.5 ± 0.691.4 ± 0.601.4 ± 0.541.9 ± 0.931.8 ± 0.191.4 ± 0.32
21Fruit ThicknessThinIntermediateIntermediateThinIntermediateThick
22Seed widthIntermediateIntermediateBroadIntermediateIntermediateNarrow
23100 Fruit fresh weight133 ± 6.73166 ± 4.266175 ± 4.22176 ± 6.56178 ± 3.83180 ± 6.89
24100 Fruit dry weight44.9 ± 4.7347 ± 2.5349 ± 2.9845.2 ± 3.3948 ± 4.5753 ± 4.34
25100 Seed dry weight34 ± 1.2324 ± 2.2524 ± 2.2734 ± 1.8326 ± 1.3223 ± 1.23
Table 3. Polymorphism statistics were estimated using the iMEC tool for 8 ISSR and 9 SCoT primer types using the data set from the 12 Coffea cultivars.
NoPrimer CodeTotal Number of BandsHPICERpH. avMID
1HB-830.2780.4572.5001.0000.0080.0190.310
2HB-9100.4550.3923.5003.6670.0040.0130.879
3HB-1080.4220.4065.5833.1670.0040.0260.515
4HB-1270.4590.3904.5003.0000.0050.0250.590
5HB-1360.3890.4204.4172.1670.0050.0240.461
6HB-1460.4530.3933.9173.1670.0060.0250.577
781470.4080.4125.0002.3330.0050.0240.492
882660.4010.4154.3333.0000.0060.0240.481
9ScoT380.4370.4002.5834.5000.0050.0120.898
10ScoT460.4440.3974.0003.0000.0060.0250.559
11ScoT7100.4950.3734.5006.0000.0040.0190.800
12ScoT890.4940.3735.0002.3330.0050.0230.694
13ScoT960.3750.4254.5002.0000.0050.0230.440
14ScoT1390.4170.4082.6673.6670.0040.0100.914
15ScoT14120.4900.3755.1675.0000.0030.0180.816
16ScoT15100.4990.3714.7503.8330.0040.0200.776
17ScoT1690.4790.3815.4173.5000.0040.0240.640
Average 0.4950.3734.7544.1300.0040.0230.777
Note: heterozygosity index (H), polymorphic information content (PIC), effective multiplex ratio (E), arithmetic mean of H (H. av), marker index (MI), discriminating power (D), resolving power (Rp).
Disclaimer/Publisher’s Note: The statements, opinions and data contained in all publications are solely those of the individual author(s) and contributor(s) and not of MDPI and/or the editor(s). MDPI and/or the editor(s) disclaim responsibility for any injury to people or property resulting from any ideas, methods, instructions or products referred to in the content.

