Article

A Comprehensive Comparative Analysis and Phylogenetic Investigation of the Chloroplast Genome Sequences in Four Astragalus Species

1
Yunnan Key Laboratory of Screening and Research on Anti-pathogenic Plant Resources from Western Yunnan, Dali 671000, China
2
College of Pharmacy, Dali University, Dali 671000, China
*
Author to whom correspondence should be addressed.
Curr. Issues Mol. Biol. 2025, 47(12), 978; https://doi.org/10.3390/cimb47120978
Submission received: 17 October 2025 / Revised: 15 November 2025 / Accepted: 23 November 2025 / Published: 25 November 2025
(This article belongs to the Section Molecular Plant Sciences)

Abstract

Astragalus L. (Fabaceae), the largest plant genus with significant medicinal value, faces critical endangerment of its wild resources and a scarcity of chloroplast genomic data. We sequenced and assembled the complete chloroplast (cp) genomes of four Astragalus species (A. yunnanensis, A. yunnanensis subsp. incanus, A. polycladus and A. polycladus var. nigrescens) and performed comparative analyses with five previously published chloroplast genomes. The cp genomes of the four Astragalus species ranged in size from 122,868 bp to 125,752 bp, all lacking one inverted repeat (IR) region, thus belonging to the inverted repeat lacking clade (IRLC). Annotation revealed that each genome contained 110 unique genes, including 76 protein-coding genes, 30 tRNA genes, and 4 rRNA genes. Nucleotide diversity (Pi) analysis identified mutation hotspots, including 5 non-coding regions and 5 coding regions, which could serve as potential molecular markers. Additionally, evidence of positive selection was detected in 11 genes, suggesting their possible roles in adaptive evolution to environmental changes. Phylogenetic analysis revealed distinct clades, with Astragalus forming a monophyletic group within Fabaceae. Notably, closely related species, subspecies, and varieties were observed to cluster together, forming sister taxa. However, despite the conservation in cp genomes, A. yunnanensis and A. yunnanensis subsp. incanus exhibit significant morphological differentiation in leaf shape, leaf indumentum, and stem color. This paradox strongly suggests a markedly higher evolutionary rate in the nuclear genome compared to the chloroplast genome. The cp genomes of Astragalus presented here serve as a key resource for studying the genus’s genetic diversity and will aid in elucidating its intrageneric phylogeny.

1. Introduction

The Astragalus Linn. (Fabaceae, Papilionoideae, Galegeae) comprises approximately 3000 species, making it the largest genus of flowering plants, as well as the most species-rich vascular plant [1,2]. This taxon includes both annual and perennial species [3], with a distribution primarily concentrated in cold, arid continental regions of the Northern Hemisphere and South America, while being relatively rare in North America and Oceania [4,5]. In China, the genus is represented by 401 species, including 221 endemic species, predominantly distributed across northern and southern provinces, with particularly high diversity in Tibet (Himalayan region), Central Asia, and Northeast China [3]. Astragalus species contain various bioactive compounds including flavonoids, saponins, polysaccharides, amino acids, and trace elements [6,7,8]. These chemical constituent exhibit significant medicinal properties, demonstrating immunomodulatory, antitumor, antioxidant, hypoglycemic, hepatoprotective, and diuretic effects [9,10,11].
Astragalus exhibits characteristic papilionaceous floral structures with unique morphological synapomorphies [12], making its taxonomic delineation particularly challenging. Traditional morphological studies have demonstrated limited resolution in classifying infrageneric taxa and determining species boundaries. Recent advances in sequencing technologies have facilitated extensive research on plant chloroplast genomes, which in higher plants typically form circular quadripartite structures comprising a large single-copy region (LSC), a small single-copy region (SSC), and two intervening inverted repeat regions (IRs). These plastomes, generally spanning 120–170 kb, encode approximately 130 genes primarily involved in photosynthesis and chloroplast replication [13,14,15]. Due to their relatively small size, evolutionary conservation, and slow nucleotide substitution rates, chloroplast genomes have been widely employed as valuable tools for plant identification, evolutionary biology studies, and genetic diversity assessments [16]. However, within the Papilionoideae subfamily of Fabaceae, a distinct clade designated as the inverted repeat lacking clade (IRLC) has been identified [17,18], which has undergone extensive plastome rearrangements. Previous studies have documented various plastid genomic rearrangements in Fabaceae, including a 50 kb inversion present in most Papilionoideae species [19,20,21], loss of one IR copy [4,19,20,22], and deletions of the infA, rpl22, and rps16 genes [23,24], as well as loss of clpP and rpl2 introns [21,25,26]. Consequently, comprehensive investigation of complete chloroplast genome rearrangements and phylogenetic relationships within the Astragalus lineage is imperative to enhance our understanding of chloroplast evolution in Papilionoideae and Fabaceae as a whole.
To date, plastid genomes of about 38 Astragalus species (including 25 species of Neo-Astragalus (the New World aneuploid species) [4,27] and species belonging to other clades) have been deposited in NCBI (the National Center for Biotechnology Information). Despite significant advances in the genomics of Astragalus species, the increasing demand for Astragalus in recent years has led to the near depletion of wild Astragalus resources [28]. To better conserve Astragalus genetic resources, we sequenced the complete chloroplast genomes of four Astragalus species and conducted detailed comparative genomic and phylogenetic analyses with five previously reported Astragalus chloroplast genomes, as well as other IRLC plastomes (Figure 1). This study advances our understanding of chloroplast genome evolution within Astragalus and related species of the Fabaceae. Moreover, it offers invaluable genomic resources that can be instrumental for future conservation initiatives.

2. Materials and Methods

2.1. Plant Material Sampling, DNA Extraction and Sequencing

For this study, fresh leaf samples of four wild Astragalus species were collected and subsequently preserved in silica gel: A. yunnanensis and A. yunnanensis subsp. incanus were obtained from Baima Snow Mountain, Deqen County (28.46° N, 99.03° E), Diqing Tibetan Autonomous Prefecture, Yunnan Province, China, while A. polycladus and A. polycladus var. nigrescens were collected from Geza Township (28.08° N, 99.81° E), Shangri-La City, within the same prefecture. All specimens were authenticated by Professor Yongzeng Zhang and deposited at the Herbarium of Yunnan Key Laboratory of Screening and Research on Anti-pathogenic Plant Resources from Western Yunnan, with voucher codes 20240821-1, 20240821-2, 20240716-3, and 20240717-4, respectively. Genomic DNA was extracted using a modified CTAB protocol [29], with quality and concentration assessed through 1% agarose gel electrophoresis and spectrophotometry (Bio-Rad, Hercules, CA, USA). The DNA was sheared to approximately 350 bp fragments for library preparation. Sequencing was performed on the DNBSEQ-T7 platform, followed by quality filtering using fastp v.0.23.2 [30] to remove low-quality reads. Sequencing depth was evaluated using Samtools v1.17 [31]. The entire sequencing process was conducted by Wuhan Benagen Tech Co., Ltd. (Wuhan, China).

2.2. Chloroplast Genome Assembly and Annotation

The high-quality clean reads were assembled de novo using GetOrganelle software v1.7.5 [32] with default parameters for plant chloroplast genome reconstruction. The assembled chloroplast genomes were annotated using CPGAVAS2 (http://www.herbalgenomics.org/cpgavas2, accessed on 16 February 2025) [33], with graphical maps generated by OGDRAW v1.3.1 [34]. tRNA genes were identified through tRNAscan-SE v2.0.9 [35], while rRNA genes were annotated via BLASTN v2.8.1 [36]. Annotation errors were manually corrected using CPGView (http://www.1kmpg.cn/cpgview, accessed on 16 February 2025) [37] and Apollo [38]. The fully annotated chloroplast genome sequences of the four Astragalus species have been deposited in the NCBI GenBank database under accession numbers PV156652.1, PV156653.1, PV910878.1, and PV910879.1.

2.3. Codon Usage Bias Analysis

To mitigate sampling bias, protein-coding regions longer than 300 bp were exclusively analyzed. All coding sequences shorter than 300 bp were systematically excluded to ensure robust codon usage pattern determination. The relative synonymous codon usage (RSCU) value, defined as the ratio of observed codon frequency to expected frequency under equal usage, served as a reliable indicator of codon preference [39]. RSCU values for the nine Astragalus chloroplast genomes were computed using CodonW 1.4.4 (codon table = 11) [40], following standard bioinformatic protocols for plastid genome analysis.

2.4. Repeat Element and SSR Analysis

The chloroplast genomes of nine Astragalus species were analyzed for dispersed repeats, tandem repeats, and simple sequence repeats (SSRs) using specialized bioinformatics tools. Dispersed repeats (including forward, reverse, complementary, and palindromic types) were identified using REPuter (https://bibiserv.cebitec.uni-bielefeld.de/reputer, accessed on 12 March 2025) [41] with the following parameters: minimum repeat length = 30 bp, Hamming distance = 3, and maximum computed repeat size = 5000 bp. Tandem repeats were detected using the online Tandem Repeats Finder program [42] with default settings. SSR analysis was performed with MISA (https://webblast.ipk-gatersleben.de/misa/, accessed on 12 March 2025) [43], applying minimum repeat unit thresholds of 8, 4, 4, 3, 3, and 3 for mono-, di-, tri-, tetra-, penta-, and hexa-nucleotide motifs, respectively.

2.5. Comparative Genome and Sequence Divergence Analyses

Comparative analysis of the nine Astragalus chloroplast genomes was performed using a suite of bioinformatics tools. Complete plastome alignments were initially conducted using MAFFT v.7.313 [44], followed by extraction of consensus coding and intergenic regions. Nucleotide diversity (Pi) was calculated through sliding-window analysis (window length = 600 bp, step size = 200 bp) in DnaSP v.6.0 [45] based on the alignment results. Genomic divergence and mutation hotspots were identified using the online mVISTA platform (http://genome.lbl.gov/vista/index.shtml, accessed on 20 March 2025) in Shuffle-LAGAN mode, with the annotated A. yunnanensis chloroplast genome serving as the reference sequence [46].

2.6. Analysis of Synonymous (Ks) and Non-Synonymous (Ka) Substitution Rate

To elucidate the role of natural selection in shaping the molecular evolution of Astragalus chloroplast genomes, we employed synonymous (Ks) and nonsynonymous (Ka) substitution rates along with their ratio (Ka/Ks). All protein-coding genes were aligned using MAFFT v.7.313 [44], followed by calculation of Ks, Ka, and Ka/Ks values through KaKs_Calculator 2.0 [47]. The selection pressure was interpreted as follows: Ka/Ks > 1 indicates positive selection, Ka/Ks = 1 suggests neutral evolution, and Ka/Ks < 1 signifies purifying selection.

2.7. Phylogenetic Analysis

To investigate the phylogenetic relationships within Astragalus and the IRLC of Fabaceae, we retrieved complete chloroplast genomes of 49 species from the NCBI database, supplemented with four Astragalus species from this study. Lotus corniculatus and L. corniculatus subsp. japonicus were selected as outgroups for phylogenetic reconstruction. The sampling strategy for selecting these 53 taxa from the IRLC was designed with the following objectives: (1) to include representative species from all major genera within the IRLC for which complete chloroplast genome sequences are available; (2) to specifically oversample genera phylogenetically close to Astragalus (such as Oxytropis, Caragana, and Glycyrrhiza) to robustly test the monophyly and phylogenetic position of Astragalus; and (3) to base our selection on all available, high-quality, and complete chloroplast genome sequences in public databases (e.g., NCBI). All sequences were aligned using MAFFT v.7.313 [44] and subsequently trimmed with Trimal v1.4 [48]. The optimal substitution models were determined through ModelFinder [49] in PhyloSuite v1.2.3 [50], identifying GTR+G4+F for maximum likelihood (ML) analysis and GTR+G+F for Bayesian inference (BI). ML trees were constructed with IQ-tree 2.2.0 [51] using 1000 bootstrap replicates to assess branch support [52]. Bayesian analysis was performed in MrBayes v3.2.7 [53] with two parallel runs of 1,000,000 generations, discarding the initial 25% as burn-in. Final tree visualization was conducted using FigTree v1.4.4 [54].

3. Results

3.1. Chloroplast Genome Features of Astragalus Species

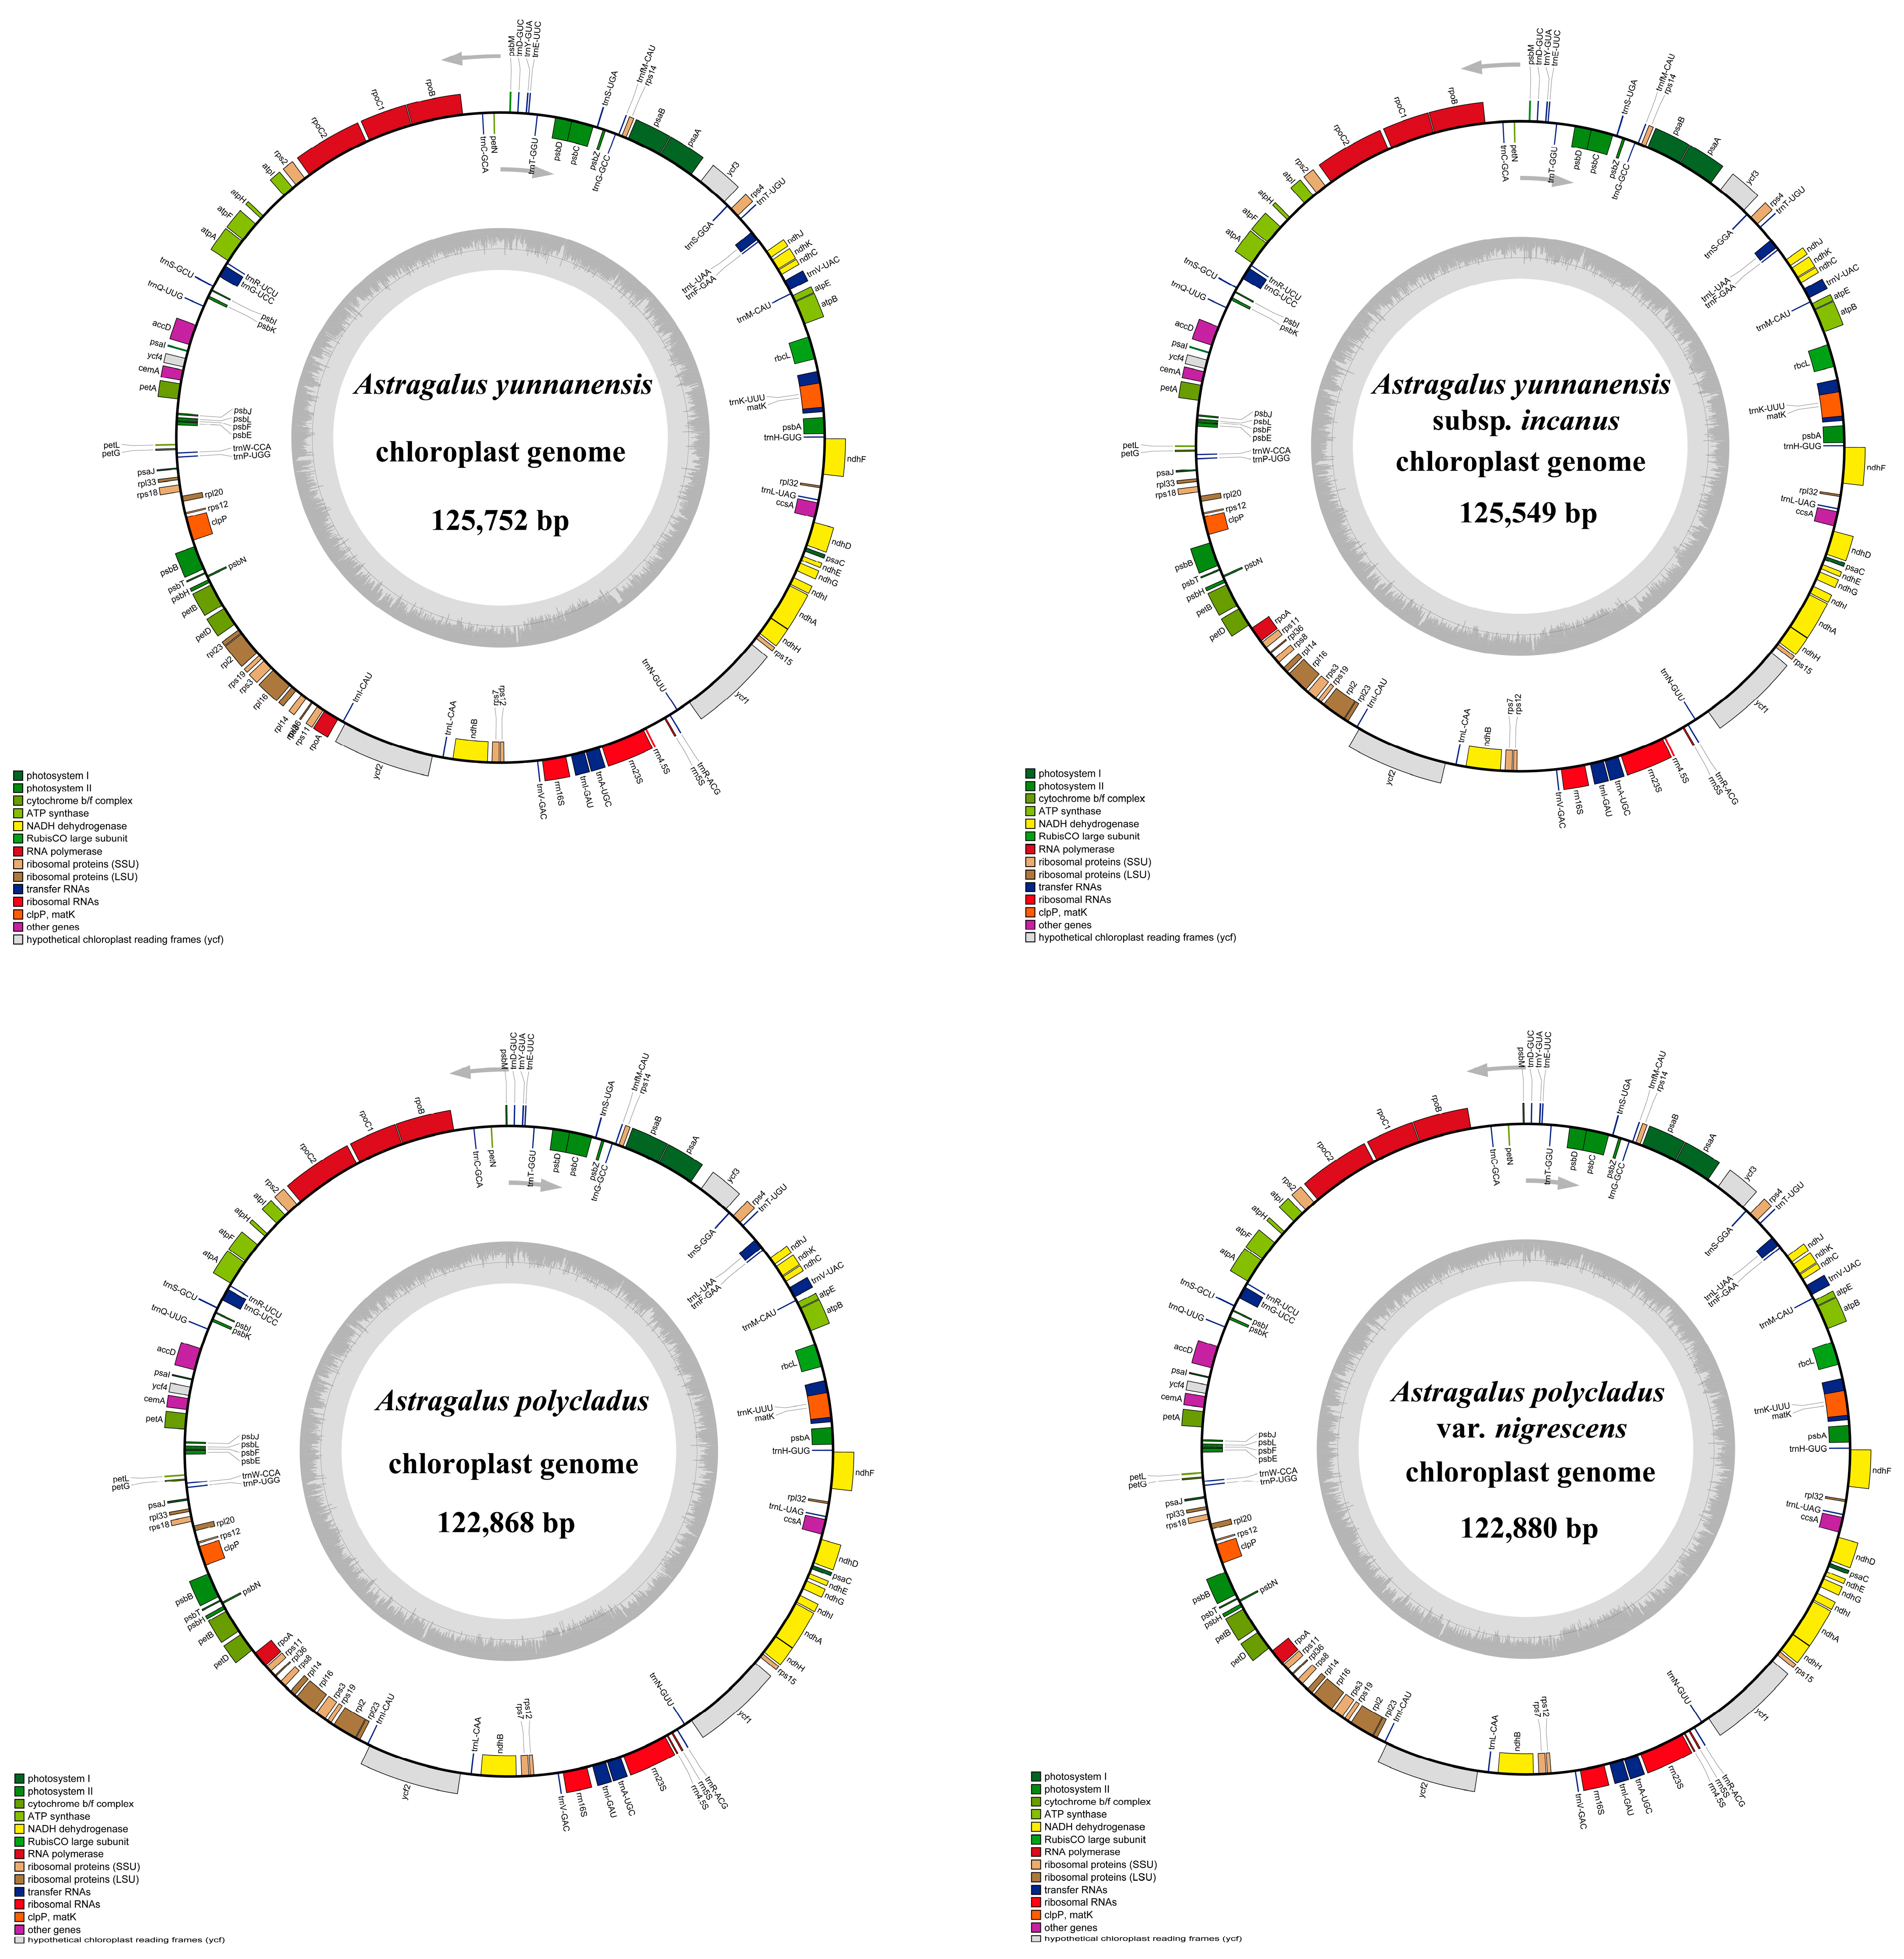
This study analyzed nine cp genomes, including four newly sequenced genomes (Supplementary Table S1) and five previously published ones. The four newly sequenced Astragalus cp genomes ranged in size from 122,868 bp to 125,752 bp, with GC contents between 34.14% and 34.22% (Table 1), demonstrating highly conserved plastome architectures. Due to the absence of inverted repeat (IR) regions, they lack the typical quadripartite structure found in most angiosperm chloroplast genomes, exhibiting instead the characteristic IRLC organization with correspondingly shorter lengths (Figure 2). Average read depths for gene coverage were 1454.51×, 2773.59×, 4696.17×, and 4570.70×, respectively (Supplementary Figure S1). Notably, the cp genomes of the four Astragalus species lack the infA, rps16, and rpl22 genes, as well as the first intron of the clpP gene.
The annotation results of the cp genomes showed that all four Astragalus plastomes contained 110 genes, including 76 protein-coding genes (PCGs), 30 transfer RNA (tRNA) genes, and 4 ribosomal RNA (rRNA) genes (Figure 2; Table 2). Among the four Astragalus species, 10 PCGs (ndhA, ndhB, petB, petD, atpF, rps12, rpl2, rpl16, rpoC1, and clpP) and 6 tRNA genes (trnA-UGC, trnG-UCC, trnI-GAU, trnK-UUU, trnL-UAA, and trnV-UAC) contained 1 intron each, while ycf3 had 2 introns (Supplementary Table S2). Additionally, cis-spliced and trans-spliced genes were identified in the four Astragalus, with a total of 10 PCGs (ndhA, ndhB, rpl2, rpl16, petD, petB, clpP, atpF, rpoC1, and ycf3) being cis-spliced genes, each containing 1–2 introns (Supplementary Figure S2). The rps12 gene underwent trans-splicing, with its 3′ end lacking an intron (Supplementary Figure S2). All genes were classified into four categories: the first group comprised 44 photosynthesis-related genes; the second group included 57 self-replication-related genes; the third group contained 5 other functional genes; and the fourth group consisted of 4 unknown function genes (Table 2).
Comparative analysis of the four newly sequenced Astragalus chloroplast genomes with five previously published ones revealed total sequence lengths ranging from 122,796 to 125,752 base pairs. The absence of IRs resulted in the shortest chloroplast genome in A. laxmannii (122,796 bp), while A. yunnanensis exhibited the longest genome (125,752 bp) (Table 1). Notably, A. membranaceus, A. laxmannii, and A. membranaceus var. mongholicus displayed distinct gene counts (107, 106, and 109 genes, respectively) compared to the consistent 110 genes observed in the other six Astragalus species (Table 1). This variation primarily stemmed from differences in tRNA gene numbers, while PCGs and rRNA gene counts remained conserved across all examined genomes.
From the perspective of gene content, PCGs were the most abundant among the nine plant species, accounting for approximately half of the entire genome length. This was followed by tRNA genes, which were considerably shorter in length compared to other genes (Table 1). Overall, the chloroplast genome sequences of these nine Astragalus species exhibited highly similar lengths and gene compositions. We further analyzed the differences in GC content among these three gene categories. The rRNA genes displayed the highest GC content, consistently exceeding 50%. tRNA genes ranked second in GC content, while PCGs exhibited the lowest GC content, averaging around 36%. Additionally, the mean GC content across all nine species was approximately 34% (Table 1), suggesting a relatively conserved sequence evolution within the Astragalus.

3.2. Codon Usage Analysis

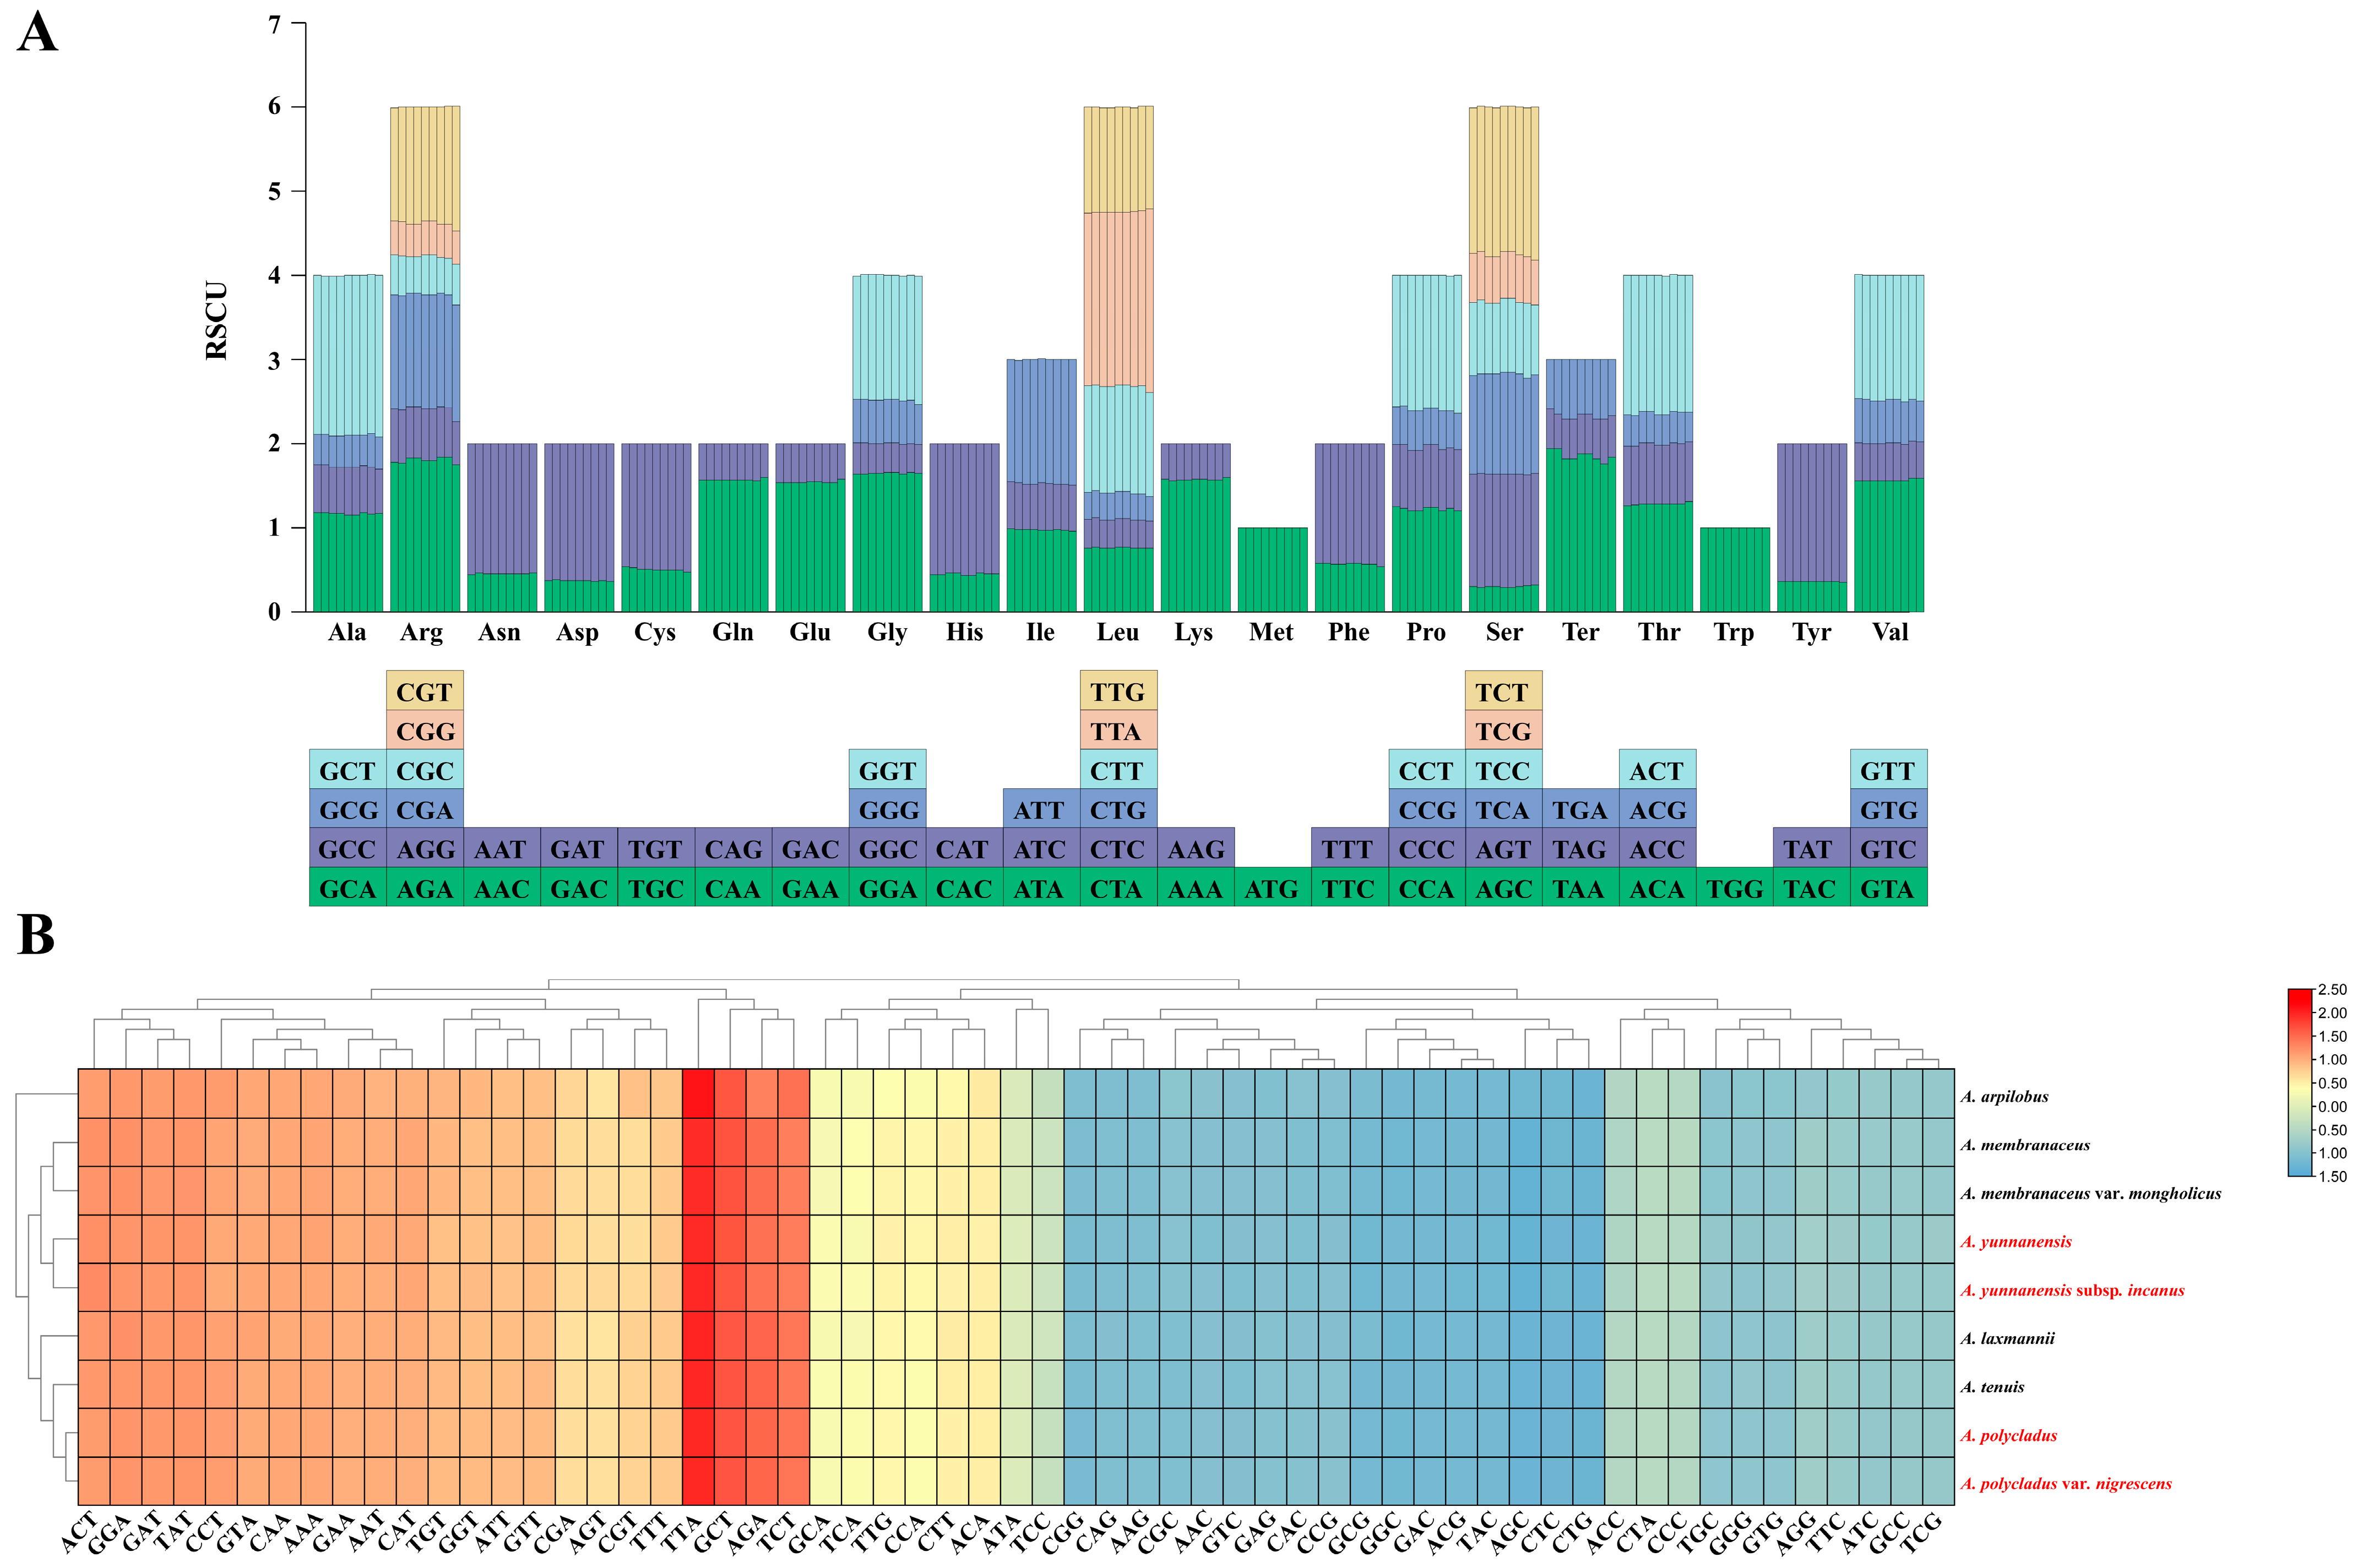
Analysis of codon usage patterns across nine Astragalus species revealed both conserved and species-specific trends. We identified 61 relative synonymous codon usage (RSCU) values in Astragalus plastomes, with total codon counts ranging from 18,018 (A. arpilobus) to 20,206 (A. yunnanensis) (Supplementary Table S3). The species exhibited minimal variation in codon numbers per amino acid, maintaining consistent codon preference patterns. Among these codons, leucine (Leu) was the most abundant amino acid (10.51–10.66% of total occurrences), followed by isoleucine (Ile) (8.82–8.99%), while cysteine (Cys) was the rarest (1.06–1.09%) (Supplementary Table S3). Among the 61 codons, 29 showed RSCU values > 1, with leucine’s TTA demonstrating the highest RSCU (2.05–2.18), while 30 codons had RSCU values < 1. The methionine (Met) and tryptophan (Trp) codons ATG and TGG exhibited RSCU = 1, indicating no usage bias (Figure 3B; Supplementary Table S3). Notably, among codons with RSCU > 1, all except TTG (leucine) terminated with A/U (T) (Figure 3A; Supplementary Table S3), demonstrating A/U (T)-ending codon dominance in Astragalus chloroplast genomes.

3.3. Repeat Sequence and SSR Analyses

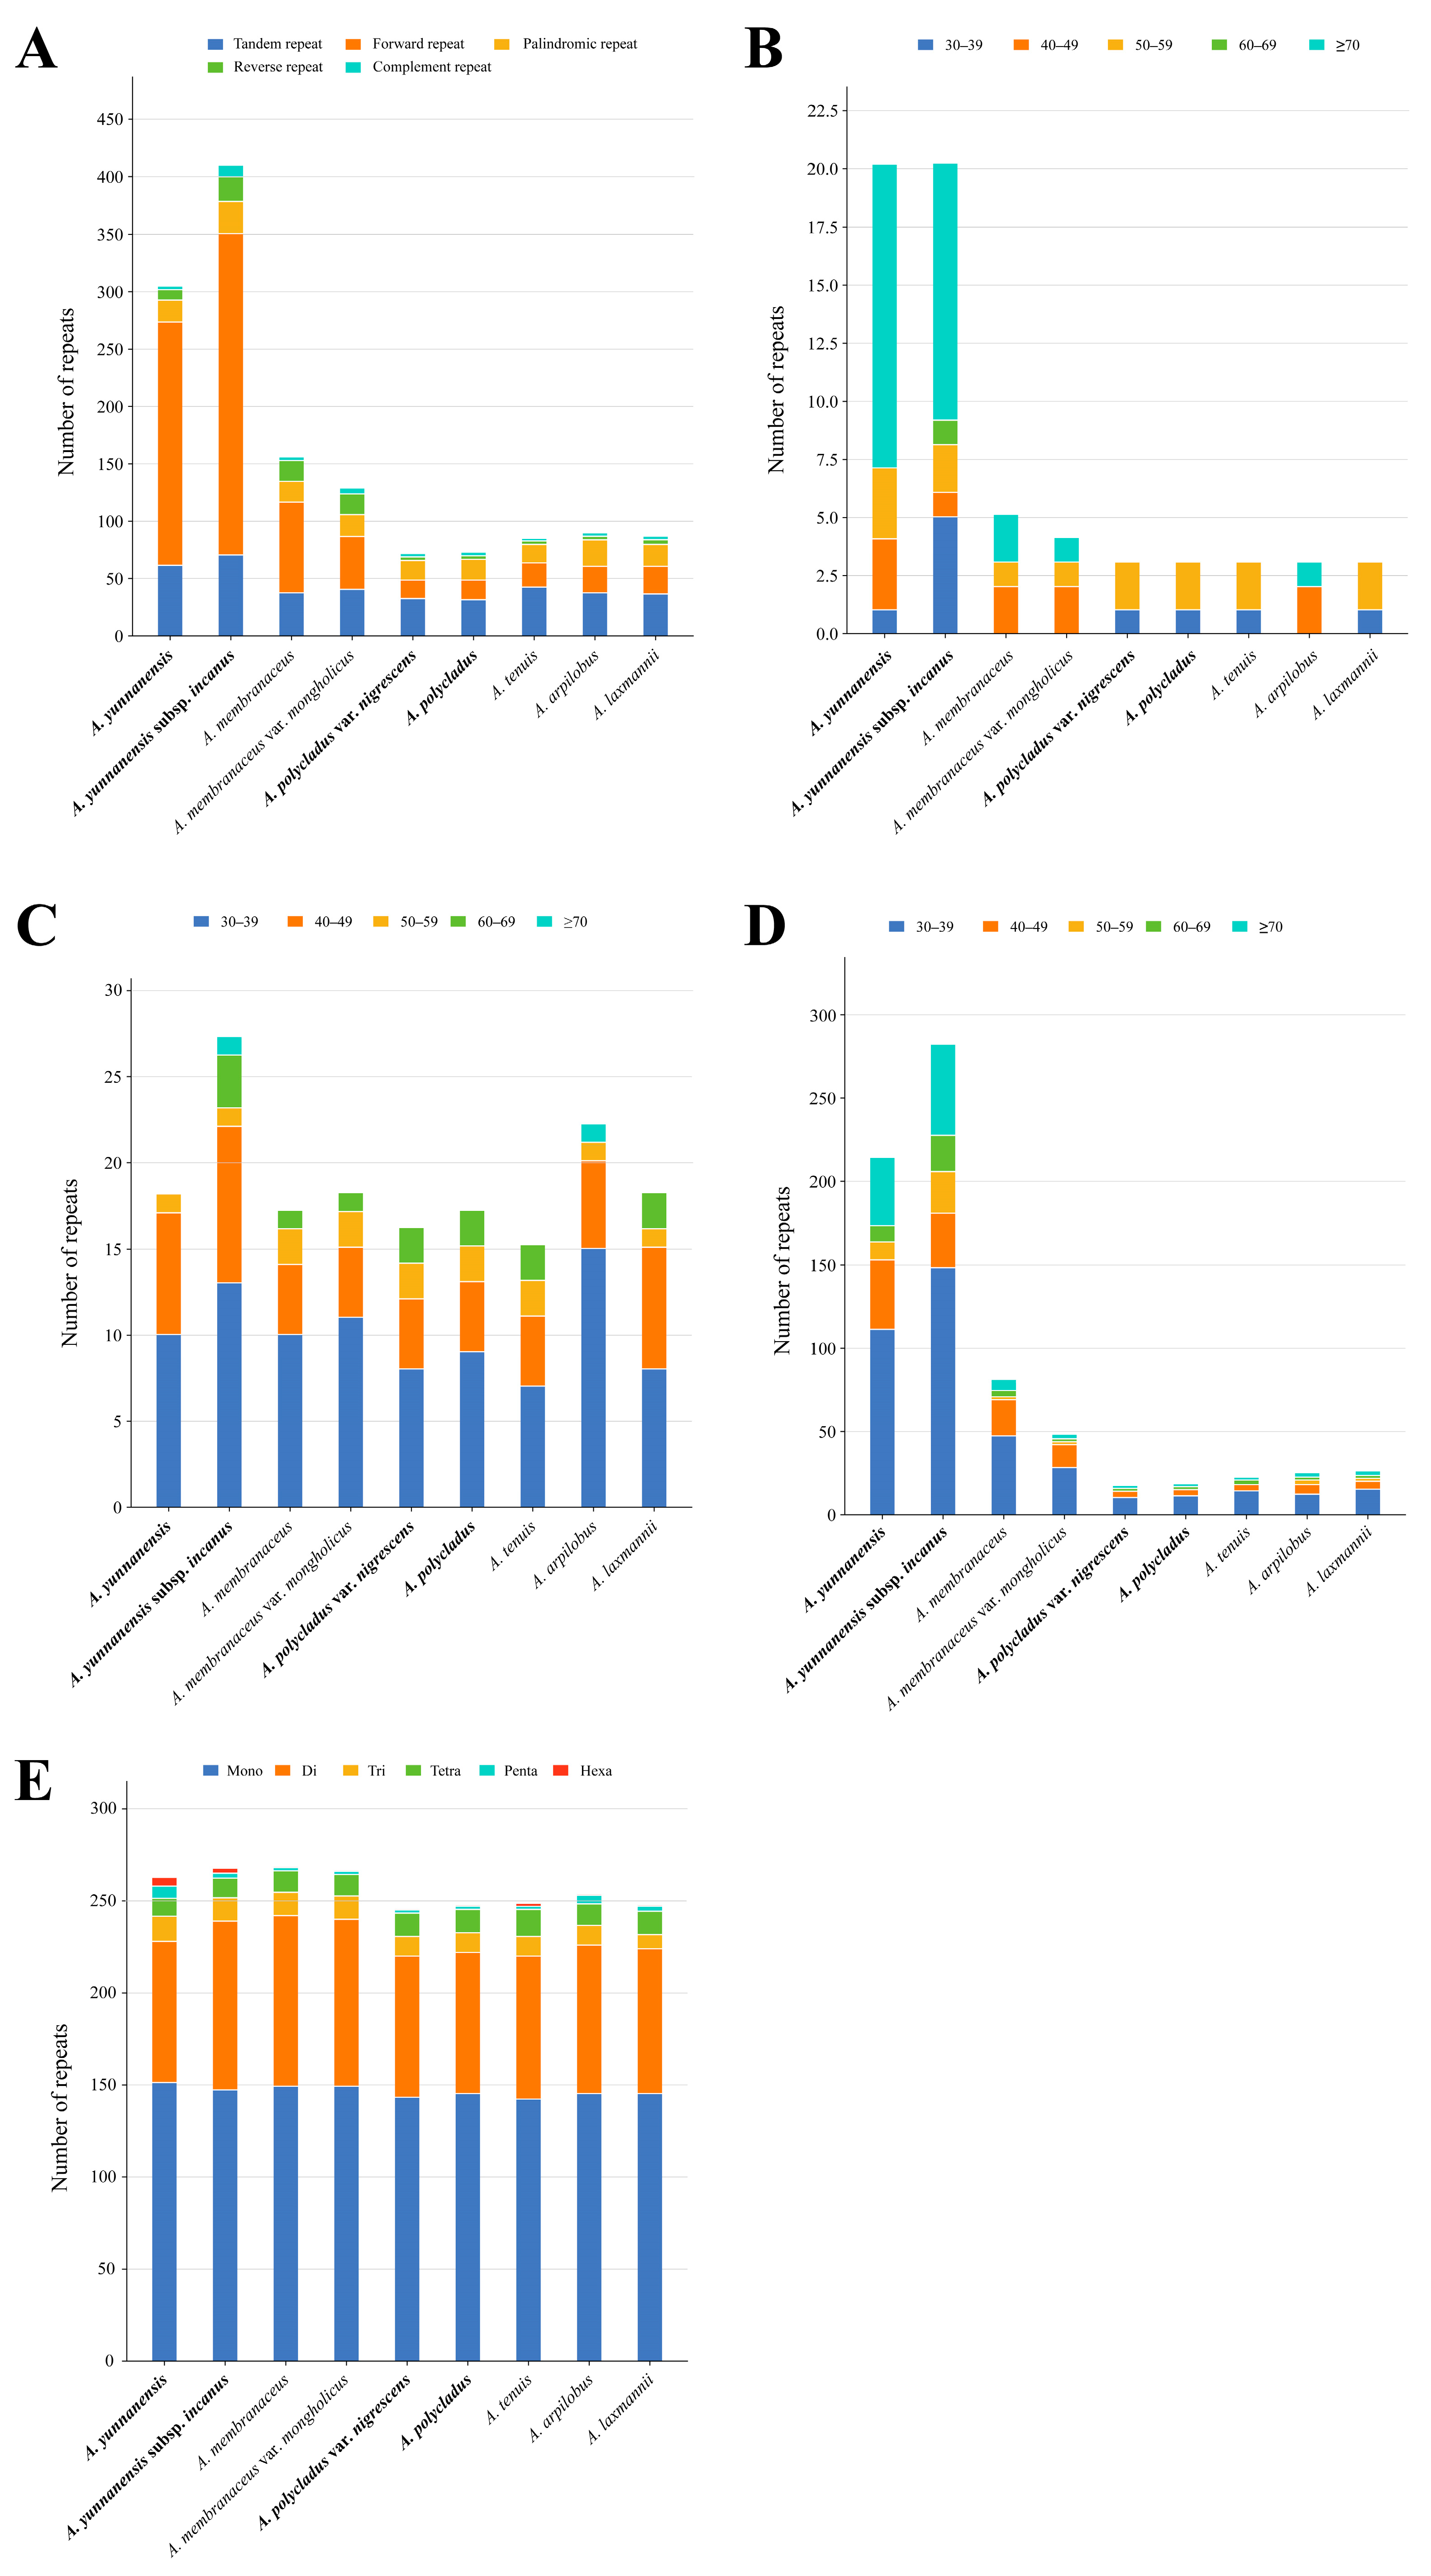
Comprehensive analysis of Astragalus chloroplast genomes revealed 386 tandem repeats (Supplementary Table S4), with A. polycladus (31 repeats) showing the lowest frequency and A. yunnanensis subsp. incanus (70 repeats) exhibiting the highest count (Figure 4A; Supplementary Table S4). While tandem repeat lengths varied across the nine plastomes, the majority (50–59 bp) clustered within a specific size range (Figure 4B). Four distinct long repeat types were identified: forward, reverse, complementary, and palindromic repeats (Figure 4A), with total counts ranging from 35 (A. polycladus var. nigrescens) to 335 (A. yunnanensis subsp. incanus) (Supplementary Table S5). Forward repeats predominated (15 [A. polycladus var. nigrescens] to 279 [A. yunnanensis subsp. incanus]), followed by palindromic repeats (15 [A. tenuis] to 27 [A. yunnanensis subsp. incanus]) (Figure 4A). Reverse and complementary repeats occurred less frequently, ranging from 2 (A. polycladus var. nigrescens, A. polycladus, A. tenuis, A. arpilobus) to 20 (A. yunnanensis subsp. incanus) and 1 (A. tenuis) to 9 (A. yunnanensis subsp. incanus), respectively (Figure 4A–D). Notably, 30–39 bp represented the most prevalent length category across all long repeat types (Figure 4B–D).
A comprehensive analysis of SSRs in Astragalus chloroplast genomes identified 242–265 SSRs across the nine species, with all specimens containing mono-, di-, tri-, tetra-, and penta-nucleotide repeats (Figure 4E; Supplementary Table S6). Notably, hexa-nucleotide repeats were exclusively detected in A. yunnanensis, A. yunnanensis subsp. incanus, and A. tenuis, being absent in the remaining six species (Figure 4E; Supplementary Table S6). The quantitative distribution of SSR types was as follows: mono-nucleotide (142–151), di-nucleotide (75–92), tri-nucleotide (7–13), tetra-nucleotide (9–14), penta-nucleotide (1–6), and hexa-nucleotide (0–4) repeats (Figure 4E; Supplementary Table S6). Mono- and di-nucleotide SSRs demonstrated particularly high prevalence across all sequenced genomes. The majority of mono-nucleotide repeats consisted of A/T bases with minimal G/C content, while AT/TA sequences dominated the di-nucleotide repeats, a pattern consistently observed in all nine species (Supplementary Table S6). Further analysis of SSR distribution between genic and intergenic regions revealed significantly lower SSR abundance in coding regions compared to intergenic spacers (Supplementary Table S6).

3.4. Sequence Divergence Analysis

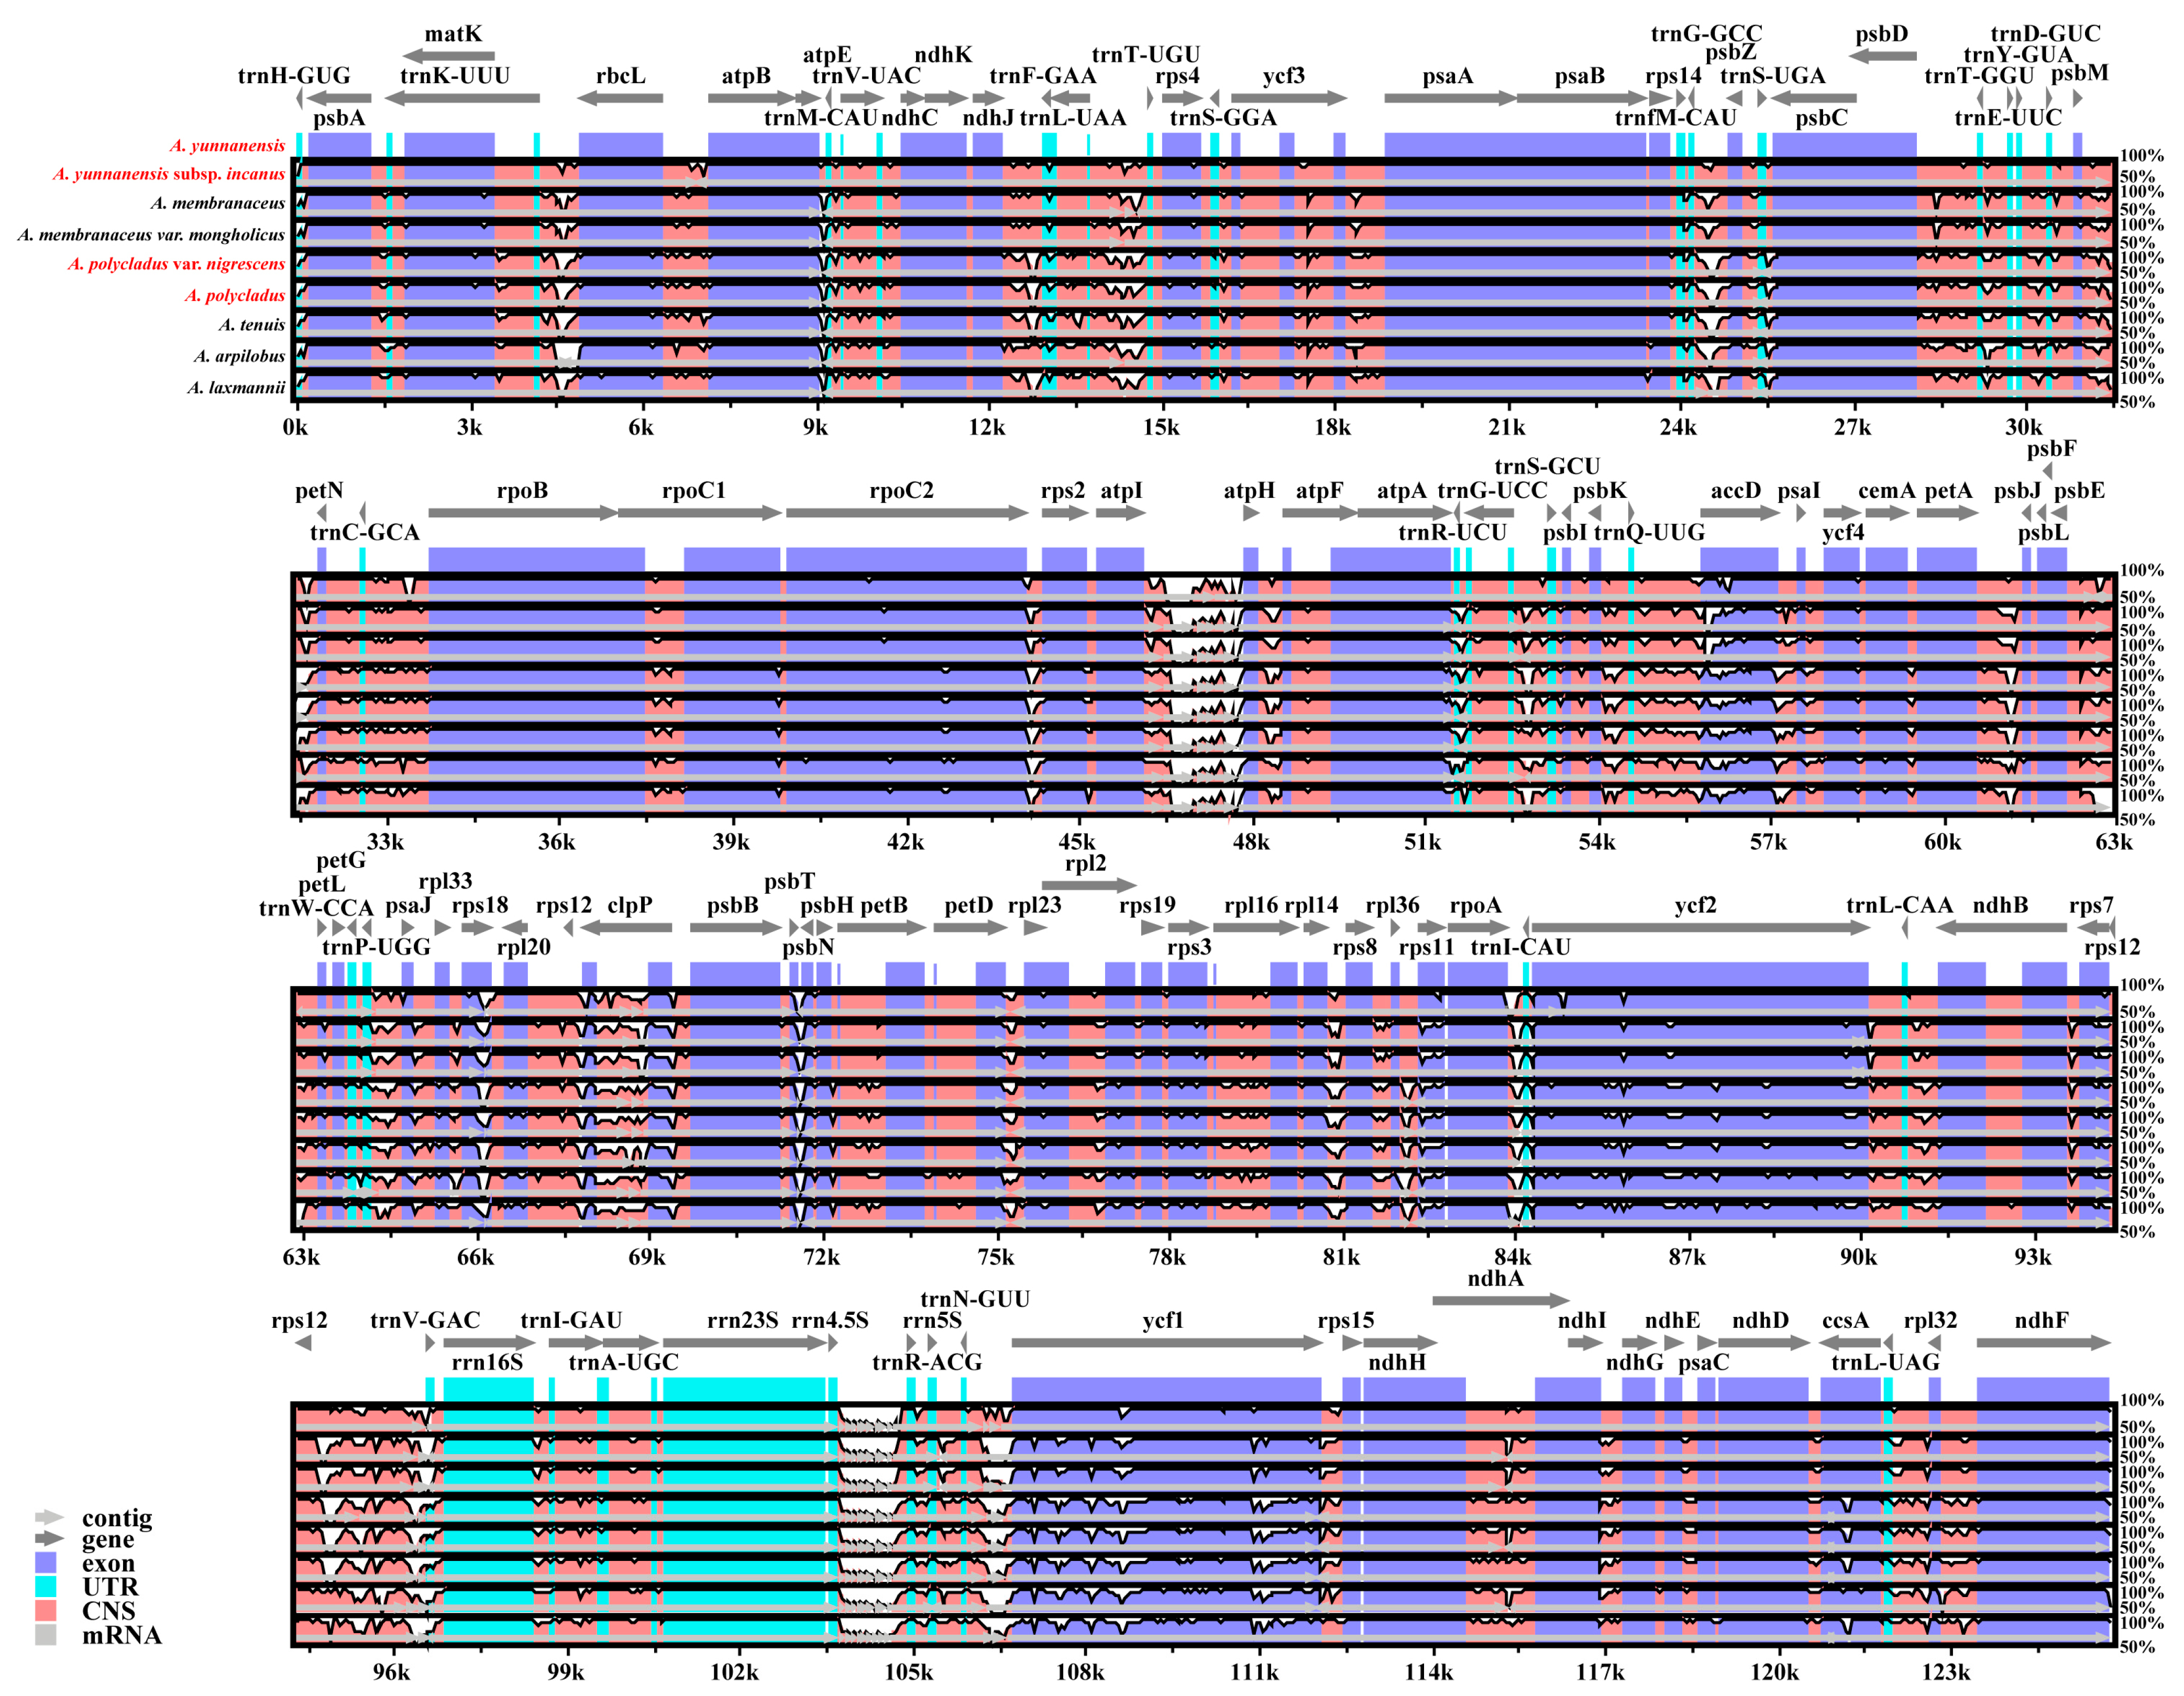
To elucidate conserved and divergent characteristics within Astragalus species, we conducted comparative analyses of plastid sequences from four newly sequenced and five previously reported Astragalus taxa, using mVISTA with A. yunnanensis as the reference genome. The results demonstrated high similarity among all nine chloroplast genomes, while revealing sequence divergence primarily in intergenic spacer (IGS) regions, including trnK-UUU-rbcL, rbcL-atpB, ndhJ-trnF-GAA, trnL-UAA-trnT-UGU, ycf3-psaA, trnG-GCC-psbZ, trnS-UGA-psbC, psbD-trnT-GGU, atpI-atpH, petA-psbJ, psbE-trnW-CCA, rpl14-rps8, rpl36-rps11, rps12-trnV-GAC, trnN-GUU-ycf1 and rpl32-ndhF (Figure 5). Protein-coding genes exhibited strong conservation, with notable exceptions in rps4, ycf3, rpoC1, accD, rps18, clpP, rpl16, ycf2 and ycf1. Comparative analysis further revealed significantly higher sequence conservation in coding regions relative to non-coding regions.

3.5. Nucleic Acid Polymorphism Analysis

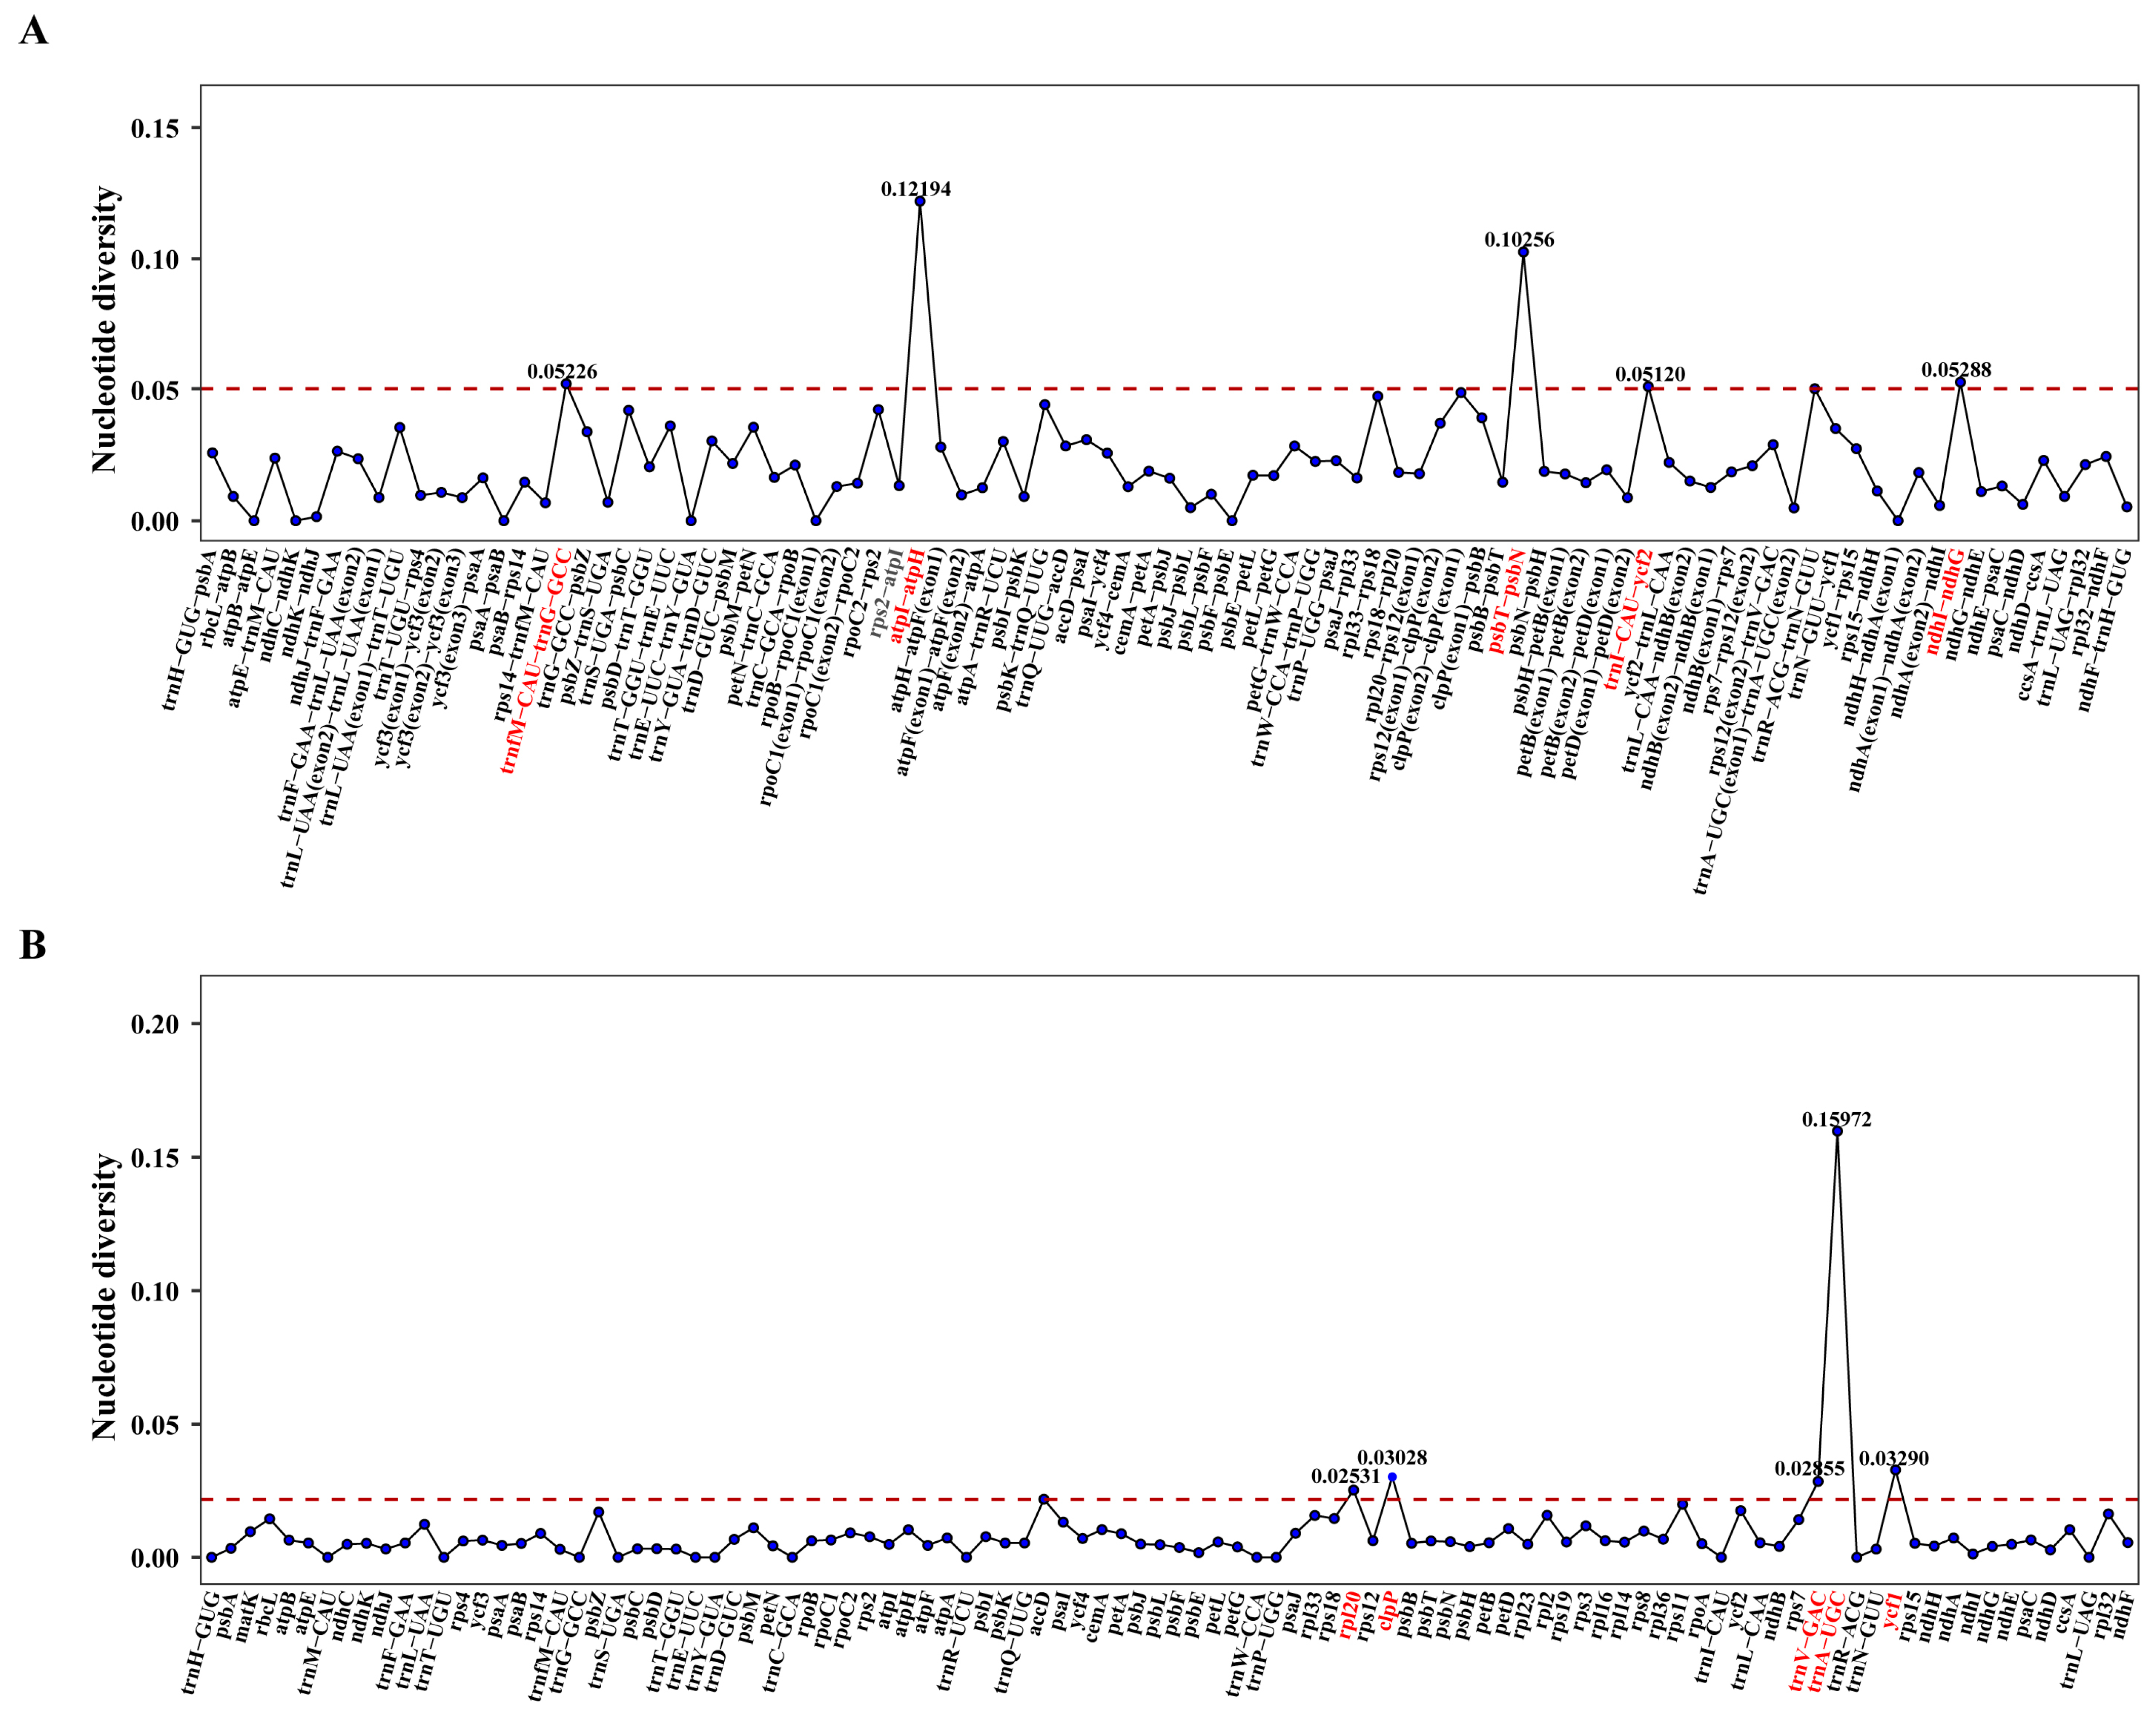
To assess sequence divergence patterns, we performed nucleotide diversity (Pi) analysis on both coding and intergenic regions across the nine Astragalus chloroplast genomes using DnaSP v6 software. The calculated Pi values ranged from 0.00000 to 0.15972, with a mean value of 0.01518 (Supplementary Table S7). The most variable intergenic regions were identified as trnfM-CAU-trnG-GCC (Pi = 0.05226), atpI-atpH (0.12194), psbT-psbN (0.10256), trnI-CAU-ycf2 (0.05120), and ndhI-ndhG (0.05288), while the most polymorphic coding regions included rpl20 (0.02531), clpP (0.03028), trnV-GAC (0.02855), trnA-UGC (0.15972), and ycf1 (0.03290) (Figure 6). These highly variable regions represent potential molecular markers for Astragalus species identification.

3.6. Selective Pressure Analysis

Using Astragalus yunnanensis chloroplast genome as the reference, we calculated the Ka/Ks ratios for 76 PCGs across eight Astragalus species (Figure 7). The analysis revealed that most genes exhibited Ka/Ks ratios < 1, indicating strong purifying selection (Supplementary Table S8). Notably, rps11 and ycf1 demonstrated Ka/Ks > 1 across all examined species, while nine additional genes (cemA, ndhB, rpl20, rpoA, rps18, rps2, rps3, rps7 and ycf2) showed Ka/Ks ratios > 1 in specific Astragalus lineages, providing evidence for positive selection acting on these genes during species diversification. The observed interspecific variation in Ka/Ks ratios among these eleven genes suggests their potential roles in adaptive evolution within the genus.

3.7. Phylogenetic Relationship Analysis

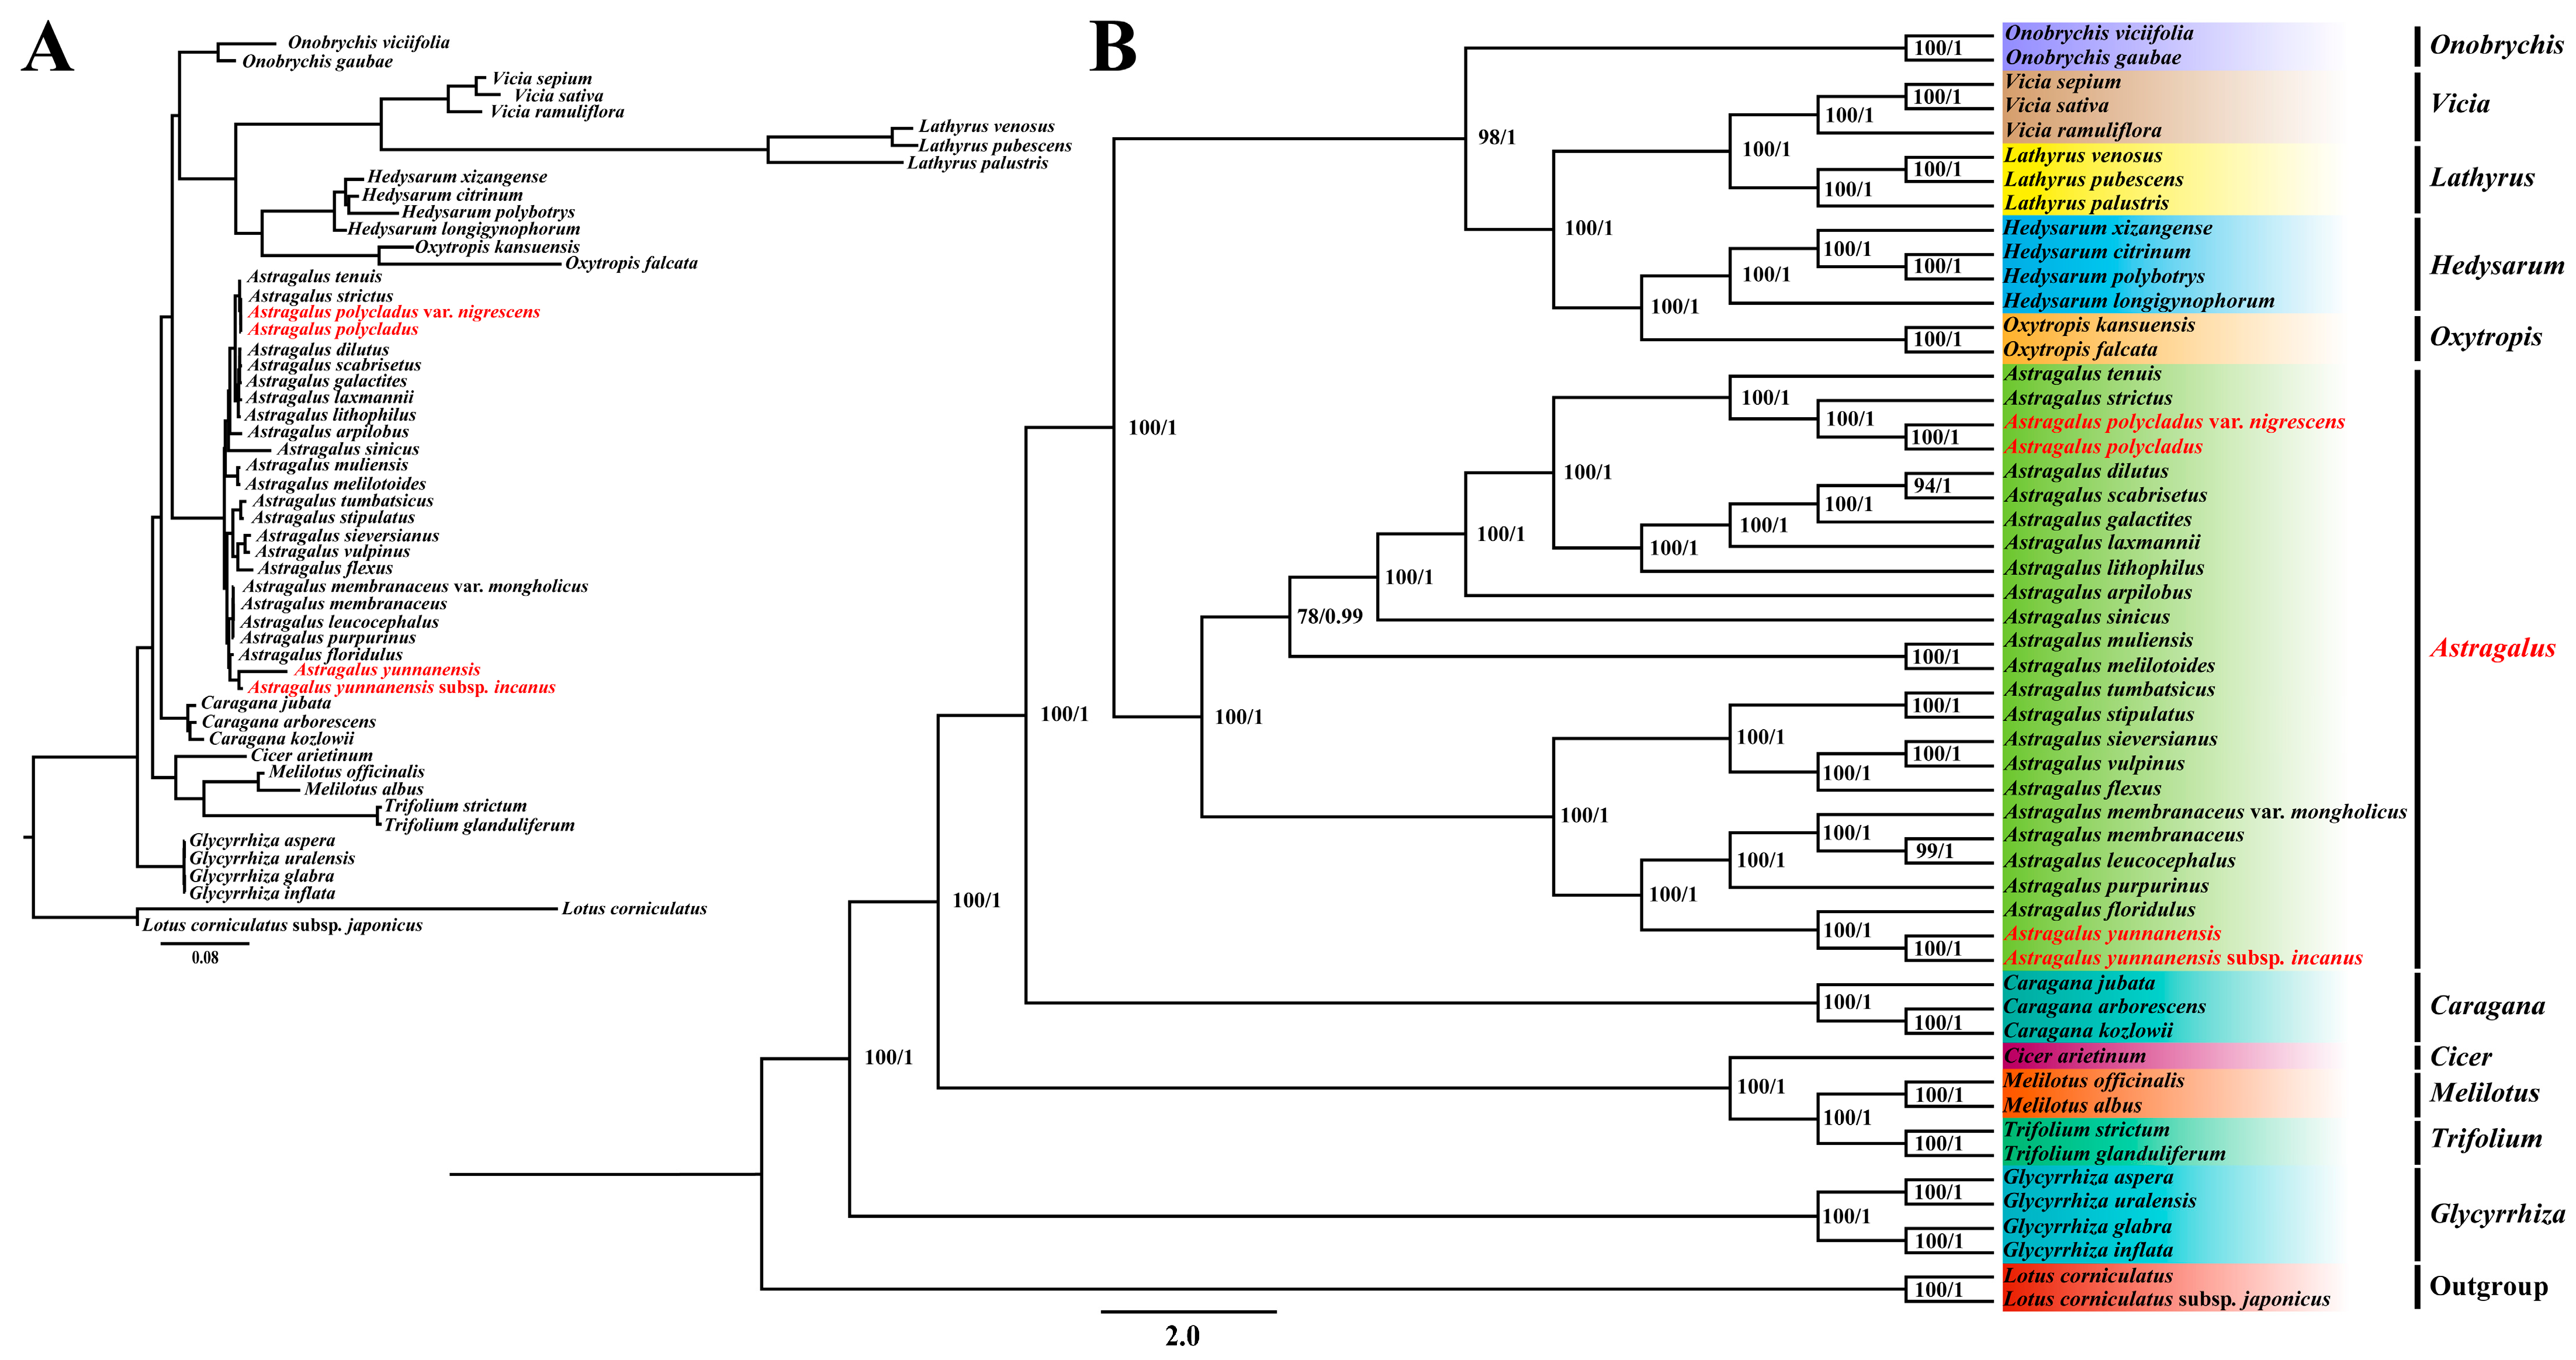
To elucidate the evolutionary relationships within Astragalus and related Papilionoideae taxa, we performed comprehensive phylogenetic analyses encompassing 53 species (Supplementary Table S9). Both maximum likelihood (ML) and Bayesian inference (BI) analyses yielded identical tree topologies, presented here as a single consensus tree (Figure 8A,B). The phylogenetic reconstruction revealed five major clades: (1) Onobrychis, Vicia, Lathyrus, Hedysarum, and Oxytropis; (2) Cicer, Melilotus, and Trifolium; (3) Astragalus; (4) Caragana; and (5) Glycyrrhiza. Notably, the newly sequenced A. yunnanensis showed close affinity with A. yunnanensis subsp. incanus, and A. polycladus clustered with A. polycladus var. nigrescens, demonstrating tight phylogenetic relationships among species, subspecies, and varieties within the genus.

4. Discussion

4.1. Chloroplast Genome Structure

In this study, we characterized the cp genomes of four Astragalus species and conducted comparative analyses with five previously reported congeners. Distinct from most angiosperms, both the newly sequenced and previously reported Astragalus plastomes exhibit a notable absence of IRs, resulting in ambiguous boundaries between the LSCs and SSCs. Notably, the cp genomes of the four Astragalus species were found to lack infA, rps16, and rpl22 genes, along with the first intron of the clpP gene, which is consistent with previous reports in other congeneric species including A. membranaceus, A. membranaceus var. mongholicus, A. iranicus and A. melilotoides [55,56,57]. Among these missing elements, infA represents an exceptionally unstable chloroplast gene in flowering plants [24], rps16 encodes a cruciform DNA-binding protein [58], and rpl22 produces ribosomal protein CL22 [59]. Their absence likely reflects either functional transfer to the nucleus or replacement by nuclear genes of prokaryotic/eukaryotic origin, as documented in Glycine max (L.) Merr. (nuclear relocation of infA) [24] and Medicago sativa L. (mitochondrion-derived nuclear rps16 substitution) [60]. These observations suggest potential nuclear translocation of infA, rps16, and rpl22 in these Astragalus species. However, given the current scarcity of Astragalus chloroplast genome data, extensive experimental validation remains imperative to confirm these evolutionary inferences.

4.2. Characteristics of Codon Usage and Repetitive Sequences

Codon usage bias serves as a valuable indicator for investigating evolutionary history, predicting expression levels, and understanding molecular-level evolutionary processes acting on genomes [61,62]. Our analyses revealed that Astragalus species, like most plants, predominantly employ A/U-ending codons (RSCU > 1), with the exception of UUG [63]. This translational preference for A/U at the third codon position likely reflects the combined effects of natural selection and mutational bias during chloroplast genome evolution [64]. cp genomes are rich in SSRs, LRSs, and highly divergent regions—critical genetic markers closely associated with species origin and diversification [65]. The examined Astragalus plastomes contained 35–335 long repeats encompassing all four types (forward, palindromic, reverse, and complementary), though forward (F) and palindromic (P) repeats substantially outnumbered reverse (R) and complementary (C) types. SSRs numbered 242–265 per genome, with mononucleotide repeats being most abundant (56.98–58.68% of total SSRs), while penta- and hexa-nucleotide motifs were exceptionally rare. Notably, most SSRs exhibited AT-rich composition with minimal GC content, consistent with patterns observed in other Fabaceae species [56,57,66]. These SSR repositories provide valuable foundations for developing genetic markers applicable to species identification, phylogenetic reconstruction and ecological studies in Astragalus.

4.3. Comparative Genomic Analysis and Nucleotide Diversity

Plastid genomes harbor abundant nucleotide polymorphisms that serve as valuable DNA barcodes for elucidating interspecific and intergeneric relationships [67,68]. Our analyses identified 10 hypervariable regions with significantly elevated divergence values, including 5 intergenic spacers (trnfM-CAU-trnG-GCC, atpI-atpH, psbT-psbN, trnI-CAU-ycf2 and ndhI-ndhG) and 5 coding regions (rpl20, clpP, trnV-GAC, trnA-UGC and ycf1). These highly polymorphic loci represent promising candidate DNA barcodes for phylogenetic reconstruction, species identification, and population genetic studies in Astragalus. Furthermore, mVISTA-based divergence analysis revealed substantially greater sequence variation in non-coding regions compared to coding sequences, suggesting that intergenic spacers are exceptionally well-suited for the development of molecular markers within this genus.

4.4. Analysis of Selection Pressure

The Ka and Ks nucleotide substitution patterns serve as crucial indicators of gene evolution [69]. Selection pressure on genes is reflected by the Ka/Ks ratio, where values < 1, =1, and >1 signify purifying selection, neutral evolution, and positive selection, respectively, with most PCGs typically undergoing purifying selection [70,71]. Among the 76 PCGs analyzed, only 11 exhibited Ka/Ks ratios > 1, indicating positive selection and rapid evolutionary adaptation. Notably, rps11 and ycf1 demonstrated Ka/Ks > 1 across all examined Astragalus species. The rps11 gene, encoding a component of the 30S ribosomal subunit involved in chloroplast protein translation, may undergo positive selection to modulate translation rates in response to environmental constraints [72]. As one of the largest and most conserved chloroplast genes, ycf1 likely stabilizes photosynthetic complexes, with its selective patterns potentially enhancing photosynthetic efficiency under low-light or hypoxic conditions [73]. The positive selection observed in these genes suggests their critical roles in regulating plastid gene expression and environmental adaptation.

4.5. Phylogenetic Relationships of IR-Lacking Clades

Due to its simple structure and maternal inheritance pattern, the chloroplast genome has been widely employed for resolving evolutionary relationships among species [74]. Our analysis of chloroplast genomic datasets from 53 species within the IRLC revealed that Astragalus forms a well-supported monophyletic cluster divided into two major clades, thereby clarifying the phylogenetic positions of the newly sequenced Astragalus species within the genus. While previous studies identified Oxytropis and Caragana as sister groups to Astragalus [13,75], our current analysis demonstrated closer affinity between Oxytropis and Hedysarum, with Caragana forming a distinct lineage. The AstragalusOxytropisHedysarum clade showed sister relationships with LathyrusViciaOnobrychis before associating with Caragana. We posit that this topological discrepancy primarily stems from differences in sampling strategies. First, increased taxonomic sampling enhances the statistical power of phylogenetic reconstruction by providing more comprehensive genetic variation data, thereby improving the accuracy of evolutionary inference and reducing topological uncertainty [76]. Second, expanded sampling mitigates potential biases and offers a more complete perspective of genetic diversity, consequently improving tree resolution and enabling clearer differentiation of closely related species or populations [77]. Previously, A. polycladus var. nigricans was merged into A. polycladus. Phylogenetic analysis revealed a high degree of similarity in their chloroplast genome sequences (bootstrap support ≥ 95%), providing genomic evidence to support their taxonomic treatment as a single species.
The highly conserved sequences of the chloroplast genomes among the four Astragalus species at the species level reaffirm the characteristically low evolutionary rate of this genome in plants and further support a very close phylogenetic relationship among these species, subspecies, and varieties. However, in stark contrast, A. yunnanensis and A. yunnanensis subsp. incanus exhibit significant morphological differentiation in leaf shape, leaf indumentum, and stem color. This paradox of “molecular conservation” versus “phenotypic divergence” strongly suggests that the nuclear genome has evolved at a much faster rate than the chloroplast genome [78,79], and the observed morphological differences are likely the result of adaptive evolution to different habitats or selective pressures [80].
The observed morphological divergence may originate from distinct regulatory pathways in the nuclear genome: the formation and variation in leaflet trichomes are primarily associated with the coordinated regulation of plant hormone signaling (e.g., GAs and CTKs) and specific transcription factors (e.g., MYB, bHLH). This conserved network may have been specifically modified in the genus Astragalus in response to adaptation to different habitats [81,82,83]. In contrast, stem color variation involves chlorophyll and anthocyanin metabolic pathways, with the functions of related genes (e.g., APRR2) and regulatory factors (e.g., GLKs, MYB) having been confirmed in multiple plant species [84,85]. These findings support an integrative hypothesis: natural selection may independently shape nuclear genes controlling trichome development and pigmentation, thereby facilitating the coordinated evolution of multiple traits and adaptive divergence. Therefore, future studies should focus on comparative genomic analyses of the nuclear genome, aiming to identify the key genetic loci underlying these critical phenotypic traits.

5. Conclusions

In this study, we sequenced and assembled the chloroplast genomes of four Astragalus species, confirming their classification within the IRLC through comparative analysis with five previously published plastomes. Our comprehensive molecular characterization encompassed codon usage patterns, repeat sequence distribution, hotspot region identification, selection pressure analysis, and phylogenomic assessment. We identified ten highly variable loci (5 intergenic: trnfM-CAU-trnG-GCC, atpI-atpH, psbT-psbN, trnI-CAU-ycf2, ndhI-ndhG; 5 coding: rpl20, clpP, trnV-GAC, trnA-UGC, ycf1) that represent promising molecular markers for species identification and phylogenetic studies, pending further validation. Positive selection signals were detected in 11 genes functionally associated with photosynthesis and related physiological processes, suggesting adaptive evolution to diverse environmental conditions in Astragalus. The reconstructed phylogenetic tree establishes a robust framework for species delineation, genetic diversity assessment, and evolutionary studies within the genus. These remarkable findings not only substantially expand the genomic resources available for Astragalus but also offer invaluable references for phylogenetic reconstruction and conservation initiatives. The study lays a substantial foundation for future evolutionary analyses, taxonomic revisions, and investigations of genetic diversity across broader IRLC lineages.

Supplementary Materials

The following supporting information can be downloaded at: https://www.mdpi.com/article/10.3390/cimb47120978/s1.

Author Contributions

Conceptualization, B.J. and Y.-Z.Z.; methodology, H.-T.M. and Q.-Y.C.; software, H.-T.M. and J.-H.R.; formal analysis, H.-T.M.; investigation, Q.-Y.C.; resources, K.-L.W.; data curation, H.-T.M.; writing—original draft preparation, H.-T.M.; writing—review and editing, Y.-Z.Z.; visualization, H.-T.M.; supervision, J.-H.R.; funding acquisition, Y.-Z.Z. and K.-L.W. All authors have read and agreed to the published version of the manuscript.

Funding

This work was supported by the National Natural Science Foundation of China (Grant Nos. 32300181 and 82360708), the Natural Science Foundation of Yunnan Province (Grant No. 202401CF070015), the Expert Workstation of Jiang Yong Yunnan Province (Grant No. 202305AF150048), and the project of Yunnan Key Laboratory of Screening and Research on Anti-pathogenic Plant Resources from Western Yunnan (Grant No. 202305AG340015).

Institutional Review Board Statement

Not applicable.

Informed Consent Statement

Not applicable.

Data Availability Statement

The data presented in this study are openly available in GenBank (NCBI, https://www.ncbi.nlm.nih.gov/, accessed on 27 October 2025) under the accession number PV156652.1 (Astragalus yunnanensis), PV156653.1 (A. yunnanensis subsp. incanus), PV910878.1 (A. polycladus), PV910879.1 (A. polycladus var. nigrescens). The associated BioProject, SRA, and BioSample numbers are PRJNA1285615, SRR34972813 (A. yunnanensis), SRR35000060 (A. yunnanensis subsp. incanus), SRR35022202 (A. polycladus), SRR35152301 (A. polycladus var. nigrescens) and SAMN49770410 (A. yunnanensis), SAMN49770411 (A. yunnanensis subsp. incanus), SAMN49770412 (A. polycladus), SAMN49770413 (A. polycladus var. nigrescens), respectively.

Acknowledgments

Thank all those who have helped us.

Conflicts of Interest

The authors declare no conflicts of interest.

Abbreviations

The following abbreviations are used in this manuscript:
IRsInverted repeat regions
LSCLarge single-copy region
SSCSmall single-copy region
SSRsSimple sequence repeats
IRLCInverted repeat lacking clade
PCGsProtein-coding genes
IGSIntergenic spacer region
KaNon-synonymous
KsSynonymous
MLMaximum Likelihood
BIBayesian Inference

References

  1. Li, X.X.; Qu, L.; Dong, Y.Z.; Han, L.F.; Liu, E.W.; Fang, S.M.; Zhang, Y.; Wang, T. A Review of Recent Research Progress on the Astragalus Genus. Molecules 2014, 19, 18850–18880. [Google Scholar] [CrossRef]
  2. Bagheri, A.; Maassoumi, A.A.; Rahiminejad, M.R.; Brassac, J.; Blattner, F.R. Molecular Phylogeny and Divergence Times of Astragalus Section Hymenostegis: An Analysis of a Rapidly Diversifying Species Group in Fabaceae. Sci. Rep. 2017, 7, 14033. [Google Scholar] [CrossRef]
  3. Xu, L.R.; Podlech, D. Astragalus L. In Flora of China: Fabaceae; Miss. Bot. Gard.: St. Louis, MO, USA; Science Press: Beijing, China, 2010; Volume 10, pp. 328–453. [Google Scholar]
  4. Wojciechowski, M.F.; Sanderson, M.J.; Hu, J.M. Evidence on the Monophyly of Astragalus (Fabaceae) and Its Major Subgroups Based on Nuclear Ribosomal DNA ITS and Chloroplast DNA trnL Intron Dat. Syst. Bot. 1999, 24, 409–437. [Google Scholar] [CrossRef]
  5. Maassoumi, A.A. A Checklist of Astragalus in the World: New Grouping, New Changes, and Additional Species with Augmented Data; Research Institute of Forests and Rangelands: Tehran, Iran, 2022; pp. 1–563. [Google Scholar]
  6. Lin, L.Z.; He, X.G.; Lindenmaier, M.; Nolan, G.; Yang, J.; Cleary, M.; Qiu, S.X.; Cordell, G.A. Liquid Chromatography-Electrospray Ionization Mass Spectrometry Study of the Flavonoids of the Roots of Astragalus mongholicus and A. membranaceus. J. Chromatogr. A 2000, 876, 87–95. [Google Scholar] [CrossRef] [PubMed]
  7. Fu, J.; Wang, Z.H.; Huang, L.F.; Zheng, S.H.; Wang, D.M.; Chen, S.L.; Zhang, H.T.; Yang, S.H. Review of the Botanical Characteristics, Phytochemistry, and Pharmacology of Astragalus membranaceus (Huangqi). Phytother. Res. 2014, 28, 1275–1283. [Google Scholar] [CrossRef] [PubMed]
  8. Guo, Z.Z.; Lou, Y.M.; Kong, M.Y.; Luo, Q.; Liu, Z.Q.; Wu, J.J. A Systematic Review of Phytochemistry, Pharmacology and Pharmacokinetics on Astragali Radix: Implications for Astragali Radix as a Personalized Medicine. Int. J. Mol. Sci. 2019, 20, 1463. [Google Scholar] [CrossRef]
  9. Auyeung, K.K.; Han, Q.B.; Ko, J.K. Astragalus membranaceus: A Review of Its Protection Against Inflammation and Gastrointestinal Cancers. Am. J. Chin. Med. 2016, 44, 1–22. [Google Scholar] [CrossRef]
  10. Durazzo, A.; Nazhand, A.; Lucarini, M.; Amelia, M.S.; Selma, B.S.; Fabrizia, G.; Patricia, S.; Massimo, Z.; Eliana, B.S.; Antonello, S. Astragalus (Astragalus membranaceus Bunge): Botanical, Geographical, and Historical Aspects to Pharmaceutical Components and Beneficial Role. Rend. Fis. Acc. Lincei 2021, 32, 625–642. [Google Scholar] [CrossRef]
  11. Sheik, A.; Kim, K.; Varaprasad, G.L.; Lee, H.; Kim, S.; Kim, E.; Shin, J.Y.; Oh, S.Y.; Huh, Y.S. The Anti-Cancerous Activity of Adaptogenic Herb Astragalus membranaceus. Phytomedicine 2021, 91, 153698. [Google Scholar] [CrossRef]
  12. Zarre, S.; Azani, N. Perspectives in Taxonomy and Phylogeny of the Genus Astragalus (Fabaceae): A Review. Prog. Biol. Sci. 2013, 3. [Google Scholar]
  13. Osaloo, S.; Maassoumi, A.; Murakami, N. Molecular Systematics of the Genus Astragalus L. (Fabaceae): Phylogenetic Analyses of Nuclear Ribosomal DNA Internal Transcribed Spacers and Chloroplast Gene ndhF Sequences. Plant Syst. Evol. 2003, 242, 1–32. [Google Scholar] [CrossRef]
  14. Lin, C.P.; Huang, J.P.; Wu, C.S.; Hsu, C.Y.; Chaw, S.M. Comparative Chloroplast Genomics Reveals the Evolution of Pinaceae Genera and Subfamilies. Genome Biol. Evol. 2010, 2, 504–517. [Google Scholar] [CrossRef]
  15. Zha, X.; Wang, X.Y.; Li, J.R.; Gao, F.; Zhou, Y.J. Complete Chloroplast Genome of Sophora alopecuroides (Papilionoideae): Molecular Structures, Comparative Genome Analysis and Phylogenetic Analysis. J. Genet. 2020, 99, 13. [Google Scholar] [CrossRef] [PubMed]
  16. Qiao, J.W.; Cai, M.X.; Yan, G.X.; Wang, N.; Li, F.; Chen, B.Y.; Gao, G.Z.; Xu, K.; Li, J.; Wu, X.M. High-Throughput Multiplex cpDNA Resequencing Clarifies the Genetic Diversity and Genetic Relationships among Brassica napus, Brassica rapa and Brassica oleracea. Plant Biotechnol. J. 2016, 14, 409–418. [Google Scholar] [CrossRef]
  17. Compton, J.A.; Schrire, B.D.; Könyves, K.; Forest, F.; Malakasi, P.; Mattapha, S.; Sirichamorn, Y. The Callerya Group Redefined and Tribe Wisterieae (Fabaceae) Emended Based on Morphology and Data from Nuclear and Chloroplast DNA Sequences. PhytoKeys 2019, 125, 1–112. [Google Scholar] [CrossRef]
  18. Duan, L.; Li, S.J.; Su, C.; Sirichamorn, Y.; Han, L.N.; Ye, W.; Lôc, P.K.; Wen, J.; Compton, J.A.; Schrire, B.; et al. Phylogenomic Framework of the IRLC Legumes (Leguminosae Subfamily Papilionoideae) and Intercontinental Biogeography of Tribe Wisterieae. Mol. Phylogenet. Evol. 2021, 163, 107235. [Google Scholar] [CrossRef]
  19. Palmer, J.D.; Thompson, W.F. Chloroplast DNA Rearrangements Are More Frequent When a Large Inverted Repeat Sequence Is Lost. Cell 1982, 29, 537–550. [Google Scholar] [CrossRef] [PubMed]
  20. Lavin, M.; Doyle, J.J.; Palmer, J.D. Evolutionary Significance of the Loss of the Chloroplast-DNA Inverted Repeat in the Leguminosae Subfamily Papilionoideae. Evolution 1990, 44, 390–402. [Google Scholar] [CrossRef]
  21. Jansen, R.K.; Wojciechowski, M.F.; Sanniyasi, E.; Lee, S.B.; Daniell, H. Complete Plastid Genome Sequence of the Chickpea (Cicer arietinum) and the Phylogenetic Distribution of rps12 and clpP Intron Losses among Legumes (Leguminosae). Mol. Phylogenet. Evol. 2008, 48, 1204–1217. [Google Scholar] [CrossRef]
  22. Wojciechowski, M.F.; Lavin, M.; Sanderson, M.J. A Phylogeny of Legumes (Leguminosae) Based on Analysis of the Plastid matK Gene Resolves Many Well-Supported Subclades within the Family. Am. J. Bot. 2004, 91, 1846–1862. [Google Scholar] [CrossRef] [PubMed]
  23. Doyle, J.J.; Doyle, J.L.; Ballenger, J.A.; Palmer, J.D. The Distribution and Phylogenetic Significance of a 50-Kb Chloroplast DNA Inversion in the Flowering Plant Family Leguminosae. Mol. Phylogenet. Evol. 1996, 5, 429–438. [Google Scholar] [CrossRef]
  24. Millen, R.S.; Olmstead, R.G.; Adams, K.L.; Palmer, J.D.; Lao, N.T.; Heggie, L.; Kavanagh, T.A.; Hibberd, J.M.; Gray, J.C.; Morden, C.W.; et al. Many Parallel Losses of infA from Chloroplast DNA during Angiosperm Evolution with Multiple Independent Transfers to the Nucleus. Plant Cell 2001, 13, 645–658. [Google Scholar] [CrossRef]
  25. Doyle, J.J. DNA Data and Legume Phylogeny: A Progress Report. In Phylogeny; Crisp, M.D., Ed.; Royal Botanic Gardens: London, UK, 1995; pp. 11–30. [Google Scholar]
  26. Doyle, J.J.; Doyle, J.L.; Palmer, J.D. Multiple Independent Losses of Two Genes and One Intron from Legume Chloroplast Genomes. Syst. Bot. 1995, 20, 272–294. [Google Scholar] [CrossRef]
  27. Wojciechowski, M.F.; Sanderson, M.J.; Baldwin, B.G.; Donoghue, M.J. Monophyly of Aneuploid Astragalus (Fabaceae): Evidence from Nuclear Ribosomal DNA Internal Transcribed Spacer Sequences. Am. J. Bot. 1993, 80, 711–722, Erratum in Am. J. Bot. 1993, 80, 1099. [Google Scholar] [CrossRef]
  28. Yang, S.P.; Ma, J.H. Progress in Molecular Pharmacognosy Research on Astragalus. Tradit. Med. Asia-Pac. 2024, 20, 244–251. [Google Scholar]
  29. Pahlich, E.; Gerlitz, C. A Rapid DNA Isolation Procedure for Small Quantities of Fresh Leaf Tissue Semantic Scholar. Phytochemistry 1980, 19, 11–13. [Google Scholar] [CrossRef]
  30. Chen, S.F. Ultrafast One-Pass FASTQ Data Preprocessing, Quality Control, and Deduplication Using Fastp. Imeta 2023, 2, e107. [Google Scholar] [CrossRef] [PubMed]
  31. Li, H.; Handsaker, B.; Wysoker, A.; Fennell, T.; Ruan, J.; Homer, N.; Marth, G.; Abecasis, G.; Durbin, R. 1000 Genome Project Data Processing Subgroup The Sequence Alignment/Map Format and SAMtools. Bioinformatics 2009, 25, 2078–2079. [Google Scholar] [CrossRef]
  32. Jin, J.J.; Yu, W.B.; Yang, J.B.; Song, Y.; dePamphilis, C.W.; Yi, T.S.; Li, D.Z. GetOrganelle: A Fast and Versatile Toolkit for Accurate de Novo Assembly of Organelle Genomes. Genome Biol. 2020, 21, 241. [Google Scholar] [CrossRef]
  33. Shi, L.C.; Chen, H.M.; Jiang, M.; Wang, L.Q.; Wu, X.; Huang, L.F.; Liu, C. CPGAVAS2, an Integrated Plastome Sequence Annotator and Analyzer. Nucleic Acids Res. 2019, 47, W65–W73. [Google Scholar] [CrossRef]
  34. Greiner, S.; Lehwark, P.; Ralph, B. OrganellarGenomeDRAW (OGDRAW) Version 1.3.1: Expanded Toolkit for the Graphical Visualization of Organellar Genomes. Nucleic Acids Res. 2019, 47, W59–W64. [Google Scholar] [CrossRef] [PubMed]
  35. Lowe, T.M.; Eddy, S.R. tRNAscan-SE: A Program for Improved Detection of Transfer RNA Genes in Genomic Sequence. Nucleic Acids Res. 1997, 25, 955–964. [Google Scholar] [CrossRef]
  36. Chen, Y.; Ye, W.; Zhang, Y.; Xu, Y. High Speed BLASTN: An Accelerated MegaBLAST Search Tool. Nucleic Acids Res. 2015, 43, 7762–7768. [Google Scholar] [CrossRef]
  37. Liu, S.Y.; Ni, Y.; Li, J.L.; Zhang, X.Y.; Yang, H.Y.; Chen, H.M.; Liu, C. CPGView: A Package for Visualizing Detailed Chloroplast Genome Structures. Mol. Ecol. Resour. 2023, 23, 694–704. [Google Scholar] [CrossRef]
  38. Lewis, S.E.; Searle, S.M.J.; Harris, N.; Gibson, M.; Lyer, V.; Richter, J.; Wiel, C.; Bayraktaroglu, L.; Birney, E.; Crosby, M.A.; et al. Apollo: A Sequence Annotation Editor. Genome Biol. 2002, 3, RESEARCH0082. [Google Scholar] [CrossRef]
  39. Sharp, P.M.; Li, W.H. An Evolutionary Perspective on Synonymous Codon Usage in Unicellular Organisms. J. Mol. Evol. 1986, 24, 28–38. [Google Scholar] [CrossRef] [PubMed]
  40. Langmead, B.; Trapnell, C.; Pop, M.; Salzberg, S.L. Ultrafast and Memory-Efficient Alignment of Short DNA Sequences to the Human Genome. Genome Biol. 2009, 10, R25. [Google Scholar] [CrossRef] [PubMed]
  41. Kurtz, S.; Choudhuri, J.V.; Ohlebusch, E.; Schleiermacher, C.; Stoye, J.; Giegerich, R. REPuter: The Manifold Applications of Repeat Analysis on a Genomic Scale. Nucleic Acids Res. 2001, 29, 4633–4642. [Google Scholar] [CrossRef]
  42. Benson, G. Tandem Repeats Finder: A Program to Analyze DNA Sequences. Nucleic Acids Res. 1999, 27, 573–580. [Google Scholar] [CrossRef]
  43. Faircloth, B.C. Msatcommander: Detection of Microsatellite Repeat Arrays and Automated, Locus-Specific Primer Design. Mol. Ecol. Resour. 2008, 8, 92–94. [Google Scholar] [CrossRef]
  44. Katoh, K.; Standley, D.M. MAFFT Multiple Sequence Alignment Software Version 7: Improvements in Performance and Usability. Mol. Biol. Evol. 2013, 30, 772–780. [Google Scholar] [CrossRef]
  45. Rozas, J.; Ferrer-Mata, A.; Sánchez-DelBarrio, J.C.; Guirao-Rico, S.; Librado, P.; Ramos-Onsins, S.E.; Sánchez-Gracia, A. DnaSP 6: DNA Sequence Polymorphism Analysis of Large Data Sets. Mol. Biol. Evol. 2017, 34, 3299–3302. [Google Scholar] [CrossRef]
  46. Frazer, K.A.; Pachter, L.; Poliakov, A.; Rubin, E.M.; Dubchak, I. VISTA: Computational Tools for Comparative Genomics. Nucleic Acids Res. 2004, 32, W273–W279. [Google Scholar] [CrossRef]
  47. Zhang, Z.; Li, J.; Zhao, X.Q.; Wang, J.; Wong, G.K.S.; Yu, J. KaKs_Calculator: Calculating Ka and Ks through Model Selection and Model Averaging. Genom. Proteom. Bioinform. 2006, 4, 259–263. [Google Scholar] [CrossRef]
  48. Capella-Gutiérrez, S.; Silla-Martínez, J.M.; Gabaldón, T. trimAl: A Tool for Automated Alignment Trimming in Large-Scale Phylogenetic Analyses. Bioinformatics 2009, 25, 1972–1973. [Google Scholar] [CrossRef] [PubMed]
  49. Kalyaanamoorthy, S.; Minh, B.Q.; Wong, T.K.F.; von Haeseler, A.; Jermiin, L.S. ModelFinder: Fast Model Selection for Accurate Phylogenetic Estimates. Nat. Methods 2017, 14, 587–589. [Google Scholar] [CrossRef] [PubMed]
  50. Zhang, D.; Gao, F.L.; Jakovlić, I.; Zou, H.; Zhang, J.; Li, W.X.; Wang, G.T. PhyloSuite: An Integrated and Scalable Desktop Platform for Streamlined Molecular Sequence Data Management and Evolutionary Phylogenetics Studies. Mol. Ecol. Resour. 2020, 20, 348–355. [Google Scholar] [CrossRef] [PubMed]
  51. Nguyen, L.T.; Schmidt, H.A.; von Haeseler, A.; Minh, B.Q. IQ-TREE: A Fast and Effective Stochastic Algorithm for Estimating Maximum-Likelihood Phylogenies. Mol. Biol. Evol. 2015, 32, 268–274. [Google Scholar] [CrossRef]
  52. Minh, B.Q.; Nguyen, M.A.T.; von Haeseler, A. Ultrafast Approximation for Phylogenetic Bootstrap. Mol. Biol. Evol. 2013, 30, 1188–1195. [Google Scholar] [CrossRef]
  53. Ronquist, F.; Teslenko, M.; van der Mark, P.; Ayres, D.L.; Darling, A.; Höhna, S.; Larget, B.; Liu, L.; Suchard, M.A.; Huelsenbeck, J.P. MrBayes 3.2: Efficient Bayesian Phylogenetic Inference and Model Choice across a Large Model Space. Syst. Biol. 2012, 61, 539–542. [Google Scholar] [CrossRef]
  54. Rambaut, A. FigTree v 1.4.4; University of Edinburgh: Edinburgh, UK, 2018. [Google Scholar]
  55. Cook, D.; Gardner, D.R.; Pfister, J.A.; Lee, S.T.; Welch, K.D.; Welsh, S.L. A Screen for Swainsonine in Select North American Astragalus Species. Chem. Biodivers. 2017, 14, e1600364. [Google Scholar] [CrossRef]
  56. Tian, C.Y.; Li, X.S.; Wu, Z.N.; Li, Z.Y.; Hou, X.Y.; Li, F.Y.H. Characterization and Comparative Analysis of Complete Chloroplast Genomes of Three Species From the Genus Astragalus (Leguminosae). Front. Genet. 2021, 12, 705482. [Google Scholar] [CrossRef]
  57. Moghaddam, M.; Wojciechowski, M.F.; Kazempour-Osaloo, S. Characterization and Comparative Analysis of the Complete Plastid Genomes of Four Astragalus Species. PLoS ONE 2023, 18, e0286083. [Google Scholar] [CrossRef] [PubMed]
  58. Bonnefoy, E. The Ribosomal S16 Protein of Escherichia Coli Displaying a DNA-Nicking Activity Binds to Cruciform DNA. Eur. J. Biochem. 1997, 247, 852–859. [Google Scholar] [CrossRef]
  59. Gantt, J.S.; Baldauf, S.L.; Calie, P.J.; Weeden, N.F.; Palmer, J.D. Transfer of rpl22 to the Nucleus Greatly Preceded Its Loss from the Chloroplast and Involved the Gain of an Intron. EMBO J. 1991, 10, 3073–3078. [Google Scholar] [CrossRef] [PubMed]
  60. Ueda, M.; Fujimoto, M.; Arimura, S.I.; Tsutsumi, N.; Kadowaki, K.I. Presence of a Latent Mitochondrial Targeting Signal in Gene on Mitochondrial Genome. Mol. Biol. Evol. 2008, 25, 1791–1793. [Google Scholar] [CrossRef]
  61. Jia, J.; Xue, Q. Codon Usage Biases of Transposable Elements and Host Nuclear Genes in Arabidopsis thaliana and Oryza sativa. Genom. Proteom. Bioinform. 2009, 7, 175–184. [Google Scholar] [CrossRef]
  62. Leffler, E.M.; Bullaughey, K.; Matute, D.R.; Meyer, W.K.; Ségurel, L.; Venkat, A.; Andolfatto, P.; Przeworski, M. Revisiting an Old Riddle: What Determines Genetic Diversity Levels within Species? PLoS Biol. 2012, 10, e1001388. [Google Scholar] [CrossRef]
  63. Li, C.J.; Wang, R.N.; Li, D.Z. Comparative Analysis of Plastid Genomes within the Campanulaceae and Phylogenetic Implications. PLoS ONE 2020, 15, e0233167. [Google Scholar] [CrossRef]
  64. Xu, C.; Cai, X.N.; Chen, Q.Z.; Zhou, H.X.; Cai, Y.; Ben, A. Factors Affecting Synonymous Codon Usage Bias in Chloroplast Genome of Oncidium Gower Ramsey. Evol. Bioinform. 2011, 7, 271–278. [Google Scholar] [CrossRef] [PubMed]
  65. Kapoor, M.; Mawal, P.; Sharma, V.; Gupta, R.C. Analysis of Genetic Diversity and Population Structure in Asparagus Species Using SSR Markers. J. Genet. Eng. Biotechnol. 2020, 18, 50. [Google Scholar] [CrossRef]
  66. Souza, U.J.B.d.; Nunes, R.; Targueta, C.P.; Diniz-Filho, J.A.F.; Telles, M.P.d.C. The Complete Chloroplast Genome of Stryphnodendron adstringens (Leguminosae—Caesalpinioideae): Comparative Analysis with Related Mimosoid Species. Sci. Rep. 2019, 9, 14206. [Google Scholar] [CrossRef]
  67. Li, X.; Li, Y.F.; Zang, M.Y.; Li, M.Z.; Fang, Y.M. Complete Chloroplast Genome Sequence and Phylogenetic Analysis of Quercus acutissima. Int. J. Mol. Sci. 2018, 19, 2443. [Google Scholar] [CrossRef]
  68. Xiong, Y.L.; Xiong, Y.; He, J.; Yu, Q.Q.; Zhao, J.M.; Lei, X.; Dong, Z.X.; Yang, J.; Peng, Y.; Zhang, X.Q.; et al. The Complete Chloroplast Genome of Two Important Annual Clover Species, Trifolium alexandrinum and T. resupinatum: Genome Structure, Comparative Analyses and Phylogenetic Relationships with Relatives in Leguminosae. Plants 2020, 9, 478. [Google Scholar] [CrossRef]
  69. Kimura, M. The Neutral Theory of Molecular Evolution. Sci. Am. 1979, 241, 98–100, 102, 108 passim. [Google Scholar] [CrossRef] [PubMed]
  70. Wang, D.; Zhang, S.; He, F.; Zhu, J.; Hu, S.; Yu, J. How Do Variable Substitution Rates Influence Ka and Ks Calculations? Genom. Proteom. Bioinform. 2009, 7, 116–127. [Google Scholar] [CrossRef] [PubMed]
  71. Zong, D.; Zhou, A.; Zhang, Y.; Zou, X.; Li, D.; Duan, A.; He, C. Characterization of the Complete Chloroplast Genomes of Five Populus Species from the Western Sichuan Plateau, Southwest China: Comparative and Phylogenetic Analyses. PeerJ 2019, 7, e6386. [Google Scholar] [CrossRef]
  72. Gu, X.L.; Li, L.L.; Li, S.C.; Shi, W.X.; Zhong, X.N.; Su, Y.J.; Wang, T. Adaptive Evolution and Co-Evolution of Chloroplast Genomes in Pteridaceae Species Occupying Different Habitats: Overlapping Residues Are Always Highly Mutated. BMC Plant Biol. 2023, 23, 511. [Google Scholar] [CrossRef]
  73. Wen, J.; Zhu, J.W.; Ma, X.D.; Li, H.M.; Wu, B.C.; Zhou, W.; Yang, J.X.; Song, C.F. Phylogenomics and Adaptive Evolution of Hydrophytic Umbellifers (Tribe Oenantheae, Apioideae) Revealed from Chloroplast Genomes. BMC Plant Biol. 2024, 24, 1140. [Google Scholar] [CrossRef] [PubMed]
  74. Daniell, H.; Lin, C.S.; Yu, M.; Chang, W.J. Chloroplast Genomes: Diversity, Evolution, and Applications in Genetic Engineering. Genome Biol. 2016, 17, 134. [Google Scholar] [CrossRef]
  75. Liu, L.E.; Li, H.Y.; Li, J.X.; Li, X.J.; Hu, N.; Sun, J.; Zhou, W. Chloroplast Genomes of Caragana tibetica and Caragana turkestanica: Structures and Comparative Analysis. BMC Plant Biol. 2024, 24, 254. [Google Scholar] [CrossRef]
  76. Hillis, D.M.; Bull, J.J. An Empirical Test of Bootstrapping as a Method for Assessing Confidence in Phylogenetic Analysis. Syst. Biol. 1993, 42, 182–192. [Google Scholar] [CrossRef]
  77. Nei, M.; Kumar, S. Accuracies and Statistical Tests of Phylogenetic Trees. In Molecular Evolution and Phylogenetics; Oxford University Press: Oxford, UK, 2000; pp. 162–186. [Google Scholar]
  78. Clark, J.W.; Hetherington, A.J.; Morris, J.L.; Pressel, S.; Duckett, J.G.; Puttick, M.N.; Schneider, H.; Kenrick, P.; Wellman, C.H.; Donoghue, P.C.J. Evolution of Phenotypic Disparity in the Plant Kingdom. Nat. Plants 2023, 9, 1618–1626. [Google Scholar] [CrossRef]
  79. Han, G.L.; Li, Y.X.; Yang, Z.R.; Wang, C.F.; Zhang, Y.Y.; Wang, B.S. Molecular Mechanisms of Plant Trichome Development. Front. Plant Sci. 2022, 13, 910228. [Google Scholar] [CrossRef]
  80. Wu, R.; Cun, S.; Gao, Y.Q.; Ma, R.; Zhang, L.; Lev-Yadun, S.; Sun, H.; Song, B. Distribution Patterns of Glandular Trichomes in the Flora of the Hengduan Mountains, Southwestern China. Bot. J. Linn. Soc. 2025, 207, 83–94. [Google Scholar] [CrossRef]
  81. Wang, X.J.; Shen, C.; Meng, P.H.; Tan, G.F.; Lv, L.T. Analysis and Review of Trichomes in Plants. BMC Plant Biol. 2021, 21, 70. [Google Scholar] [CrossRef]
  82. Maes, L.; Goossens, A. Hormone-Mediated Promotion of Trichome Initiation in Plants Is Conserved but Utilizes Species and Trichome-Specific Regulatory Mechanisms. Plant Signal. Behav. 2010, 5, 205–207. [Google Scholar] [CrossRef] [PubMed]
  83. Matías-Hernández, L.; Aguilar-Jaramillo, A.E.; Cigliano, R.A.; Sanseverino, W.; Pelaz, S. Flowering and Trichome Development Share Hormonal and Transcription Factor Regulation. J. Exp. Bot. 2016, 67, 1209–1219. [Google Scholar] [CrossRef] [PubMed]
  84. Chen, Z.; Wang, P.; Bai, W.H.; Deng, Y.; Cheng, Z.K.; Su, L.W.; Nong, L.F.; Liu, T.; Yang, W.R.; Yang, X.P.; et al. Quantitative Trait Loci Sequencing and Genetic Mapping Reveal Two Main Regulatory Genes for Stem Color in Wax Gourds. Plants 2024, 13, 1804. [Google Scholar] [CrossRef]
  85. Nong, L.F.; Wang, P.; Yang, W.R.; Liu, T.; Su, L.W.; Cheng, Z.K.; Bai, W.H.; Deng, Y.; Chen, Z.H.; Liu, Z.G. Analysis of BhAPRR2 Allele Variation, Chlorophyll Content, and Chloroplast Structure of Different Peel Colour Varieties of Wax Gourd (Benincasa hispida) and Development of Molecular Markers. Euphytica 2023, 219, 107. [Google Scholar] [CrossRef]
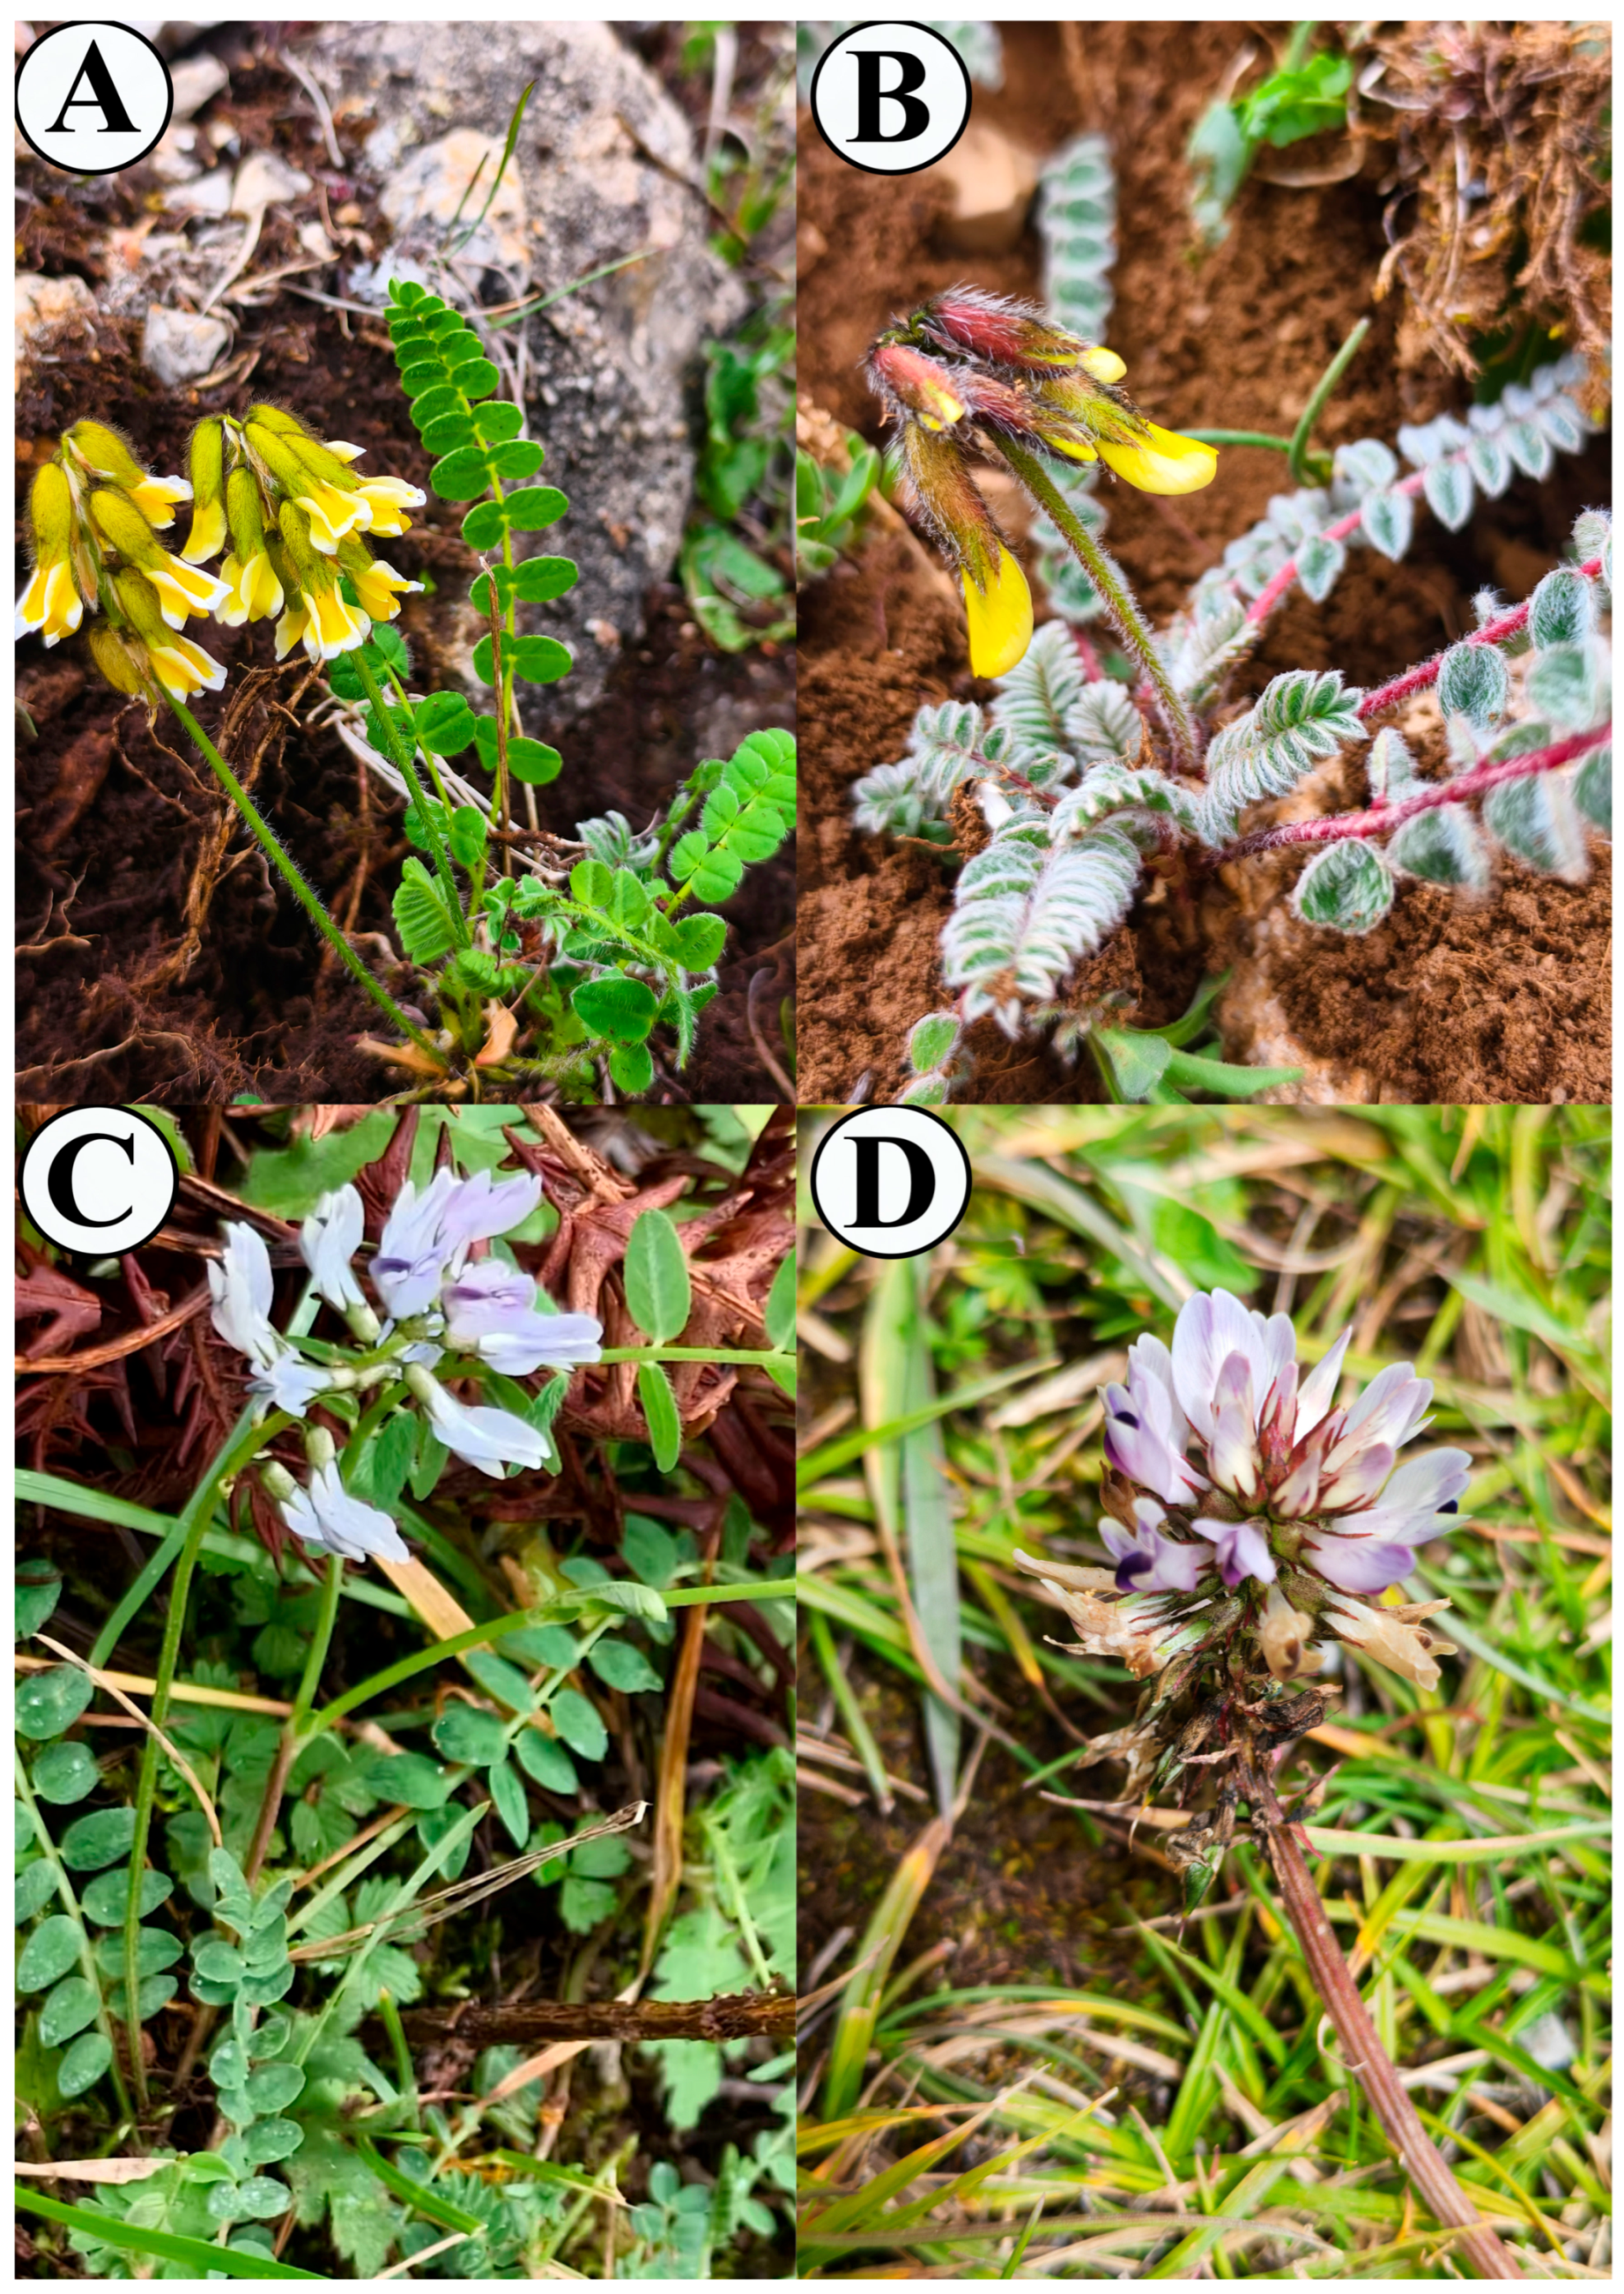
Figure 1. Plant morphology of A. yunnanensis, A. yunnanensis subsp. incanus, A. polycladus, and A. polycladus var. nigrescens (AD).
Cimb 47 00978 g001
Figure 2. Chloroplast genome maps of Astragalus with annotated genes. Genes within the circle are clockwise, while those beyond the circle are counterclockwise. Different colors indicate functional gene groups. The darker and lighter shades of gray in the inner circle represent the content of GC and AT, respectively.
Cimb 47 00978 g002
Figure 3. Codon bias analysis of 9 Astragalus species. (A) Relative Synonymous Codon Usage (RSCU) analysis. The x-axis shows the 20 standard amino acids, and the y-axis shows the corresponding RSCU values. (B) Heatmap analysis of the Relative Synonymous Codon Usage (RSCU) values for protein-coding genes. Red and blue colors indicate higher and lower RSCU values, respectively. Species labeled in red are those sequenced in this study.
Cimb 47 00978 g003
Figure 4. Analysis of repeats and SSRs in 9 complete chloroplast genomes of the Astragalus. (A) Different types of repeats in each chloroplast genome. (B) Numbers of tandem repeats more than 30 bp long in each chloroplast genome. (C) Numbers of palindromic repeats more than 30 bp long in each chloroplast genome. (D) Numbers of forward repeats more than 30 bp long in each chloroplast genome. (E) Total numbers and different types of SSRs detected in each chloroplast genome. Mono: mononucleotide, Di: dinucleotide, Tri: trinucleotides, Tetra: tetranucleotide, Penta: pentanucleotide, Hexa: hexanucleotide. The species in bold are sequenced in this study.
Cimb 47 00978 g004
Figure 5. The chloroplast genome of nine Astragalus species were compared by mVISTA. The gray arrow in the figure indicates the direction of gene translation. The x-axis represents the coordinates in the chloroplast genome; the y-axis represents the percentage between 50 and 100%; Blue indicates protein coding (exon); light green indicates untranslated region (UTR); orange indicates conserved non-coding sequences (CNSs). Species labeled in red are those sequenced in this study.
Cimb 47 00978 g005
Figure 6. Nucleotide diversity (Pi) across (A) intergenic spacer regions (IGS) and (B) gene regions in the cp genomes of nine Astragalus species. Notably, the genes highlighted in red in each panel represent those which exhibited higher Pi values.
Cimb 47 00978 g006
Figure 7. The Ka/Ks ratios of 76 PCGs from 8 Astragalus species taking A. yunnanensis as a reference.
Cimb 47 00978 g007
Figure 8. Maximum-likelihood (ML) and Bayesian inference (BI) phylogenetic tree based on the complete chloroplast genome sequence of 53 species from the Papilionaceae. (A) Phylogenetic tree with branches scaled to genetic distance. (B) Cladogram showing the topology without branch lengths. Number above nodes are support values with ML bootstrap (BS) values on the left and BI posterior probability (PP) values on the right. Species labeled in red are those sequenced in this study.
Cimb 47 00978 g008
Table 1. The basic chloroplast genome information of 9 Astragalus species.
Plastome Characteristics A. yunnanensisA. yunnanensis Subsp. incanusA. polycladusA. polycladus var. nigrescensA. membranaceusAstragalus membranaceus var. mongholicusA. tenuisA. laxmanniiA. arpilobus
GenBank accession PV156652.1PV156653.1PV910878PV910879OR528897.1OR712437.1OP723862.1NC_085710.1NC_077549.1
Protein coding genes (PCG)Length (bp)66,11165,99465,91665,91665,74565,74265,92265,92265,892
GC (%)36.5336.5436.4336.4436.5336.5236.4236.4336.36
Length (%)52.5752.5653.6553.6453.2153.353.5953.6853.55
Number767676767676767676
tRNALength (bp)226822682296229620662194230919992269
GC (%)52.5152.8252.752.751.8452.6451.4151.9852.67
Length (%)1.81.811.871.871.671.781.881.631.84
Number303030302729302630
rRNALength (bp)450745094509450945094512450945094512
GC (%)54.1454.1854.2554.2554.2254.2654.2254.254.12
Length (%)3.583.593.673.673.653.663.673.673.67
Number444444444
TotalLength (bp)125,752125,549122,868122,880123,548123,349123,012122,796123,054
Number of genes110110110110107109110106110
GC (%)34.2234.1834.1434.1534.0734.134.134.1133.97
Table 2. The chloroplast-encoded genes of the 4 Astragalus species.
Category for GeneGroup of GenesName of Genes
Gene for
photosynthesis
Subunits of NADH-dehydrogenasendhA *, ndhB *, ndhC, ndhD, ndhE, ndhF, ndhG, ndhH, ndhI, ndhJ, ndhK
Subunits of photosystem IpsaA, psaB, psaC, psaI, psaJ
Subunits of photosystem IIpsbA, psbB, psbC, psbD, psbE, psbF, psbH, psbI, psbJ, psbK, psbL, psbM, psbN, psbT, psbZ
Subunits of cytochrome b/f complexpetA, petB *, petD *, petG, petL, petN
Subunits of ATP synthaseatpA, atpB, atpE, atpF *, atpH, atpI
Large subunit of rubiscorbcL
Self-replicationSmall subunit of ribosomerps2, rps3, rps4, rps7, rps8, rps11, rps12 *, rps14, rps15, rps18, rps19
Large subunit of ribosomerpl2 *, rpl14, rpl16 *, rpl20, rpl23, rpl32, rpl33, rpl36
DNA dependent RNA polymeraserpoA, rpoB, rpoC1 *, rpoC2
tRNA genestrnA-UGC *, trnC-GCA, trnD-GUC, trnE-UUC, trnF-GAA, trnG-GCC, trnG-UCC *, trnH-GUG, trnI-CAU, trnI-GAU *, trnK-UUU *, trnL-CAA, trnL-UAA *, trnL-UAG, trnM-CAU, trnN-GUU, trnP-UGG, trnQ-UUG, trnR-ACG, trnR-UCU, trnS-GCU, trnS-GGA, trnS-UGA, trnT-GGU, trnT-UGU, trnV-GAC, trnV-UAC *, trnW-CCA, trnY-GUA, trnfM-CAU
rRNA genesrrn4.5S, rrn5S, rrn16S, rrn23S
Other genesMaturasematK
c-type cytochrom synthesis geneccsA
Envelope membrane proteincemA
ProteaseclpP *
Subunit of Acetyl-CoA-carboxylaseaccD
Genes of unknown functionConserved hypothetical chloroplast ORFycf1, ycf2, ycf3 **, ycf4
Note: *: contains one intron; **: contains two introns.
Disclaimer/Publisher’s Note: The statements, opinions and data contained in all publications are solely those of the individual author(s) and contributor(s) and not of MDPI and/or the editor(s). MDPI and/or the editor(s) disclaim responsibility for any injury to people or property resulting from any ideas, methods, instructions or products referred to in the content.