Article

Integrating Network Pharmacology and Metabolomics to Elucidate the Mechanism of Cryptotanshinone Against Platelet Aggregation

1
School of Pharmacy, Guangxi University of Chinese Medicine, Nanning 530200, China
2
Guangxi Engineering Technology Research Center of Advantage Chinese Patent Drug and Ethnic Drug Development, Guangxi University of Chinese Medicine, Nanning 530200, China
3
Guangxi Key Laboratory of Traditional Chinese Medicine Quality Standards, Guangxi Institute of Chinese Medicine & Pharmaceutical Science, Nanning 530200, China
*
Authors to whom correspondence should be addressed.
These authors contributed equally to this work.
Curr. Issues Mol. Biol. 2025, 47(11), 953; https://doi.org/10.3390/cimb47110953 (registering DOI)
Submission received: 10 October 2025 / Revised: 7 November 2025 / Accepted: 14 November 2025 / Published: 17 November 2025

Abstract

Cryptotanshinone (CTS), an antiplatelet compound from Salvia miltiorrhiza, exhibits in vitro potency comparable to aspirin. This study integrated network pharmacology and metabolomics to elucidate its underlying mechanisms. An acute blood stasis model was induced in Sprague-Dawley rats using epinephrine and ice-water immersion. Animals were assigned to seven groups. Platelet aggregation was measured turbidimetrically using arachidonic acid (AA) and adenosine diphosphate (ADP) as agonists. Core targets were predicted by network pharmacology, differential metabolites were screened, and pathways were enriched using untargeted metabolomics. Integrated analysis identified shared pathways and key targets, validated by molecular docking. AA- and ADP-induced aggregation was significantly increased in model rats versus the blank group. CTS at all doses markedly inhibited aggregation in a dose-dependent manner. Network pharmacology identified 15 core targets. Metabolomics identified 51 differential metabolites enriched in seven pathways, including glycerophospholipid and butanoate metabolism. Integrated analysis revealed five common pathways: linoleic acid metabolism, arginine biosynthesis, AA metabolism, glutathione metabolism, and drug metabolism—and four key targets (CYP3A4, NOS3, PTGS2, and GSTP1). Molecular docking showed strong binding energies (<−9 kcal/mol) between CTS and these targets. CTS inhibits platelet aggregation by regulating CYP3A4, NOS3, PTGS2, and GSTP1 and intervening in five metabolic pathways, supporting its potential as an anti-platelet agent.

1. Introduction

Platelet aggregation is the process by which activated platelets adhere via fibrinogen bridges, forming primary hemostatic plugs or pathological thrombi [1]. Dysregulation of this process drives various thrombotic events. Cardiovascular diseases (CVDs) remain the leading cause of mortality worldwide, with abnormal platelet activation and aggregation central to the pathogenesis of atherosclerosis, myocardial infarction, and ischemic stroke [2,3]. Antiplatelet agents are the cornerstones for preventing and treating these conditions, with aspirin and clopidogrel being the most widely used [4]. Despite their efficacy, both are associated with significant limitations: aspirin can induce dose-dependent gastrointestinal injury and bleeding, while clopidogrel resistance occurs due to CYP2C19 genetic polymorphism, P2Y12 receptor variations, or drug interactions, leading to reduced therapeutic efficacy and increased thrombotic risk [5,6].
In recent years, traditional Chinese medicine (TCM) has demonstrated a unique potential in antiplatelet therapy [7]. Its multi-component and multi-target mechanisms offer new insights into the development of antiplatelet agents [8]. Blood stasis, a central concept in TCM, is pathologically characterized by impaired circulation, blood stagnation, and hypercoagulability [9]. Therefore, identifying novel antiplatelet compounds from traditional medicinal plants with innovative mechanisms, high efficacy, and improved safety profiles has emerged as an important research direction and an urgent unmet need in cardiovascular pharmacology.
Salvia miltiorrhiza Bunge, a TCM herb with blood-activating and stasis-eliminating properties, is historically used to alleviate pain by unblocking meridians, clearing heart fires to relieve irritability, and cooling blood to reduce abscesses [10]. It has demonstrated remarkable clinical efficacy in cardiovascular disorders [11]. Cryptotanshinone (CTS), a liposoluble diterpenoid quinone and one of its primary active constituents, is considered a key bioactive substance responsible for these effects [12]. Recent studies have revealed that CTS exhibits broad pharmacological activities, including anti-inflammatory, antioxidant, antitumor, and cardiovascular-protective effects [13]. Accumulating evidence demonstrates that CTS strongly suppresses platelet aggregation, with in vitro activity comparable to that of aspirin, indicating its promising therapeutic potential for thrombotic disorders [14,15,16]. However, its antiplatelet mechanisms remain incompletely elucidated, thereby constraining its clinical development. Consequently, the molecular basis for CTS-mediated inhibition of platelet aggregation represents a focal point of ongoing investigation.
Elucidating the multi-component, multi-target, and multi-pathway actions of TCM poses a significant challenge, as conventional single-method approaches are often inadequate to fully capture the systemic pharmacological effects [17]. Network pharmacology addresses this challenge by constructing multidimensional “component-target-pathway” networks to predict core therapeutic targets and potential signaling pathways at the system level, providing hypotheses and directions for mechanistic studies [18,19]. Metabolomics complements this approach by providing a comprehensive analysis of global metabolic changes within an organism following drug administration, revealing altered pathways from the perspective of terminal metabolic responses [20]. The integrated application of network pharmacology and metabolomics involves a comprehensive pathway-level analysis of core targets and differential metabolites obtained from both omics approaches, achieving mutual validation and complementary enhancement [21].
This study aimed to systematically elucidate the mechanisms by which CTS inhibits platelet aggregation using an integrated approach combining network pharmacology and metabolomics. Specifically, network pharmacology was employed to predict core targets and pathways, whereas untargeted metabolomics profiled metabolic alterations in platelets following CTS treatment, identifying significantly dysregulated metabolites and their associated metabolic pathways. Integrating the results from both omics analyses enables identification of the key targets and metabolic pathways involved in the antiplatelet aggregation effect of CTS. Furthermore, molecular docking was conducted to simulate the binding mode between CTS and key targets identified through integrated analysis, evaluating the binding affinity and stability at the atomic level. This computational validation provides structural insights for future experimental validation.

2. Materials and Methods

2.1. Drugs and Reagents

Aspirin enteric-coated tablets (positive control, batch No. BJ60885) were purchased from Bayer Healthcare Co., Ltd. (Beijing, China). Clopidogrel bisulfate tablets (positive control, batch No. AA984) were obtained from Sanofi (Hangzhou) Pharmaceutical Co., Ltd. (Hangzhou, China). Cryptotanshinone (purity ≥ 98%, batch No. PS010099) was supplied by Chengdu Pusi Biotechnology Co., Ltd. (Chengdu, China). Epinephrine hydrochloride injection (batch No. 62111202) was acquired from Suicheng Pharmaceutical Co., Ltd. (Xinxiang, China). Physiological sodium chloride solution (batch No. L220091206) was provided by Sichuan Kelun Pharmaceutical Co., Ltd. (Chengdu, China). Sodium carboxymethyl cellulose (CMC-Na, batch No. 20191222) was purchased from Tianjin Bodi Chemical Co., Ltd. (Tianjin, China). Adenosine diphosphate (ADP, batch No. 3215364) and arachidonic acid (AA, batch No. 3215335) were procured from Beijing Baibin Medical Device Co., Ltd. (Beijing, China). LC-MS grade acetonitrile and methanol were obtained from CNW Technologies (Shanghai, China). LC-MS grade ammonium acetate was supplied by Sigma-Aldrich (St. Louis, MO, USA). LC-MS grade ammonia solution was purchased from Fisher Chemical (Shanghai, China). Ultrapure water was provided by Guangzhou Watsons Food & Beverage Co., Ltd. (Guangzhou, China).

2.2. Animal Experimentation

2.2.1. Experimental Animals and Grouping

Seventy male Sprague–Dawley rats (250 ± 10 g) were obtained from Beijing Vital River Laboratory Animal Technology Co., Ltd. (Beijing, China; license No. SCXK2021-0011). Animals were maintained in a specific pathogen-free (SPF) barrier facility (20–25 °C, 40–60% relative humidity, 12 h light/dark cycle) with ad libitum access to standard chow and autoclaved water. All procedures were approved by the Guangxi University of Chinese Medicine Laboratory Animal Ethics Committee (Approval No: SYXK-2019-0001; Approval date: 1 November 2019) and conducted in accordance with the approved protocol and institutional animal-welfare guidelines.
After a 7-day acclimatization period, rats were randomly assigned to seven groups (n = 10 each). Mortality during the experiment reduced the final numbers to: (1) control (C) (n = 10), (2) model (M) (n = 8), (3) clopidogrel (LB, 30 mg kg−1) (n = 7), (4) aspirin (AS, 100 mg kg−1) (n = 7), and (5) low-dose CTS (Y05, 0.5 mg kg−1) (n = 10); (6) medium-dose CTS (Y5, 5 mg kg−1) (n = 6); and (7) high-dose CTS (Y50, 50 mg kg−1) (n = 10).

2.2.2. Drug Administration and Model Establishment

Rats in the drug-treated groups received the respective agents by intragastric gavage once daily for five consecutive days. The C and M groups received an equal volume of 0.5% (w/v) sodium carboxymethylcellulose. On day 5, 1 h after the final gavage, all groups except C were intraperitoneally (i.p.) injected with adrenaline hydrochloride (1 mg mL−1, 0.8 mL kg−1); group C received an equal volume of 0.9% saline. Two hours later; the rats in the model and drug-treated groups were immersed in ice water (0–4 °C) for 4 min; with their heads kept above the water and then dried thoroughly. After an additional 2 h; a second intraperitoneal injection of adrenaline hydrochloride (or saline for group C) was administered to induce acute blood stasis [22]. All the rats were fasted for 12 h with free access to water. Successful modeling was confirmed by the appearance of typical signs: dark purple claws and tails; pale ears; and cold aversion

2.2.3. Sample Collection and Processing

After a 12 h fast, the rats were anesthetized by the intraperitoneal injection of 20% urethane at 1 g/kg, and blood was collected from the abdominal aorta. Samples for metabolomics were collected into plain vacuum tubes, and samples for platelet aggregation assays were collected into sodium citrate anticoagulant tubes.
For metabolomics, blood in plain tubes was incubated at room temperature for 1 h, centrifuged at 3000 rpm for 10 min, and the supernatant was transferred to sterile 1.5 mL EP tubes. This was further centrifuged at 12,000 rpm at 4 °C for 10 min, and the resulting supernatant was aliquoted into sterile 1.5 mL tubes and stored at −80 °C until further analysis.

2.3. Platelet Aggregation Assay

Platelet aggregation was measured using light-transmission aggregometry [23]. Platelet-rich plasma (PRP) and platelet-poor plasma (PPP) were prepared as follows: whole blood was left at room temperature and centrifuged at 600 rpm for 10 min; this step was repeated twice, and the supernatant was collected into 1.5 mL EP tubes as PRP. The remaining plasma was centrifuged at 3000 rpm for 15 min at room temperature, and the resulting supernatant was collected into 1.5 mL EP tubes as PPP.
The aggregometer was pre-warmed to 37 °C for 15 min. After blanking with 200 μL PPP, 200 μL PRP was placed in a cuvette and incubated at 37 °C for 5 min. Subsequently, 25 μL ADP and 25 μL AA were added as agonists, followed by a magnetic stir bar. The maximum aggregation rate of PRP was recorded within 5 min following agonist addition at 37 °C.

2.4. Network Pharmacology

2.4.1. Collection of Potential Compound Targets

Using “cryptotanshinone” as the keyword, the 2-D structure, SMILES string, and InChIKey were retrieved from PubChem (https://pubchem.ncbi.nlm.nih.gov/, accessed on 9 October 2024). Putative human targets were predicted using the Comparative Toxicogenomics Database (CTD) (https://ctdbase.org/, accessed on 9 October 2024) and TCMSP (https://www.tcmsp-e.com/, accessed on 10 October 2024) and Swiss Target Prediction (http://swisstargetprediction.ch/, accessed on 10 October 2024), with the species restricted to Homo sapiens.

2.4.2. Disease Target Acquisition

Targets associated with the keyword “anti-platelet aggregation” were extracted from OMIM (http://www.omim.org/, accessed on 10 October 2024), STRING (http://string-db.org/, accessed on 10 October 2024), GeneCards (https://www.genecards.org/, accessed on 10 October 2024), and DrugBank (https://go.drugbank.com/, accessed on 10 October 2024), and converted using UniProt (https://www.uniprot.org/, accessed on 10 October 2024). The drug- and disease-related targets were intersected using Venny 2.1.0 (https://bioinfogp.cnb.csic.es/tools/venny/index.html, accessed 10 October 2024) to generate common targets, which were visualized in Venn diagrams.

2.4.3. Protein–Protein Interaction Network Construction and Core Target Selection

Intersected targets were uploaded to STRING (http://string-db.org/, accessed 11 October 2024) with species set to Homo sapiens and a confidence threshold of 0.4 to generate the PPI network. The resulting data were imported into Cytoscape 3.10.0 software for visualization. Node size and color denote degree values, while edge width and color represent combined scores.

2.4.4. GO and KEGG Enrichment Analysis

Intersected targets were analyzed using DAVID (https://davidbioinformatics.nih.gov/, accessed 11 October 2024) for Gene Ontology (GO) and Kyoto Encyclopedia of Genes and Genomes (KEGG) enrichment, with Homo sapiens as background. GO terms were ranked by p-values, and the top ten biological processes were plotted as bar charts. Likewise, KEGG pathways were ranked by p-value, and the top 30 were visualized in Sankey diagrams.

2.5. Untargeted Metabolomics Analysis

2.5.1. Extraction of Serum Metabolites

Frozen serum aliquots stored at −80 °C were thawed on ice and allowed to equilibrate to room temperature. A 100 μL volume of each sample was transferred to a 1.5 mL EP tube, followed by the addition of 400 μL ice-cold extraction solvent (methanol/acetonitrile 1:1, v/v) containing a cocktail of stable-isotope-labeled internal standards. The mixture was vortexed for 30 s and then sonicated in an ice-water bath for 10 min. After incubation at −40 °C for 1 h, proteins were pelleted by centrifugation at 12,000 rpm (13,800× g, 8.6 cm rotor radius) for 15 min at 4 °C. The resulting supernatant was transferred to an LC–MS autosampler vial for analysis. An equal volume of the supernatant from each sample was pooled to generate a pooled quality control (QC) sample, which was analyzed alongside the study samples throughout the batch.

2.5.2. LC-MS Analysis Conditions

Chromatography was performed on a Vanquish UHPLC system (Thermo Fisher Scientific, Waltham, MA, USA) equipped with a Waters ACQUITY UPLC BEH Amide column (2.1 mm × 100 mm, 1.7 µm). Mobile phase A consisted of 25 mmol L−1 ammonium acetate and 25 mmol L−1 aqueous ammonia in water; mobile phase B was acetonitrile. The column temperature was maintained at 30 °C, the autosampler tray was maintained at 4 °C, and the flow rate was set at 0.5 mL min−1. The injection volume was 2 L. Gradient elution was as follows: 0–0.5 min, % B; 0.5–7 min, 95–65% B; 7–8 min, 65–40% B; 8–9 min, 40% B; 9–9.1 min, 40–95% B; 9.1–12 min, 95% B.
Mass spectrometry was performed using an Orbitrap Exploris 120 mass spectrometer (Thermo Fisher Scientific) controlled by Xcalibur software (v. 4.4, Thermo Fisher Scientific, Waltham, MA, USA). Full-scan and tandem mass spectra were acquired in the positive-ion and negative-ion modes. Key parameters were: sheath gas flow rate (50 arbitrary units); auxiliary gas flow rate (15 arbitrary units); capillary temperature 320 °C; full-MS resolution, 60,000; MS/MS resolution, 15,000; normalized collision energies, 10, 30, and 60%; spray voltage, 3.8 kV (positive) or −3.4 kV (negative).

2.5.3. Data Processing and Analysis

Raw data were converted to mzXML format using ProteoWizard software (v. 3.0.21120; https://proteowizard.sourceforge.io, accessed on 8 November 2024) and subsequently processed with the XCMS-based R package (v. 4.1.2; R Foundation for Statistical Computing, Vienna, Austria) for peak detection, extraction, alignment, and integration. Metabolites were annotated by matching the MS2 spectra against the BiotreeDB (version 2.1) database, using an algorithm score cutoff of 0.3. Statistical analyses included univariate and multivariate analyses. Differences between the two groups were evaluated using Student’s t-test. Multivariate analysis was conducted using SIMCA software (V16.0.2, Sartorius Stedim Data Analytics AB, Umeå, Sweden) for principal component analysis (PCA) and orthogonal partial least-squares discriminant analysis (OPLS-DA). In the OPLS-DA model, variables with VIP > 1 and p-value < 0.05 were considered significant differential metabolites. KEGG functional annotation and metabolic pathway enrichment analyses were performed using MetaboAnalyst 5.0 (https://www.metaboanalyst.ca/; accessed 2 November 2022).

2.6. Integrated Network-Pharmacology and Metabolomics Analysis

Interactions between differential metabolites and core targets were examined via an integrated analysis of network pharmacology and metabolomics using the “Joint Pathway Analysis” module of MetaboAnalyst 5.0. (https://www.metaboanalyst.ca/, accessed on 5 November 2024).

2.7. Molecular Docking

2D structures of the core compounds were downloaded from the PubChem database (https://pubchem.ncbi.nlm.nih.gov/, accessed on 8 November 2024) and converted to 3D conformers using ChemBioOffice Ultra 13.0.2-Chem3D. The resulting structures were energy-minimized. The protein structures corresponding to the core targets were retrieved from the PDB database (https://www.rcsb.org/, accessed on 8 November 2024) and processed (water and extraneous ligands were removed) using PyMOL 2.5.2. Docking grids were defined using AutoDockTools-1.5.7, ensuring that the grid box encompassed the entire protein. Semi-flexible molecular docking was performed using Vina (v. 1.2.5); the absolute value of the binding energy was used as the affinity metric, with higher values indicating stronger receptor–ligand interactions.

2.8. Statistical Analysis

All analyses were performed using SPSS software (version 26.0; IBM, Armonk, NY, USA). Results are presented as mean ± standard deviation (SD). Differences among groups were evaluated using one-way analysis of variance (ANOVA). Statistical significance was set at p < 0.05.

3. Results

3.1. Effect on Platelet Aggregation Rate in Rat Acute Blood Stasis Model

Arachidonic acid (AA) and adenosine diphosphate (ADP) are widely used as platelet aggregation inducers [24]. In this study, AA induced aggregation rates of 66.50% ± 2.96% in the C group, whereas those of the acute blood-stasis M group rose significantly to 81.57% ± 1.62% (vs. C group, p < 0.01). With ADP stimulation, the aggregation rates were 64.73% ± 2.81% and 74.43% ± 1.68%, respectively (vs. C group, p < 0.05), indicating that the acute blood-stasis model was successfully established (Figure 1). Further analysis revealed that, under AA stimulation, platelet aggregation in all drug-treated groups was markedly lower than that in the M group (p < 0.01), demonstrating a significant inhibitory effect on AA-induced aggregation. The strongest effects were observed in the AS and Y50 groups, whose aggregation rates decreased to 0.70% ± 0.10% and 1.00% ± 0.10%, respectively. The rates for the LB, Y05, and Y5 groups were 21.70% ± 2.08%, 45.30% ± 1.71% and 25.67% ± 2.74%. For corresponding inhibition ratios, AS (0.99 ± 0.01) and Y50 (0.98 ± 0.02) were the highest; among the CTS-dose groups, Y5 (0.61 ± 0.01) and Y50 exceeded LB (0.67 ± 0.03), while Y05 was the lowest (0.32 ± 0.06). With ADP stimulation, aggregation was likewise significantly reduced in all treated groups relative to the M group (p < 0.01), confirming pronounced inhibitory action against ADP-induced aggregation. The strongest effects were observed in the LB, Y5, and Y50 groups, whose aggregation values decreased to 1.43% ± 0.46%, 7.93% ± 0.61% and 1.70% ± 0.61%, respectively. The AS and Y05 groups exhibited weaker activity, yet their aggregation rates still decreased to 25.20% ± 2.46% and 36.17% ± 2.46%, respectively. Corresponding inhibition ratios ranked highest for LB (0.98 ± 0.01), Y50 (0.97 ± 0.01), and Y5 (0.88 ± 0.01), whereas Y05 (0.44 ± 0.01) remained lower than the former three but superior to AS (0.61 ± 0.03). Collectively, CTS significantly suppressed AA- and ADP-induced platelet aggregation in a dose-dependent manner.

3.2. Network Pharmacology Analysis

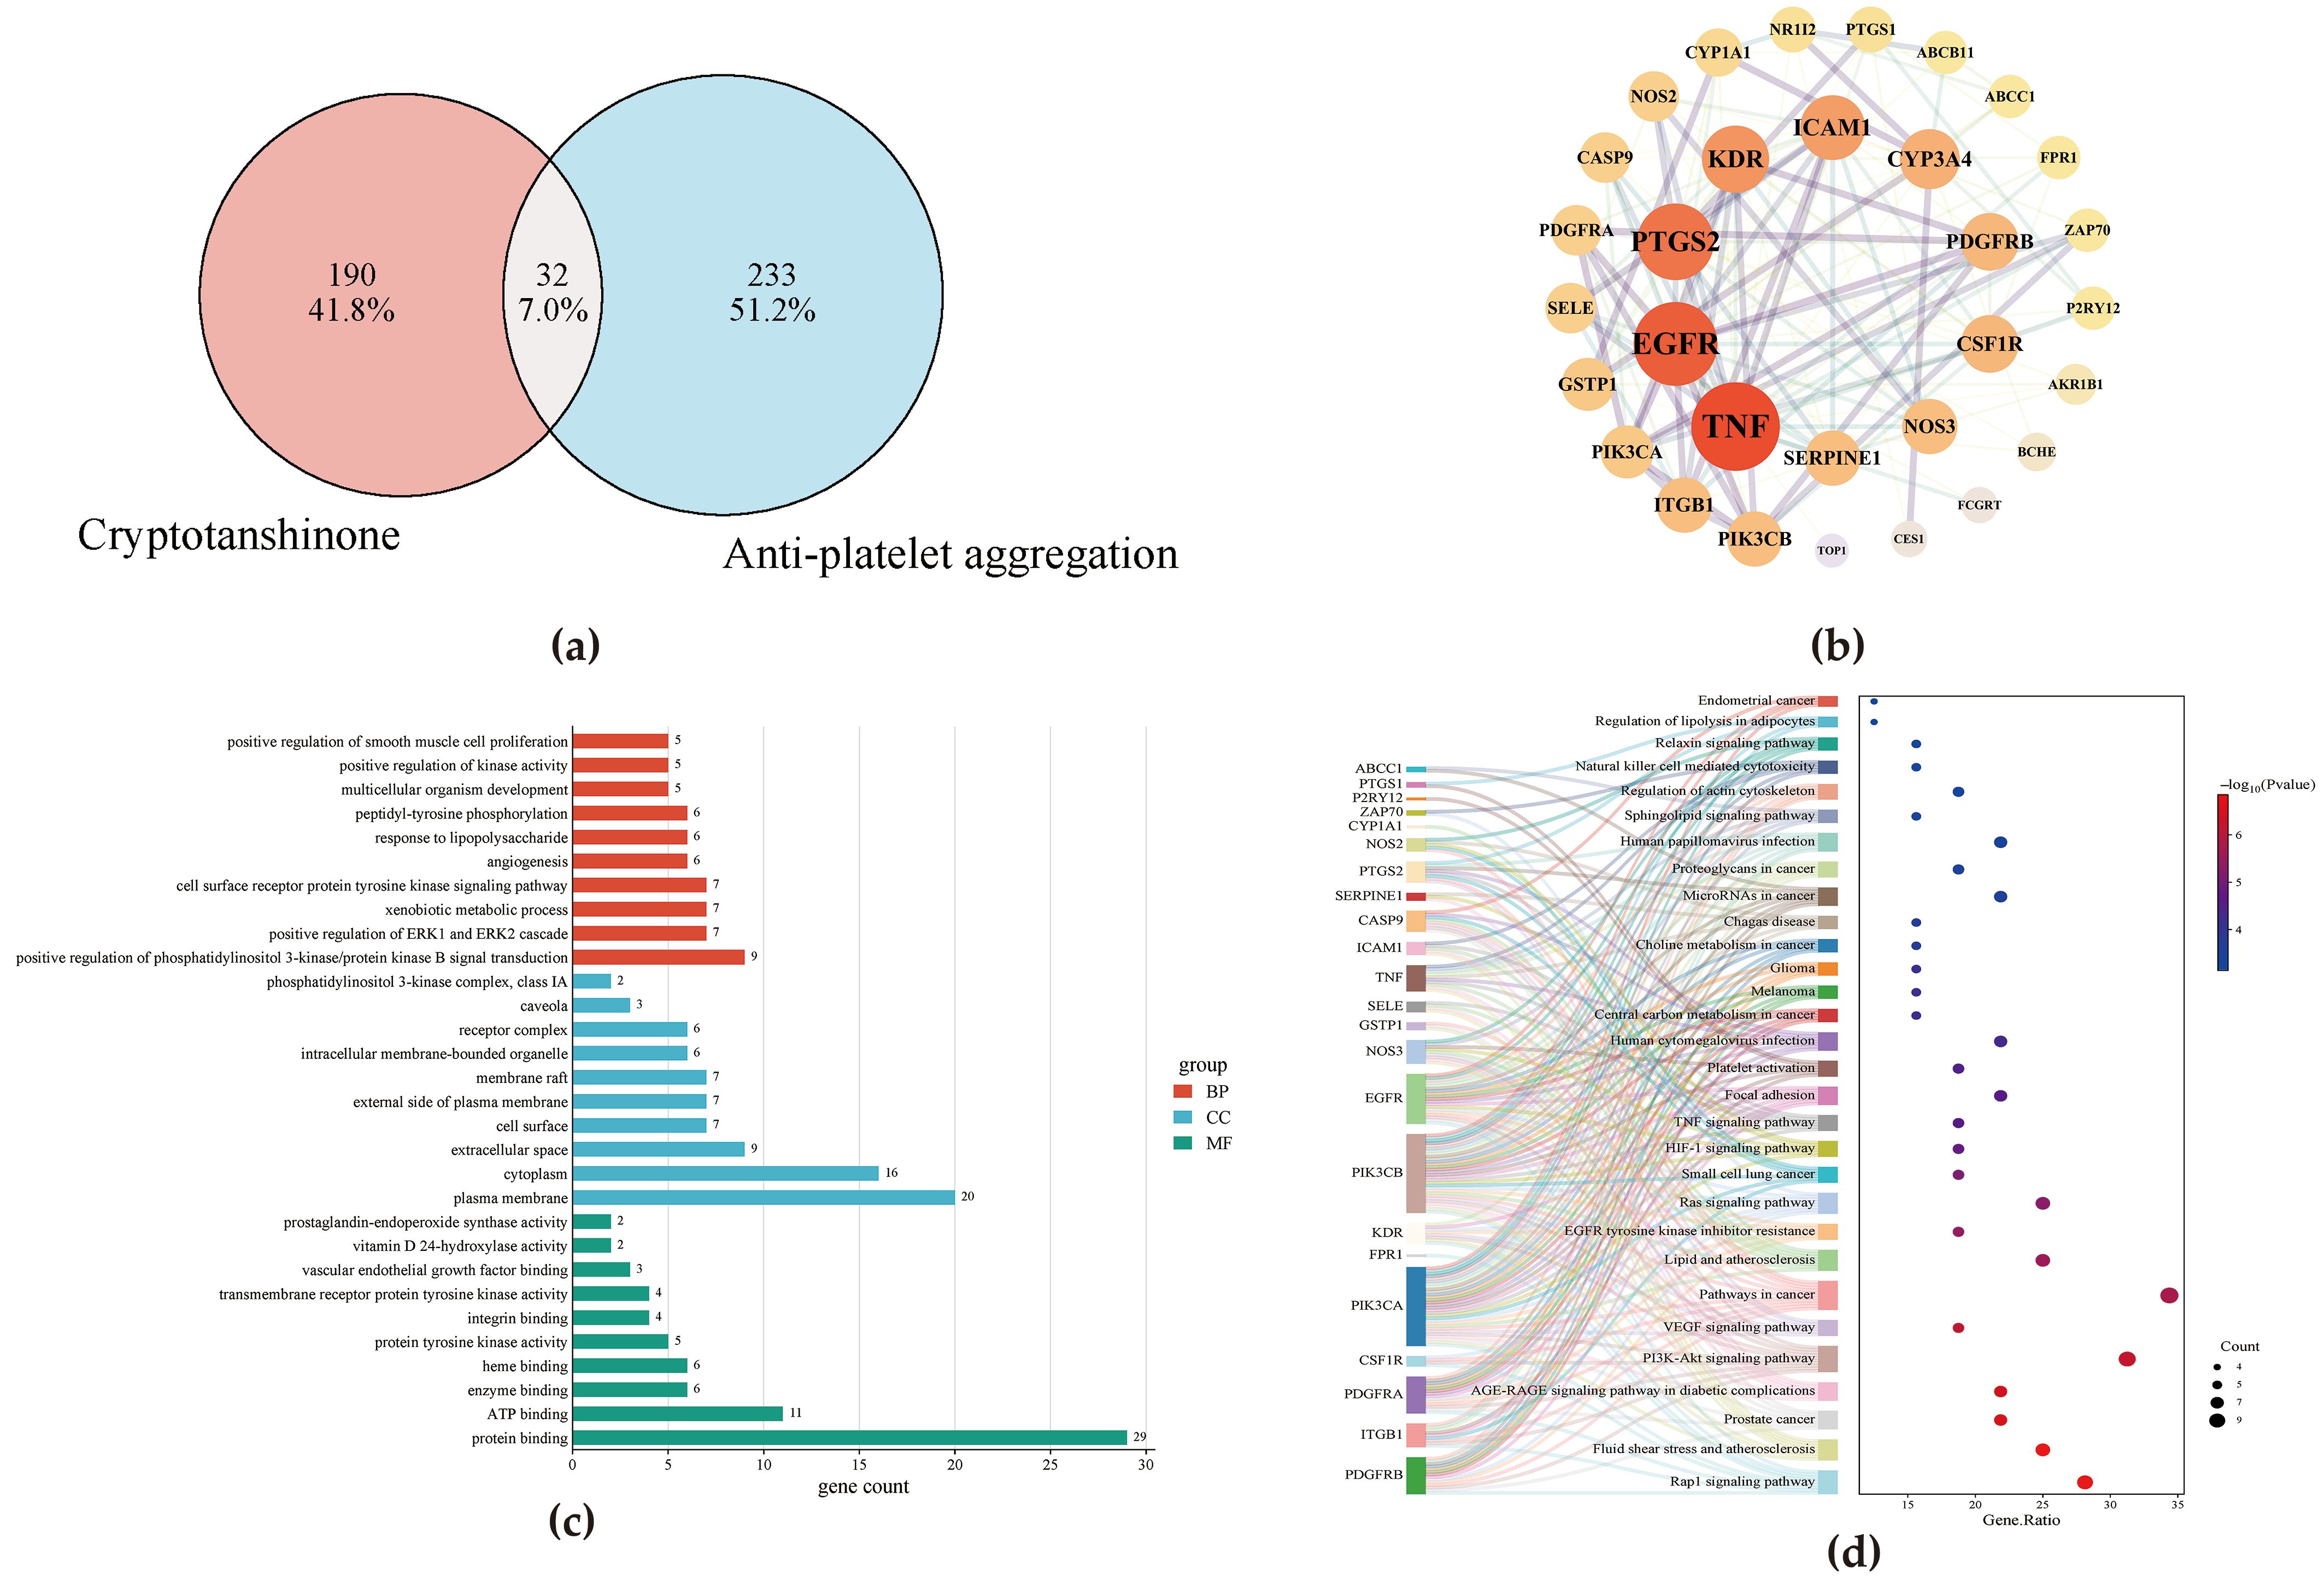
Network pharmacology was employed to explore the potential mechanism by which CTS inhibits platelet aggregation in a rat model of acute blood stasis. In total, 222 drug-associated and 262 disease-related targets were retrieved, with 32 overlapping therapeutic targets (Figure 2a), which were used to construct a STRING-derived protein–protein interaction (PPI) network (Figure 2b). The top 15 nodes ranked by degree included TNF, EGFR, PTGS2, KDR, and ICAM1 (Table S1).
GO analysis returned 211 terms comprising 143 biological processes (BP), 27 cellular components (CC), and 41 molecular functions (MF) entries. The BP terms were enriched for receptor protein tyrosine kinase signaling pathway, xenobiotic metabolism, positive regulation of ERK1/ERK2, and phosphatidylinositol 3-kinase/protein kinase B (PI3K-Akt) signal transduction. The MF terms mainly included heme, enzyme, ATP, and protein binding. CC terms corresponding to the cell surface, the extracellular space, the cytoplasm, and the plasma membrane (Figure 2c). KEGG pathway analysis identified 93 signaling pathways, with the most significant ones including the Rap1 signaling pathway, fluid shear stress, atherosclerosis, PI3K-Akt signaling pathway, and cancer-related pathways (Figure 2d).

3.3. Untargeted Metabolomics

3.3.1. Multivariate Statistical Analysis

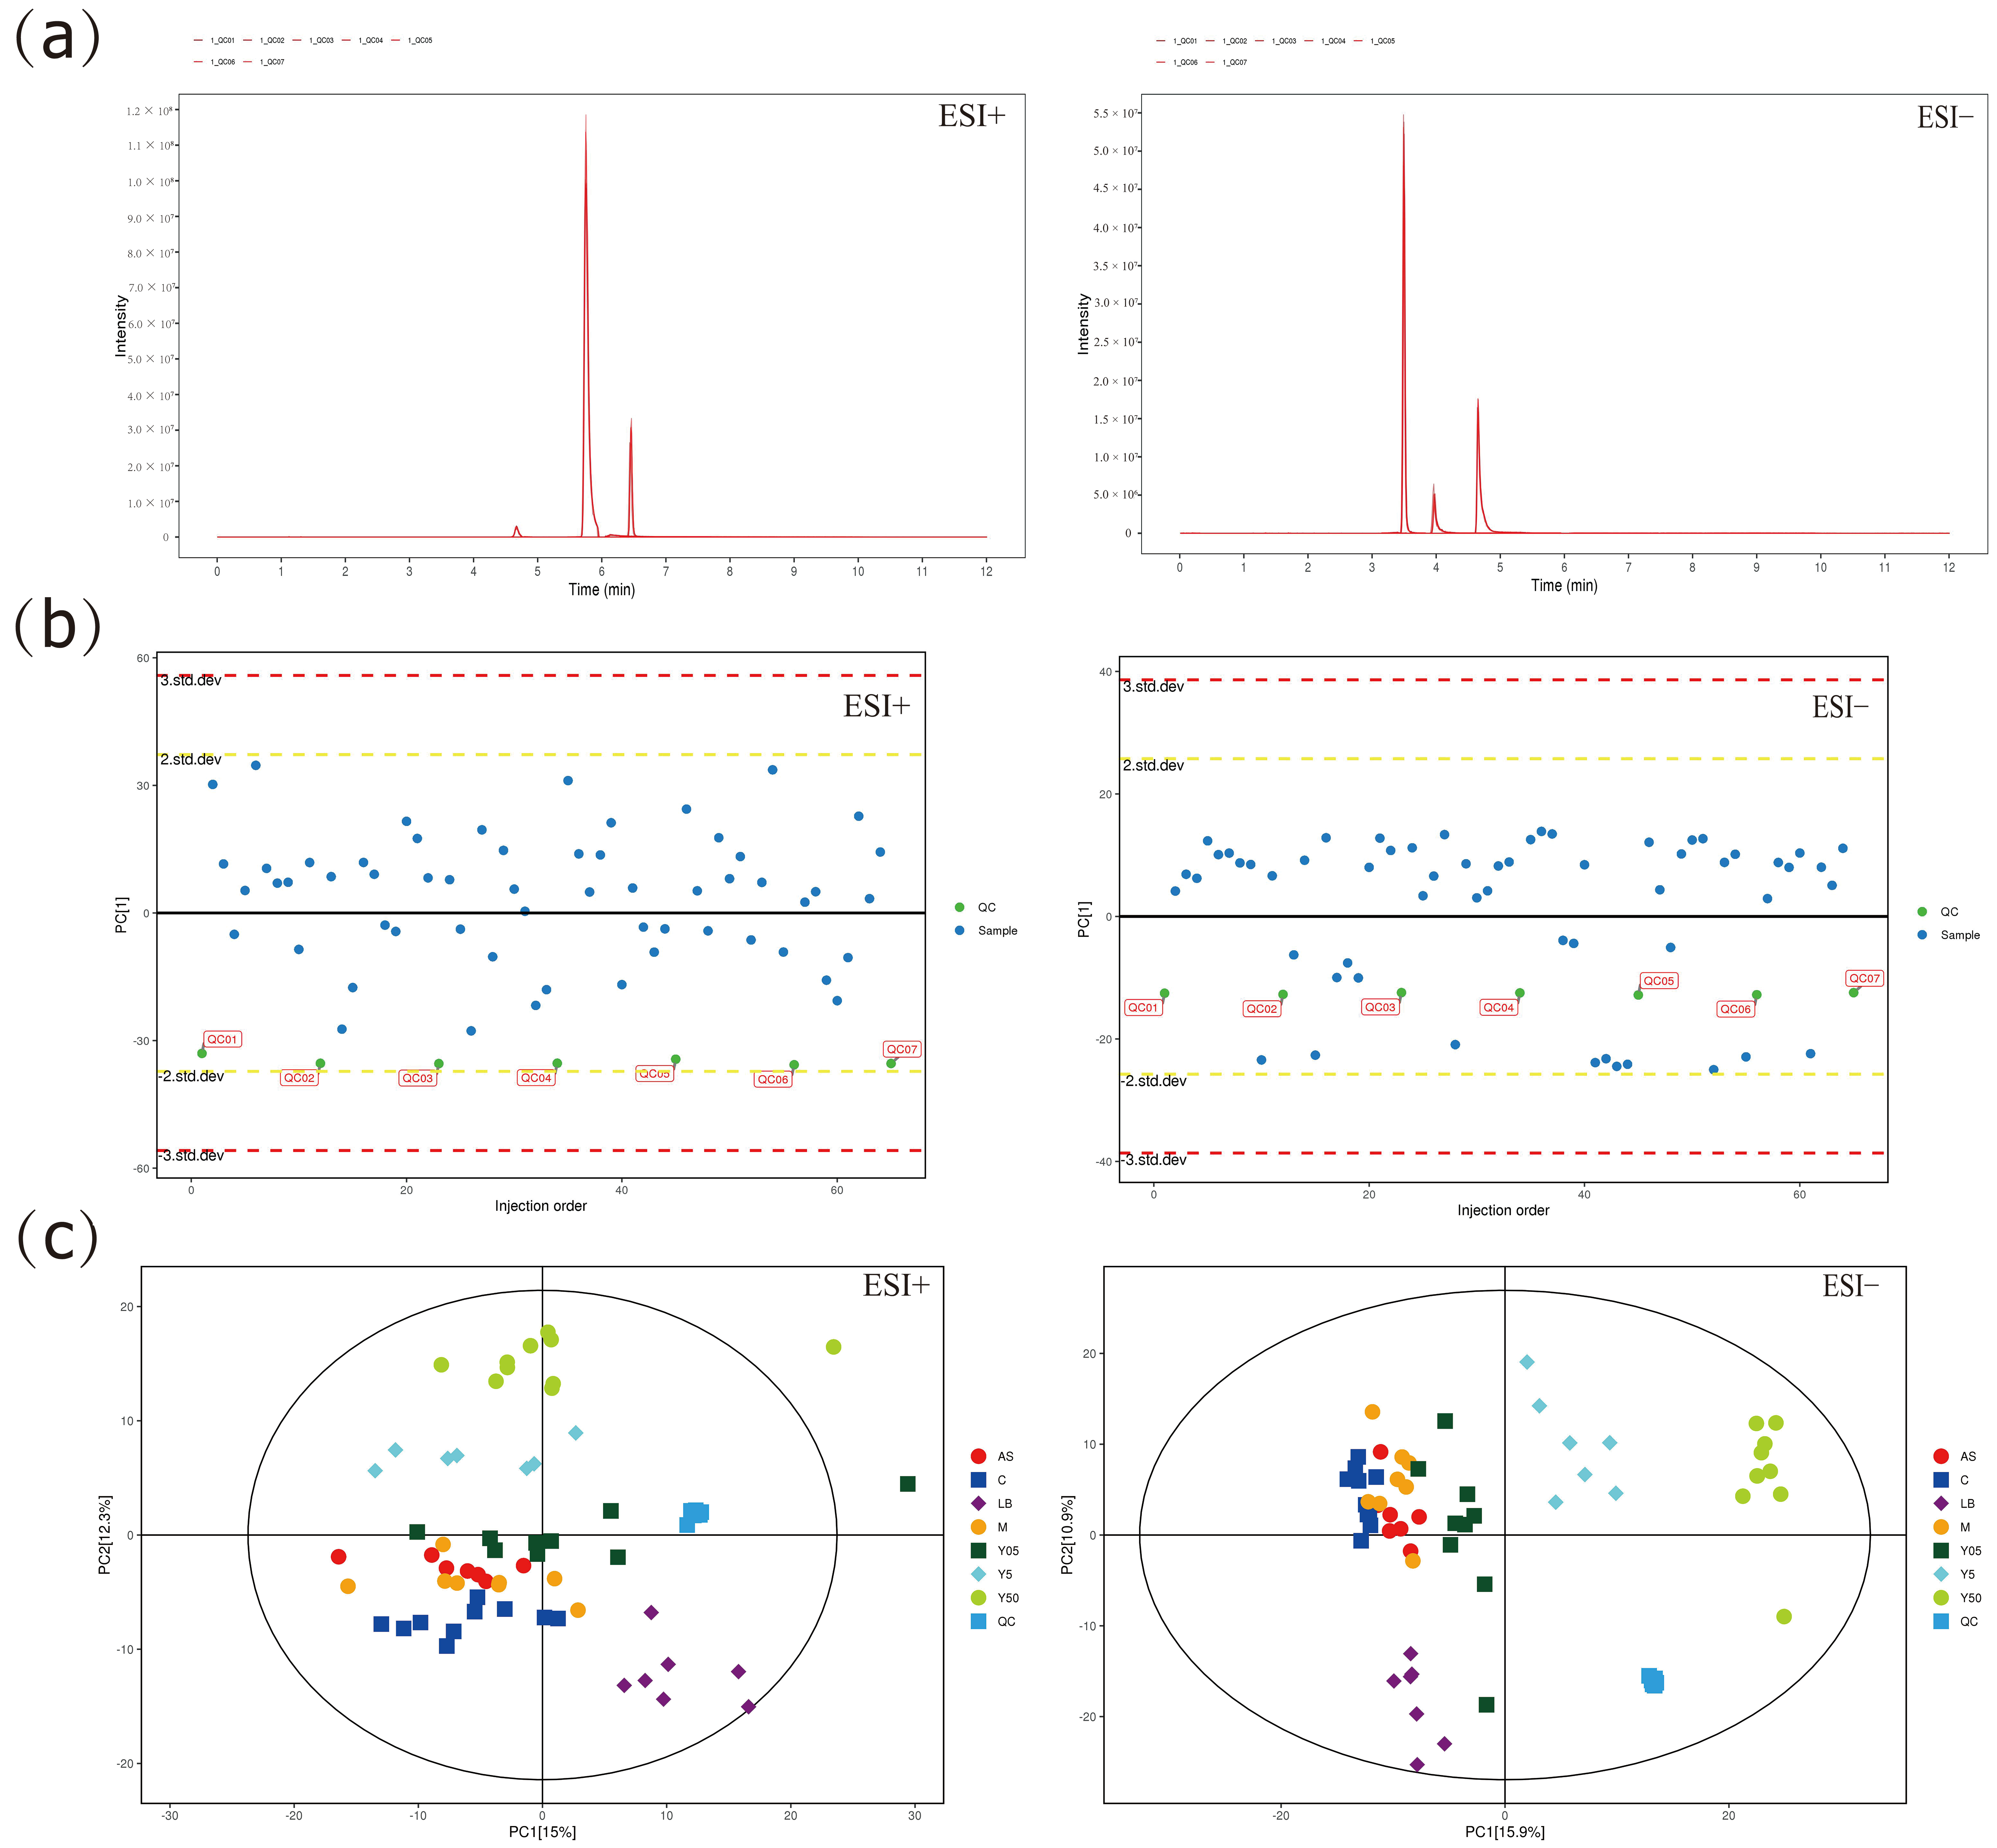
Metabolomic datasets are inherently high-dimensional and noise-laden; consequently, multivariate pattern recognition was employed to extract biologically relevant features. Inspection of the extracted-ion chromatograms (EICs) of the internal standards in all QC injections (Figure 3a) revealed negligible drift in retention time and response intensity, thereby confirming instrumental stability. Subsequent examination of the QC samples along the first principal component of a PCA-X model (Figure 3b) showed that every QC specimen resided within ±2 standard deviations of the centroid, validating reproducibility. The PCA score plot (Figure 3c) displays the metabolic profiles of the seven rat groups, together with the QC cohort. QC replicates clustered tightly, underscoring methodological robustness, whereas all experimental samples fell within the 95% confidence ellipse, with the seven groups clearly separated. Relative to the M group, the Y05, Y5, and Y50 groups converged sequentially, indicating a dose-dependent metabolic signature of CTS. These three treatment groups were spatially distinct from the positive control LB group cluster, suggesting the involvement of divergent metabolic pathways. Notably, the Y05 group was localized adjacent to the alternative positive control AS group, whereas the Y5 and Y50 groups deviated markedly from the AS group, indicating that low-dose CTS may partially recapitulate the metabolic actions of the AS group. These observations warrant confirmation by supervised OPLS-DA modeling and pathway enrichment analysis.
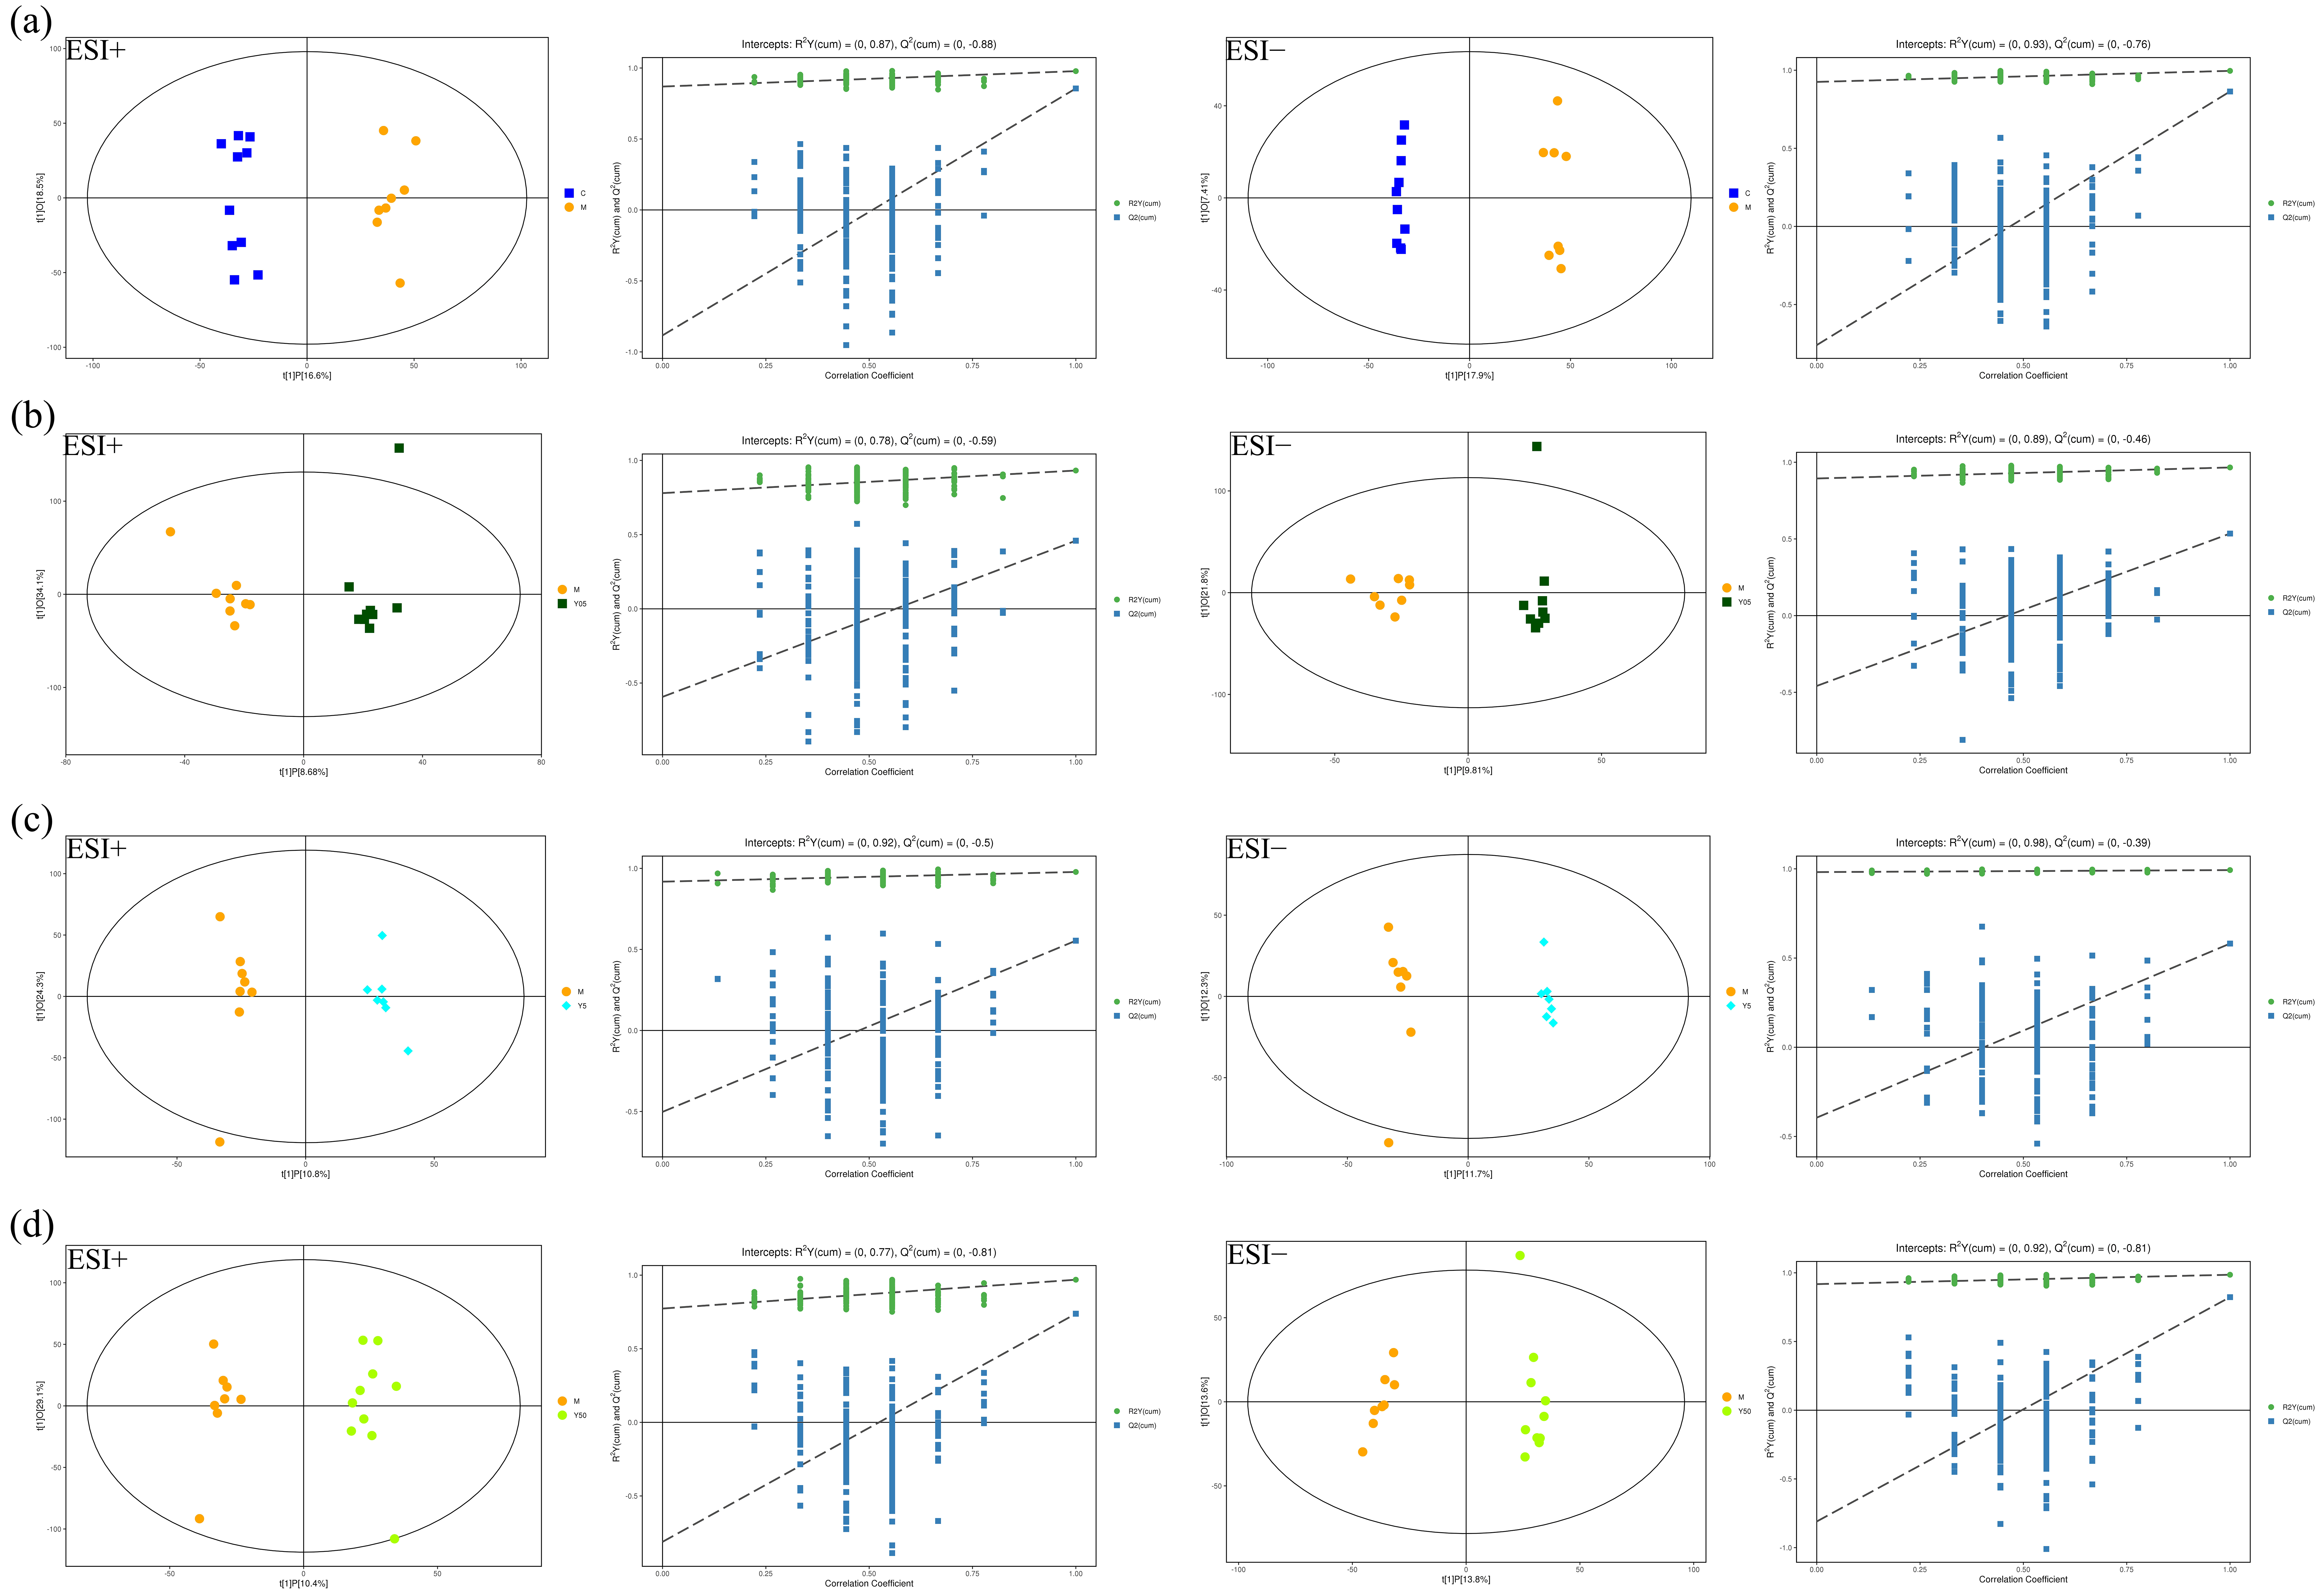
To further resolve inter-group metabolic differences and identify robust discriminant metabolites, orthogonal partial least squares discriminant analysis (OPLS-DA) was applied pairwise: C group vs. M group, M group vs. Y05 group, M group vs. Y5 group, and M group vs. Y50 group. Both ESI+ and ESI modes exhibit a clear separation along the first predictive component between C and M groups (Figure 4a), confirming the validity of the acute blood-stasis model. Likewise, the M group was distinctly segregated from the Y05, Y5, and Y50 groups (Figure 4b–d), with tight within-group clustering, indicating that CTS markedly remodeled the plasma metabolome of the model rats. The model robustness and predictive ability, evaluated using seven-fold cross-validation combined with 200-iteration permutation testing, showed R2Y values close to unity, corroborating the faithful representation of the observed data, Q2 intercepts of <0, with the majority of permuted Q2 values falling below the corresponding original points (Table S2), demonstrating the absence of overfitting and confirming model robustness. R2X denotes the variance in X explained by the model, R2Y quantifies the variance in class variable Y, and Q2 reflects the predictive accuracy.

3.3.2. Screening and Identification of Differential Metabolites

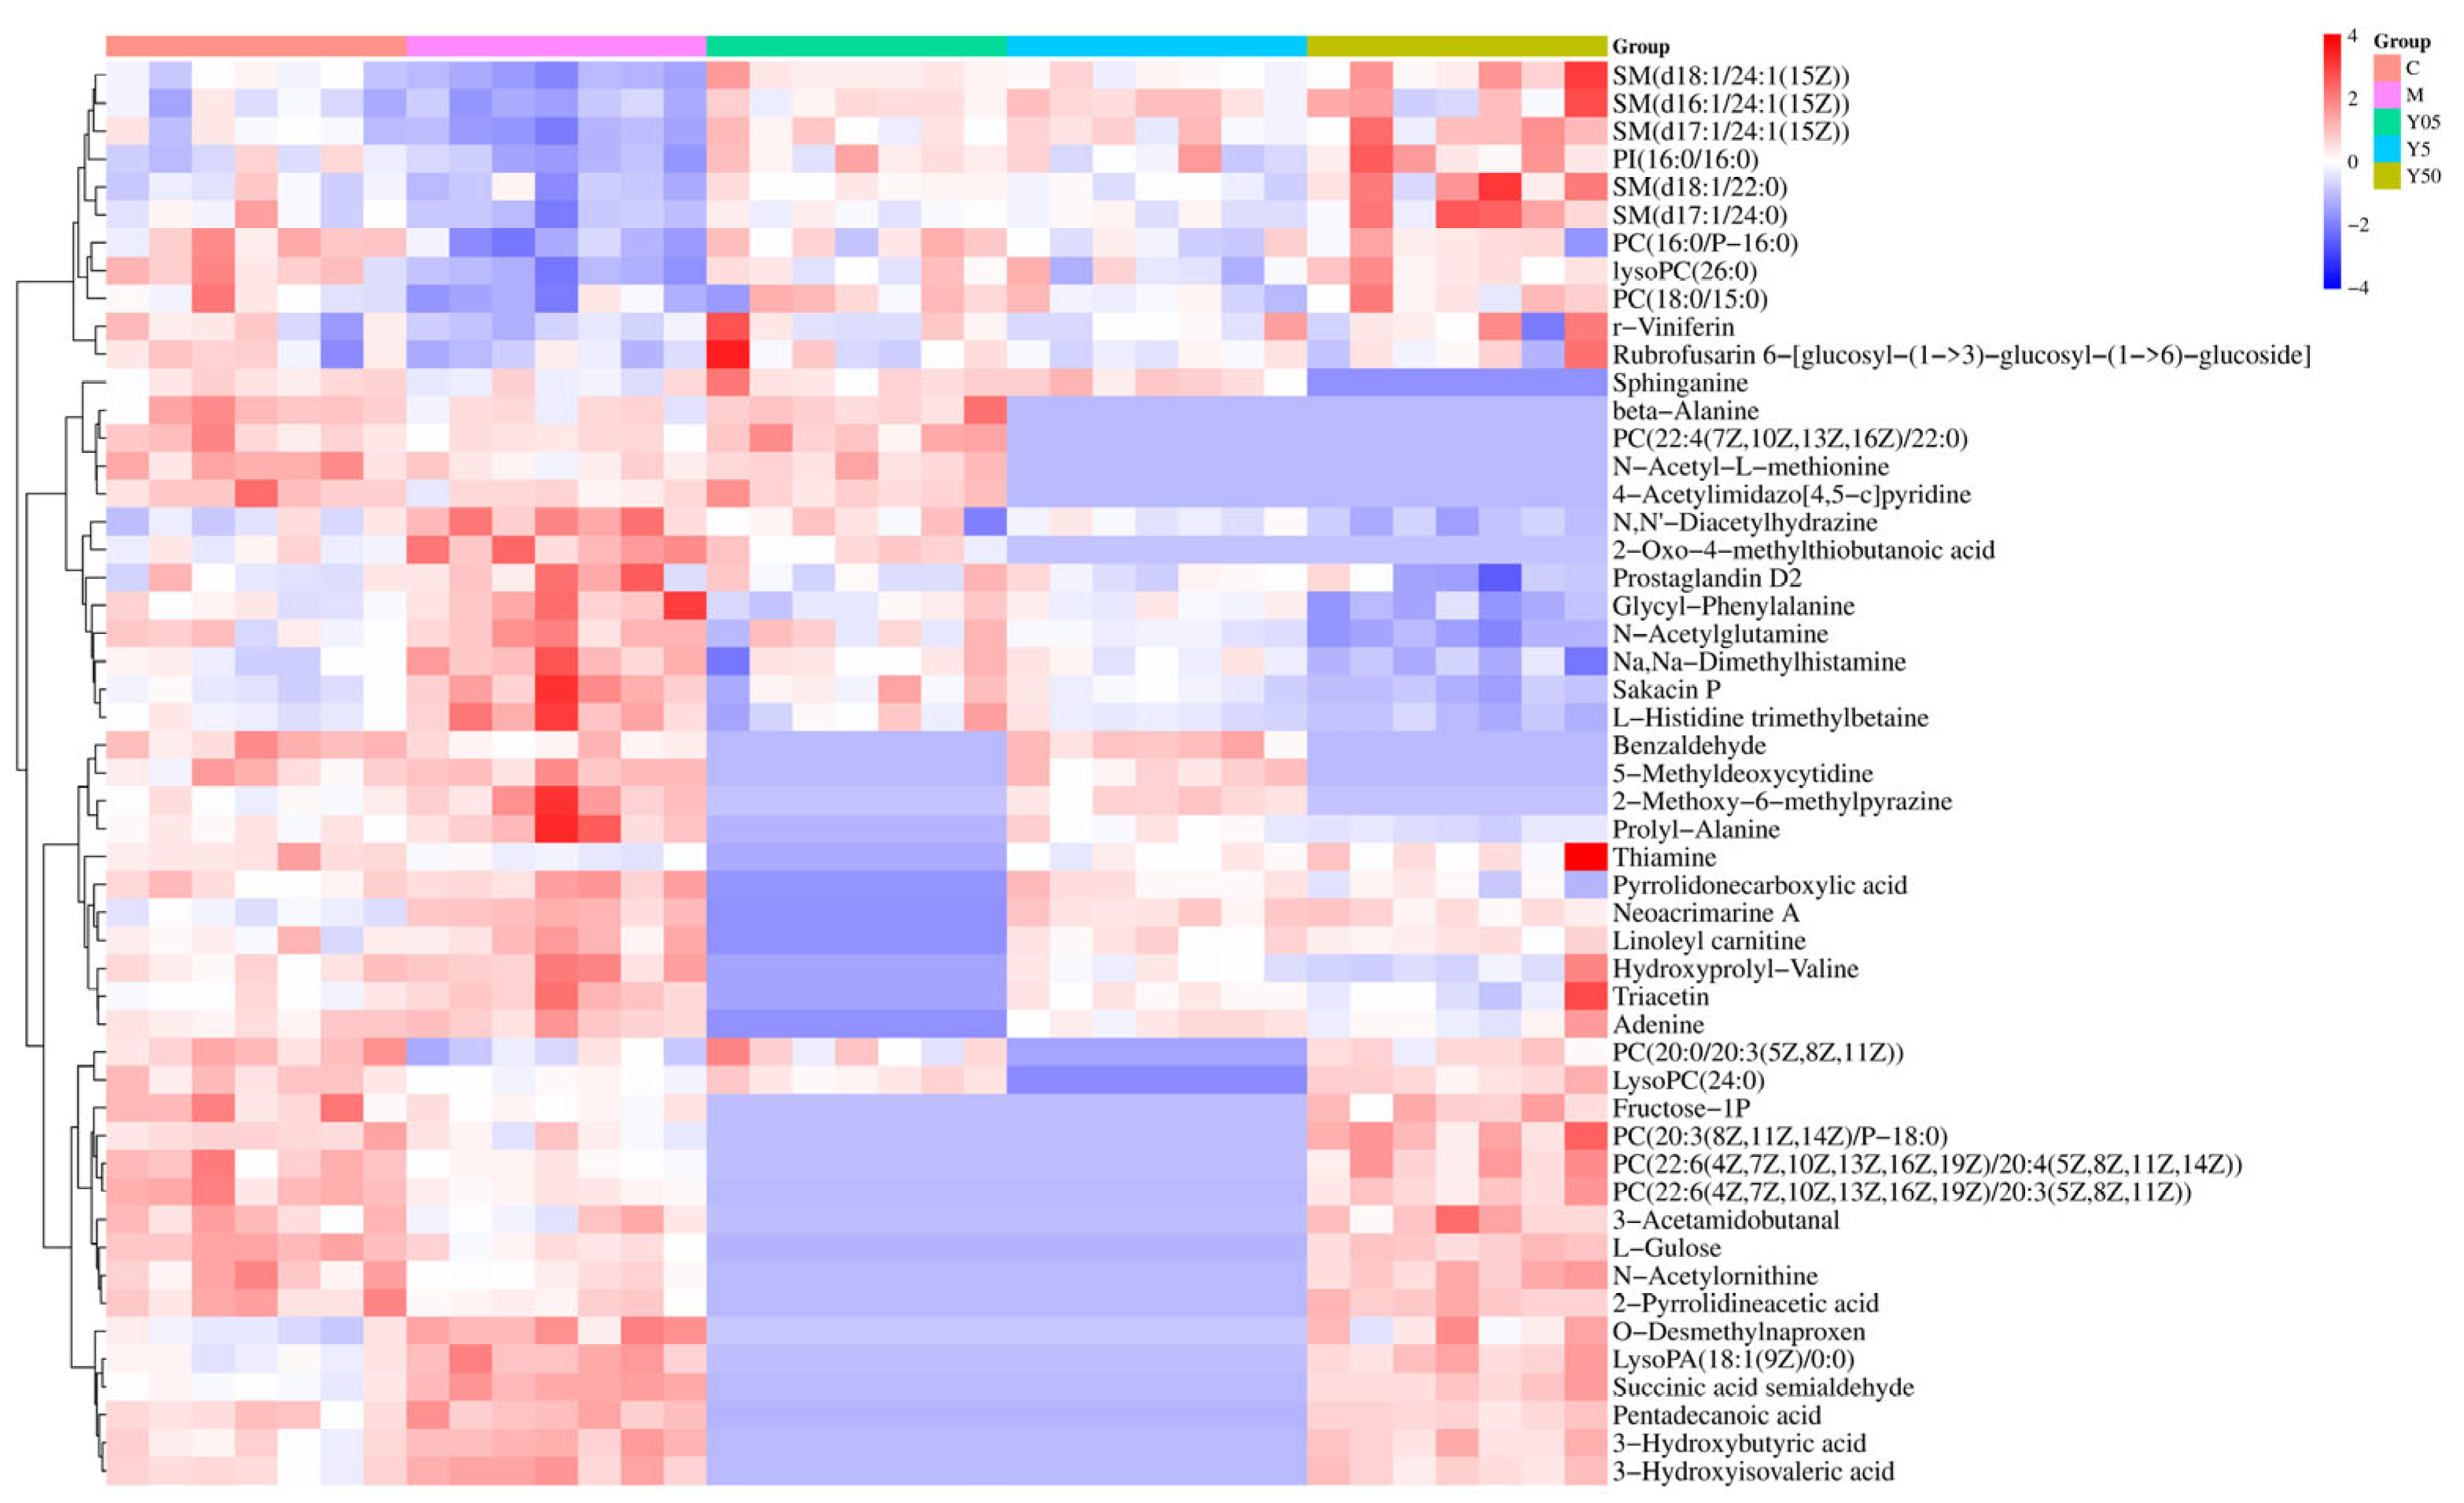
Differential metabolites were selected by combining variable importance in projection (VIP) values from OPLS-DA models with two-tailed independent-samples t-tests; thresholds were set at VIP > 1 and p < 0.05. Volcano plots were constructed to visualize the overall expression patterns of the resulting features (Figures S1 and S2). Putative identifications were made by matching accurate mass and MS/MS fragmentation patterns against the Human Metabolome Database (HMDB). Compared to the C group, the M group showed 151 discriminant metabolites in the positive-ion mode (40 upregulated and 111 downregulated) and 83 in the negative-ion mode (42 upregulated and 38 downregulated). CTS administration significantly normalized 51 metabolites in M rats, including succinic acid semialdehyde, Neoacrimarine A, and 2-oxo-4-methylthiobutanoic acid (Table 1). Among these, the low-, medium-, and high-dose CTS groups normalized 27, 31, and 42 metabolites, respectively. A heat map of these 51 CTS-responsive metabolites (Figure 5) demonstrated dose-dependent restoration trends and distinct expression profiles of each experimental group. Functional categorization of these 51 metabolites revealed that 19 were directly associated with platelet activation pathways, while the remaining 32 were related to systemic metabolic stress, thereby delineating the targeted antiplatelet actions of CTS from its broader systemic effects.

3.3.3. KEGG Pathway Analysis of Differential Metabolites

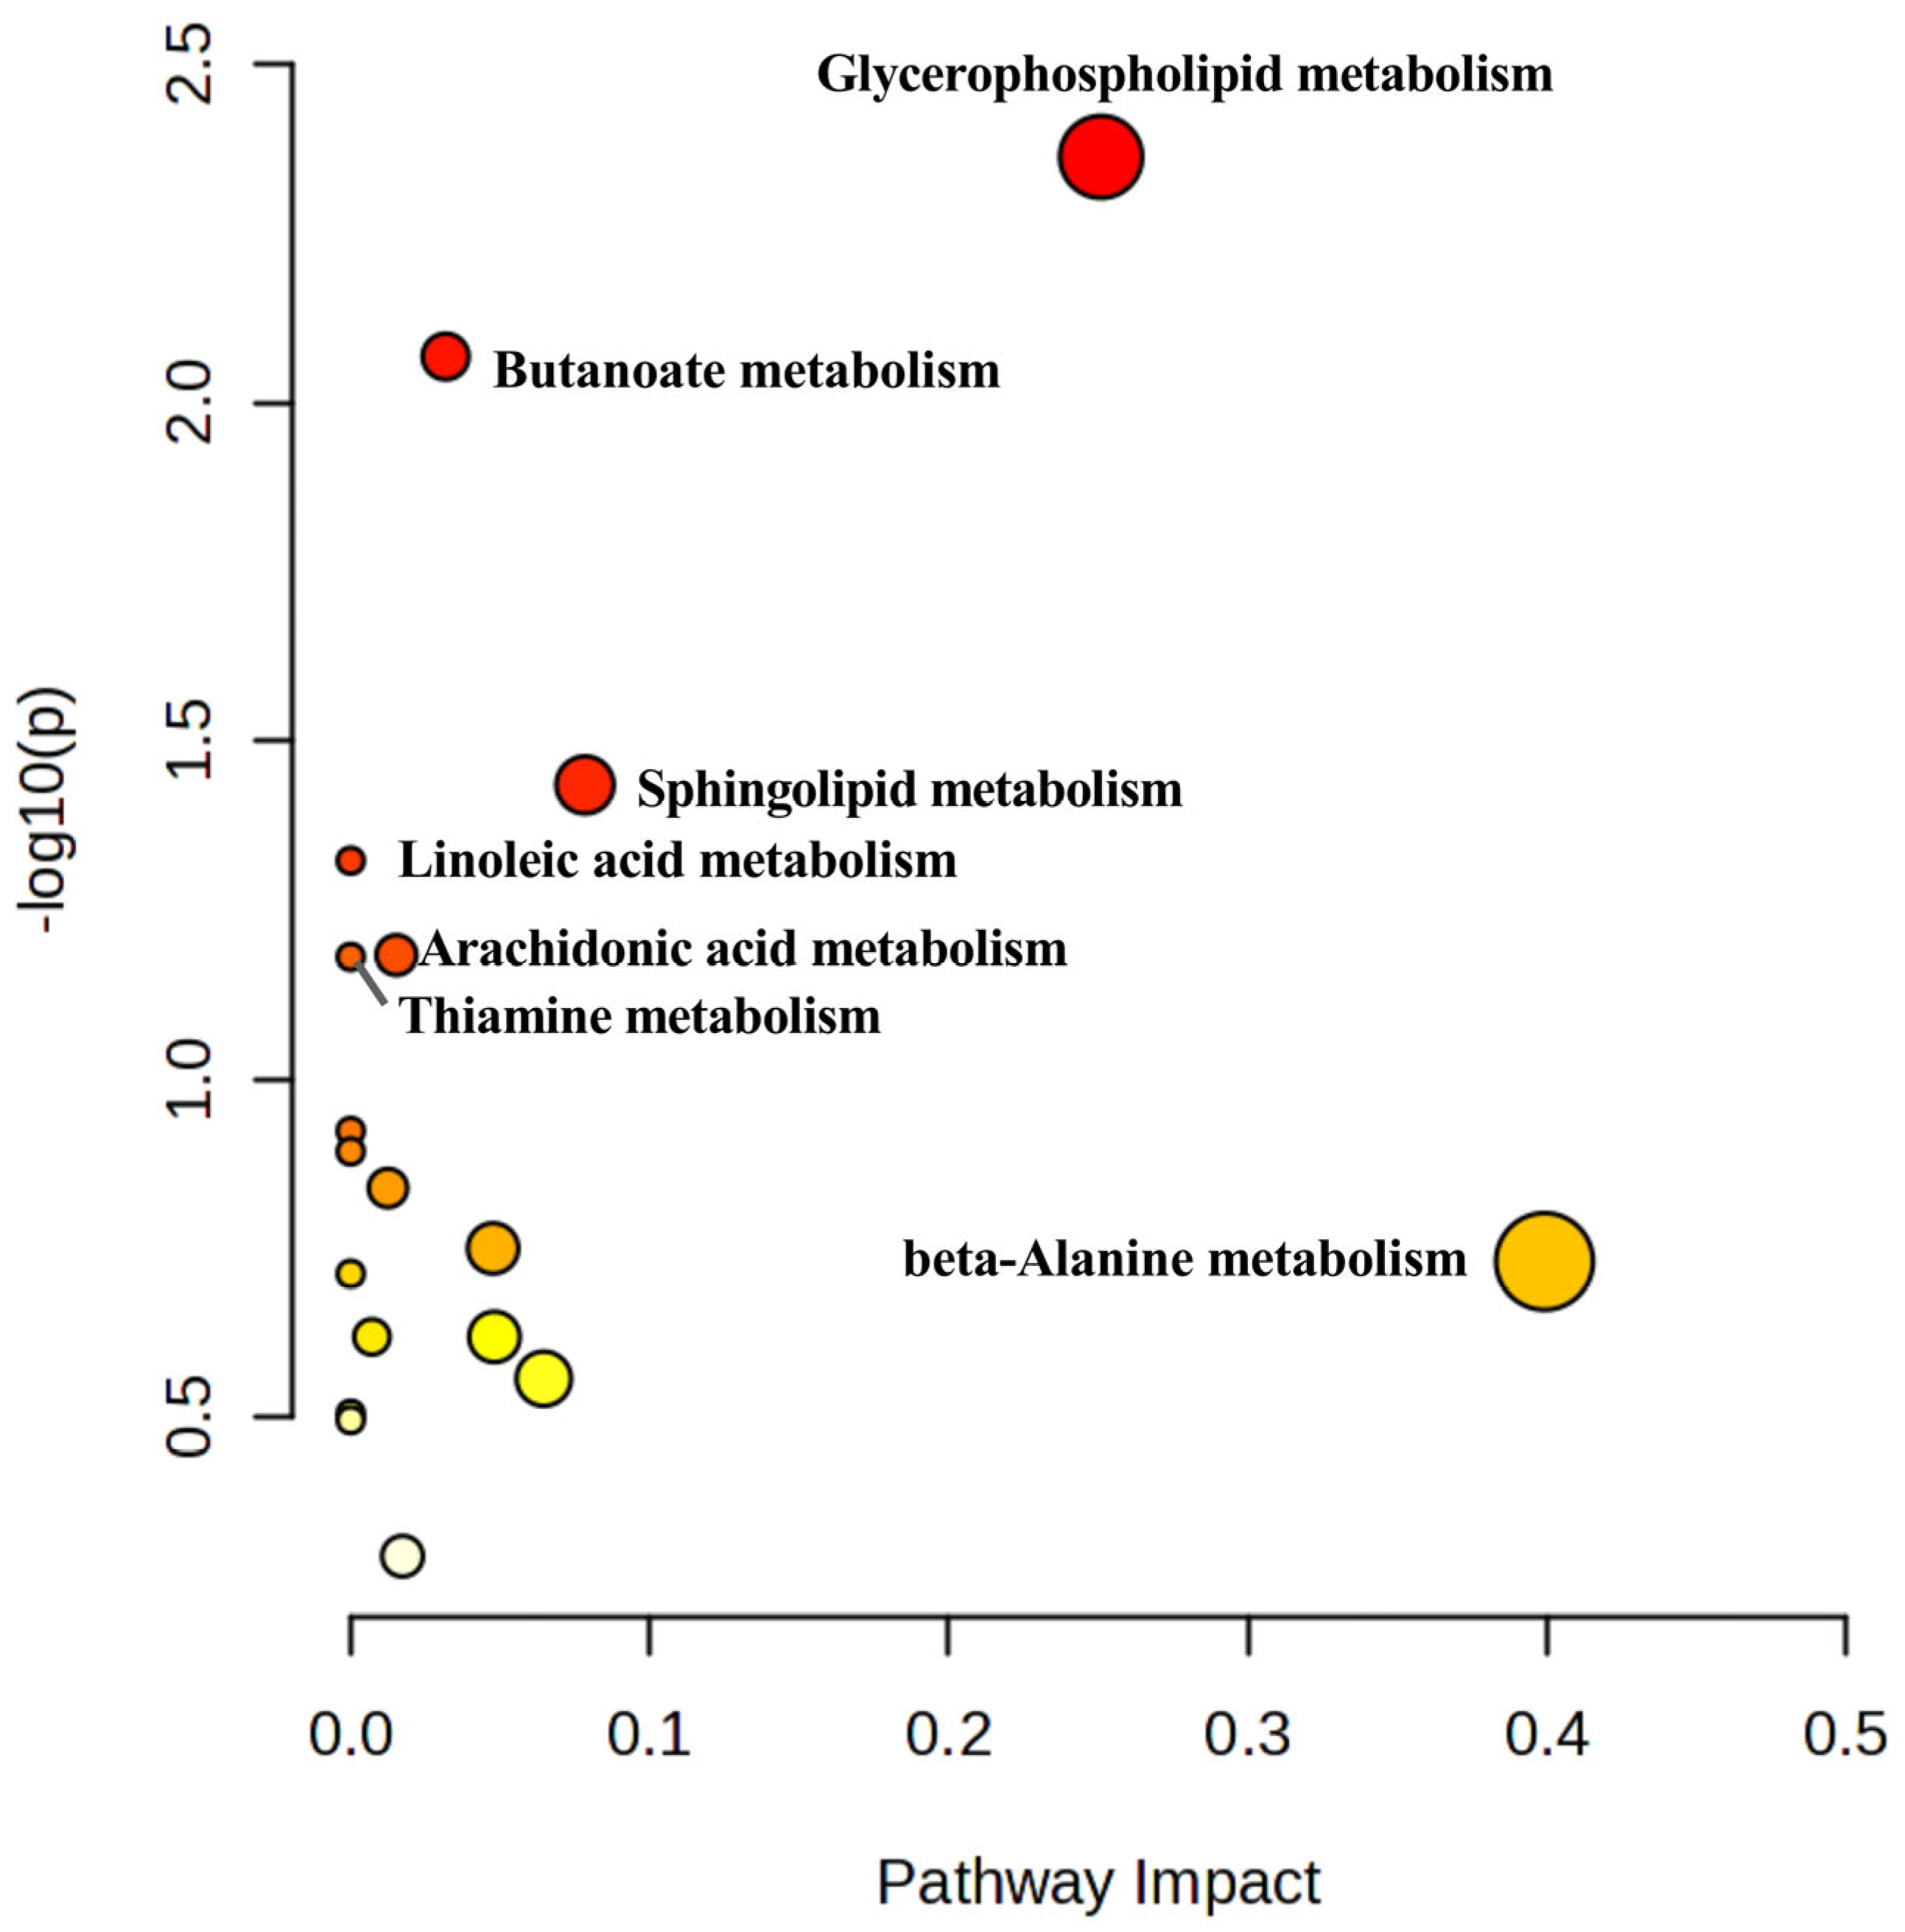
To elucidate the biological relevance of the 51 differential metabolites, an integrated KEGG enrichment analysis, including over-representation and topology analyses, was performed using MetaboAnalyst 5.0. Pathways with impact > 0.1 and p < 0.05 were considered relevant, yielding seven key pathways (Table 2). These included glycerophospholipid metabolism, butanoate metabolism, sphingolipid metabolism, linoleic acid metabolism, arachidonic acid metabolism, thiamine metabolism, and β-alanine metabolism (Figure 6).

3.4. Integrated Analysis of Metabolomics and Network Pharmacology

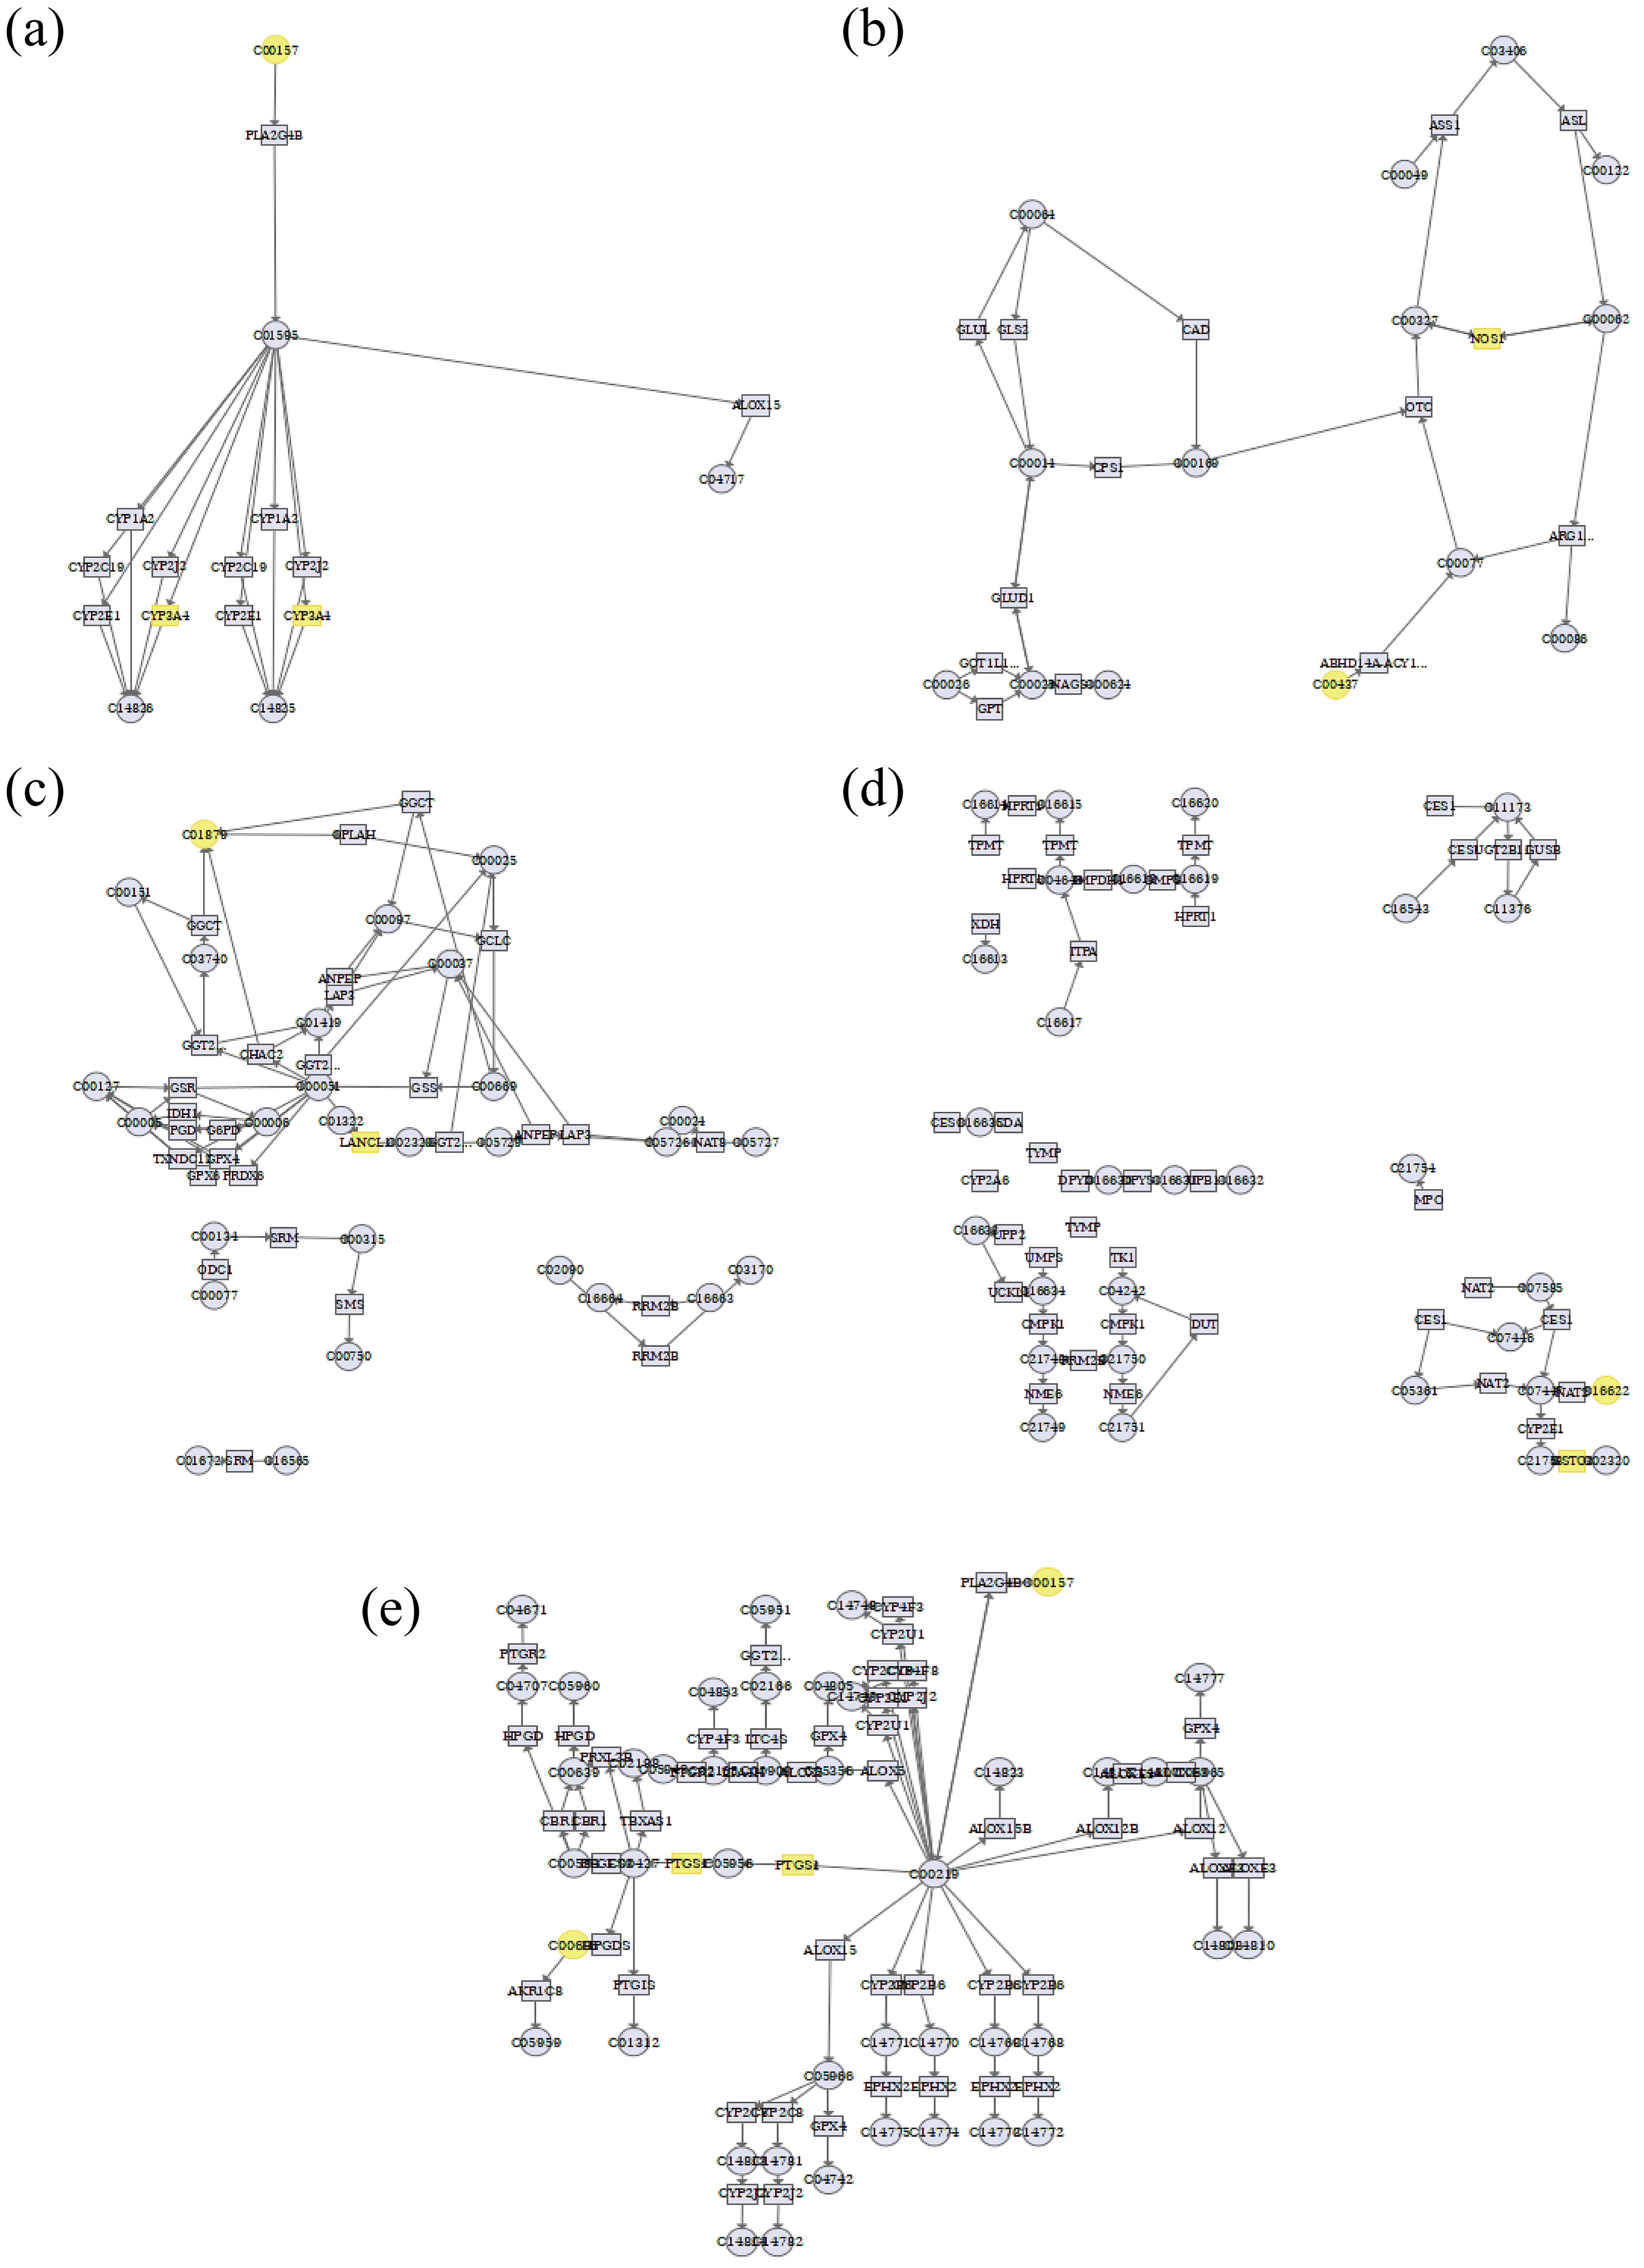
Differential metabolites and core targets identified by network pharmacology were uploaded to MetaboAnalyst 5.0 and subjected to Joint Pathway Analysis, which mapped both target sets onto KEGG pathways. Five common pathways emerged: linoleic acid metabolism, arginine biosynthesis, arachidonic acid metabolism, glutathione metabolism, and drug metabolism (Figure 7). CTS exerted its anti-platelet-aggregative effect primarily by modulating CYP3A4, NOS3, PTGS2, and GSTP1 within these five pathways (Table S3).

3.5. Analysis of Molecular Docking

CTS was docked against four core targets (CYP3A4, NOS3, PTGS2, and GSTP1) identified by integrated metabolomics and network pharmacology analysis using AutoDock Vina. The pose with the lowest binding energy was retained. Binding affinity was assessed using the calculated binding free energy, with more negative values indicating stronger ligand–receptor interactions. The resulting complexes were visualized in PyMOL 2.5.2 (Figure 8), where the dashed lines denote hydrogen bonds between the ligand and binding site residues. All four docking runs yielded binding energies lower than 9 kcal/mol. Table S4, demonstrating that CTS exhibits exceptionally high affinity for each of the identified targets.

4. Discussion

In this study, an adrenaline/ice-water-induced acute blood stasis model and platelet aggregation rates induced by AA and ADP were measured with turbidimetry. The acute blood stasis model effectively simulates an abnormal platelet aggregation state resulting from blood flow stagnation, reflecting the pathophysiological processes of platelet aggregation [25,26]. The results of this present study demonstrated that both aspirin and clopidogrel significantly inhibited AA- and ADP-induced platelet aggregation compared with the model group (p < 0.001). Specifically, aspirin exhibited a markedly superior inhibitory effect on AA-induced platelet aggregation compared to clopidogrel (p < 0.01), consistent with its known inhibitory mechanism: targeting the COX-1/TXA2 pathway [27]. In contrast, clopidogrel more effectively blocked ADP-induced aggregation (p < 0.01), aligning with its role as an irreversible P2Y12 receptor antagonist that blocks the ADP–P2Y12 signaling pathway [28]. However, CTS at medium and high doses significantly inhibited both AA- and ADP-induced platelet aggregation in a dose-dependent manner, suggesting its multi-pathway regulatory mechanism. Additionally, although early docking studies suggested that CTS might act as a Gi-coupled P2Y12 receptor antagonist, recent functional data have demonstrated that its anti-aggregatory effect is entirely independent of P2Y12 but is rather mediated by concurrent inhibition of the PI3K–AKT, MAPK, and STAT3 signaling networks [29,30].
Network pharmacology screening identified 15 core targets, providing clues for dissecting the multi-target characteristics of CTS. Untargeted metabolomics revealed 51 differential metabolites and seven key pathways, including glycerophospholipid, butanoate, and sphingolipid metabolism, which mirror the metabolic perturbations inherent in the acute blood stasis model. Integrative analysis cross-linked these two datasets and identified CYP3A4, NOS3, PTGS2, and GSTP1 as the four most relevant nodes governing the anti-platelet-aggregation effect. It must be emphasized that the four targets were not selected solely through computational prediction. Using MetaboAnalyst 5.0, we conducted a pathway-level integration of the 15 candidate proteins with the 51 CTS-modulated metabolites. The algorithm identifies metabolic pathways in which both (i) metabolites significantly reversed by CTS and (ii) the enzymes documented to catalyze these metabolites are concurrently enriched. Consequently, CYP3A4, NOS3, PTGS2, and GSTP1 surfaced from our omics dataset as the most proximal enzymatic nodes linking CTS intervention to the observed metabolic phenotype, thereby substantiating their candidacy as plausible mechanistic targets. Molecular-docking simulations showed strong binding energies between CTS and each of these targets (<−9 kcal/mol), indicating stable binding at the molecular level and implying potential inhibition or modulation of enzymatic activity. Such direct target engagement has been proposed to rebalance downstream metabolic circuits, ultimately converging on the observed anti-platelet-aggregation phenotype.
Linoleic acid, an essential ω-6 polyunsaturated fatty acid, is a structural component of membrane phospholipids and a key precursor of bioactive lipid mediators—including epoxy-octadecenoic acids (EpOMEs) and AA—which in turn modulate inflammation, vascular tone, and platelet aggregation [31,32]. In the present study, CTS restored the disrupted linoleic acid metabolism in rats with acute blood stasis. Molecular docking suggested a potential interaction with CYP3A4, a key enzyme in this pathway; however, whether CTS affects platelet function by regulating CYP3A4 and linoleic acid metabolism requires further verification. Based on this, it is hypothesized that CTS attenuates inflammation and improves vascular function, at least in part, by potentially suppressing the CYP3A4-mediated epoxy-ω-oxidation and modulating the formation of EpOMEs. This metabolic correction likely altered platelet membrane phospholipids, which can impair receptor localization and downstream signaling, thereby reducing platelet aggregation [33]. Therefore, CTS may jointly alleviate acute blood stasis by modulating bioactive lipid mediators and concomitantly remodeling the membrane phospholipid microenvironment.
Arginine is an immediate substrate for nitric oxide (NO) biosynthesis, and its bioavailability directly determines endothelial NO production [34]. NO synthase 3 (NOS3, also known as eNOS) catalyzes the conversion of L-arginine to NO, thereby maintaining vasodilation and suppressing platelet activation and aggregation [35]. Impaired arginine metabolism reduces NO generation and consequently favors platelet hyperreactivity [36]. Molecular docking analyses suggested that CTS interferes with NOS3, thereby attenuating L-arginine-to-NO conversion and ultimately inhibiting platelet aggregation.
AA metabolism constitutes a canonical signaling cascade in platelet activation, and the balance between its downstream products, thromboxane A2 (TXA2) and prostacyclin (PGI2), largely determines the extent of platelet aggregation [37]. However, the TXA2/PGI2 equilibrium is not governed solely by platelet COX-1 [38]. Under acute blood-stasis conditions, inflammatory cytokines markedly induce COX-2 expression in vascular endothelial and infiltrating immune cells, expanding the local prostaglandin H2 (PGH2) pool [39]. Excess PGH2 is preferentially channeled by thromboxane-A synthase (TXAS) toward TXA2 and, less efficiently converted to PGI2 by prostacyclin synthase (PGIS), thereby amplifying the pro-thrombotic milieu [40]. The present data demonstrate that CTS normalizes AA metabolite profiles in rats with experimentally induced acute blood stasis, integrative “metabolite-target” mapping identified PTGS2 (COX-2) as a key target, and molecular docking revealed a robust binding affinity of −10.5 kcal mol−1 between CTS and COX-2. These findings suggest that CTS attenuates platelet aggregation partly by inhibiting COX-2 activity, diminishing endothelial/inflammatory-cell-derived PGH2 formation, and consequently blunting paracrine TXA2 signaling.
Glutathione metabolism maintains cellular redox homeostasis, with the depletion of its metabolite, glutathione (GSH), precipitating reactive oxygen species (ROS) accumulation, endothelial injury, and platelet activation [41]. During acute blood stasis, severe oxidative stress consumes large amounts of GSH and markedly elevates intracellular ROS [42]. The ensuing GSH decline activates platelet NADPH oxidase (NOX) and phospholipase A2, thereby enhancing the generation of pro-aggregatory mediators, including TXA2 and 8-isoprostane. In the vascular endothelium, GSH modulates eNOS activity to augment NO production, thereby establishing a dual defense against platelet aggregation [43]. In the present study, GSTP1 was identified as a key target, and molecular docking suggests that CTS could potentiate GSTP1-mediated GSH regeneration, thereby reducing ROS-driven platelet activation and contributing an antioxidant component to its antiplatelet effect.
In addition to xenobiotic detoxification, drug-metabolizing enzymes modulate platelet function by processing endogenous substrates such as AA. Integrative profiling highlighted GSTP1 in the “drug metabolism—other enzymes” category [44]. Docking simulations revealed a robust binding between CTS and GSTP1, implying that CTS regulates GSTP1-driven phase II metabolism and glutathione conjugation. This interaction can simultaneously alter detoxification efficiency and redox homeostasis, thereby indirectly restraining platelet activation and aggregation.
Although the integrated network pharmacology and metabolomics in this study revealed multiple CTS targets, functional validations are needed to confirm their contribution to platelet inhibition. Future work should focus on directly testing this multi-target hypothesis through in vitro and in vivo experiments designed to measure the functional impact of CTS on the activity and expression of CYP3A4, NOS3, PTGS2, and GSTP1.

5. Conclusions

By integrating network pharmacology with untargeted metabolomics, we identified that CTS simultaneously targets CYP3A4, NOS3, PTGS2, and GSTP1, thereby reprogramming arachidonic acid and glutathione metabolism and suppressing platelet aggregation at multiple nodes. This mechanism explains its therapeutic efficacy in the acute blood stasis rat model and provides quantifiable metabolic biomarkers for dose optimization. Collectively, CTS represents a promising multi-target antiplatelet agent; however, the target-specific functions require experimental validation.

Supplementary Materials

The following supporting information can be downloaded at: https://www.mdpi.com/article/10.3390/cimb47110953/s1.

Author Contributions

Conceptualization, X.T. and J.F.; methodology, J.H. and Z.L.; software, B.W. and H.Q.; validation, J.H. and Z.L.; formal analysis, Q.C. and J.X.; investigation, S.L.,T.X., and X.S.; resources, J.F. and L.W.; data curation, J.H. and Z.L.; writing—original draft preparation, J.H.; writing—review and editing, X.T. and Z.L.; visualization, Y.S. and W.J.; supervision, X.T. and J.F.; project administration, X.T. and J.F.; funding acquisition, X.T. and J.F. All authors have read and agreed to the published version of the manuscript.

Funding

This research was funded by the National Natural Science Foundation of China (Grant Nos. 81860711 and 82560823), the Natural Science Foundation of Guangxi Province (Grant No. 2018GXNSFBA281034), the 2024 Innovation and Entrepreneurship Training Program for College Students of Guangxi Zhuang Autonomous Region (Grant No. S202410600066), the Independent Research Program of Guangxi Key Laboratory of Traditional Chinese Medicine Quality Standards (Grant No. 202504), and the Third Batch of High-Level Talent Team Cultivation Program of the “Qi Huang Project” of Guangxi University of Chinese Medicine (Grant No. 202406).

Institutional Review Board Statement

The animal study protocol was approved by the Experimental Animal Management and Ethics Committee of Guangxi University of Chinese Medicine (Approval No: SYXK-2019-0001; Approval date: 1 November 2019), and was conducted in compliance with the principles of animal protection, welfare, and ethics.

Informed Consent Statement

Not applicable.

Data Availability Statement

The data presented in this study are available on request from the corresponding author. The data are not publicly available due to privacy or ethical restrictions.

Conflicts of Interest

The authors declare no conflicts of interest.

Abbreviations

The following abbreviations are used in this manuscript:
CTSCryptotanshinone
AAArachidonic acid
ADPAdenosine diphosphate
LBClopidogrel (positive control group)
PPIProtein-protein interaction
GOGene Ontology
KEGGKyoto Encyclopedia of Genes and Genomes
BPBiological process
CCCellular component
MFMolecular function
QCQuality control
PCAPrincipal component analysis
OPLS-DAOrthogonal partial least squares discriminant analysis
HMDBHuman Metabolome Database
EpOMEsEpoxy-octadecenoic acids
NOXNADPH oxidase

References

  1. Jackson, S.P. The Growing Complexity of Platelet Aggregation. Blood 2007, 109, 5087–5095. [Google Scholar] [CrossRef] [PubMed]
  2. Vaduganathan, M.; Mensah, G.A.; Turco, J.V.; Fuster, V.; Roth, G.A. The Global Burden of Cardiovascular Diseases and Risk. JACC 2022, 80, 2361–2371. [Google Scholar] [CrossRef] [PubMed]
  3. Coenen, D.M.; Heinzmann, A.C.A.; Karel, M.F.A.; Cosemans, J.M.E.M.; Koenen, R.R. The Multifaceted Contribution of Platelets in the Emergence and Aftermath of Acute Cardiovascular Events. Atherosclerosis 2021, 319, 132–141. [Google Scholar] [CrossRef] [PubMed]
  4. Patrono, C.; Morais, J.; Baigent, C.; Collet, J.-P.; Fitzgerald, D.; Halvorsen, S.; Rocca, B.; Siegbahn, A.; Storey, R.F.; Vilahur, G. Antiplatelet Agents for the Treatment and Prevention of Coronary Atherothrombosis. J. Am. Coll. Cardiol. 2017, 70, 1760–1776. [Google Scholar] [CrossRef]
  5. Pereira, N.L.; Cresci, S.; Angiolillo, D.J.; Batchelor, W.; Capers, Q.; Cavallari, L.H.; Leifer, D.; Luzum, J.A.; Roden, D.M.; Stellos, K.; et al. CYP2C19 Genetic Testing for Oral P2Y12 Inhibitor Therapy: A Scientific Statement From the American Heart Association. Circulation 2024, 150, e129–e150. [Google Scholar] [CrossRef]
  6. Mahady, S.E.; Margolis, K.L.; Chan, A.; Polekhina, G.; Woods, R.L.; Wolfe, R.; Nelson, M.R.; Lockery, J.E.; Wood, E.M.; Reid, C.; et al. Major GI Bleeding in Older Persons Using Aspirin: Incidence and Risk Factors in the ASPREE Randomised Controlled Trial. Gut 2021, 70, 717–724. [Google Scholar] [CrossRef]
  7. Wang, J.; Zou, J.; Shi, Y.; Zeng, N.; Guo, D.; Wang, H.; Zhao, C.; Luan, F.; Zhang, X.; Sun, J. Traditional Chinese Medicine and Mitophagy: A Novel Approach for Cardiovascular Disease Management. Phytomedicine 2024, 128, 155472. [Google Scholar] [CrossRef]
  8. Hou, Y.; Li, H.; Zhu, L.; Li, Y.; Zeng, Y.; Quan, T.; Xiang, Z.; Zhang, Y.; Bian, Y.; Wei, Y. A Review of Natural Compounds to Regulate Platelet Aggregation: Molecular Mechanism and Research Advance. Front. Pharmacol. 2025, 16, 1537776. [Google Scholar] [CrossRef]
  9. Xin, Q.-Q.; Chen, X.; Yuan, R.; Yuan, Y.-H.; Hui, J.-Q.; Miao, Y.; Cong, W.-H.; Chen, K.-J. Correlation of Platelet and Coagulation Function with Blood Stasis Syndrome in Coronary Heart Disease: A Systematic Review and Meta-Analysis. Chin. J. Integr. Med. 2021, 27, 858–866. [Google Scholar] [CrossRef]
  10. Lan, T.; Yu, D.; Zhao, Q.; Qu, C.; Wu, Q. Ethnomedicine, Phytochemistry, Pharmacology, Pharmacokinetics, and Clinical Application of Salvia miltiorrhiza Bunge (Lamiaceae): A Comprehensive Review. J. Ethnopharmacol. 2025, 350, 120032. [Google Scholar] [CrossRef]
  11. Chen, W.; Chen, G. Danshen (Salvia miltiorrhiza Bunge): A Prospective Healing Sage for Cardiovascular Diseases. Curr. Pharm. Des. 2017, 23, 5125–5135. [Google Scholar] [CrossRef]
  12. Li, H.; Gao, C.; Liu, C.; Liu, L.; Zhuang, J.; Yang, J.; Zhou, C.; Feng, F.; Sun, C.; Wu, J. A Review of the Biological Activity and Pharmacology of Cryptotanshinone, an Important Active Constituent in Danshen. Biomed. Pharmacother. 2021, 137, 111332. [Google Scholar] [CrossRef]
  13. Zheng, Z.; Ke, L.; Ye, S.; Shi, P.; Yao, H. Pharmacological Mechanisms of Cryptotanshinone: Recent Advances in Cardiovascular, Cancer, and Neurological Disease Applications. Drug Des. Devel Ther. 2024, 18, 6031–6060. [Google Scholar] [CrossRef]
  14. Liu, Z.; Shi, Z.; Tu, C.; Zhang, H.; Gao, D.; Li, C.; He, Q.; Li, R.; Guo, Y.; Niu, M.; et al. An Activity-Calibrated Chemical Standardization Approach for Quality Evaluation of Salvia miltiorrhiza Bge. RSC Adv. 2017, 7, 5331–5339. [Google Scholar] [CrossRef]
  15. Nie, Z.-Y.; Zhang, J.-Q.; Shen, Y.-J.-Y.; Xi, J.-Q.; Cao, Y.-B.; Zhang, L.-C.; Li, L. Natural Active Herbal Monomers for the Treatment of Thromboembolic Diseases: A Review. Front. Pharmacol. 2025, 16, 1607415. [Google Scholar] [CrossRef]
  16. Li, J.; Liu, H.; Yang, Z.; Yu, Q.; Zhao, L.; Wang, Y. Synergistic Effects of Cryptotanshinone and Senkyunolide I in Guanxinning Tablet Against Endogenous Thrombus Formation in Zebrafish. Front. Pharmacol. 2020, 11, 622787. [Google Scholar] [CrossRef]
  17. Lin, A.X.; Chan, G.; Hu, Y.; Ouyang, D.; Ung, C.O.L.; Shi, L.; Hu, H. Internationalization of Traditional Chinese Medicine: Current International Market, Internationalization Challenges and Prospective Suggestions. Chin. Med. 2018, 13, 9. [Google Scholar] [CrossRef]
  18. Singh, R.; Sahu, N.; Tyagi, R.; Alam, P.; Akhtar, A.; Walia, R.; Chandra, A.; Madan, S. Integrative Network Pharmacology, Molecular Docking, and Dynamics Simulations Reveal the Mechanisms of Cinnamomum tamala in Diabetic Nephropathy Treatment: An In Silico Study. Curr. Issues Mol. Biol. 2024, 46, 11868–11889. [Google Scholar] [CrossRef]
  19. Zhang, Y.; Zhao, Z.; Li, W.; Tang, Y.; Wang, S. Mechanism of Taxanes in the Treatment of Lung Cancer Based on Network Pharmacology and Molecular Docking. Curr. Issues Mol. Biol. 2023, 45, 6564–6582. [Google Scholar] [CrossRef]
  20. Cui, L.; Lu, H.; Lee, Y.H. Challenges and Emergent Solutions for LC-MS/MS Based Untargeted Metabolomics in Diseases. Mass. Spectrom. Rev. 2018, 37, 772–792. [Google Scholar] [CrossRef]
  21. Zhang, Y.; Li, H.; Liu, X.; Wang, Q.; Zhao, D.; Su, M.; Jia, Z.; Shen, S. Integrating Metabolomics and Network Pharmacology to Decipher the Hepatoprotective Effect Mechanisms of Magnesium Isoglycyrrhizinate Injection. Curr. Issues Mol. Biol. 2024, 46, 279–298. [Google Scholar] [CrossRef]
  22. Huang, S.; Xu, F.; Wang, Y.-Y.; Shang, M.-Y.; Wang, C.-Q.; Wang, X.; Cai, S.-Q. Improvement and Application of Acute Blood Stasis Rat Model Aligned with the 3Rs (Reduction, Refinement and Replacement) of Humane Animal Experimentation. Chin. J. Integr. Med. 2020, 26, 292–298. [Google Scholar] [CrossRef]
  23. Le Blanc, J.; Mullier, F.; Vayne, C.; Lordkipanidzé, M. Advances in Platelet Function Testing-Light Transmission Aggregometry and Beyond. J. Clin. Med. 2020, 9, 2636. [Google Scholar] [CrossRef] [PubMed]
  24. Wadowski, P.P.; Eichelberger, B.; Kopp, C.W.; Pultar, J.; Seidinger, D.; Koppensteiner, R.; Lang, I.M.; Panzer, S.; Gremmel, T. Disaggregation Following Agonist-Induced Platelet Activation in Patients on Dual Antiplatelet Therapy. J. Cardiovasc. Transl. Res. 2017, 10, 359–367. [Google Scholar] [CrossRef] [PubMed]
  25. Zhang, J.-X.; Feng, Y.; Zhang, Y.; Liu, Y.; Li, S.-D.; Yang, M.-H. Hemorheology Index Changes in a Rat Acute Blood Stasis Model: A Systematic Review and Meta-Analysis. Afr. J. Tradit. Complement. Altern. Med. 2017, 14, 96–107. [Google Scholar] [CrossRef]
  26. Zhang, J.; Feng, Y.; Li, S.; Liu, Y.; Zhang, Y.; Guo, Y.; Yang, M. Microvascular Pathological Features and Changes in Related Injury Factors in a Rat Acute Blood Stasis Model. J. Tradit. Chin. Med. 2017, 37, 108–115. [Google Scholar] [CrossRef]
  27. Undas, A.; Brummel-Ziedins, K.E.; Mann, K.G. Antithrombotic Properties of Aspirin and Resistance to Aspirin: Beyond Strictly Antiplatelet Actions. Blood 2007, 109, 2285–2292. [Google Scholar] [CrossRef]
  28. Weber, A.A.; Reimann, S.; Schrör, K. Specific Inhibition of ADP-Induced Platelet Aggregation by Clopidogrel in Vitro. Br. J. Pharmacol. 1999, 126, 415–420. [Google Scholar] [CrossRef]
  29. Maione, F.; Cantone, V.; Chini, M.G.; De Feo, V.; Mascolo, N.; Bifulco, G. Molecular Mechanism of Tanshinone IIA and Cryptotanshinone in Platelet Anti-Aggregating Effects: An Integrated Study of Pharmacology and Computational Analysis. Fitoterapia 2015, 100, 174–178. [Google Scholar] [CrossRef]
  30. Xiao, Y.; Zhang, R.; Hua, C.; Wu, M.; Yuan, Y.; Zhang, L.; Guo, F.; Liu, J.; Yang, Z.; Liu, G. P2Y12 Receptor-Independent Antiplatelet Mechanism of Cryptotanshinone: Network Pharmacology and Experimental Validation of Multi-Target Signaling Pathways. J. Ethnopharmacol. 2025, 341, 119321. [Google Scholar] [CrossRef]
  31. Hildreth, K.; Kodani, S.D.; Hammock, B.D.; Zhao, L. Cytochrome P450-Derived Linoleic Acid Metabolites EpOMEs and DiHOMEs: A Review of Recent Studies. J. Nutr. Biochem. 2020, 86, 108484. [Google Scholar] [CrossRef]
  32. Jeong, H.Y.; Moon, Y.S.; Cho, K.K. ω-6 and ω-3 Polyunsaturated Fatty Acids: Inflammation, Obesity and Foods of Animal Resources. Food Sci. Anim. Resour. 2024, 44, 988–1010. [Google Scholar] [CrossRef]
  33. Octave, M.; Pirotton, L.; de Cartier d’Yves, E.; Marino, A.; Ambroise, J.; Giera, M.; Guigas, B.; Ginion, A.; Robaux, V.; Kuijpers, M.; et al. Deleting ACC1 in Platelets Alters Phospholipidome and Reduces Platelet Activation and Thrombosis in Mice. Blood Adv. 2025, 9, 4553–4567. [Google Scholar] [CrossRef] [PubMed]
  34. Chen, W.-H.; Chen, C.-H.; Hsu, M.-C.; Chang, R.-W.; Wang, C.-H.; Lee, T.-S. Advances in the Molecular Mechanisms of Statins in Regulating Endothelial Nitric Oxide Bioavailability: Interlocking Biology between eNOS Activity and L-Arginine Metabolism. Biomed. Pharmacother. 2024, 171, 116192. [Google Scholar] [CrossRef] [PubMed]
  35. Gawrys, J.; Gajecki, D.; Szahidewicz-Krupska, E.; Doroszko, A. Intraplatelet L-Arginine-Nitric Oxide Metabolic Pathway: From Discovery to Clinical Implications in Prevention and Treatment of Cardiovascular Disorders. Oxid. Med. Cell Longev. 2020, 2020, 1015908. [Google Scholar] [CrossRef] [PubMed]
  36. Erens, C.; Van Broeckhoven, J.; Bronckaers, A.; Lemmens, S.; Hendrix, S. The Dark Side of an Essential Amino Acid: L-Arginine in Spinal Cord Injury. J. Neurotrauma 2023, 40, 820–832. [Google Scholar] [CrossRef]
  37. Wang, B.; Wu, L.; Chen, J.; Dong, L.; Chen, C.; Wen, Z.; Hu, J.; Fleming, I.; Wang, D.W. Metabolism Pathways of Arachidonic Acids: Mechanisms and Potential Therapeutic Targets. Signal Transduct. Target. Ther. 2021, 6, 94. [Google Scholar] [CrossRef]
  38. Cheng, Y.; Austin, S.C.; Rocca, B.; Koller, B.H.; Coffman, T.M.; Grosser, T.; Lawson, J.A.; FitzGerald, G.A. Role of Prostacyclin in the Cardiovascular Response to Thromboxane A2. Science 2002, 296, 539–541. [Google Scholar] [CrossRef]
  39. Li, L.; Sluter, M.N.; Yu, Y.; Jiang, J. Prostaglandin E Receptors as Targets for Ischemic Stroke: Novel Evidence and Molecular Mechanisms of Efficacy. Pharmacol. Res. 2021, 163, 105238. [Google Scholar] [CrossRef]
  40. Ershov, P.V.; Yablokov, E.O.; Mezentsev, Y.V.; Ivanov, A.S. Human Prostacyclin and Thromboxane Synthases: Molecular Interactions, Regulation, and Pharmacology. Biochimie 2025, 234, 76–88. [Google Scholar] [CrossRef]
  41. Li, W.; Busu, C.; Circu, M.L.; Aw, T.Y. Glutathione in Cerebral Microvascular Endothelial Biology and Pathobiology: Implications for Brain Homeostasis. Int. J. Cell Biol. 2012, 2012, 434971. [Google Scholar] [CrossRef]
  42. Arrivi, A.; Barillà, F.; Carnevale, R.; Sordi, M.; Pucci, G.; Tanzilli, G.; Prandi, F.R.; Mangieri, E. Protective Biomolecular Mechanisms of Glutathione Sodium Salt in Ischemia-Reperfusion Injury in Patients with Acute Coronary Syndrome-ST-Elevation Myocardial Infarction. Cells 2022, 11, 3964. [Google Scholar] [CrossRef]
  43. Kim, M.E.; Lee, J.S. Advances in the Regulation of Inflammatory Mediators in Nitric Oxide Synthase: Implications for Disease Modulation and Therapeutic Approaches. Int. J. Mol. Sci. 2025, 26, 1204. [Google Scholar] [CrossRef]
  44. Wei, C.; Wang, M.; Wang, X.-J. Evolutionary Conservation Analysis of Human Arachidonic Acid Metabolism Pathway Genes. Life Med. 2023, 2, lnad004. [Google Scholar] [CrossRef]
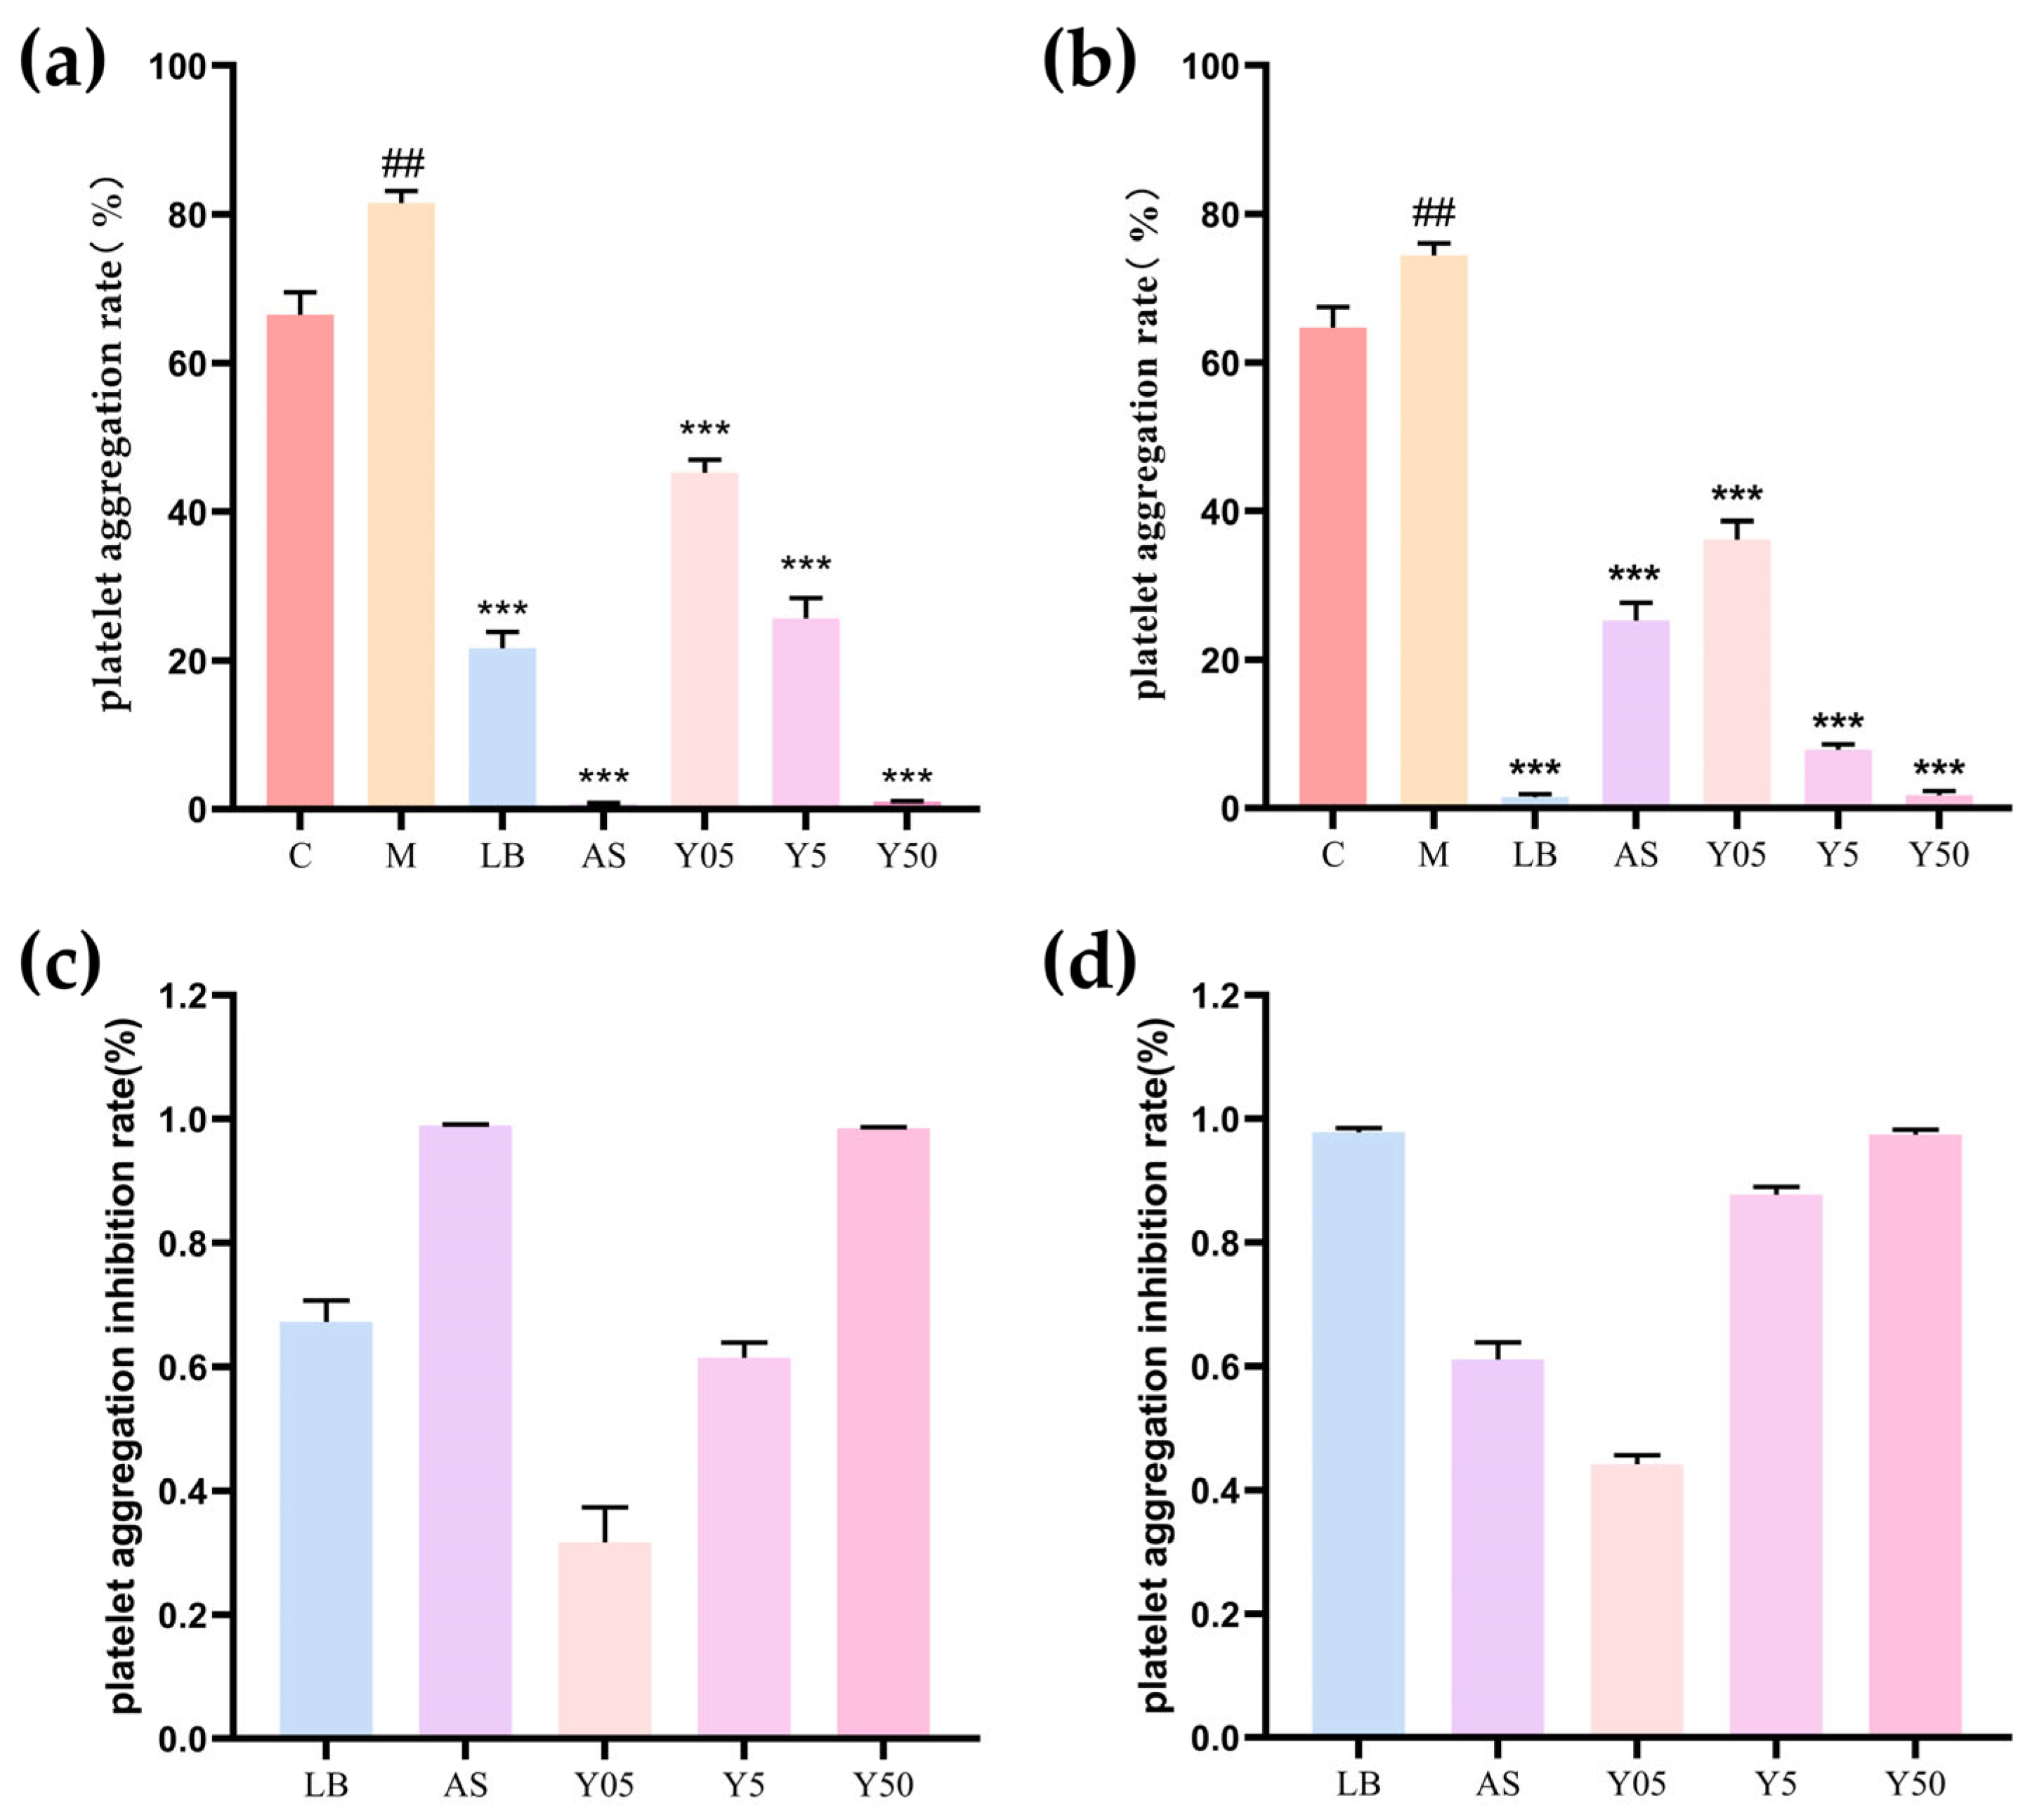
Figure 1. Platelet aggregation rates. (a) Platelet aggregation rates among groups induced by AA. (b) Platelet aggregation rates among groups induced by ADP. (c) Platelet aggregation inhibition rates induced by AA among all groups. (d) Platelet aggregation inhibition rates induced by ADP among all groups. ## indicates M group vs. C group, p < 0.01; *** indicates treatment group vs. M group, p < 0.001.
Cimb 47 00953 g001
Figure 2. Network-pharmacology analysis. (a) Venn diagram of CTS and antiplatelet -aggregation targets. (b) PPI network of the intersecting targets. (c) GO enrichment analysis. (d) Sankey bubble plot of KEGG pathways.
Cimb 47 00953 g002
Figure 3. EIC and PCA score plots. (a) EIC of the internal standard in QC samples; (b) One-dimensional PCA-X distribution of QC samples; (c) PCA score plot of samples from all groups and QC replicates.
Cimb 47 00953 g003
Figure 4. OPLS-DA score plots and permutation test scatter plots of rat serum metabolites in positive and negative ion modes. (a) C group vs. M group; (b) M group vs. Y05 group; (c) M group vs. Y5 group; (d) M group vs. Y50 group.
Cimb 47 00953 g004
Figure 5. Heatmap of unsupervised clustering of 51 serum metabolic biomarkers.
Cimb 47 00953 g005
Figure 6. Enrichment of potential biomarker metabolic pathways.
Cimb 47 00953 g006
Figure 7. (a) Linoleic acid metabolism; (b) Arginine biosynthesis; (c) Glutathione metabolism; (d) Drug metabolism—other enzymes; (e) Arachidonic acid metabolism.
Cimb 47 00953 g007
Figure 8. Molecular docking models. (a) CTS–CYP3A4; (b) CTS–GSTP1; (c) CTS–NOS3; (d) CTS–PTGS2. In the detailed view, green = ligand (cryptotanshinone), blue = receptor residues, dashed lines = hydrogen bonds.
Cimb 47 00953 g008
Table 1. Potential platelet aggregation-related differential metabolites significantly modulated by CTS.
NO.RT (s)m/zHMDB IDMetaboliteClassificationLon ModeTrend
C vs. MM vs. Y05M vs. Y5M vs. Y50
1217.5330101.0241HMDB0001259Succinic acid semialdehydeBNRG--
2431.1600682.2992HMDB0040384Neoacrimarine ABPOS-
3216.8970435.2512HMDB0007855LysoPA(18:1(9Z)/0:0)ANRG--
478.9896147.0117HMDB00015532-Oxo-4-methylthiobutanoic acidBNRG--
5160.3015840.6418HMDB0008277PC(20:0/20:3(5Z,8Z,11Z))APOS-
6166.0875718.5734HMDB0007994PC(16:0/P-16:0)APOS
7407.2230217.1174HMDB0038239Sakacin PBPOS
8286.5010103.0398HMDB00003573-Hydroxybutyric acidBNRG--
9197.6575813.6816HMDB0012107SM(d18:1/24:1(15Z))APOS
10347.4185115.0512HMDB0060496N,N′-DiacetylhydrazineBNRG
11248.1410215.0725HMDB0013989O-DesmethylnaproxenBNRG--
12308.3890203.0517HMDB0012326L-GuloseBPOS--
13291.6910198.1228HMDB0029422L-Histidine trimethylbetaineBPOS
14155.2270856.5802HMDB0008737PC(22:6(4Z,7Z,10Z,13Z,16Z,19Z)/20:3(5Z,8Z,11Z))APOS--
15293.1655140.1176HMDB0033438Na,Na-DimethylhistamineBPOS
16355.6875265.1105HMDB0000235ThiamineBPOS-
17206.5500608.4628HMDB0010405LysoPC(24:0)APOS-
18198.0780799.6664HMDB0011696SM(d17:1/24:1(15Z))APOS
19205.1945636.4930HMDB0029205lysoPC(26:0)APOS
20379.5950219.0842HMDB0029592TriacetinBPOS-
21214.6055117.0554HMDB00007543-Hydroxyisovaleric acidBNRG--
22153.9160854.5663HMDB0008739PC(22:6(4Z,7Z,10Z,13Z,16Z,19Z)/20:4(5Z,8Z,11Z,14Z))APOS--
23168.0830748.5792HMDB0008033PC(18:0/15:0)APOS
24221.2975809.5157HMDB0009778PI(16:0/16:0)ANRG
25290.7780223.1066HMDB0028848Glycyl-PhenylalanineBPOS
26373.0340175.1067HMDB0003357N-AcetylornithineBPOS--
27151.9330125.0703HMDB00401432-Methoxy-6-methylpyrazineBPOS--
28198.3560801.6802HMDB0011695SM(d17:1/24:0)APOS
29232.7680107.0488HMDB0006115BenzaldehydeBPOS--
30380.670588.0403HMDB0000056beta-AlanineBNRG--
31101.5005130.0856HMDB00294442-Pyrrolidineacetic acidBPOS--
32313.2795179.0555HMDB0062538Fructose-1PBNRG--
33169.9790136.0612HMDB0000034AdenineBPOS-
34394.3850231.1329HMDB0028876Hydroxyprolyl-ValineBPOS-
3552.7136130.0856HMDB00596493-AcetamidobutanalBPOS--
36404.3080189.0861HMDB0006029N-AcetylglutamineBPOS
37197.0020424.3403HMDB0006469Linoleyl carnitineAPOS-
3828.4327907.2543HMDB0041291r-ViniferinBPOS
3945.2212351.2199HMDB0001403Prostaglandin D2ANRG
4045.7435241.2167HMDB0000826Pentadecanoic acidBNRG--
41150.6600162.0654HMDB00348884-Acetylimidazo[4,5-c]pyridineBPOS--
42211.7070242.1124HMDB00022245-MethyldeoxycytidineBPOS--
43215.8790190.0536HMDB0011745N-Acetyl-L-methionineBNRG--
4442.3529302.3035HMDB0000269SphinganineAPOS-
45316.9175187.1067HMDB0029010Prolyl-AlanineBPOS-
46272.4340130.0492HMDB0000805Pyrrolidonecarboxylic acidBPOS-
4728.5982759.2177HMDB0034569Rubrofusarin 6-[glucosyl-(1->3)-glucosyl-(1->6)-glucoside]BPOS
48156.3890796.6173HMDB0008423PC(20:3(8Z,11Z,14Z)/P-18:0)APOS--
49198.7930785.6506HMDB0011694SM(d16:1/24:1(15Z))APOS
50199.5415787.6648HMDB0012103SM(d18:1/22:0)APOS
51153.3870894.6874HMDB0008643PC(22:4(7Z,10Z,13Z,16Z)/22:0)APOS--
↑ indicates significant up-regulation, ↓ indicates significant down-regulation, and - indicates not detected. A represents platelet-directly related metabolites; B represents non-specific metabolites.
Table 2. Metabolic pathways enriched by potential biomarkers and related information.
Pathway NameTotalHitspFDRImpact
Glycerophospholipid metabolism3630.004340.342380.25096
Butanoate metabolism1520.008560.342380.03175
Sphingolipid metabolism3220.0367660.880180.07838
Linoleic acid metabolism510.047580.880180
Arachidonic acid metabolism4420.0655890.880180.01528
Thiamine metabolism710.0660140.880180
beta-Alanine metabolism2110.1860210.39925
Disclaimer/Publisher’s Note: The statements, opinions and data contained in all publications are solely those of the individual author(s) and contributor(s) and not of MDPI and/or the editor(s). MDPI and/or the editor(s) disclaim responsibility for any injury to people or property resulting from any ideas, methods, instructions or products referred to in the content.