Article

HDAC9 and miR-512 Regulate CAGE-Promoted Anti-Cancer Drug Resistance and Cellular Proliferation

Department of Biochemistry, College of Natural Sciences, Kangwon National University, Chuncheon 24341, Republic of Korea
*
Author to whom correspondence should be addressed.
Curr. Issues Mol. Biol. 2024, 46(6), 5178-5193; https://doi.org/10.3390/cimb46060311
Submission received: 11 April 2024 / Revised: 21 May 2024 / Accepted: 22 May 2024 / Published: 24 May 2024
(This article belongs to the Section Biochemistry, Molecular and Cellular Biology)

Abstract

:
Histone deacetylase 9 (HDAC9) is known to be upregulated in various cancers. Cancer-associated antigens (CAGEs) are cancer/testis antigens that play an important role in anti-cancer drug resistance. This study aimed to investigate the relationship between CAGEs and HDAC9 in relation to anti-cancer drug resistance. AGSR cells with an anti-cancer drug-resistant phenotype showed higher levels of CAGEs and HDAC9 than normal AGS cells. CAGEs regulated the expression of HDAC9 in AGS and AGSR cells. CAGEs directly regulated the expression of HDAC9. Rapamycin, an inducer of autophagy, increased HDAC9 expression in AGS, whereas chloroquine decreased HDAC9 expression in AGSR cells. The downregulation of HDAC9 decreased the autophagic flux, invasion, migration, and tumor spheroid formation potential in AGSR cells. The TargetScan analysis predicted that miR-512 was a negative regulator of HDAC9. An miR-512 mimic decreased expression levels of CAGEs and HDAC9. The miR-512 mimic also decreased the autophagic flux, invasion, migration, and tumor spheroid forming potential of AGSR cells. The culture medium of AGSR increased the expression of HDAC9 and autophagic flux in AGS. A human recombinant CAGE protein increased HDAC9 expression in AGS cells. AGSR cells displayed higher tumorigenic potential than AGS cells. Altogether, our results show that CAGE–HDAC9–miR-512 can regulate anti-cancer drug resistance, cellular proliferation, and autophagic flux. Our results can contribute to the understanding of the molecular roles of HDAC9 in anti-cancer drug resistance.

Graphical Abstract

1. Introduction

Cancer-associated antigens (CAGEs) are first identified in the sera of patients with gastric cancer [1]. It was then detected in the sera of patients with various other cancers [2,3]. CAGEs are also expressed in various diffuse large B cell lymphoma cell lines [4]. The methylation status of its promoter sequences determines CAGE expression [5]. CAGEs show oncogenic potential [6].
CAGEs can bind to histone deacetylase 2 (HDAC2), decrease p53 expression, and lead to the resistance of melanoma cells to anti-cancer drugs [7]. It is known that miR-200b can negatively regulate the expression of CAGEs and enhance the sensitivity of melanoma cells to microtubule-targeting drugs [8]. CAGEs can bind to glycogen synthase kinase 3β (GSK3β) and increase cyclin D1 expression in melanoma cells [9]. CAGE-derived penta peptide can enhance anti-cancer drug sensitivity by inhibiting the binding of CAGEs to GSK3β [9]. In breast cancer cells, CAGEs can increase autophagic flux and promote resistance to anti-cancer drugs [10]. CAGEs are present in the exosomes of gastric cancer cells and confer resistance to anti-cancer drugs [11]. CAGEs are also present in the exosomes of nasopharyngeal cancer cells and confer resistance to taxol [12].
Histone deacetylase 9 (HDAC9) has been shown to be present in the nucleus, cytoplasm, and deacetylate histone and non-histone substrates [13]. HDAC9 can directly regulate the expression of p53 to promote osteosarcoma cell proliferation [14]. The overexpression of HDAC9 in B cells has been shown to lead to the development of lymphoma in a mouse model [15]. HDAC9 has been found to be upregulated in gastric cancer tissues and retinoblastoma tissues [16,17].
The downregulation of HDAC9 can inhibit neuronal apoptosis [18]. A selective inhibitor of HDAC9 has been shown to have an apoptotic effect in breast cancer cells [19]. HDAC9 can promote endothelial–mesenchymal transition and contribute to vascular pathology [20]. HDAC9 has been shown to decrease the expression of E-cadherin, an inhibitor of epithelial–mesenchymal transition (EMT) [21].
HDAC9 can inhibit intracellular autophagy by binding to promoter sequences of autophagy-related gene 7 (Atg7), Beclin1, and LC3 [22]. Autophagy is closely related to anti-cancer drug resistance [3,11]. HDAC9 can confer resistance to taxol in triple-negative breast cancer cells [23]. The inhibition of HDAC9 can result in the resistance of AMP-dependent kinase (AMPK)-deficient cells to irradiation [24].
We found that CAGEs regulated the expression of HDAC9. We also found that CAGEs could bind to promoter sequences of HDAC9. In addition, anti-cancer drug resistance was found to be closely associated with increased autophagic flux. We also showed that HDAC9 was necessary for anti-cancer drug resistance and autophagic flux. HDAC9 was shown to function as a target of miR-512. miR-512 was found to be able to decrease invasion, migration, and autophagic flux in AGSR cells. miR-512 was also found to enhance the sensitivity of AGSR cells to anti-cancer drugs. Altogether, our results showed a novel mechanism of CAGE-promoted anti-cancer drug resistance. The CAGE–HDAC9–miR-512 loop can be employed for developing anti-cancer drugs.

2. Materials and Methods

2.1. Materials

We purchased Lipofectamine and PLUSTM reagent from Invitrogen (San Diego, CA, USA). Oligonucleotides, miRNA mimic, and small interfering RNAs (siRNAs) were purchased from the Bioneer Company (Daejeon, Republic of Korea).

2.2. Cell Lines and Cell Culture

We purchased human cancer cell lines from the Korea Cell Line Bank (Seoul, Republic of Korea). Cancer cell lines were cultured in Dulbecco’s modified minimal essential medium (DMEM) containing heat-inactivated 10% fetal bovine serum. Anti-cancer drug-resistant AGSR cells were established by the stepwise addition of celastrol to AGS gastric cancer cells. AGSR△CAGE#5 and AGSR△CAGE#7 cell lines were generated using the CRISPR-Cas9 system. AGSR cells were stably transfected with Cas9, CAGE-targeted sgRNA, and reporter plasmid and selected by hygromycin B.

2.3. Colony Formation

The cells were mixed with 0.4% trypan blue staining solution in a 1:1 ratio and counted using a hemocytometer. Two hundred cells were seeded onto 6-well plates and maintained at 37 °C in 5% CO2 for 7 days. Colonies were stained with 0.01% crystal violet and counted.

2.4. Cell Viability Determination

The cancer cells (2 × 10⁴) were plated in 48-well plates. Then, 24 h after incubation, the cells were treated with the anti-cancer drug for 48 h. The cells were treated with 0.5 mg/mL 3-(4,5-dimethylthiazol-2-yl)-2,5-diphenyltetrazolium bromide (MTT) and incubated for 1 h. After removing the solution, MTT formazans were dissolved with DMSO, and the plates were read at 570 nm. GraphPad Prism 7 software was used for the determination of the IC50 value.

2.5. Invasion Assays

Trypsinized cells (5 × 10³) in the serum-free DMEM medium were added to each upper chamber of the transwell with 8-μm pore polycarbonate filter inserts (CoSTAR, Acton, MA, USA). DMEM containing 10% fetal bovine serum was placed in the lower chamber. Incubation was continued at 37 °C for 16 h. The invaded cells were stained and counted as described [11].

2.6. ChIP Assays

Assays were carried out according to the protocol provided by the manufacturer (Upstate Company). For the detection of the binding of CAGEs to HDAC9 promoter sequences, specific primers of HDAC9 promoter-1 sequences [5′-ATTCTGGGGTGTGCTTGTTTTC-3′ (sense) and 5′-ATACTGGCGATTCGCTTCCAA-3′ (antisense)], HDAC9 promoter-2 sequences [5′-CTGGACAGCTGGGTTTGCTG-3′ (sense) and 5′-GAGTTCTTCAGGCTGCTAGGG-3′ (antisense)], and HDAC9 promoter-3 sequences [5′-GACAAAGAAATAACCCCGAAGCA-3′ (sense) and 5′-CAGGAGCTACCCTCGCTGG-3′ (antisense)] were used.

2.7. Tumor Spheroid Forming Potential

The cells were plated (5 × 10⁴ cells/well) in ultralow attachment plates (Corning Inc., Corning, NY, USA) and fed with 0.2 mL of fresh stem cell medium on days 2, 4, and 6. The number of tumor spheroids was counted after 5–14 days of culture. Those larger than 50 μm were counted as tumor spheroids.

2.8. Transfection

The transfections were performed with JetPEI® (Polyplus, cat.201-10G, New York, NY, USA) using the protocol provided by the manufacturer (Polyplus). All the transfections were carried out in the presence of a serum. The cells were transfected with siRNA (each at 10 nM) or miR mimic (each at 10 nM) for 24 h. The sequences for miRNA mimics and siRNAs are listed in Supplementary Tables S1 and S2, respectively.

2.9. miRNA Extraction and qRT-PCR

Total miRNA was isolated using the miRNeasy Micro Kit (Qiagen, San Diego, CA, USA). The total miRNA was converted into cDNA using a miScript II RT Kit (Qiagen). SYBR Green Master Mix (Qiagen) was used to determine the expression level of miR-512. The expression level of miR-512 was defined based on the threshold (Ct), and relative expression levels were calculated as 2−(Ct of miR 512)−(Ct of U6) after normalization with reference to the expression of U6 small nuclear RNA.
Total RNA was isolated using TRIzol reagent (Thermo Fisher, Waltham, MA, USA). Total RNA was converted into cDNA using the protocol provided by the manufacturer (iNtRon Biotechnology, Kyunggi, Republic of Korea). Quantitative RT-PCR was performed using the synthesized cDNA and an SYBR Green mixture containing the Rox dye (Excel Taq™ 2X Fast Q-PCR Master Mix) (SMOBIO, Hsinchu, Taiwan) in a StepOneTM Real-Time PCR System (Thermo Fisher). PCR conditions were 40 cycles of denaturation for 30 s at 95 °C, annealing for 30 s at 60 °C, and extension for 30 s at 72 °C. The sequences of primers targeting CAGEs and HDAC9 are listed in Supplementary Table S3.

2.10. TargetScan Analysis

The identification of miRNAs that can bind to the UTR of HDAC9 was carried out using the TargetScan program (http://www.targetscan.org, accessed on 28 April 2021), Diana laboratory (http://dianna.imis.athena-innovation.gr, accessed on 28 April 2021), and miRDB (http://mirdb.org, accessed on 28 April 2021).

2.11. Immunofluorescence Staining

The cells were fixed with 4% paraformaldehyde and were permeabilized by Triton X-100. After blocking with goat serum (10%) in 0.1% BSA, incubation with anti-LC3 antibody at 4 °C overnight was performed. Next, incubation with anti-rabbit Alexa Fluor 488 (for LC3) secondary antibody was followed. The cells were stained with DAPI and mounted with a mounting medium.

2.12. Immunoblot and Immunoprecipitation

The cell lysates were isolated using lysis buffer (50 mM Tris-HCl, pH 8.0, NP-40 1% (v/v), 0.1% (v/v) protease inhibitor mixture (Roche, Singapore), and 200 μM sodium orthovanadate). The cell lysates (20 μg/well) were loaded onto a 10% SDS-PAGE and were transferred onto a PVDF membrane. The following primary antibodies were used for immunoblot: CAGE (MBS2524843, MyBioSource, San Diego, CA, USA), HDAC9 (sc-398003; Santa Cruz, Santa Cruz, CA, USA), AMPKα (AF3194, R&D Systems, Minneapolis, MN, USA), pAMPKαThr172 (2535S, Cell Signaling, Danvers, MA, USA), PARP (9542S, Cell Signaling), Beclin1 (sc-48341; Santa Cruz), pBeclin1Ser15 (84966S, Cell Signaling), LC3 (12741S, Cell Signaling), Beclin1 (sc-48341, Santa Cruz), MDR1 (12683s, Cell Signaling), IgG (sc-2025, Santa Cruz), FLAG (F3166, Sigma, New York, NY, USA), and p62 (ab56416, Abcam, Cambridge, UK). For immunoprecipitation, cell lysates were incubated with each antibody (2 μg/mL) with constant agitation at 4 °C. The immunocomplexes were precipitated with protein A/G-Sepharose (Sigma) and analyzed by immunoblot. The following secondary antibodies were used in this study: anti-mouse HRP secondary antibody (31430, Invitrogen, Carlsbad, CA, USA), anti-goat HRP secondary antibody (31402, Invitrogen), anti-rabbit HRP secondary antibody (ADI-SAB-300-J, Enzo, Farmingdale, NY, USA), and anti-rabbit Alexa Fluor 488 secondary antibody (A11008, Invitrogen).

2.13. Luciferase Activity Assays

The 3′ UTR of HDAC9 (381 bp) was cloned into the XbaI site of the pGL3 luciferase plasmid. The mutant pGL3–3′ UTR–HDAC9 was made using the QuikChange site-directed mutagenesis kit (Stratagene, La Jolla, CA, USA). A luciferase activity assay was carried out according to the standard procedures [11]. PCR-amplified full-length human HDAC9 promoter and deletion constructs were cloned into the pGL2 basic luciferase plasmid.

2.14. Expression and Purification of CAGE Proteins

Human full-length CAGE proteins were purified as described [11].

2.15. In Vivo Tumorigenic Potential

AGS or AGSR cells (5 × 10⁶) were injected subcutaneously into the dorsal flank area of the athymic nude mice to induce the formation of tumors. Animal experiments were carried out according to the guidelines of the Korean Council for the Care and Use of Animals in Research, approved by the Institutional Animal Care and Use Committee (IACUC) of Kangwon National University, and in compliance with ARRIVE guidelines. The animals were kept under standard housing conditions (20~26 °C, 150~300 lux, and 40~60% humidity) with a 14–10-h light–dark period. The animals were allowed free access to food and water. The tumor volume (0.5 × length × width2) was calculated. Animal euthanasia was carried out using CO2 gas at a 30–70% displacement rate of the cage volume/min using a flow meter according to the American Veterinary Medical Association (AVMA) euthanasia guideline43.

2.16. TCGA Dataset Analysis

UALCAN online software (https://ualcan.path.uab.edu/, accessed on 28 February 2024) was used for TCGA dataset analysis (reference needed). Briefly, TCGA level 3 RNA-seq data were used to analyze gene expression values, and transcripts per million (TPM) was used as the measure of expression in this software. Box plot graphs were generated using Highcharts in this software. The values from primary tumors were classified based on the patients’ clinical data. The tumor grades were categorized from 1 to 4 according to the level of tumor cell differentiation. The cancer stages were categorized from 1 to 4 according to pathologic information based on AJCC. GraphPad Prism was used to modify the graphs from UALCAN software.

2.17. Statistical Analysis

GraphPad Prism software (Version 7) was used. The data are presented as means ± standard error of the mean (S.E.M.). The Student’s t-test was employed for statistical analysis. Statistical significance was set to p < 0.05.

3. Results

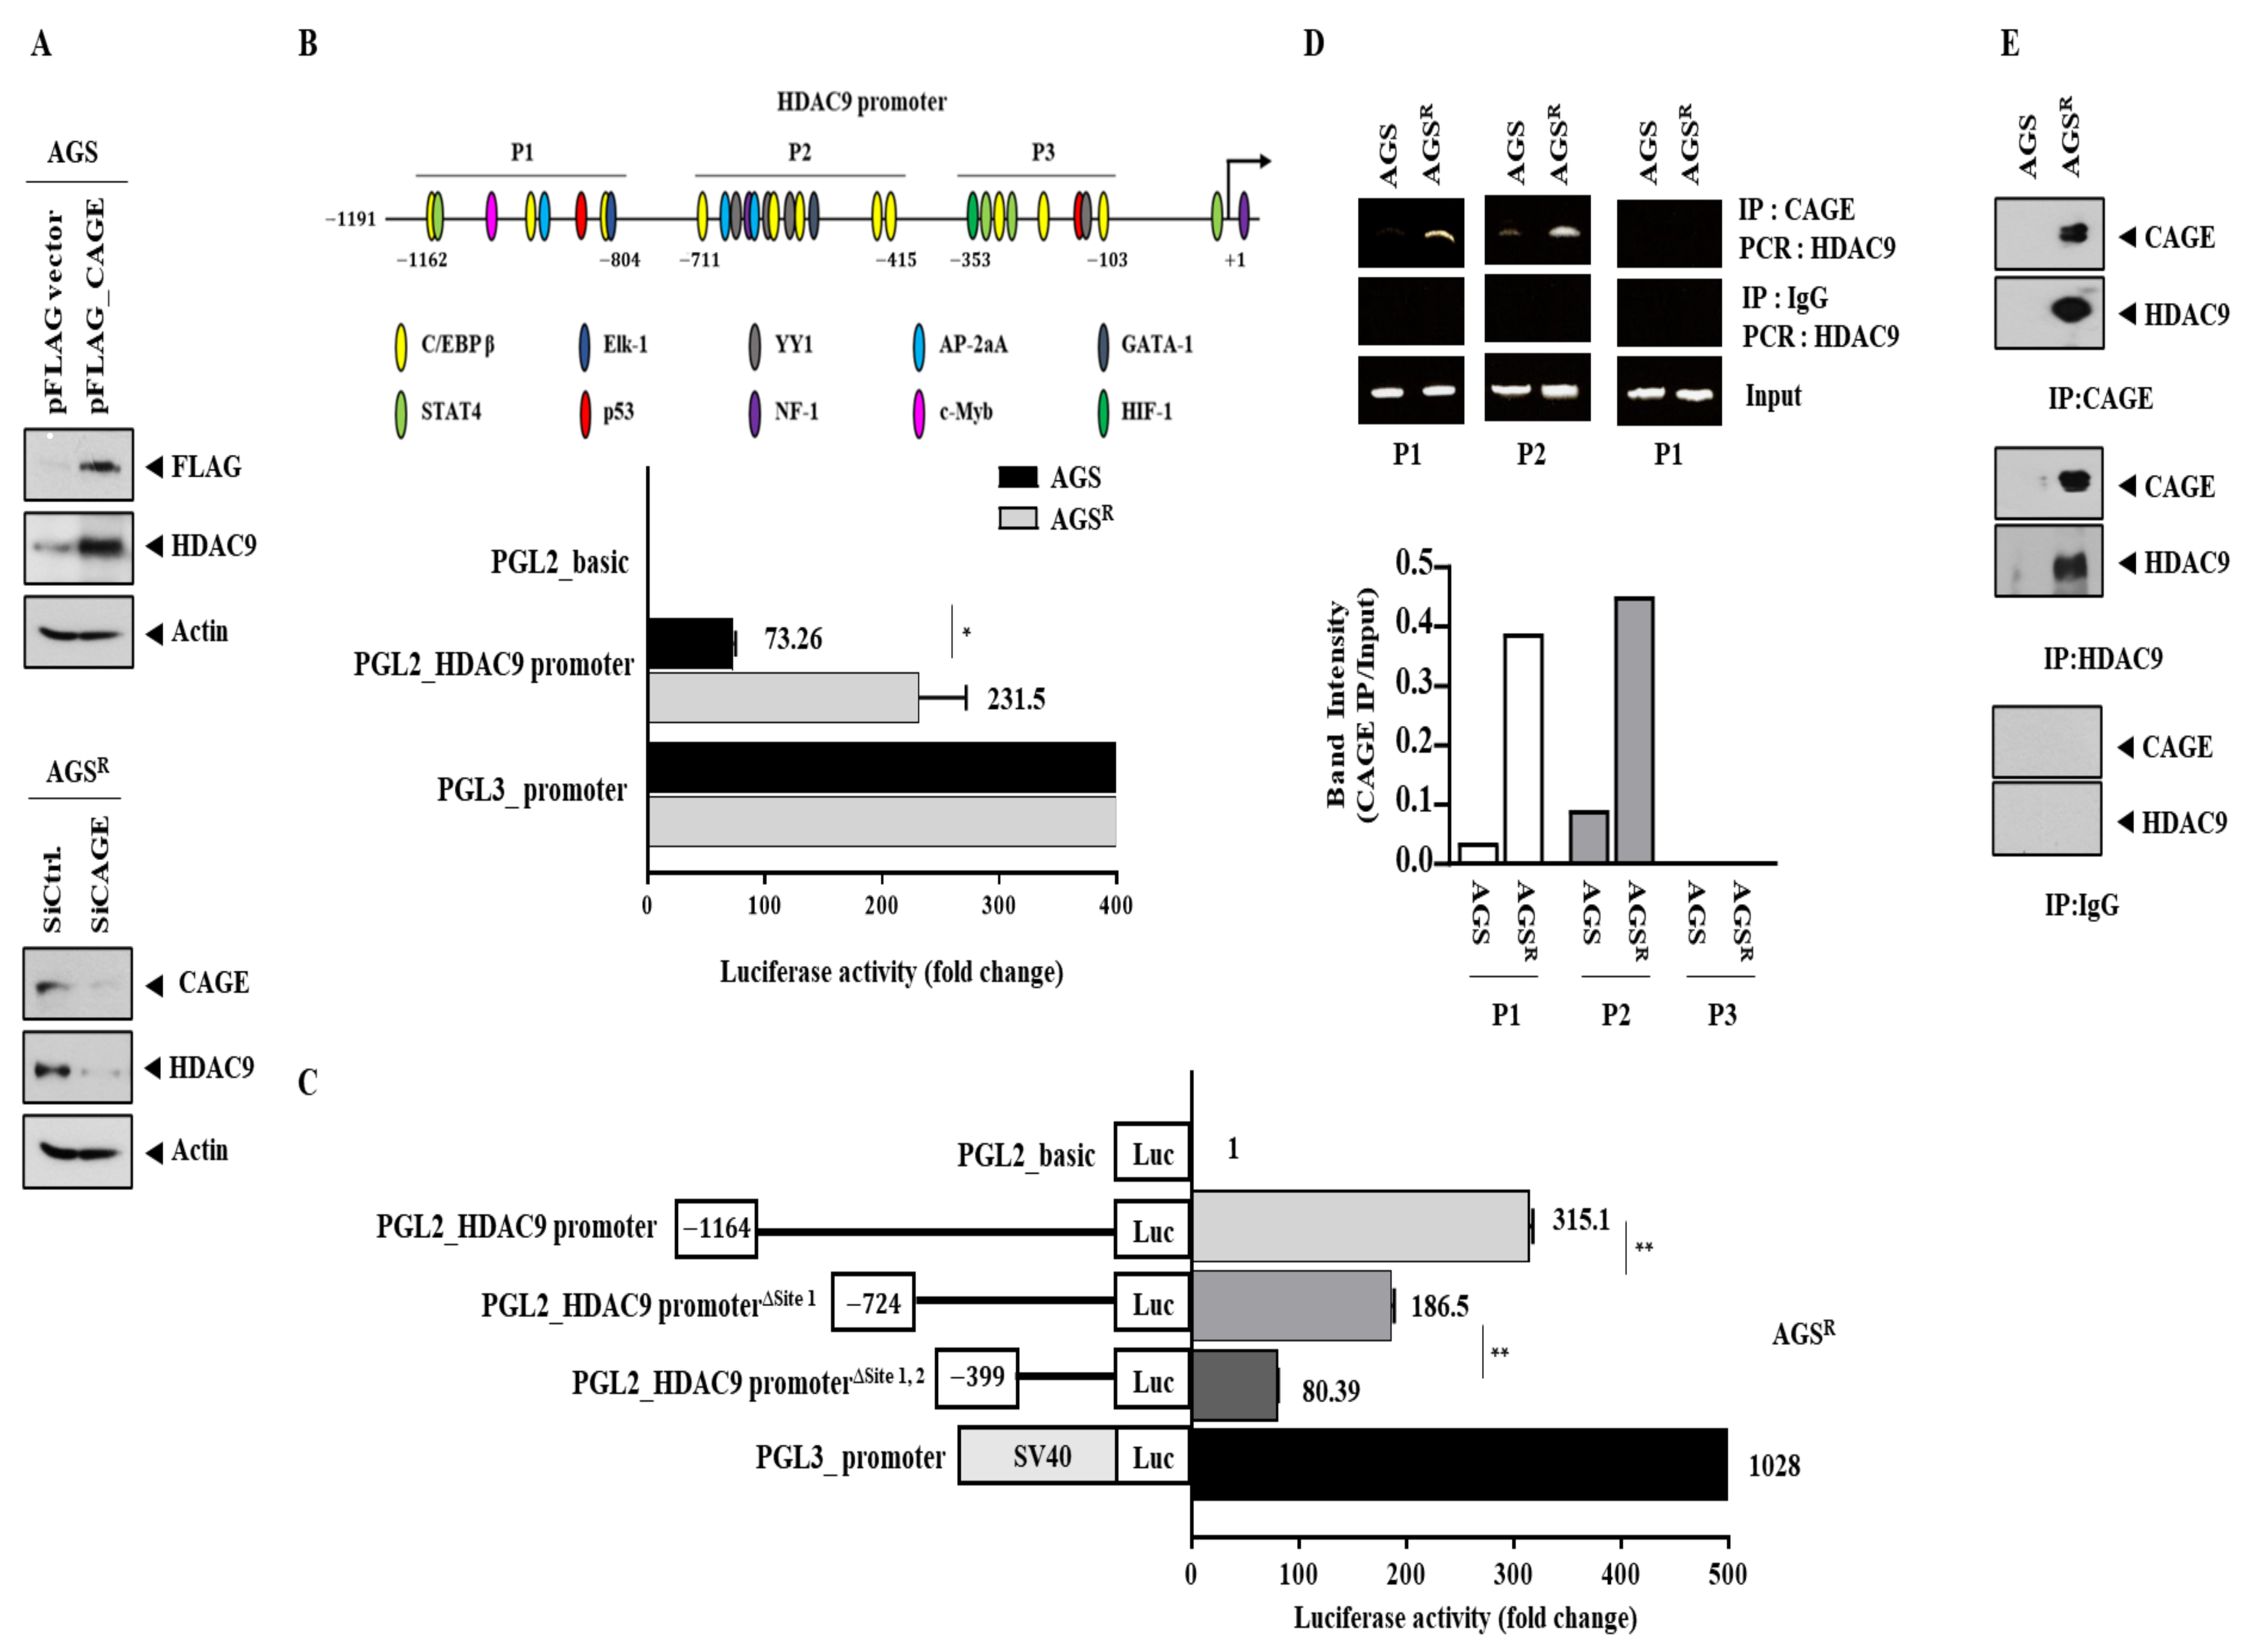
3.1. Anti-Cancer Drug-Resistant Gastric Cancer Cells Show Increased Expression of CAGEs and HDAC9

The sensitivities of various human gastric cancer cell lines to anti-cancer drugs were determined. AGS cells were found to be the most sensitive to celastrol and taxol (Figure 1A). This indicated the relevance of AGS cells as parental anti-cancer drug-sensitive cancer cells. Compared to AGS cells, AGSR cells showed increased resistance to celastrol and taxol (Figure 1A). AGSR cells also showed higher expressions of CAGEs and HDAC9 than AGS cells (Figure 1B). In addition, AGSR cells showed a higher expression of HDAC9 mRNA than AGS cells (Figure 1C). CRISPR/Cas-9 was used to establish AGSR cells that displayed stable downregulation of CAGEs (AGS R△CAGE#5 and AGSR △CAGE#7). AGS R△CAGE#5 and AGSR △CAGE#7 cell lines showed lower levels of HDAC9 than AGSR cells (Figure 1D). These results imply the existence of a close relationship between CAGEs and HDAC9.

3.2. CAGEs Regulate the Expression of HDAC9

Since AGSR cells showed increased expression levels of CAGEs and HDAC9, we examined whether CAGEs could affect the expression of HDAC9. The overexpression of CAGEs increased the expression of HDAC9 in AGS cells, while the downregulation of CAGEs in AGSR cells decreased the expression of HDAC9 (Figure 2A). We then examined whether increased expression of HDAC9 occurred at the transcriptional level. HDAC9 promoter sequences contained three potential binding sites for various transcriptional factors (Figure 2B). AGSR cells showed higher luciferase activity associated with HDAC9 promoter sequences than AGS cells (Figure 2B). This indicates that the increased expression of HDAC9 occurs at the transcriptional level. The promoter luciferase activity assays showed that the promoter sites 1 and 2 (P1 and P2) of HDAC9 were both necessary for the increased expression of HDAC9 in AGSR cells (Figure 2C). The deletion of site 1 decreased luciferase activity associated with the wild-type HDAC9 promoter (Figure 2C). The deletion of both site 1 and site 2 further decreased luciferase activity associated with the wild-type HDAC9 promoter (Figure 2C). ChIP assays showed that CAGEs could bind to the promoter sequences of HDAC9 (Figure 2D). CAGE proteins could also bind to HDAC9 proteins in AGSR cells (Figure 2E). Thus, CAGEs can bind to the promoter sequences of HDAC9 to exert direct regulation of HDAC9 expression. Transfection with the HDAC9 promoter luciferase construct into AGSR△CAGE#5 or AGSR△CAGE#7 cells might provide a clue about the possibility of the direct regulation of HDAC9 expression by CAGEs.

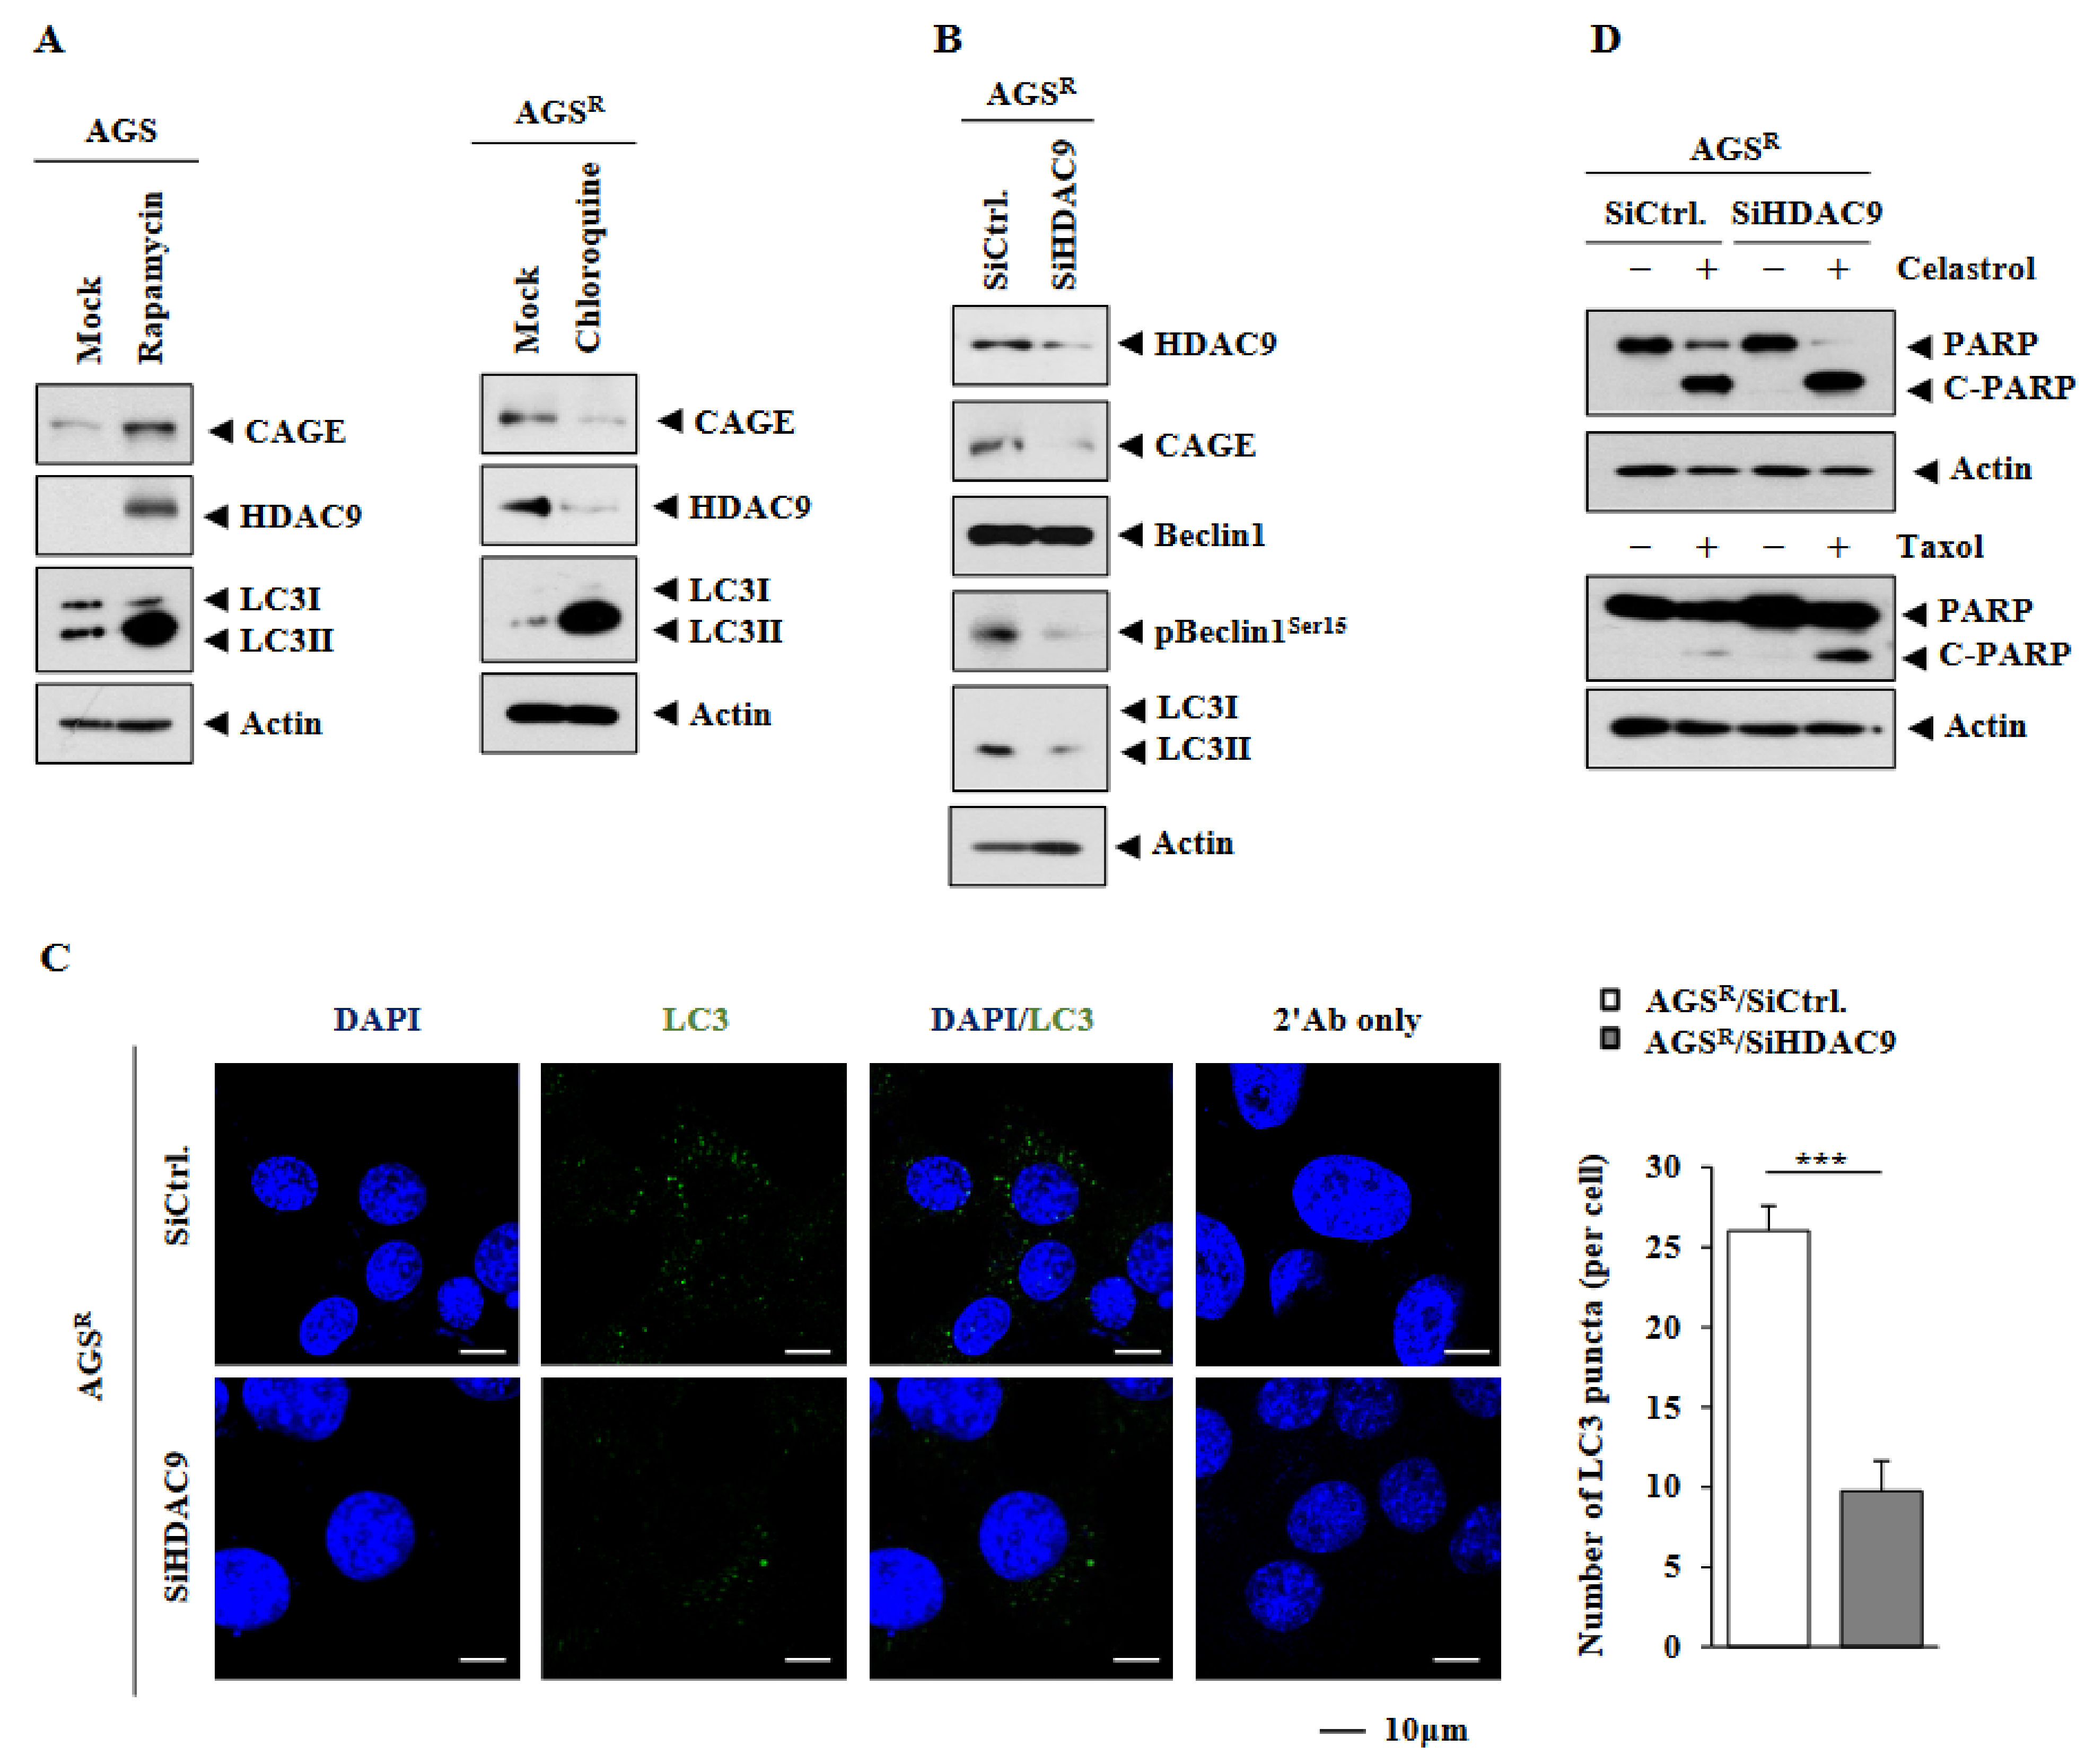
3.3. HDAC9 Is Necessary for Increased Autophagic Flux in AGSR Cells

CAGEs induced anti-cancer drug resistance by decreasing the expression of p53 in melanoma cells [7]. Anti-cancer drug resistance induced by CAGEs was accompanied by increased autophagic flux [11]. The overexpression of HDAC9 promotes cancer cell proliferation by suppressing the expression of p53 [14]. Therefore, we examined whether increased autophagic flux could affect the expression of HDAC9. Rapamycin, an inducer of autophagy, increased the expression levels of CAGEs, HDAC9, and LC3II in AGS cells (Figure 3A). Chloroquine, an inhibitor of autophagy, decreased the expression levels of CAGEs and HDAC9 in AGSR cells (Figure 3A). The downregulation of HDAC9 decreased the expression levels of CAGEs, pBeclin1Ser15, and LC3II in AGSR cells (Figure 3B). Increased expression of pBeclin1Ser15 and LC3II is known to be associated with anti-cancer drug resistance [11]. Immunofluorescence staining showed that the downregulation of HDAC9 decreased LC3 puncta in AGSR cells (Figure 3C). However, the downregulation of HDAC9 increased the expression of cleaved PARP in AGSR cells in response to celastrol and taxol (Figure 3D). Thus, CAGEs and HDAC9 are likely to promote anti-cancer drug resistance by regulating autophagic flux.

3.4. Downregulation of HDAC9 Decreases Invasion, Migration, and Tumor Spheroid Forming Potential of AGSR Cells

The downregulation of HDAC9 decreased the invasion and migration potential of AGSR cells (Figure 4A). Cancer stem cell-like properties are known to be closely related to increased autophagic flux [11,12]. The downregulation of HDAC9 also decreased SOX2, a marker of cancer stemness, in AGSR cells (Figure 4B). In addition, the downregulation of HDAC9 decreased the tumor spheroid forming potential of AGSR cells (Figure 4C). AGSR cells showed binding of CAGEs to SOX2 (Figure 4D). The downregulation of SOX2 decreased autophagic flux in AGSR cells (Figure 4D). The downregulation of HDAC9 decreased the colony forming potential of AGSR cells (Figure 4E). It would be interesting to examine whether the CAGE–HDAC9 complex could bind to the promoter sequences of SOX2 in the future.

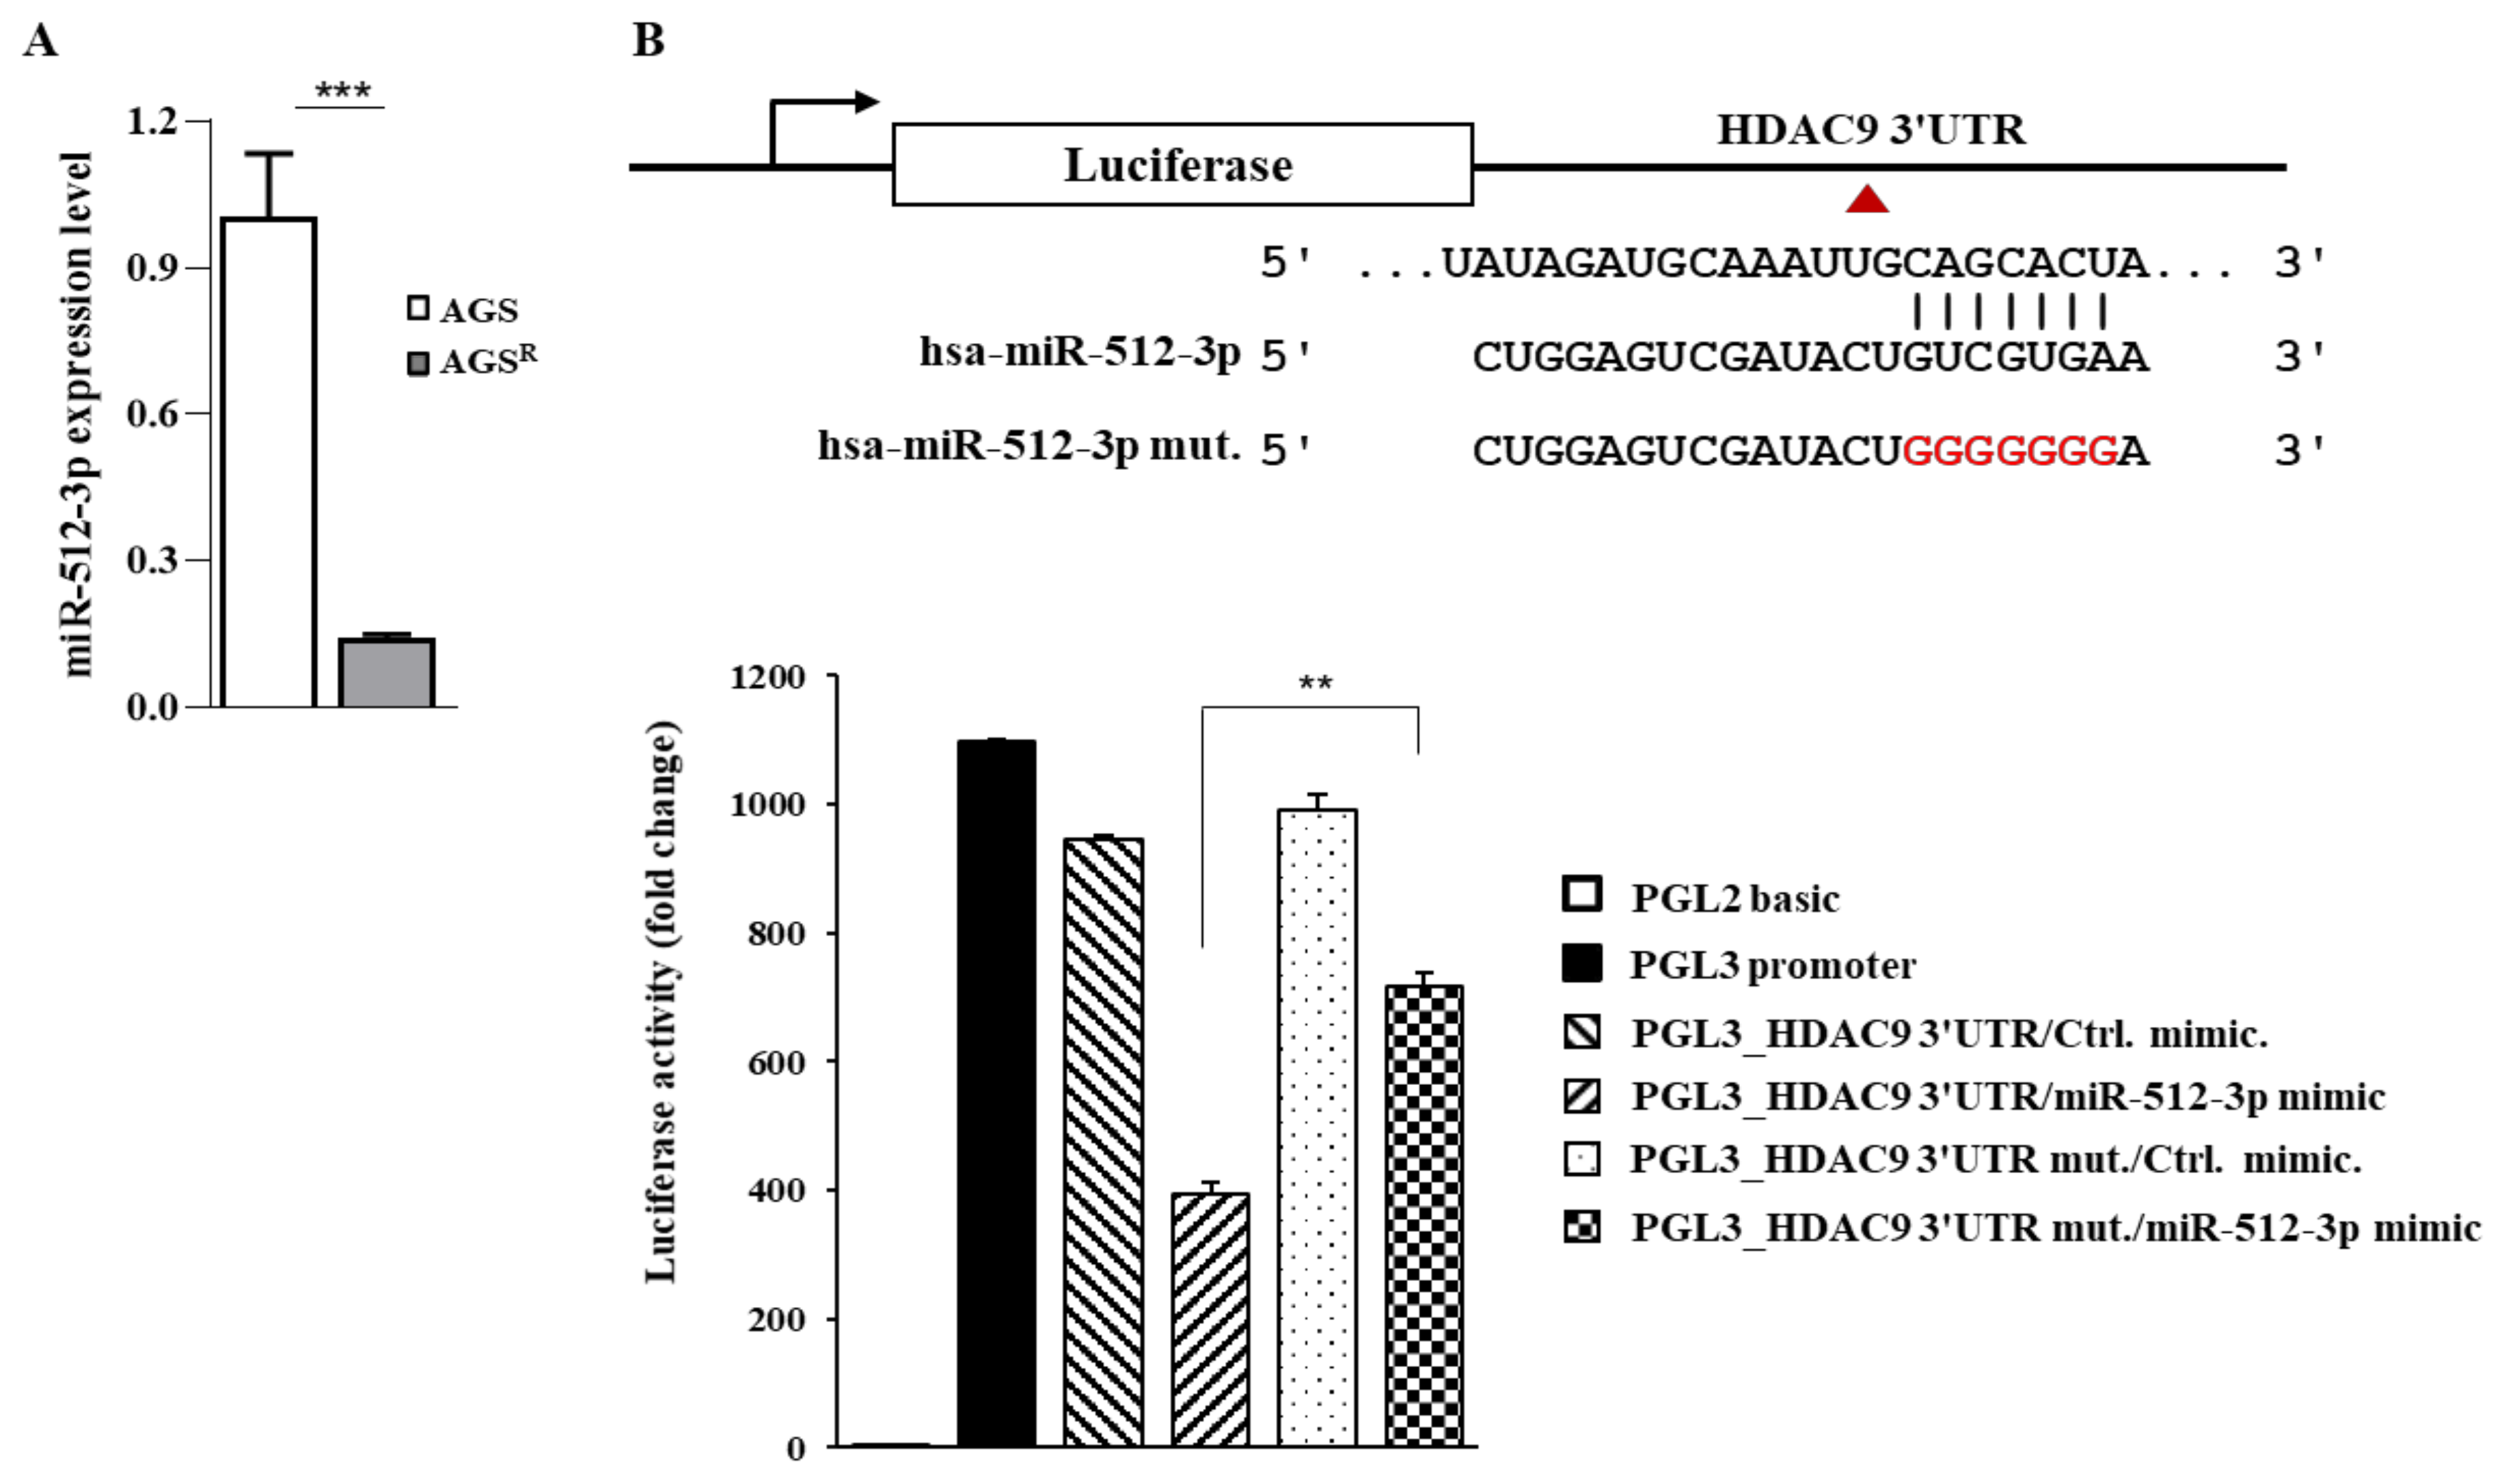
3.5. miR-512 Directly Regulates the Expression of HDAC9

Next, we aimed to identify a regulator of HDAC9. miR-512 was predicted to be a negative regulator of HDAC9 by a TargetScan analysis. AGSR cells showed a lower expression of miR-512 than AGS cells (Figure 5A). miR-512 mimic decreased luciferase activity associated with the wild-type 3’ UTR of HDAC9. However, it did not affect luciferase activity associated with the mutant 3’ UTR of HDAC9 (Figure 5B). Therefore, miR-512 could directly regulate the expression of HDAC9 in AGSR cells.

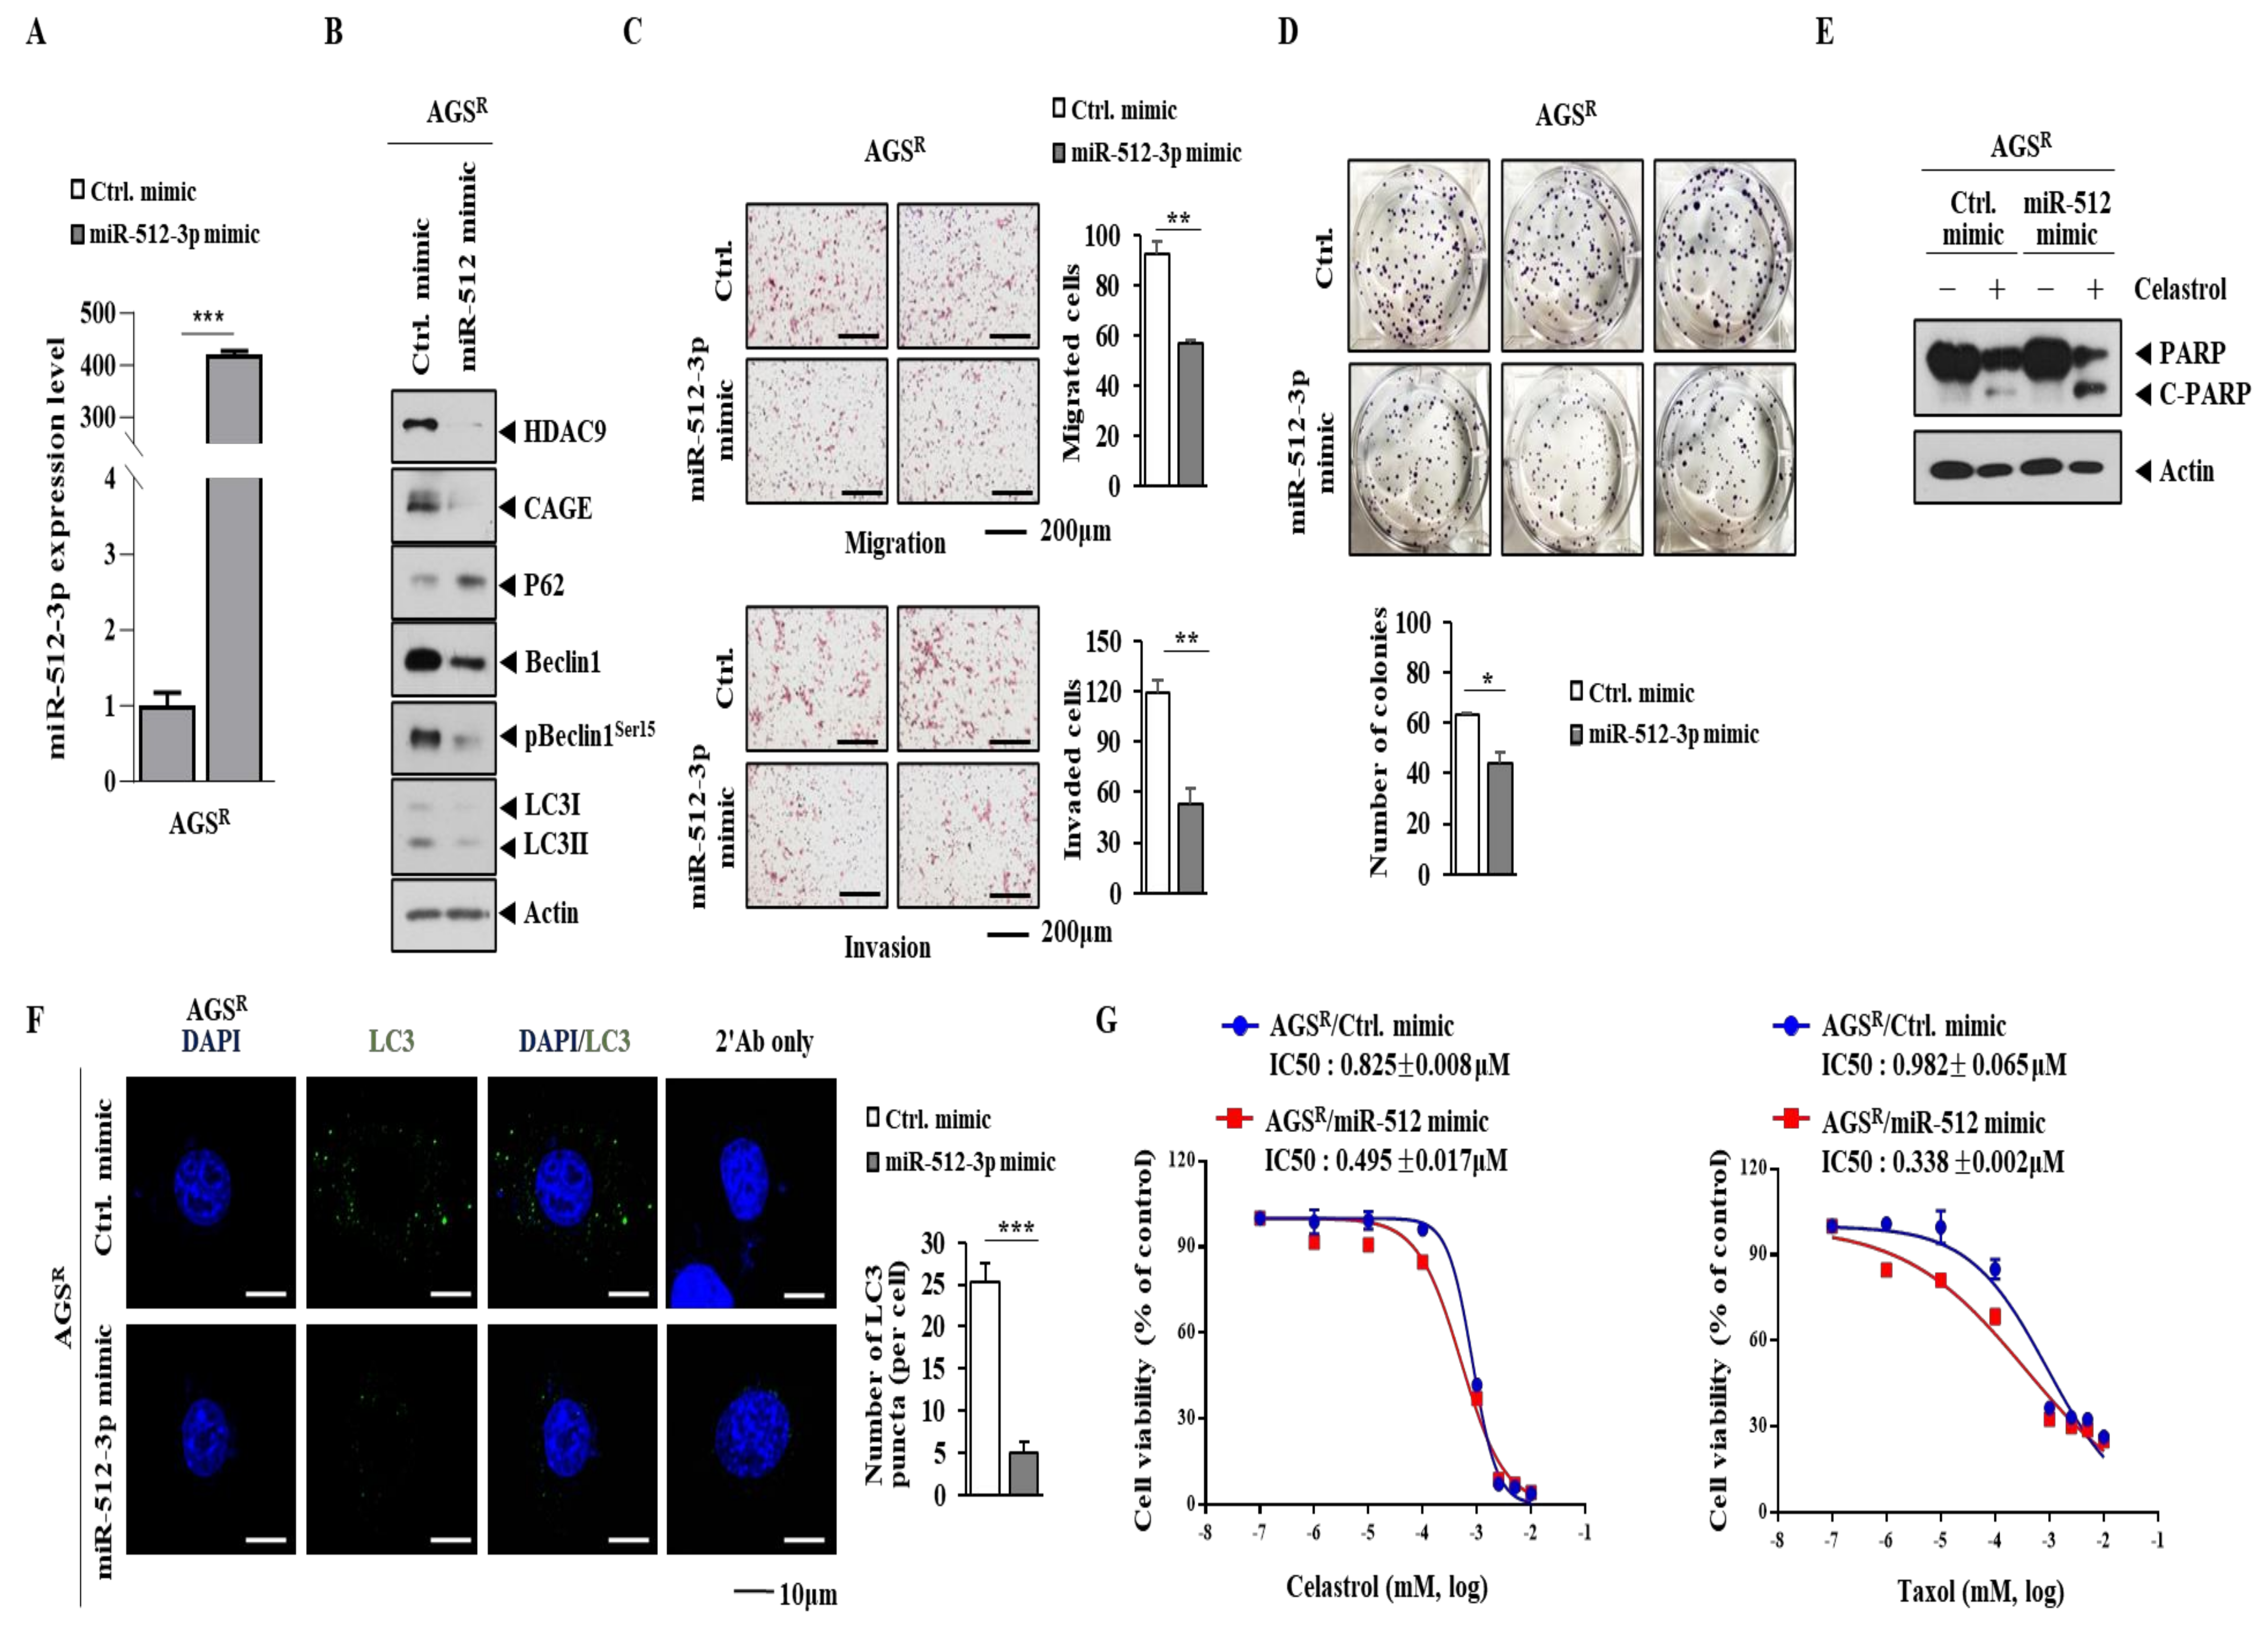
3.6. miR-512 Decreases Autophagic Flux, Invasion/Migration, and Cellular Proliferation but Enhances Sensitivity to Anti-Cancer Drugs

The overexpression of miR-512 mimic (Figure 6A) decreased the expression levels of CAGEs, HDAC9, and LC3II but increased the expression of p62 in AGSR cells (Figure 6B). The overexpression of miR-512 mimic also decreased the invasion and migration potential of AGSR cells (Figure 6C). In addition, the overexpression of miR-512 mimic decreased the colony forming potential (Figure 6D) and LC3 puncta in AGSR cells (Figure 6F). However, the overexpression of miR-512 mimic increased the cleavage of PARP in AGSR cells (Figure 6E). In addition, miR-512 mimic enhanced the sensitivity of AGSR cells to both celastrol and taxol (Figure 6G).

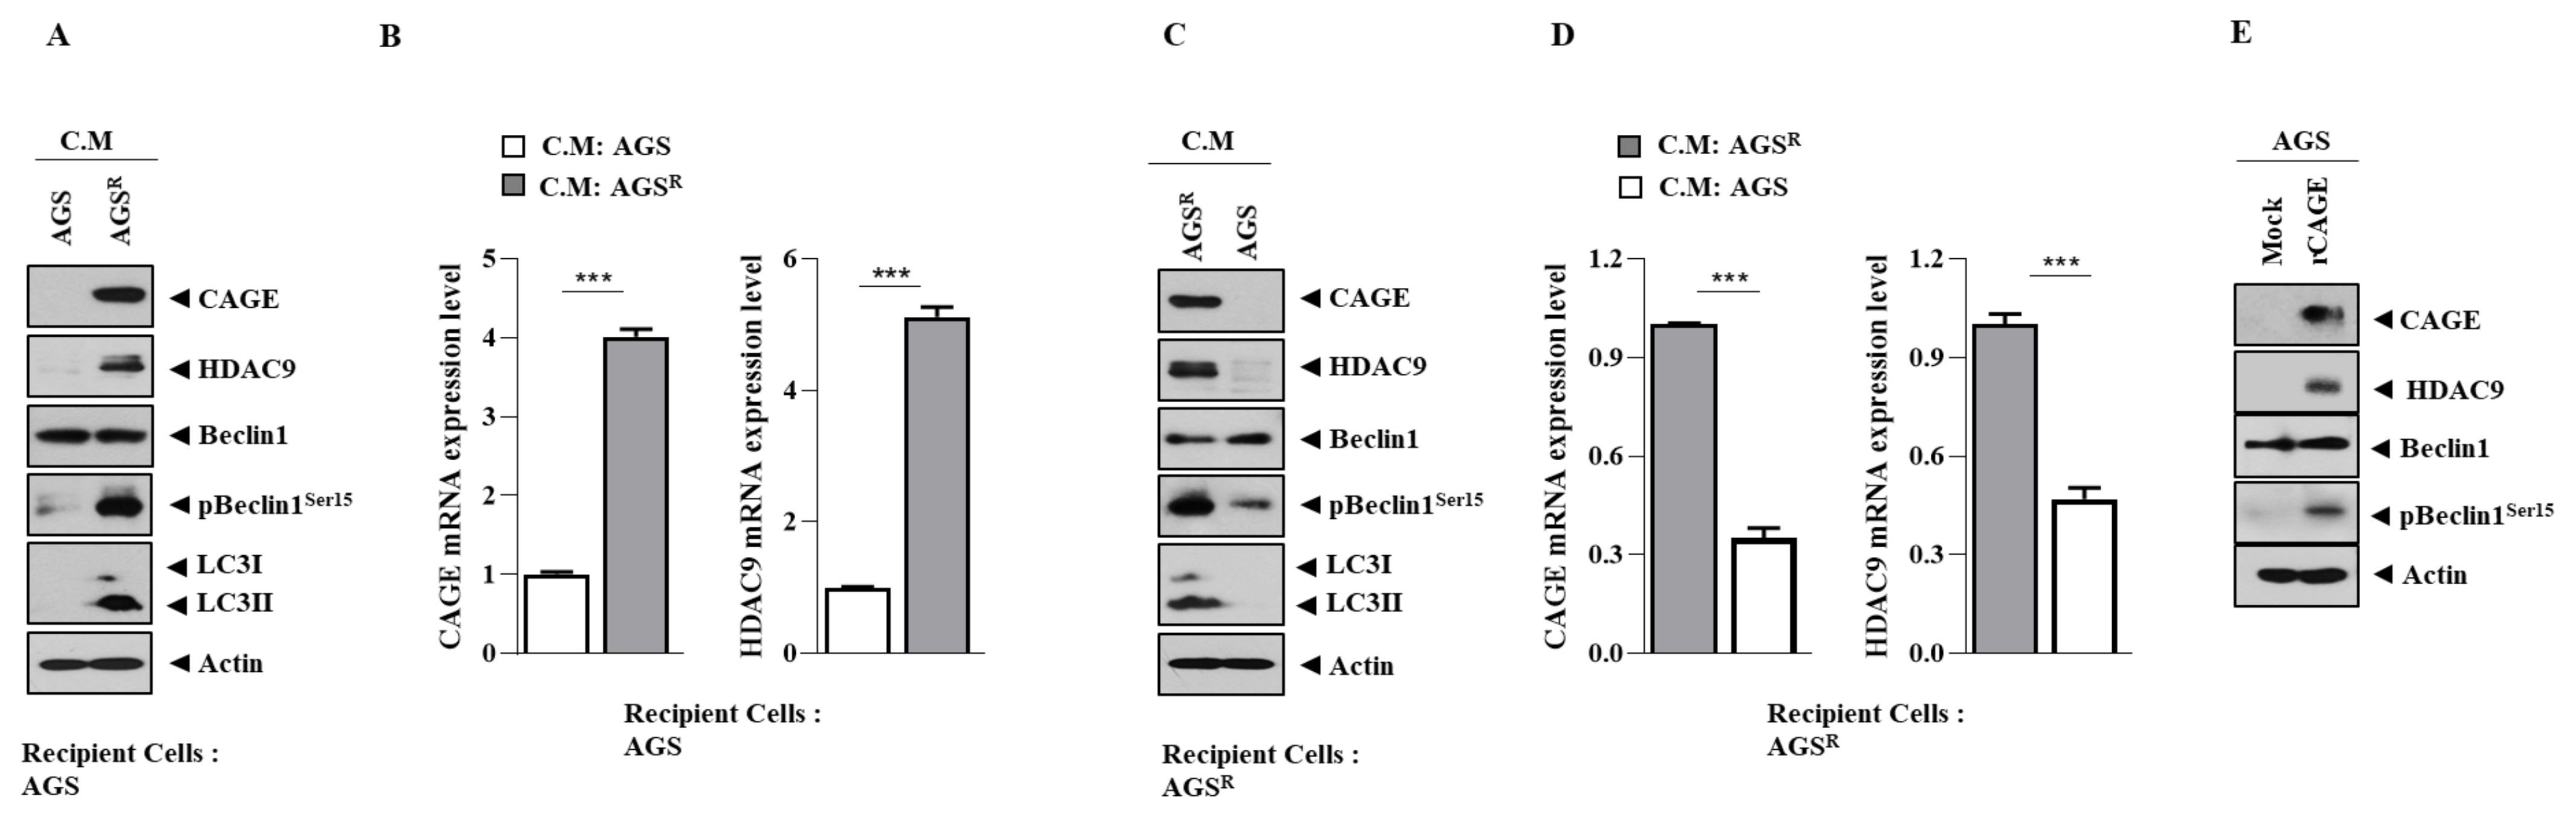
3.7. Soluble Factors Regulate HDAC9 Expression

We examined whether soluble factors could regulate the expression of HDAC9 in gastric cancer cells. We used a culture medium for this purpose. When the culture medium of AGSR cells was added to AGS cells, it increased the expression levels of HDAC9 and CAGEs (Figure 7A,B). However, the culture medium of AGS cells decreased the expression levels of HDAC9 and CAGEs in AGSR cells (Figure 7C,D). Human recombinant CAGE proteins increased HDAC9 expression in AGS cells (Figure 7E). These results suggest that the exosomes of AGSR cells could promote anti-cancer drug resistance in AGS cells.

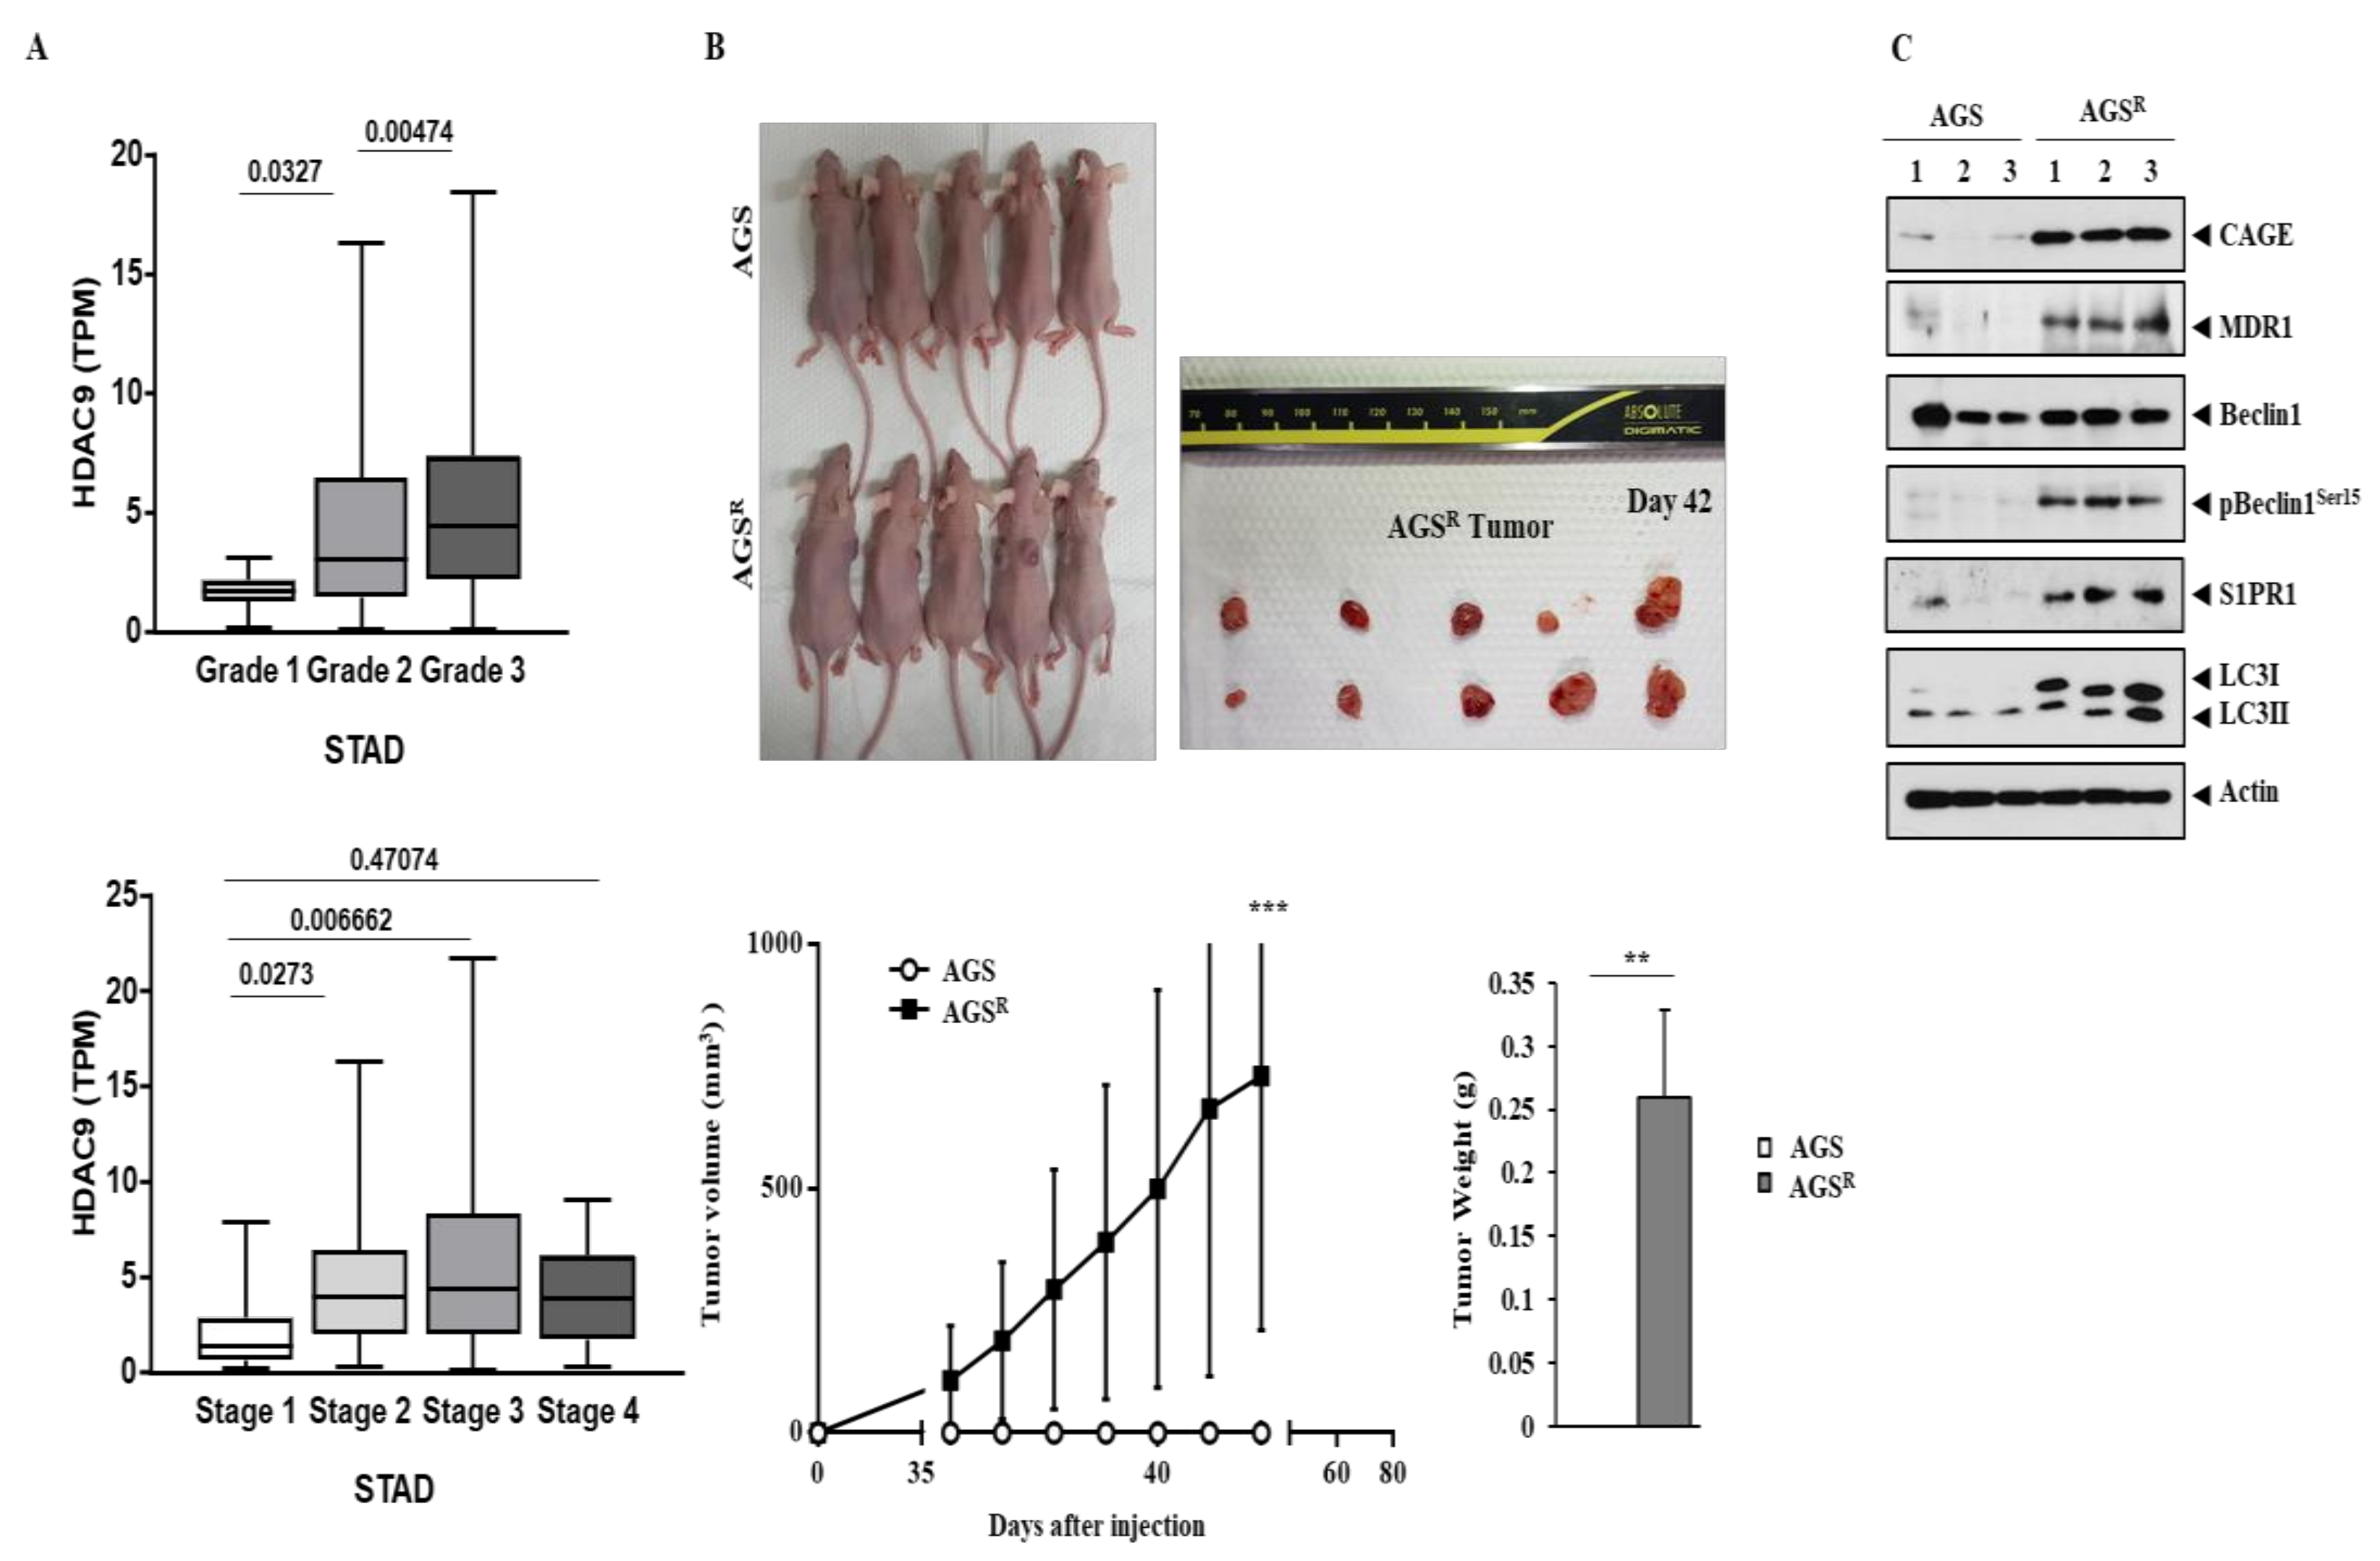
3.8. AGSR Cells Display Tumorigenic Potential

The TCGA database analysis showed that a high expression level of HDAC9 was positively associated with a poorly differentiated state of gastric cancer (Figure 8A). A high level of HDAC9 was found to be positively associated with an advanced stage of gastric cancer (Figure 8A). AGSR cells, but not AGS cells, displayed tumorigenic potential (Figure 8B). Thus, anti-cancer drug resistance is accompanied by an enhanced tumorigenic potential. Tumor tissues derived from AGSR cells, but not corresponding normal tissues of AGS cells, showed expression of CAGEs, MDR1, pBeclin1Ser15, S1PR1, and LC-3II (Figure 8C). It is probable that anti-cancer drug resistance is accompanied by an enhanced autophagic flux.

4. Discussion

The overexpression of HDAC9 can enhance the tumorigenic potential of non-small cell lung cancer cells [25]. A high expression of HDAC9 contributes to poor overall survival of patients with hepatocellular carcinomas [26]. HDAC9 expression has been reported to be upregulated in gastric cancer tissues [27]. It would be interesting to examine HDAC9 expression in the sera of gastric cancer patients in the future. Bioinformatics analysis revealed that a high expression of HDAC9 was correlated with poor survival in patients with gastric cancers [27]. HDAC9 overexpression contributes to the pathogenesis of retinoblastoma. It is related to a poor prognosis [28]. A high expression of HDAC9 is positively related to stemness but negatively related to differentiation markers in hepatocellular carcinomas [29]. These reports suggest that HDAC9, just like CAGEs, can serve as a prognostic marker of cancers.
We found that the expression of HDAC9 in AGSR cells was increased compared to that in AGS cells. It is necessary to further examine the expression levels of other HDACs in AGSR cells. HDAC1 andHDAC2 are known to contribute to the pathogenesis of gastric carcinogenesis by interacting with phosphoribosylaminoimidazole carboxylase and phosphoribosylaminoimidazole succinocarboxamide synthetase (PAICS) [30]. The downregulation of PAICS can enhance the sensitivity of gastric cancer cells to cisplatin and inhibit gastric cancer cell growth [30]. A high expression level of HDAC1/2 is closely associated with a poor prognosis in gastric cancer [31]. The overexpression of HDA1 and HDAC2 is closely related to gastric cancer progression [32]. In the present study, we found an increased expression of HDAC6 in AGSR cells compared to AGS cells. HDAC6 inhibition can lead to apoptosis in gastric cancer cells [33]. HDAC6 is known to play an essential role in autophagy [34]. It will be interesting to examine the role of HDAC6 in anti-cancer drug resistance in the future.
CAGEs were found to be able to bind to the promoter sequences of HDAC9 (Figure 2B). This indicates that CAGEs could play a role as a transcription factor. The promoter sequences of HDAC9 contain potential binding sites for various transcription factors. It is necessary to further examine the relationship between CAGEs and these transcription factors.
Rapamycin, an inducer of autophagy, was found to increase the expression of HDAC9 in AGS cells (Figure 3A). Chloroquine, an inhibitor of autophagy, showed opposite effects on CAGEs and HDAC9 in AGSR cells (Figure 3A). These results suggest a role of HDAC9 in autophagy. Since the downregulation of HDAC9 enhanced the cleavage of PARP in AGSR cells (Figure 3D), the overexpression of HDAC9 might increase the expression of anti-apoptotic proteins. Many reports have suggested the existence of an inverse relationship between enhanced autophagic flux and apoptosis [10,11].
The interaction between CAGEs and HDAC9 has not been previously reported. Identifying the domain of CAGEs that is necessary for binding to HDAC9 may help to understand the mechanisms associated with CAGE-promoted anti-cancer drug resistance. It is also necessary to identify the domain of HDAC9 that is necessary for conferring resistance to anti-cancer drugs. In addition, it is necessary to identify downstream targets of HDAC9 to improve our understanding of CAGE-promoted anti-cancer drug resistance. Identifying the molecular network involving CAGEs and HDAC9 may also be helpful for achieving a better understanding of anti-cancer drug resistance.
miR-512 serves as a target of circular RNA circRPPH1. It inhibits breast cancer progression [35]. The downregulation of miR-512 can suppress the metastasis of colorectal cancer [36]. The overexpression of miR-512 can enhance sensitivity to cisplatin in ovarian cancer cells [37]. The overexpression of miR-512 can decrease the expression of Mcl-1, resulting in the apoptosis of gastric cancer cells [38]. miR-512 can suppress the progression of Epstein–Barr Virus-associated gastric cancer [39]. miR-512 targets JAG1, which is necessary for the negative regulatory effect of exosomes on metastasis of glioblastoma [40]. These reports suggest that miR-512 can regulate anti-cancer drug resistance in association with autophagy. Since miR-512 directly regulates the expression of HDAC9 (Figure 5), it is necessary to examine whether CAGEs and HDAC9 can directly regulate the expression of miR-512. It is also necessary to examine the possibility of the binding of CAGEs to the promoter sequence of miR-512.
The TargetScan predicted that miR-512 was a negative regulator of HDAC9. AGSR cells showed a lower expression of miR-512 than AGS cells (Figure 5A). HDAC9 was shown to be directly regulated by miR-512 (Figure 5B). miR-512 can enhance the sensitivity of retinoblastoma cells to cisplatin by promoting apoptosis [41]. miR-512 mimic enhanced the sensitivity of AGSR cells to both celastrol and taxol (Figure 6F). miR-512 mimic is likely to increase caspase-3 activity while decreasing the expression of anti-apoptotic proteins in response to anti-cancer drugs. It is reasonable that miR-512 mimic can increase the number of apoptotic cancer cells in response to anti-cancer drugs. Many other miRNAs are predicted to bind to the 3′ UTR of HDAC9 based on the TargetScan analysis (Supplementary Figure S1). It will be necessary to examine the roles of these miRNAs in anti-cancer drug resistance.
We have previously reported that CAGEs can form a negative feedback loop with miR-181b and promote anti-cancer drug resistance in gastric cancer cells [11]. CAGEs can directly regulate the expression of sphingosine-1-phosphate receptor 1 (S1PR1) by binding to the promoter sequences of S1PR1 [11]. miR-181b was shown to act as a direct regulator of S1PR1. Thus, the CAGE–S1PR1–miR–181b loop may provide clues to understanding the mechanism of CAGE-promoted anti-cancer drug resistance. It is necessary to examine the role of S1PR1 for a better understanding of CAGE-promoted anti-cancer drug resistance. The TargetScan analysis predicted miRNAs that can bind to the 3′ UTR of CAGEs (Supplementary Figure S1). These miRNAs may regulate the expression of CAGEs and anti-cancer drug resistance.
SOX2 is closely related to cancer stemness-related features [42,43]. Autophagy activation contributes to cancer stem cell-like properties [44]. We found that AGSR cells displayed higher autophagic flux than AGS cells. Cancer stem cell-like properties are known to contribute to chemotherapy resistance in breast cancer cells [45]. It would be interesting to examine whether CAGEs can bind to the promoter sequences of SOX2 in the future. A high expression of SOX2 can promote the resistance of melanoma cells to anti-programmed death ligand-1 (PD-L1) therapy [46].
We found that the culture medium of AGSR cells increased HDAC9 expression and autophagic flux in AGS cells (Figure 7A). The exosomes of AGSR cells are likely to increase HDAC9 expression in AGS cells. Thus, the exosomes of AGSR cells may confer resistance to anti-cancer drugs by promoting autophagic flux. Future studies should examine the presence of CAGEs and HDAC9 in the exosomes of AGSR cells.
Cisplatin resistance is accompanied by an increased level of PD-L1 in non-small cell lung cancer cells [47]. AGSR cells might express a higher level of PD-L1 than AGS cells. It will be interesting to examine the resistance of AGSR cells to cisplatin.

5. Conclusions

We provided a novel mechanism of CAGE-promoted anti-cancer drug resistance. Further studies on HDAC9 and miR-512 are necessary for a better understanding of CAGE-promoted anti-cancer drug resistance in relation to autophagy. It would be also necessary to examine whether CAGEs and HDAC9 can promote anti-cancer drug resistance in other gastric cancer cell lines by establishing various anti-cancer drug-resistant cell lines. Although AGSR cells showed resistance to chemotherapeutic drugs, whether AGSR cells are resistant to immunotherapeutic reagents such as anti-PD-L1 antibody remains unclear. This merits further study. It is necessary to determine the oncogenic and metastatic potential of AGSR cells. It is also necessary to examine whether AGSR cells can display in vivo anti-cancer drug resistance. The roles of CAGEs, HDAC9, and miR-512 in in vivo anti-cancer drug resistance of AGSR cells also merit further study.

Supplementary Materials

The following supporting information can be downloaded at: https://www.mdpi.com/article/10.3390/cimb46060311/s1.

Author Contributions

D.J. conceived this study. M.Y., N.K. and J.J. performed the experimental work. M.Y., N.K. and D.J. analyzed and interpreted the data. D.J. wrote the manuscript. All authors have read and agreed to the published version of the manuscript.

Funding

This research was supported by the National Research Foundation Grants (2020R1A2C1006996, 2022R1F1A1060031, and 2017M3A9G7072417), a grant from the BK21 plus four Program.

Institutional Review Board Statement

Not applicable.

Informed Consent Statement

Not applicable.

Data Availability Statement

All data generated or analyzed during this study are included in this published article and its Supplementary Information Files. The original contributions presented in this study are included in the article/Supplementary Materials. Further inquiries can be directed to the corresponding author.

Conflicts of Interest

The authors report no conflicts of interest.

References

  1. Cho, B.; Lim, Y.; Lee, D.Y.; Park, S.Y.; Lee, H.; Kim, W.H.; Yang, H.; Bang, Y.J.; Jeoung, D.I. Identification and characterization of a novel cancer/testis antigen gene CAGE. Biochem. Biophys. Res. Commun. 2002, 292, 715–726. [Google Scholar] [CrossRef] [PubMed]
  2. Iwata, T.; Fujita, T.; Hirao, N.; Matsuzaki, Y.; Okada, T.; Mochimaru, H.; Susumu, N.; Matsumoto, E.; Sugano, K.; Yamashita, N.; et al. Frequent immune responses to a cancer/testis antigen, CAGE, in patients with microsatellite instability-positive endometrial cancer. Clin. Cancer Res. 2005, 11, 3949–3957. [Google Scholar] [CrossRef] [PubMed]
  3. Meistere, I.; Werner, S.; Zayakin, P.; Siliņa, K.; Rulle, U.; Pismennaja, A.; Šantare, D.; Kikuste, I.; Isajevs, S.; Leja, M.; et al. The Prevalence of Cancer-Associated Autoantibodies in Patients with Gastric Cancer and Progressive Grades of Premalignant Lesions. Cancer Epidemiol. Biomark. Prev. 2017, 26, 1564–1574. [Google Scholar] [CrossRef] [PubMed]
  4. Liggins, A.P.; Lim, S.H.; Soilleux, E.J.; Pulford, K.; Banham, A.H. A panel of cancer-testis genes exhibiting broad-spectrum expression in haematological malignancies. Cancer Immun. 2010, 10, 8. [Google Scholar] [PubMed]
  5. Lee, T.S.; Kim, J.W.; Kang, G.H.; Park, N.H.; Song, Y.S.; Kang, S.B.; Lee, H.P. DNA hypomethylation of CAGE promotors in squamous cell carcinoma of uterine cervix. Ann. N. Y. Acad. Sci. 2006, 1091, 218–224. [Google Scholar] [CrossRef] [PubMed]
  6. Por, E.; Byun, H.J.; Lee, E.J.; Lim, J.H.; Jung, S.Y.; Park, I.; Kim, Y.M.; Jeoung, D.I.; Lee, H. The cancer/testis antigen CAGE with oncogenic potential stimulates cell proliferation by up-regulating cyclins D1 and E in an AP-1- and E2F-dependent manner. J. Biol. Chem. 2010, 285, 14475–14485. [Google Scholar] [CrossRef] [PubMed]
  7. Kim, Y.; Park, H.; Park, D.; Lee, Y.S.; Choe, J.; Hahn, J.H.; Lee, H.; Kim, Y.M.; Jeoung, D. Cancer/testis antigen CAGE exerts negative regulation on p53 expression through HDAC2 and confers resistance to anti-cancer drugs. J. Biol. Chem. 2010, 285, 25957–25968. [Google Scholar] [CrossRef] [PubMed]
  8. Kim, Y.; Park, D.; Kim, H.; Choi, M.; Lee, H.; Lee, Y.S.; Choe, J.; Kim, Y.M.; Jeoung, D. miR-200b and cancer/testis antigen CAGE form a feedback loop to regulate the invasion and tumorigenic and angiogenic responses of a cancer cell line to microtubule-targeting drugs. J. Biol. Chem. 2013, 288, 36502–36518. [Google Scholar] [CrossRef]
  9. Kim, Y.; Kim, H.; Park, D.; Lee, H.; Lee, Y.S.; Choe, J.; Kim, Y.M.; Jeon, D.; Jeoung, D. The pentapeptide Gly-Thr-Gly-Lys-Thr confers sensitivity to anti-cancer drugs by inhibition of CAGE binding to GSK3β and decreasing the expression of cyclinD1. Oncotarget 2017, 8, 13632–13651. [Google Scholar] [CrossRef]
  10. Kim, H.; Kim, Y.; Jeoung, D. DDX53 Promotes Cancer Stem Cell-Like Properties and Autophagy. Mol. Cells 2017, 40, 54–65. [Google Scholar] [CrossRef]
  11. Yeon, M.; Kim, Y.; Pathak, D.; Kwon, E.; Kim, D.Y.; Jeong, M.S.; Jung, H.S.; Jeoung, D. The CAGE-MiR-181b-5p-S1PR1 Axis Regulates Anticancer Drug Resistance and Autophagy in Gastric Cancer Cells. Front. Cell Dev. Biol. 2021, 9, 666387. [Google Scholar] [CrossRef] [PubMed]
  12. Yuan, F.; Zhou, Z.F. Exosomes derived from Taxol-resistant nasopharyngeal carcinoma (NPC) cells transferred DDX53 to NPC cells and promoted cancer resistance to Taxol. Eur. Rev. Med. Pharmacol. Sci. 2021, 25, 127–138. [Google Scholar] [PubMed]
  13. Yang, C.; Croteau, S.; Hardy, P. Histone deacetylase (HDAC) 9: Versatile biological functions and emerging roles in human cancer. Cell. Oncol. 2021, 44, 997–1017. [Google Scholar] [CrossRef] [PubMed]
  14. Zhao, Y.X.; Wang, Y.S.; Cai, Q.Q.; Wang, J.Q.; Yao, W.T. Up-regulation of HDAC9 promotes cell proliferation through suppressing p53 transcription in osteosarcoma. Int. J. Clin. Exp. Med. 2015, 8, 11818–11823. [Google Scholar] [PubMed]
  15. Gil, V.S.; Bhagat, G.; Howell, L.; Zhang, J.; Kim, C.H.; Stengel, S.; Vega, F.; Zelent, A.; Petrie, K. Deregulated expression of HDAC9 in B cells promotes development of lymphoproliferative disease and lymphoma in mice. Dis. Models Mech. 2016, 9, 1483–1495. [Google Scholar]
  16. Xiong, K.; Zhang, H.; Du, Y.; Tian, J.; Ding, S. Identification of HDAC9 as a viable therapeutic target for the treatment of gastric cancer. Exp. Mol. Med. 2019, 51, 1–15. [Google Scholar] [CrossRef] [PubMed]
  17. Zhu, Y.; Hao, F. Knockdown of long non-coding RNA HCP5 suppresses the malignant behavior of retinoblastoma by sponging miR-3619-5p to target HDAC9. Int. J. Mol. Med. 2021, 47, 74. [Google Scholar] [CrossRef] [PubMed]
  18. Zhong, L.; Yan, J.; Li, H.; Meng, L. HDAC9 Silencing Exerts Neuroprotection Against Ischemic Brain Injury via miR-20a-Dependent Downregulation of NeuroD1. Front. Cell. Neurosci. 2021, 14, 544285. [Google Scholar] [CrossRef] [PubMed]
  19. El-Awady, R.; Saleh, E.; Hamoudi, R.; Ramadan, W.S.; Mazitschek, R.; Nael, M.A.; Elokely, K.M.; Abou-Gharbia, M.; Childers, W.E.; Srinivasulu, V.; et al. Discovery of novel class of histone deacetylase inhibitors as potential anticancer agents. Bioorg. Med. Chem. 2021, 42, 116251. [Google Scholar] [CrossRef]
  20. Lecce, L.; Xu, Y.; V’Gangula, B.; Chandel, N.; Pothula, V.; Caudrillier, A.; Santini, M.P.; d’Escamard, V.; Ceholski, D.K.; Gorski, P.A.; et al. Histone deacetylase 9 promotes endothelial-mesenchymal transition and an unfavorable atherosclerotic plaque phenotype. J. Clin. Investig. 2021, 131, e131178. [Google Scholar] [CrossRef]
  21. Kim, B.; Sohn, H.M.; Hyun, H.; Lim, W. Effect of HDAC9 inhibition on epithelial-mesenchymal transition in CD133+ prostate cancer cell lines. J. Chemother. 2022, 34, 45–54. [Google Scholar] [CrossRef] [PubMed]
  22. Zhang, Z.; Zhang, L.; Zhou, Y.; Li, L.; Zhao, J.; Qin, W.; Jin, Z.; Liu, W. Increase in HDAC9 suppresses myoblast differentiation via epigenetic regulation of autophagy in hypoxia. Cell Death Dis. 2019, 10, 552. [Google Scholar] [CrossRef] [PubMed]
  23. Lian, B.; Pei, Y.C.; Jiang, Y.Z.; Xue, M.Z.; Li, D.Q.; Li, X.G.; Zheng, Y.Z.; Liu, X.Y.; Qiao, F.; Sun, W.L. Truncated HDAC9 identified by integrated genome-wide screen as the key modulator for paclitaxel resistance in triple-negative breast cancer. Theranostics 2020, 10, 11092–11109. [Google Scholar] [CrossRef] [PubMed]
  24. Jiang, Y.; Cong, X.; Jiang, S.; Dong, Y.; Zhao, L.; Zang, Y.; Tan, M.; Li, J. Phosphoproteomics Reveals AMPK Substrate Network in Response to DNA Damage and Histone Acetylation. Genom. Proteom. Bioinform. 2021, 20, 597–613. [Google Scholar] [CrossRef] [PubMed]
  25. Guan, Y.; Yang, J.; Liu, X.; Chu, L. Long noncoding RNA CBR3 antisense RNA 1 promotes the aggressive phenotypes of non-small-cell lung cancer by sponging microRNA-509-3p and competitively upregulating HDAC9 expression. Oncol. Rep. 2020, 44, 1403–1414. [Google Scholar] [CrossRef] [PubMed]
  26. Yang, Z.; Zhang, L.; Liu, J.; Yang, L.; Xue, H.; Bai, S.; Wang, K. PD-L1 combined with HDAC9 is a useful prognostic predictor in hepatocellular carcinoma. Transl. Cancer Res. 2021, 10, 2305–2317. [Google Scholar] [CrossRef] [PubMed]
  27. Chen, L.; Fei, Y.; Zhao, Y.; Chen, Q.; Chen, P.; Pan, L. Expression and prognostic analyses of HDACs in human gastric cancer based on bioinformatic analysis. Medicine 2021, 100, e26554. [Google Scholar] [CrossRef]
  28. Xu, L.; Li, W.; Shi, Q.; Wang, M.; Li, H.; Yang, X.; Zhang, J. MicroRNA-936 inhibits the malignant phenotype of retinoblastoma by directly targeting HDAC9 and deactivating the PI3K/AKT pathway. Oncol. Rep. 2020, 43, 635–645. [Google Scholar] [CrossRef] [PubMed]
  29. Kanki, K.; Watanabe, R.; Thai, L.N.; Zhao, C.H.; Naito, K. HDAC9 Is Preferentially Expressed in Dedifferentiated Hepatocellular Carcinoma Cells and Is Involved in an Anchorage-Independent Growth. Cancers 2020, 12, 2734. [Google Scholar] [CrossRef]
  30. Huang, N.; Xu, C.; Deng, L.; Li, X.; Bian, Z.; Zhang, Y.; Long, S.; Chen, Y.; Zhen, N.; Li, G. PAICS contributes to gastric carcinogenesis and participates in DNA damage response by interacting with histone deacetylase 1/2. Cell Death Dis. 2020, 11, 507. [Google Scholar] [CrossRef]
  31. Sun, J.; Piao, J.; Li, N.; Yang, Y.; Kim, K.Y.; Lin, Z. Valproic acid targets HDAC1/2 and HDAC1/PTEN/Akt signalling to inhibit cell proliferation via the induction of autophagy in gastric cancer. FEBS J. 2020, 287, 2118–2133. [Google Scholar] [CrossRef] [PubMed]
  32. Orenay-Boyacioglu, S.; Kasap, E.; Gerceker, E.; Yuceyar, H.; Demirci, U.; Bilgic, F.; Korkmaz, M. Expression profiles of histone modification genes in gastric cancer progression. Mol. Biol. Rep. 2018, 45, 2275–2282. [Google Scholar] [CrossRef]
  33. Dong, J.; Zheng, N.; Wang, X.; Tang, C.; Yan, P.; Zhou, H.B.; Huang, J. A novel HDAC6 inhibitor exerts an anti-cancereffect by triggering cell cycle arrest and apoptosis in gastric cancer. Eur. J. Pharmacol. 2018, 828, 67–79. [Google Scholar] [CrossRef]
  34. Jo, H.; Shim, K.; Jeoung, D. Targeting HDAC6 to Overcome Autophagy-Promoted Anti-Cancer Drug Resistance. Int. J. Mol. Sci. 2022, 23, 9592. [Google Scholar] [CrossRef] [PubMed]
  35. Huang, Y.; Zheng, W.; Ji, C.; Wang, X.; Yu, Y.; Deng, X.; Zhou, X.; Fang, L. Circular RNA circRPPH1 promotes breast cancer progression via circRPPH1-miR-512-5p-STAT1 axis. Cell Death Discov. 2021, 7, 376. [Google Scholar] [CrossRef] [PubMed]
  36. Shi, Z.; Shen, C.; Yu, C.; Yang, X.; Shao, J.; Guo, J.; Zhu, X.; Zhou, G. Long non-coding RNA LINC00997 silencing inhibits the progression and metastasis of colorectal cancer by sponging miR-512-3p. Bioengineered 2021, 12, 627–639. [Google Scholar] [CrossRef] [PubMed]
  37. Yang, H.; Zhang, X.; Zhu, L.; Yang, Y.; Yin, X. YY1-Induced lncRNA PART1 Enhanced Resistance of Ovarian Cancer Cells to Cisplatin by Regulating miR-512-3p/CHRAC1 Axis. DNA Cell Biol. 2021, 40, 821–832. [Google Scholar] [CrossRef] [PubMed]
  38. Saito, Y.; Suzuki, H.; Tsugawa, H.; Nakagawa, I.; Matsuzaki, J.; Kanai, Y.; Hibi, T. Chromatin remodeling at Alu repeats by epigenetic treatment activates silenced microRNA-512-5p with downregulation of Mcl-1 in human gastric cancer cells. Oncogene 2009, 28, 2738–2744. [Google Scholar] [CrossRef] [PubMed]
  39. Zou, C.; Liao, J.; Hu, D.; Su, Y.; Lin, H.; Lin, K.; Luo, X.; Zheng, X.; Zhang, L.; Huang, T. SNHG8 Promotes the Progression of Epstein-Barr Virus-Associated Gastric Cancer via SpongingmiR-512-5p and Targeting TRIM28. Front. Oncol. 2021, 11, 734694. [Google Scholar] [CrossRef] [PubMed]
  40. Yan, T.; Wu, M.; Lv, S.; Hu, Q.; Xu, W.; Zeng, A.; Huang, K.; Zhu, X. Exosomes derived from microRNA-512-5p-transfected bone mesenchymal stem cells inhibit glioblastoma progression by targeting JAG1. Aging 2021, 13, 9911–9926. [Google Scholar] [CrossRef] [PubMed]
  41. Kong, M.; Han, Y.; Zhao, Y.; Zhang, H. miR-512-3p Overcomes Resistance to Cisplatin in Retinoblastoma by Promoting Apoptosis Induced by Endoplasmic Reticulum Stress. Med. Sci. Monit. 2020, 26, e923817. [Google Scholar] [CrossRef] [PubMed]
  42. Chen, W.W.; Gong, K.K.; Yang, L.J.; Dai, J.J.; Zhang, Q.; Wang, F.; Li, X.L.; Xi, S.C.; Du, J.; Scutellariabarbata, D. Don extraction selectively targets stemness-prone NSCLC cells by attenuating SOX2/SMO/GLI1 network loop. J. Ethnopharmacol. 2021, 265, 113295. [Google Scholar] [CrossRef] [PubMed]
  43. Samy, A.L.P.A.; Bakthavachalam, V.; Vudutha, M.; Vinjamuri, S.; Chinnapaka, S.; Munirathinam, G. Eprinomectin, a novel semi-synthetic macrocylic lactone is cytotoxic to PC3 metastatic prostate cancer cells via inducing apoptosis. Toxicol. Appl. Pharmacol. 2020, 401, 115071. [Google Scholar] [CrossRef] [PubMed]
  44. Chen, Y.; Zhao, H.; Liang, W.; Jiang, E.; Zhou, X.; Shao, Z.; Liu, K.; Shang, Z. Autophagy regulates the cancer stem cell phenotype of head and neck squamous cell carcinoma through the noncanonical FOXO3/SOX2 axis. Oncogene 2022, 41, 634–646. [Google Scholar] [CrossRef]
  45. Bhattacharya, A.; Mukherjee, S.; Khan, P.; Banerjee, S.; Dutta, A.; Banerjee, N.; Sengupta, D.; Basak, U.; Chakraborty, S.; Dutta, A.; et al. SMAR1 repression by pluripotency factors and consequent chemoresistance in breast cancer stem-like cells is reversed by aspirin. Sci. Signal 2020, 13, eaay6077. [Google Scholar] [CrossRef]
  46. Wu, R.; Wang, C.; Li, Z.; Xiao, J.; Li, C.; Wang, X.; Kong, P.; Cao, J.; Huang, F.; Li, Z. SOX2 promotes resistance of melanoma with PD-L1 high expression to T-cell-mediated cytotoxicity that can be reversed by SAHA. J. Immunother. Cancer 2020, 8, e001037. [Google Scholar] [CrossRef]
  47. Jiang, Z.; Yang, Y.; Yang, Y.; Zhang, Y.; Yue, Z.; Pan, Z.; Ren, X. Ginsenoside Rg3 attenuates cisplatin resistance in lung cancer by downregulating PD-L1 and resuming immune. Biomed. Pharmacother. 2017, 96, 378–383. [Google Scholar] [CrossRef]
Figure 1. AGSR cells show increased expression of CAGEs and HDAC9. (A) Each cancer cell line was treated with various concentrations of celastrol or taxol for 48 h. The sensitivity of each cancer cell line to the indicated anti-cancer drug was determined by an MTT assay. The IC50 value was determined by GraphPad Prism 7 Software. Average values of three independent experiments are shown. (B) Representative images are shown. The uncropped blots are shown in Supplementary Materials. (C) qRT-PCR was performed. **, p < 0.01. (D) Immunoblot was performed. Representative images were shown.
Cimb 46 00311 g001
Figure 2. CAGEs directly regulate expression of HDAC9. (A) Immunoblot was performed (upper) 48 h after transfection with indicated construct (each at 1 μg). AGSR cells were transfected with indicated siRNA (each at 10 nM). Immunoblot was performed (lower) 48 h after transfection. Representative images are shown. (B) Promoter sequences of HDAC9 contain potential binding sites for various transcription factors. *, p < 0.05. (C) Luciferase activity assays were performed 48 h after transfection with indicated construct (each at 1 μg). **, p < 0.01. (D) ChIP assays were performed as described. (E) Immunoprecipitation was performed as described. Isotype-matched IgG (2 μg/mL) was also used for immunoprecipitation. Representative images are shown.
Cimb 46 00311 g002
Figure 3. HDAC9 is necessary for increased autophagic flux in AGSR cells. (A) AGS cells were treated without or with rapamycin (5 μM) for 24 h (left). AGSR cells were treated without or with chloroquine (100 μM) for 24 h (right). Representative images are shown. (B) Immunoblot was performed 48h after transfection with the indicated siRNA (each at 10 nM). Representative images are shown. (C) Same as (B), except that immunofluorescence staining was performed. ***, p < 0.001. Representative images are shown. (D) Here, 24 h after transfection with each siRNA (10 nM), AGSR cells were treated with celastrol (1 μM) or taxol (1 μM) for 24 h. Representative images of three independent experiments are shown. The uncropped blots are shown in Supplementary Materials.
Cimb 46 00311 g003
Figure 4. HDAC9 is necessary for invasion/migration and tumor spheroid forming potential of AGSR cells. (A) Invasion and migration assays of AGSR cells (104 cells) were carried out 48 h after transfection with each siRNA (10 nM). **, p < 0.01. (B) Immunoblot was performed 48 h after transfection. Representative images of three independent experiments are shown. The uncropped blots are shown in Supplementary Materials. (C) Tumor spheroid formation assays of AGSR cells were carried out 48 h after transfection. *, p < 0.05. Those larger than 50 μm were counted as tumor spheroids. (D) Cell lysates were subjected to immunoprecipitation (left). Cell lysates were subjected to immunoblot analysis 48 h after transfection. Representative images are shown. Isotype-matched IgG (2 μg/mL) was also used for immunoprecipitation. (E) AGSR cells (200 cells) were subjected to colony formation assays 48 h after transfection. **, p < 0.01.
Cimb 46 00311 g004
Figure 5. miR-512 directly regulates the expression of HDAC9. (A) Cell lysates were subjected to qRT-PCR. ***, p < 0.001. (B) Wild-type Luc-HDAC9 3′-UTR or mutant Luc-HDAC9 3′-UTR (each at 1 μg) was transfected, along with the indicated mimic (each at 10 nM), into AGSR cells. Luciferase activity assays were performed 48 h after transfection. **, p < 0.01. Luciferase activity assays were performed as described. Red color denotes mutant sequences.
Cimb 46 00311 g005
Figure 6. miR-512 decreases autophagic flux, invasion/migration, and cellular proliferation but enhances sensitivity to anti-cancer drugs. (A) qRT-PCR was performed 48 h after transfection with indicated mimic (each at 10 nM). ***, p < 0.001. (B) Same as (A), except that immunoblot was performed. Representative images are shown. (C) Same as (A), except that invasion/migration potential assays were performed. **, p < 0.01. (D) Colony forming potential assays were performed. Two hundred cells were subjected to colony forming potential assays 48 h after transfection. *, p < 0.01. (E) AGSR cells were transiently transfected with indicated siRNA (each at 10 nM). Then, 24 h after transfection with each mimic (10 nM), cells were treated with celastrol (1 μM) or taxol (1 μM) for 24 h, followed by immunoblot. Representative images are shown. (F) Immunofluorescence staining was performed 48 h after transfection with the indicated mimic (each at 10 nM). ***, p < 0.001. (G) Here, 24 h after transfection with each mimic (each at 10 nM), cells were treated with various concentrations of celastrol or taxol for 24 h. MTT assays were then performed. Average values of three independent experiments are shown. GraphPad Prism statistics program (GraphPad Prism Software, Version 7) was used to determine IC50 value.
Cimb 46 00311 g006
Figure 7. Soluble factors regulate the expression of HDAC9. (A) Culture medium of AGSR cells was added to AGS cells. Immunoblot was performed 24 h after addition. Representative images are shown. C.M. denotes culture medium. (B) qRT-PCR was performed. ***, p < 0.001. (C) Culture medium of AGS cells was added to AGSR cells. Representative images are shown. (D) Same as (C), except that qRT-PCR was performed. ***, p < 0.001. (E) AGS cells were treated with human recombinant CAGE protein (1 μg/mL) for 24 h. Representative images are shown.
Cimb 46 00311 g007
Figure 8. AGSR cells display tumorigenic potential. (A) TCGA database shows RNA sequencing analysis of gastric cancer tissues with different grades. High expression level of HDAC9 is positively associated with poor differentiation and advanced stage of gastric cancer. Grade 1 (n = 12): well-differentiated; Grade 2: moderately differentiated; Grade 3: poorly differentiated (n = 246); Stage 1 (n = 18); Stage 2 (n = 123); Stage 3 (n = 169); and Stage 4 (n = 41). TPM denotes transcripts per million. STAD denotes stomach adenocarcinoma. UALCAN online software (https://ualcan.path.uab.edu/, accessed on 28 February 2024) was used for TCGA database analysis. (B) Indicated cancer cells (each at 5 × 10⁶ cells) were injected into dorsal flanks of athymic nude mice. Each experimental group comprised five athymic nude mice. **, p < 0.01 and ***, p < 0.001. (C) Immunoblot was performed using tumor tissue lysates. Numbers denote tissues of tumor (AGSR) or corresponding normal tissue (AGS). Representative images of three independent experiments are shown.
Cimb 46 00311 g008
Disclaimer/Publisher’s Note: The statements, opinions and data contained in all publications are solely those of the individual author(s) and contributor(s) and not of MDPI and/or the editor(s). MDPI and/or the editor(s) disclaim responsibility for any injury to people or property resulting from any ideas, methods, instructions or products referred to in the content.

