
Variability in Leaf Color Induced by Chlorophyll Deficiency: Transcriptional Changes in Bamboo Leaves

 , and
, and 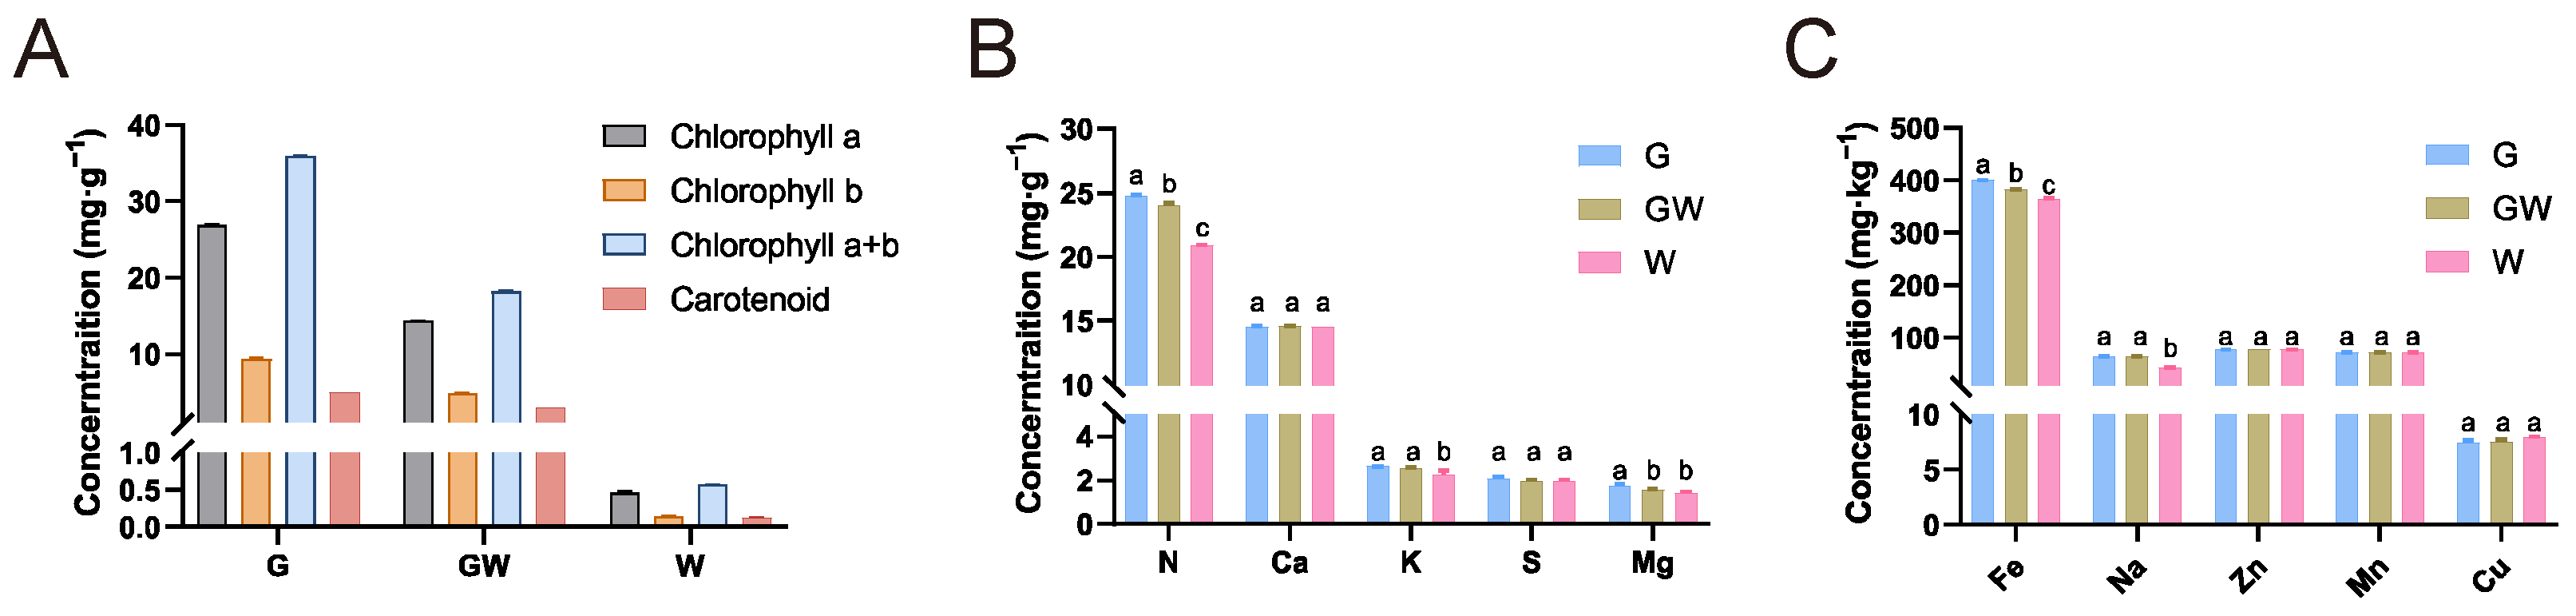
Abstract
1. Introduction
2. Methods
2.1. Plant Materials and Transcriptome Sequencing
2.2. Measurement of Photosynthetic Pigments and Nutrient Concentrations
2.3. Assembly and Function Annotation
2.4. Alignment, Quantification, and Identification of DEGs
2.5. Expression Clustering and Functional Enrichment
3. Results
3.1. Photosynthetic Pigments and Nutrient Concentrations of Three Color Types
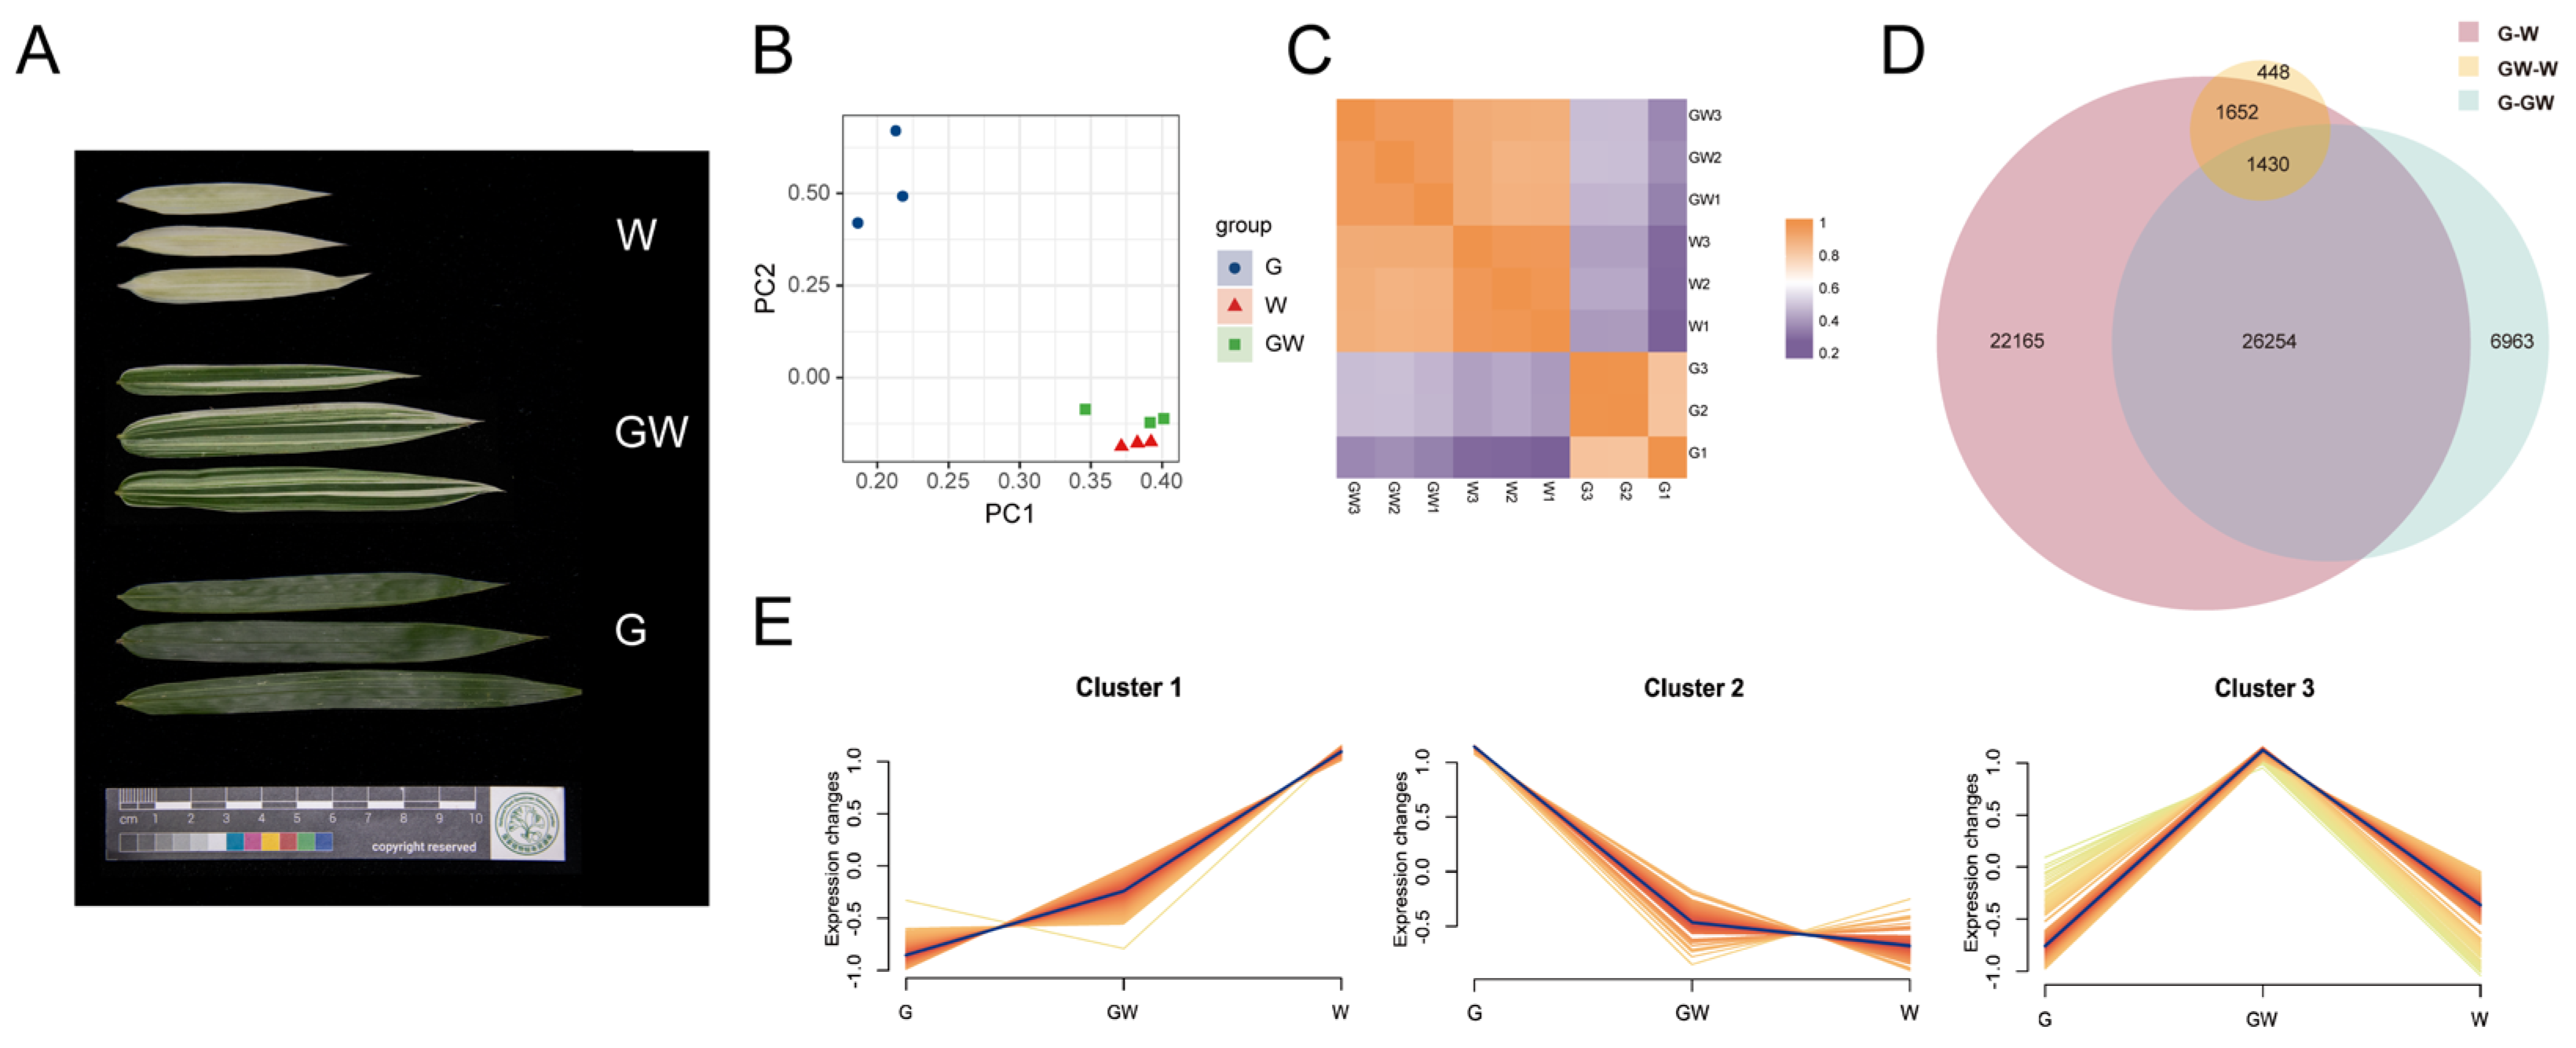
3.2. Summary of Sequencing Data and Assembly
3.3. Expression Quantification and Classification
3.4. Identification of DEGs
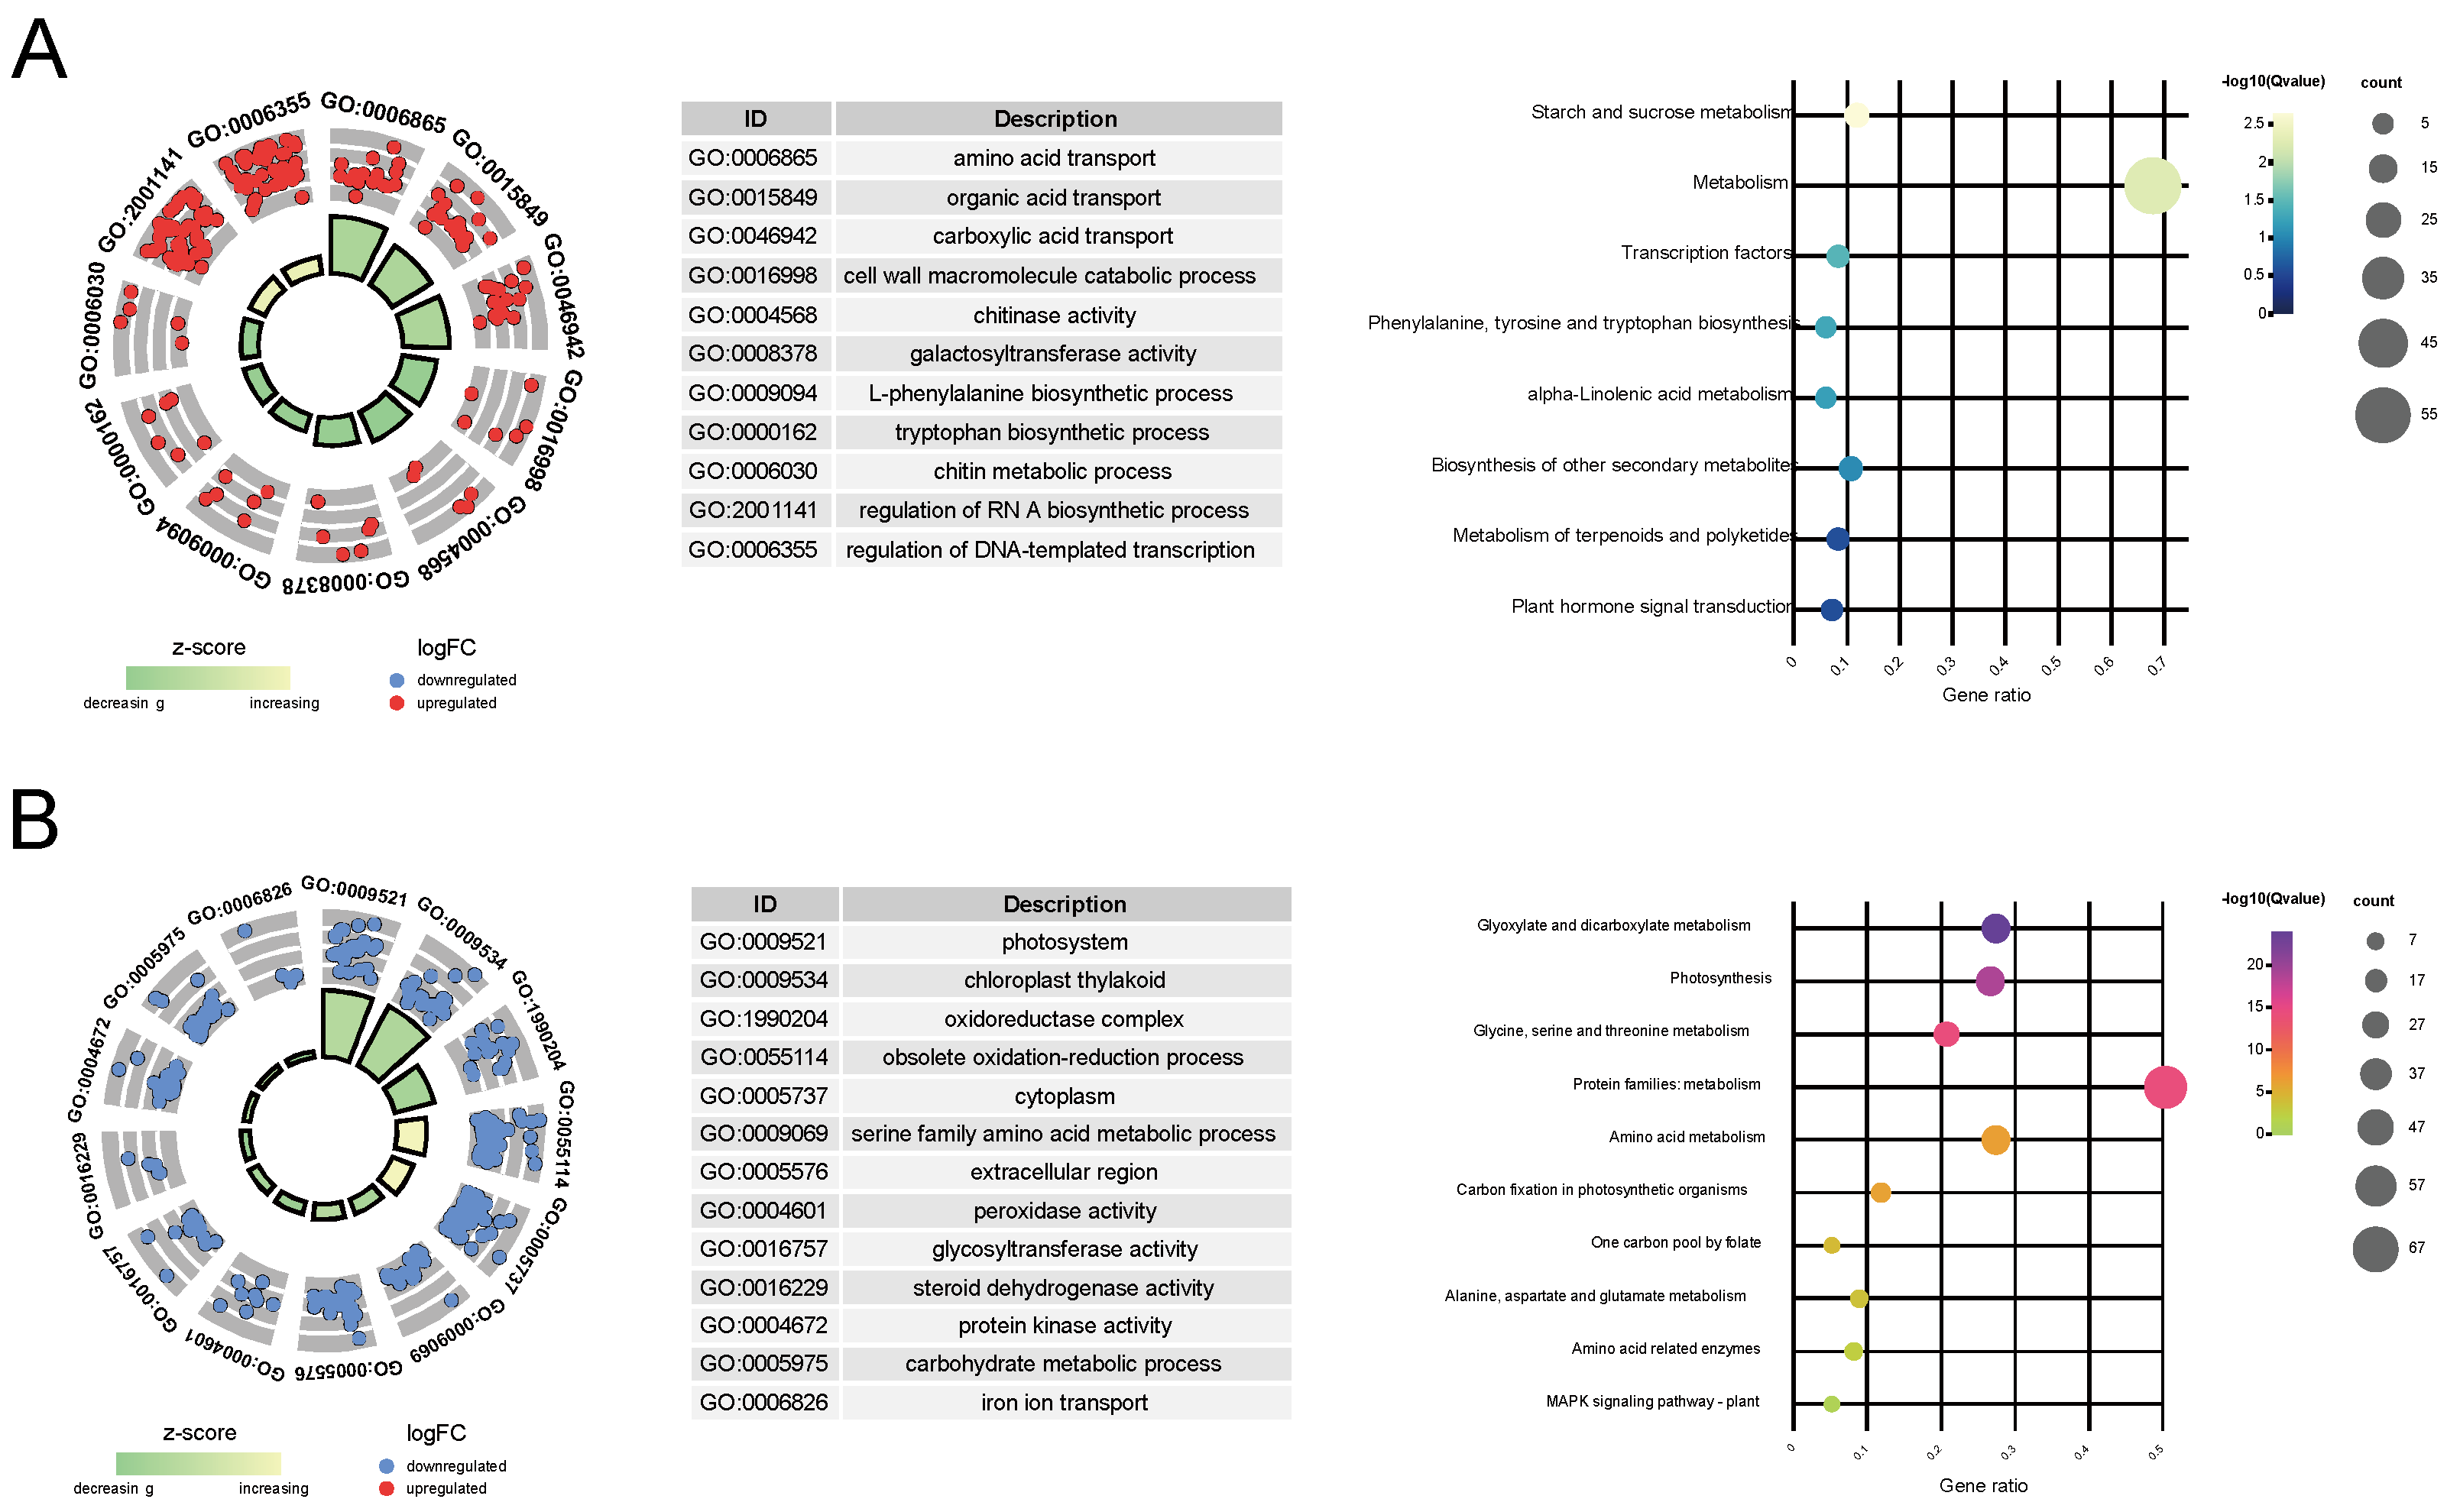
3.5. Function Annotation and Enrichment
4. Discussion
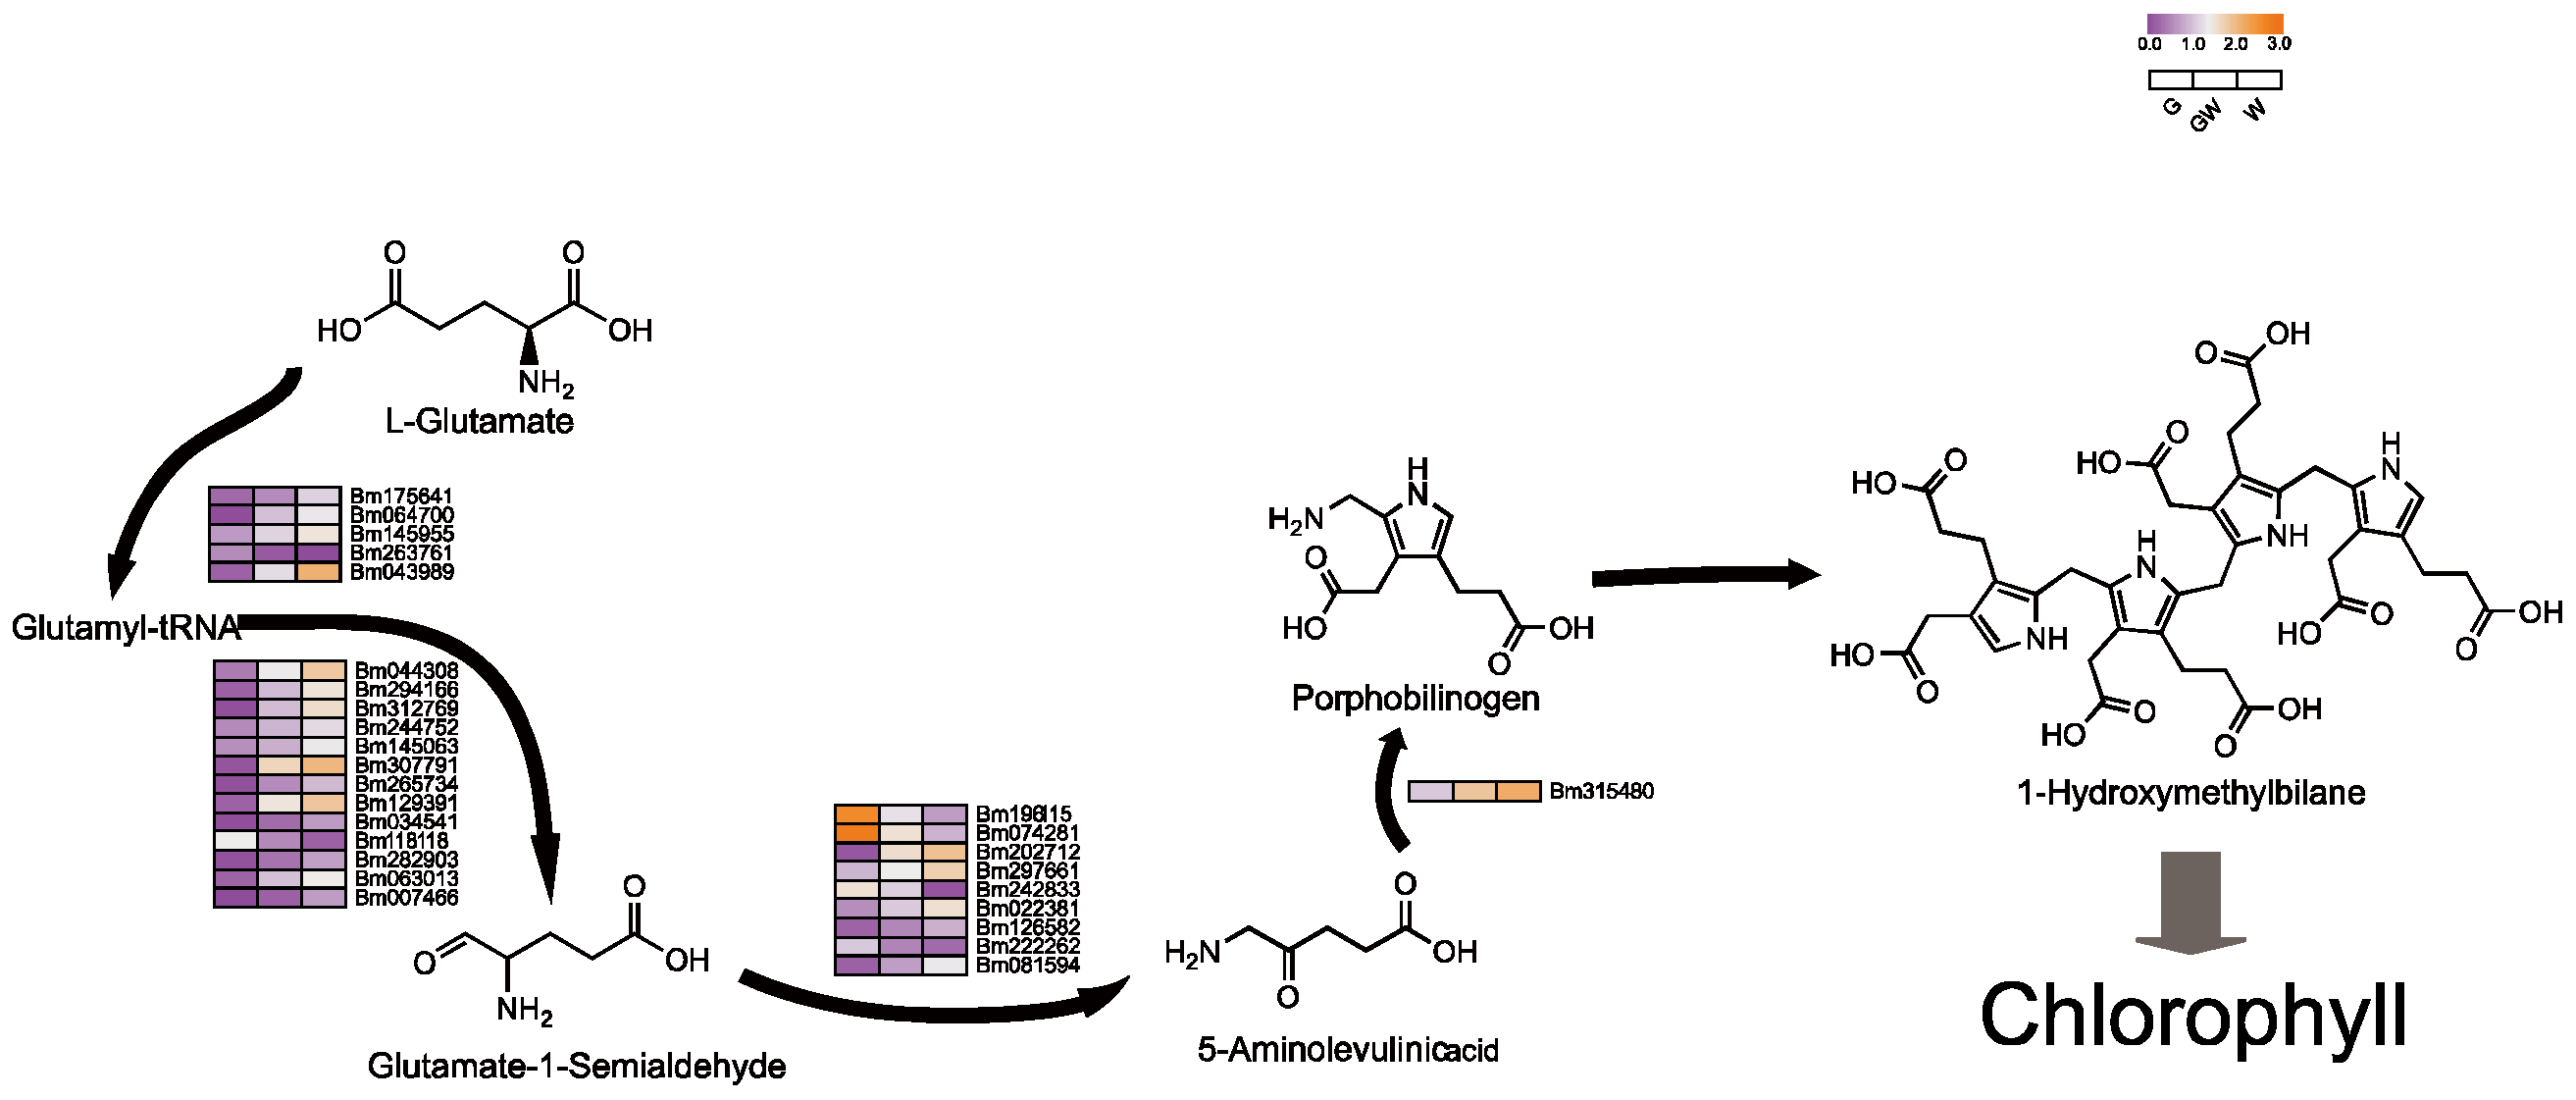
4.1. Chlorophyll Biosynthesis in Chlorophyll Deficiency in Bamboo Leaves
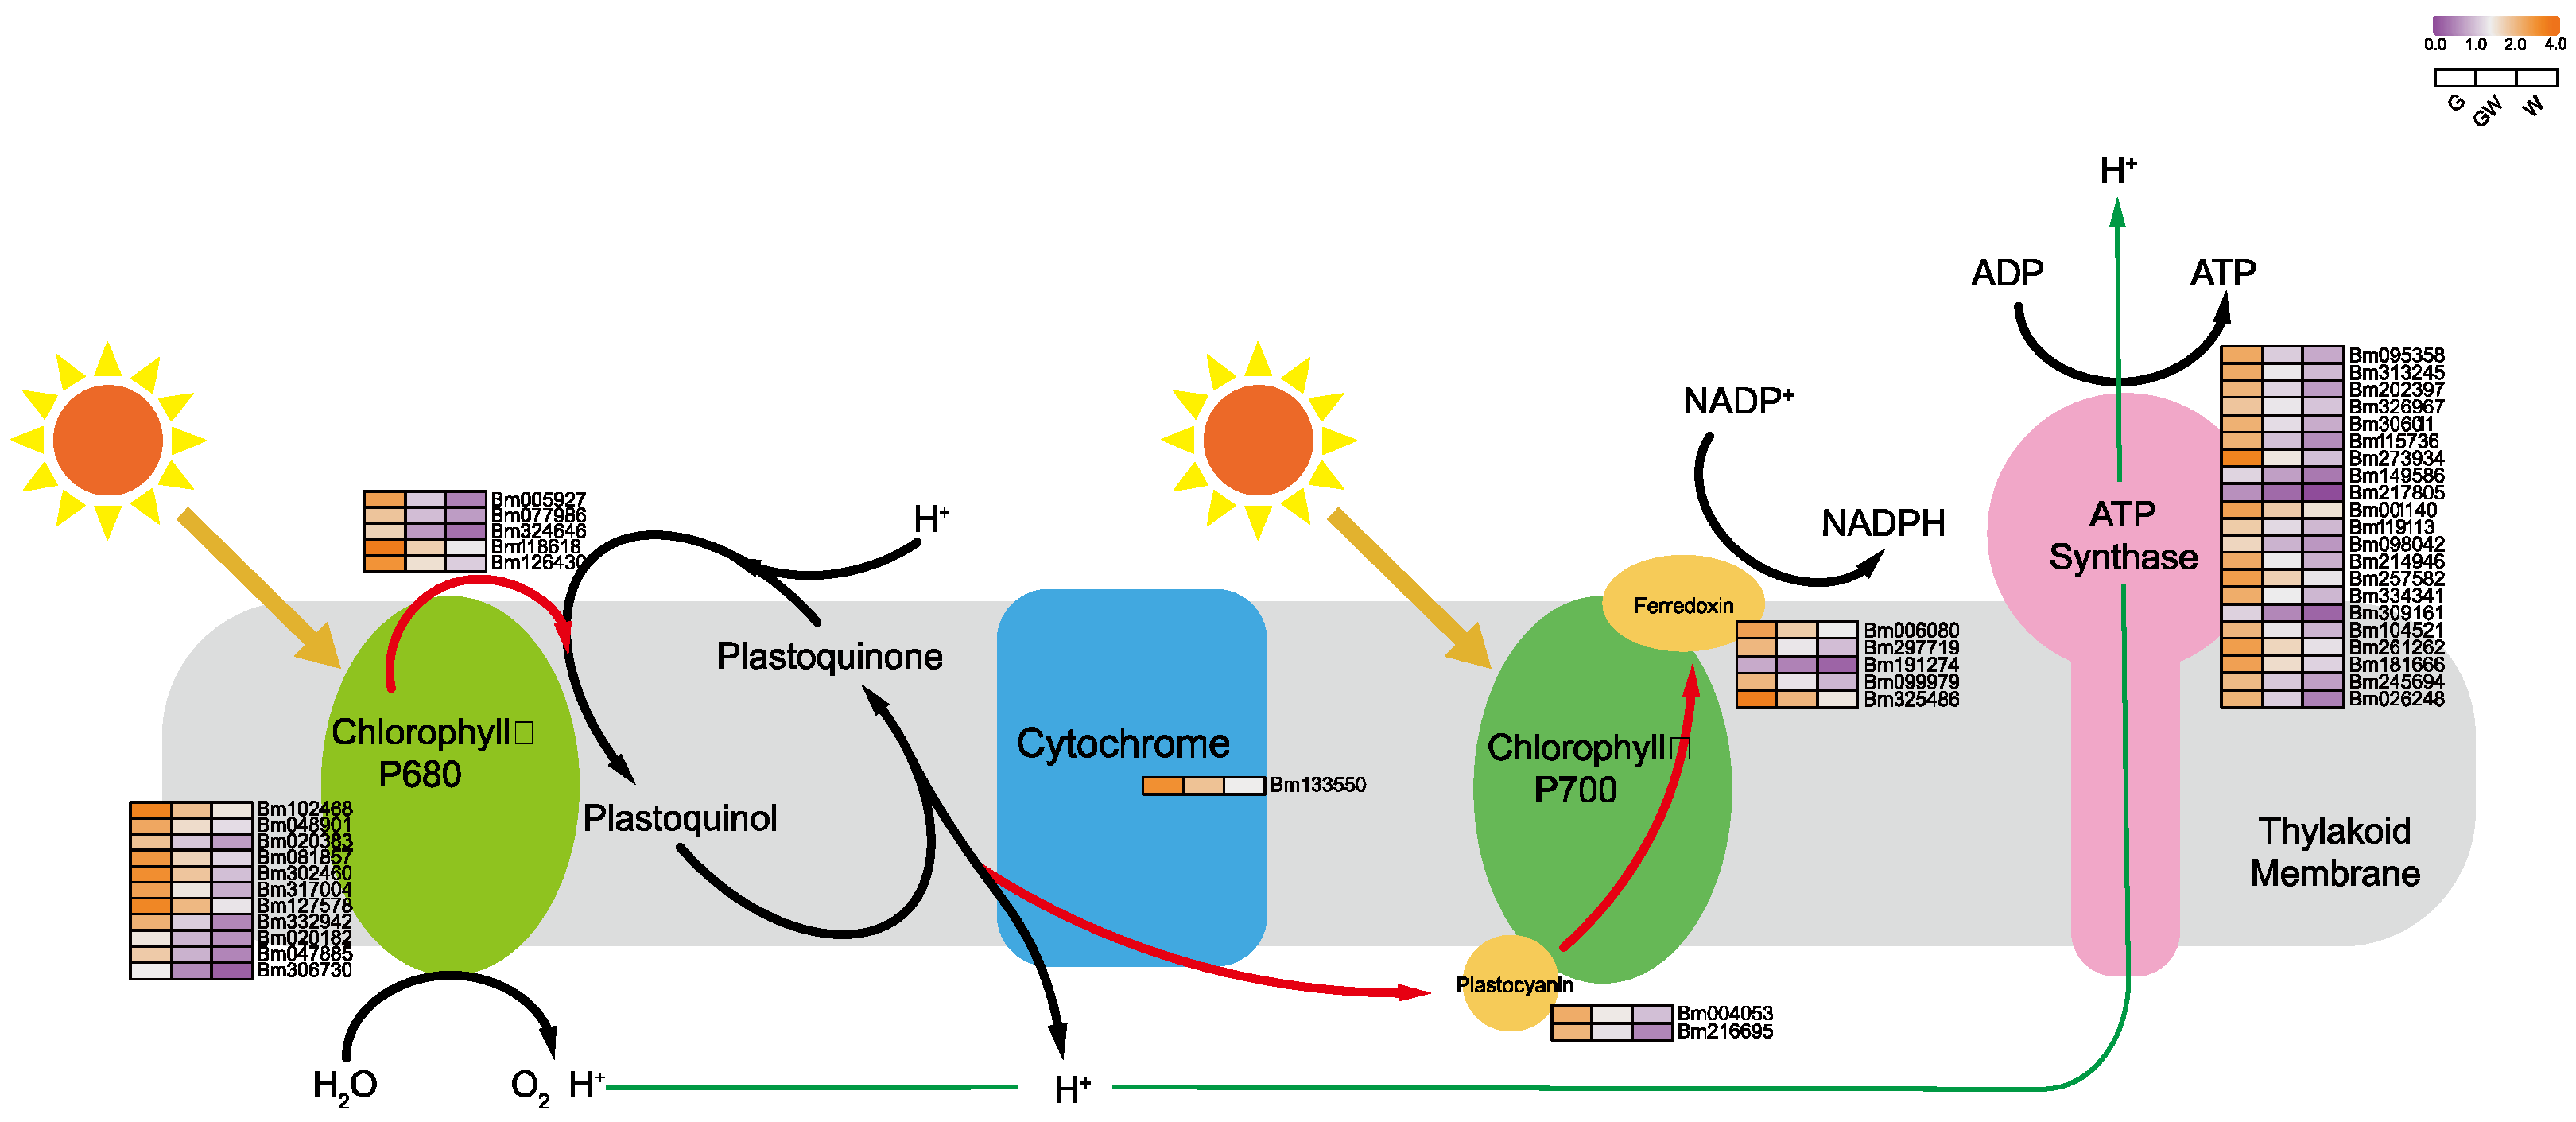
4.2. Chlorophyll Deficiency Induces Alterations in the Photosynthetic Process
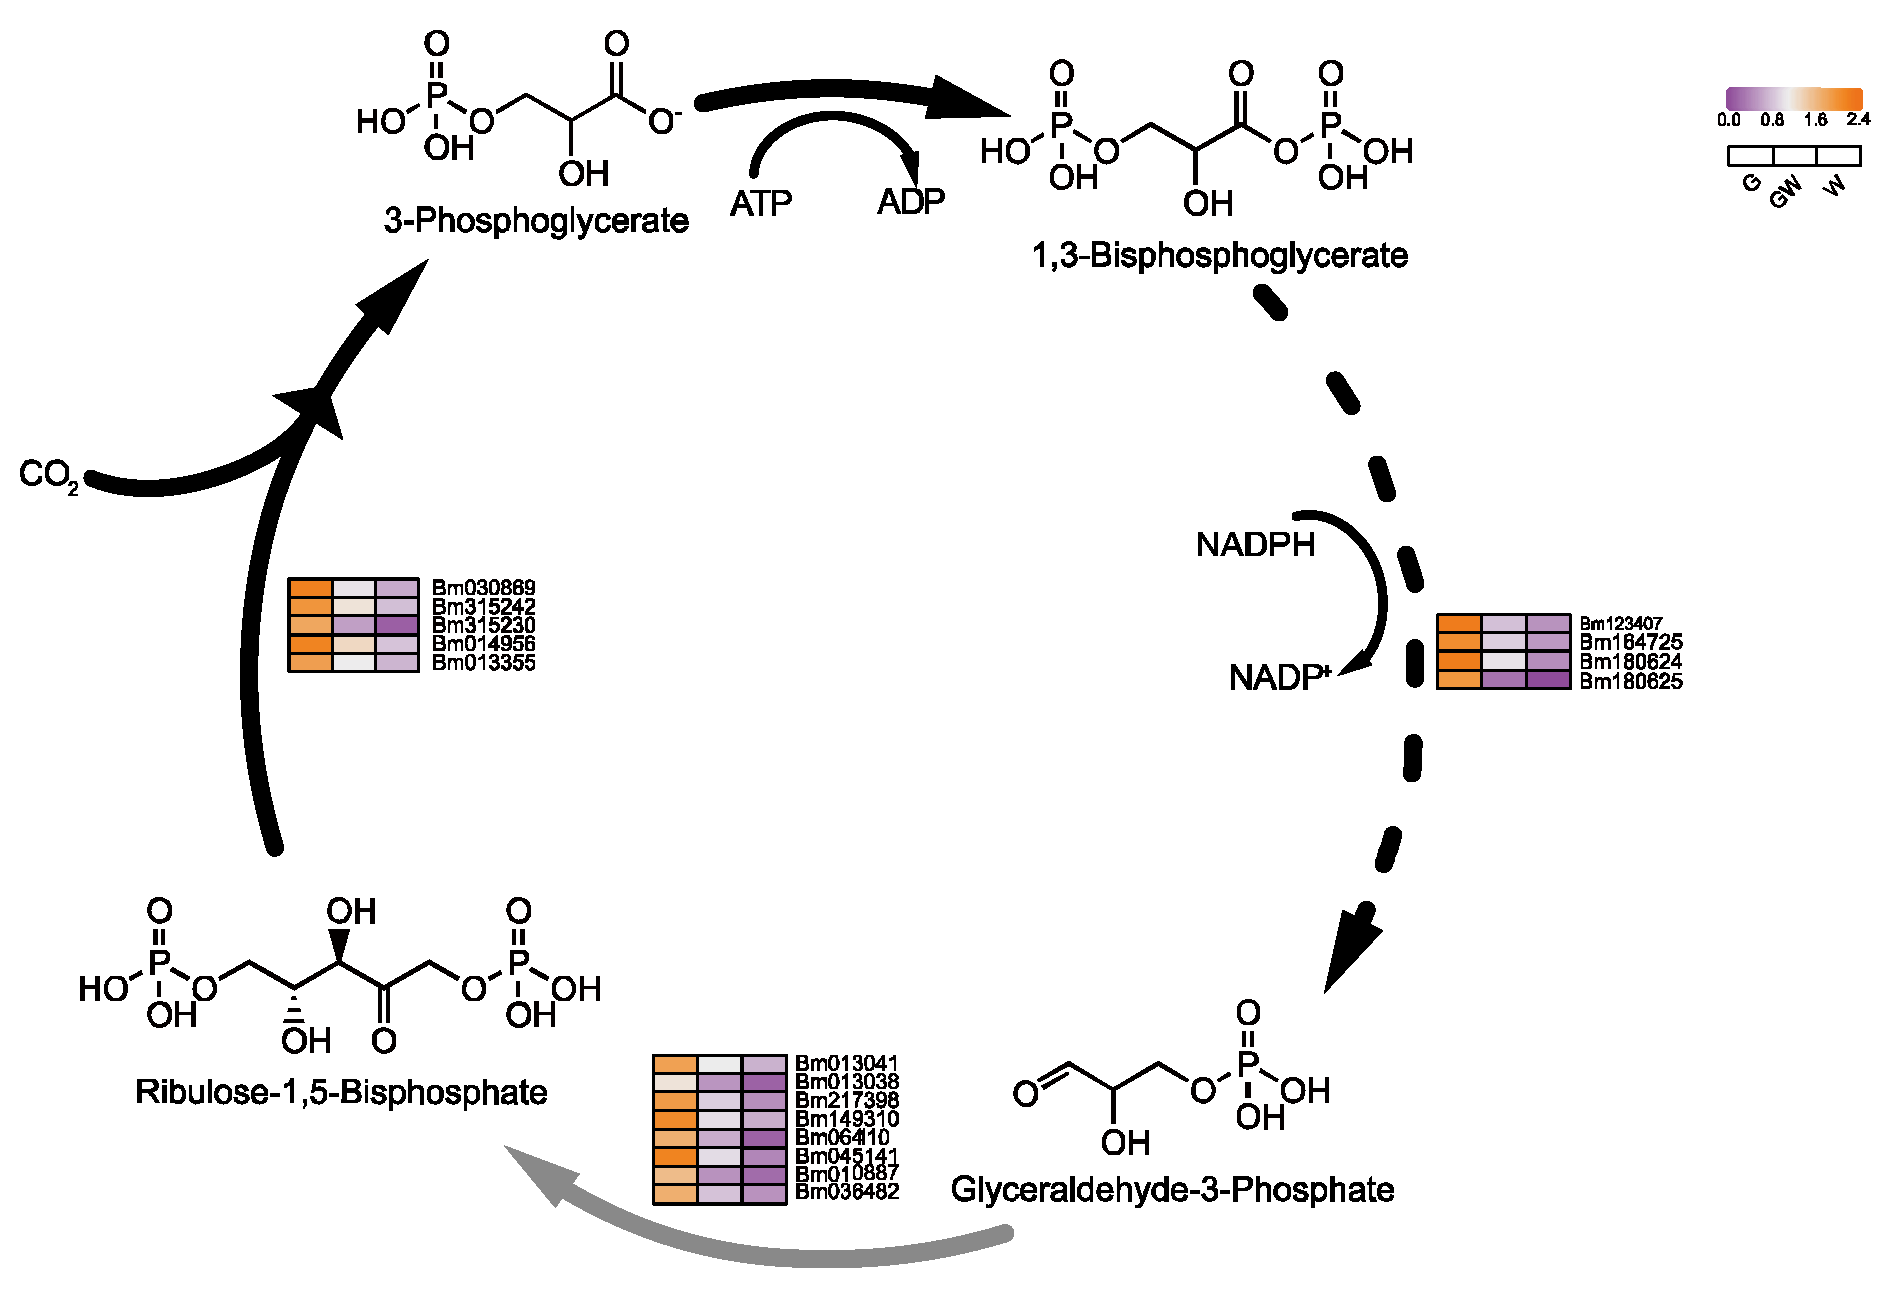
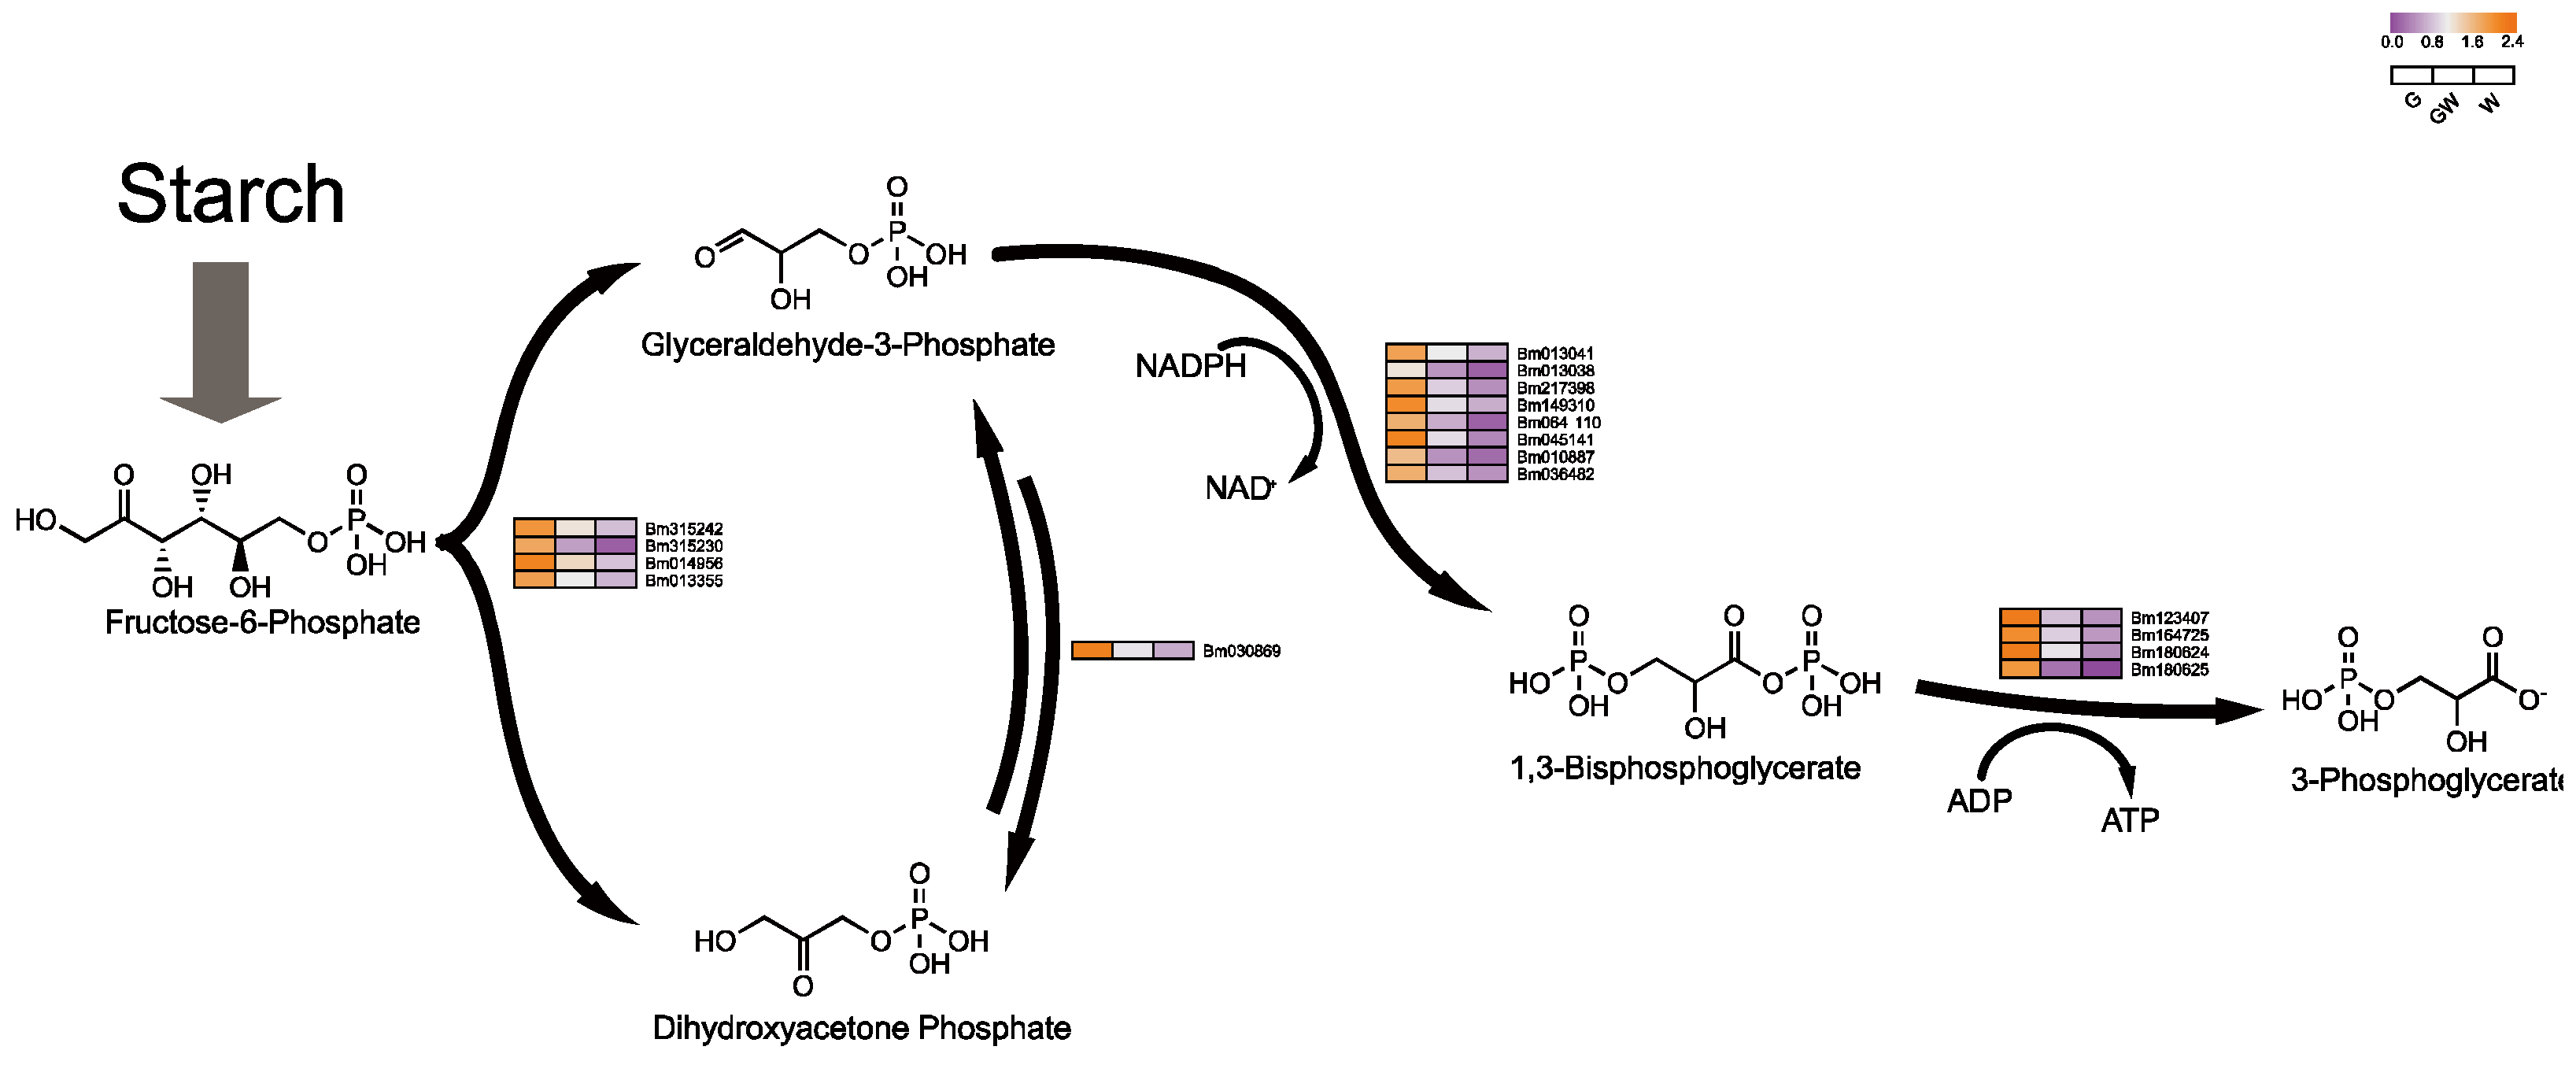
4.3. Differential Glycolysis in Chlorophyll-Deficient Phenotypes
5. Conclusions
Supplementary Materials
Author Contributions
Funding
Institutional Review Board Statement
Informed Consent Statement
Data Availability Statement
Conflicts of Interest
References
- Zhao, M.-H.; Li, X.; Zhang, X.-X.; Zhang, H.; Zhao, X.-Y. Mutation Mechanism of Leaf Color in Plants: A Review. Forests 2020, 11, 851. [Google Scholar] [CrossRef]
- Peng, X.Q.; Ai, Y.J.; Pu, Y.T.; Wang, X.J.; Li, Y.H.; Wang, Z.; Zhuang, W.B.; Yu, B.J.; Zhu, Z.Q. Transcriptome and Metabolome Analyses Reveal Molecular Mechanisms of Anthocyanin-Related Leaf Color Variation in Poplar (Populus deltoides) Cultivars. Front. Plant Sci. 2023, 14, 1103468. [Google Scholar] [CrossRef] [PubMed]
- Tripathy, B.C.; Pattanayak, G.K. Chlorophyll Biosynthesis in Higher Plants. In Photosynthesis; Eaton-Rye, J.J., Tripathy, B.C., Sharkey, T.D., Eds.; Advances in Photosynthesis and Respiration; Springer: Dordrecht, The Netherlands, 2012; Volume 34, pp. 63–94. ISBN 978-94-007-1578-3. [Google Scholar]
- Gao, L.-L.; Hong, Z.-H.; Wang, Y.; Wu, G.-Z. Chloroplast Proteostasis: A Story of Birth, Life, and Death. Plant Commun. 2023, 4, 100424. [Google Scholar] [CrossRef] [PubMed]
- Fu, M.; Cheng, S.; Xu, F.; Chen, Z.; Liu, Z.; Zhang, W.; Zheng, J.; Wang, L. Advance in Mechanism of Plant Leaf Colour Mutation. Not. Bot. Horti Agrobot. 2021, 49, 12071. [Google Scholar] [CrossRef]
- Cackett, L.; Luginbuehl, L.H.; Schreier, T.B.; Lopez-Juez, E.; Hibberd, J.M. Chloroplast Development in Green Plant Tissues: The Interplay between Light, Hormone, and Transcriptional Regulation. New Phytol. 2022, 233, 2000–2016. [Google Scholar] [CrossRef]
- Nakayama, H.; Leichty, A.R.; Sinha, N.R. Molecular Mechanisms Underlying Leaf Development, Morphological Diversification, and Beyond. Plant Cell 2022, 34, 2534–2548. [Google Scholar] [CrossRef]
- Solymosi, K.; Aronsson, H. Etioplasts and Their Significance in Chloroplast Biogenesis. In Plastid Development in Leaves during Growth and Senescence; Biswal, B., Krupinska, K., Biswal, U.C., Eds.; Advances in Photosynthesis and Respiration; Springer: Dordrecht, The Netherlands, 2013; Volume 36, pp. 39–71. ISBN 978-94-007-5723-3. [Google Scholar]
- Tyagi, P.; Singh, D.; Mathur, S.; Singh, A.; Ranjan, R. Upcoming Progress of Transcriptomics Studies on Plants: An Overview. Front. Plant Sci. 2022, 13, 1030890. [Google Scholar] [CrossRef] [PubMed]
- Zhu, L.; Wen, J.; Ma, Q.; Yan, K.; Du, Y.; Chen, Z.; Lu, X.; Ren, J.; Wang, Y.; Li, S.; et al. Transcriptome Profiling Provides Insights into Leaf Color Changes in Two Acer Palmatum Genotypes. BMC Plant Biol. 2022, 22, 589. [Google Scholar] [CrossRef]
- Yangyang, Y.; Qin, L.; Kun, Y.; Xiaoyi, W.; Pei, X. Transcriptomic and Metabolomic Analyses Reveal How Girdling Promotes Leaf Color Expression in Acer rubrum L. BMC Plant Biol. 2022, 22, 498. [Google Scholar] [CrossRef]
- Wang, C.; Zhang, L.; Li, Y.; Ali Buttar, Z.; Wang, N.; Xie, Y.; Wang, C. Single Nucleotide Mutagenesis of the TaCHLI Gene Suppressed Chlorophyll and Fatty Acid Biosynthesis in Common Wheat Seedlings. Front. Plant Sci. 2020, 11, 97. [Google Scholar] [CrossRef]
- Shao, G.; Liu, R.; Qian, Z.; Zhang, H.; Hu, Q.; Zhu, Y.; Chen, S.; Chen, F.; Jiang, J.; Wang, L. Transcriptome Analysis Reveals Genes Respond to Chlorophyll Deficiency in Green and Yellow Leaves of Chrysanthemum Morifolium Ramat. Horticulturae 2021, 8, 14. [Google Scholar] [CrossRef]
- Guo, P.; Huang, Z.; Zhao, W.; Lin, N.; Wang, Y.; Shang, F. Mechanisms for Leaf Color Changes in Osmanthus Fragrans ‘Ziyan Gongzhu’ Using Physiology, Transcriptomics and Metabolomics. BMC Plant Biol. 2023, 23, 453. [Google Scholar] [CrossRef] [PubMed]
- Xu, B.; Li, H.; Li, Y.; Yu, G.; Zhang, J.; Huang, B. Characterization and Transcriptional Regulation of Chlorophyll b Reductase Gene NON-YELLOW COLORING 1 Associated with Leaf Senescence in Perennial Ryegrass (Lolium perenne L.). Environ. Exp. Bot. 2018, 149, 43–50. [Google Scholar] [CrossRef]
- Chan-Rodriguez, D.; Walker, E.L. Analysis of Yellow Striped Mutants of Zea Mays Reveals Novel Loci Contributing to Iron Deficiency Chlorosis. Front. Plant Sci. 2018, 9, 157. [Google Scholar] [CrossRef] [PubMed]
- Wei, B.; Moscou, M.; Sato, K.; Gourlie, R.; Strelkov, S.; Aboukhaddour, R. Identification of a Locus Conferring Dominant Susceptibility to Pyrenophora Tritici-Repentis in Barley. Front. Plant Sci. 2020, 11, 158. [Google Scholar] [CrossRef] [PubMed]
- Brown, G. The Inheritance and Expression of Leaf Chlorosis Associated with Gene Sr2 for Adult Plant Resistance to Wheat Stem Rust. Euphytica 1997, 95, 67–71. [Google Scholar] [CrossRef]
- Horton, P. Molecular Design of the Photosystem II Light-Harvesting Antenna: Photosynthesis and Photoprotection. J. Exp. Bot. 2004, 56, 365–373. [Google Scholar] [CrossRef]
- Liu, W.; Karemera, N.J.U.; Wu, T.; Yang, Y.; Zhang, X.; Xu, X.; Wang, Y.; Han, Z. The Ethylene Response Factor AtERF4 Negatively Regulates the Iron Deficiency Response in Arabidopsis thaliana. PLoS ONE 2017, 12, e0186580. [Google Scholar] [CrossRef]
- Motohashi, R.; Rödiger, A.; Agne, B.; Baerenfaller, K.; Baginsky, S. Common and Specific Protein Accumulation Patterns in Different Albino/Pale-Green Mutants Reveals Regulon Organization at the Proteome Level. Plant Physiol. 2012, 160, 2189–2201. [Google Scholar] [CrossRef]
- Gong, X.; Hong, M.; Wang, Y.; Zhou, M.; Cai, J.; Liu, C.; Gong, S.; Hong, F. Cerium Relieves the Inhibition of Photosynthesis of Maize Caused by Manganese Deficiency. Biol. Trace Elem. Res. 2011, 141, 305–316. [Google Scholar] [CrossRef]
- Yamamoto, H.; Nomata, J.; Fuita, Y. Functional Expression of Nitrogenase-like Protochlorophyllide Reductase from Rhodobacter capsulatus in Escherichia coli. Photochem. Photobiol. Sci. 2008, 7, 1238–1242. [Google Scholar] [CrossRef]
- Chen, S.; Zhou, Y.; Chen, Y.; Gu, J. Fastp: An Ultra-Fast All-in-One FASTQ Preprocessor. Bioinformatics 2018, 34, i884–i890. [Google Scholar] [CrossRef]
- Haas, B.J.; Papanicolaou, A.; Yassour, M.; Grabherr, M.; Blood, P.D.; Bowden, J.; Couger, M.B.; Eccles, D.; Li, B.; Lieber, M.; et al. De Novo Transcript Sequence Reconstruction from RNA-Seq Using the Trinity Platform for Reference Generation and Analysis. Nat. Protoc. 2013, 8, 1494–1512. [Google Scholar] [CrossRef] [PubMed]
- Davidson, N.M.; Oshlack, A. Corset: Enabling Differential Gene Expression Analysis for de Novo assembled Transcriptomes. Genome Biol. 2014, 15, 410. [Google Scholar] [CrossRef]
- Simão, F.A.; Waterhouse, R.M.; Ioannidis, P.; Kriventseva, E.V.; Zdobnov, E.M. BUSCO: Assessing Genome Assembly and Annotation Completeness with Single-Copy Orthologs. Bioinformatics 2015, 31, 3210–3212. [Google Scholar] [CrossRef] [PubMed]
- Cantalapiedra, C.P.; Hernández-Plaza, A.; Letunic, I.; Bork, P.; Huerta-Cepas, J. eggNOG-Mapper v2: Functional Annotation, Orthology Assignments, and Domain Prediction at the Metagenomic Scale. Mol. Biol. Evol. 2021, 38, 5825–5829. [Google Scholar] [CrossRef]
- Altschul, S.F.; Gish, W.; Miller, W.; Myers, E.W.; Lipman, D.J. Basic Local Alignment Search Tool. J. Mol. Biol. 1990, 215, 403–410. [Google Scholar] [CrossRef]
- Aramaki, T.; Blanc-Mathieu, R.; Endo, H.; Ohkubo, K.; Kanehisa, M.; Goto, S.; Ogata, H. KofamKOALA: KEGG Ortholog Assignment Based on Profile HMM and Adaptive Score Threshold. Bioinformatics 2020, 36, 2251–2252. [Google Scholar] [CrossRef]
- Moriya, Y.; Itoh, M.; Okuda, S.; Yoshizawa, A.C.; Kanehisa, M. KAAS: An Automatic Genome Annotation and Pathway Reconstruction Server. Nucleic Acids Res. 2007, 35, W182–W185. [Google Scholar] [CrossRef]
- Langmead, B.; Salzberg, S.L. Fast Gapped-Read Alignment with Bowtie 2. Nat. Methods 2012, 9, 357–359. [Google Scholar] [CrossRef]
- Li, B.; Dewey, C.N. RSEM: Accurate Transcript Quantification from RNA-Seq Data with or without a Reference Genome. BMC Bioinform. 2011, 12, 323. [Google Scholar] [CrossRef]
- Chen, C.; Chen, H.; Zhang, Y.; Thomas, H.R.; Frank, M.H.; He, Y.; Xia, R. TBtools: An Integrative Toolkit Developed for Interactive Analyses of Big Biological Data. Mol. Plant 2020, 13, 1194–1202. [Google Scholar] [CrossRef]
- Love, M.I.; Huber, W.; Anders, S. Moderated Estimation of Fold Change and Dispersion for RNA-Seq Data with DESeq2. Genome Biol. 2014, 15, 550. [Google Scholar] [CrossRef]
- Wu, T.; Hu, E.; Xu, S.; Chen, M.; Guo, P.; Dai, Z.; Feng, T.; Zhou, L.; Tang, W.; Zhan, L.; et al. clusterProfiler 4.0: A Universal Enrichment Tool for Interpreting Omics Data. Innovation 2021, 2, 100141. [Google Scholar] [CrossRef] [PubMed]
- Burke, D.H.; Hearst, J.; Sidow, A. Early Evolution of Photosynthesis: Clues from Nitrogenase and Chlorophyll Iron Proteins. Proc. Natl. Acad. Sci. USA 1993, 90, 7134–7138. [Google Scholar] [CrossRef] [PubMed]
- Nunes-Nesi, A.; Fernie, A.R.; Stitt, M. Metabolic and Signaling Aspects Underpinning the Regulation of Plant Carbon Nitrogen Interactions. Mol. Plant 2010, 3, 973–996. [Google Scholar] [CrossRef] [PubMed]
- Akram, M. Citric Acid Cycle and Role of Its Intermediates in Metabolism. Cell Biochem. Biophys. 2014, 68, 475–478. [Google Scholar] [CrossRef] [PubMed]
- Jiang, M.; Hong, K.; Mao, Y.; Ma, H.; Chen, T.; Wang, Z. Natural 5-Aminolevulinic Acid: Sources, Biosynthesis, Detection and Applications. Front. Bioeng. Biotechnol. 2022, 10, 841443. [Google Scholar] [CrossRef] [PubMed]
- Zhang, W.; Willows, R.D.; Deng, R.; Li, Z.; Li, M.; Wang, Y.; Guo, Y.; Shi, W.; Fan, Q.; Martin, S.S.; et al. Bilin-Dependent Regulation of Chlorophyll Biosynthesis by GUN4. Proc. Natl. Acad. Sci. USA 2021, 118, e2104443118. [Google Scholar] [CrossRef] [PubMed]
- Wang, P.; Grimm, B. Connecting Chlorophyll Metabolism with Accumulation of the Photosynthetic Apparatus. Trends Plant Sci. 2021, 26, 484–495. [Google Scholar] [CrossRef]
- Brzezowski, P.; Richter, A.S.; Grimm, B. Regulation and Function of Tetrapyrrole Biosynthesis in Plants and Algae. Biochim. Biophys. Acta (BBA)-Bioenerg. 2015, 1847, 968–985. [Google Scholar] [CrossRef]
- Woodson, J.D.; Joens, M.S.; Sinson, A.B.; Gilkerson, J.; Salomé, P.A.; Weigel, D.; Fitzpatrick, J.A.; Chory, J. Ubiquitin Facilitates a Quality-Control Pathway That Removes Damaged Chloroplasts. Science 2015, 350, 450–454. [Google Scholar] [CrossRef]
- Hills, A.C.; Khan, S.; López-Juez, E. Chloroplast Biogenesis-Associated Nuclear Genes: Control by Plastid Signals Evolved Prior to Their Regulation as Part of Photomorphogenesis. Front. Plant Sci. 2015, 6, 1078. [Google Scholar] [CrossRef]
- Mahmud, K.; Makaju, S.; Ibrahim, R.; Missaoui, A. Current Progress in Nitrogen Fixing Plants and Microbiome Research. Plants 2020, 9, 97. [Google Scholar] [CrossRef]
- Ye, J.Y.; Tian, W.H.; Jin, C.W. Nitrogen in Plants: From Nutrition to the Modulation of Abiotic Stress Adaptation. Stress Biol. 2022, 2, 4. [Google Scholar] [CrossRef]
- Battersby, A.R. Tetrapyrroles: The Pigments of Life. Nat. Prod. Rep. 2000, 17, 507–526. [Google Scholar] [CrossRef]
- Eckhardt, U.; Grimm, B.; Hrtensteiner, S. Recent Advances in Chlorophyll Biosynthesis and Breakdown in Higher Plants. Plant Mol. Biol. 2004, 56, 1–14. [Google Scholar] [CrossRef] [PubMed]
- Fujita, Y.; Yamakawa, H. Biochemistry of Chlorophyll Biosynthesis in Photosynthetic Prokaryotes. In Modern Topics in the Phototrophic Prokaryotes: Metabolism, Bioenergetics, and Omics; Hallenbeck, P.C., Ed.; Springer International Publishing: Cham, Switzerland, 2017; pp. 67–122. ISBN 978-3-319-51365-2. [Google Scholar]
- Loudya, N.; Mishra, P.; Takahagi, K.; Uehara-Yamaguchi, Y.; Inoue, K.; Bogre, L.; Mochida, K.; López-Juez, E. Cellular and Transcriptomic Analyses Reveal Two-Staged Chloroplast Biogenesis Underpinning Photosynthesis Build-up in the Wheat Leaf. Genome Biol. 2021, 22, 151. [Google Scholar] [CrossRef] [PubMed]
- Su, N.; Hu, M.-L.; Wu, D.-X.; Wu, F.-Q.; Fei, G.-L.; Lan, Y.; Chen, X.-L.; Shu, X.-L.; Zhang, X.; Guo, X.-P.; et al. Disruption of a Rice Pentatricopeptide Repeat Protein Causes a Seedling-Specific Albino Phenotype and Its Utilization to Enhance Seed Purity in Hybrid Rice Production. Plant Physiol. 2012, 159, 227–238. [Google Scholar] [CrossRef] [PubMed]
- Wang, L.; Yue, C.; Cao, H.; Zhou, Y.; Zeng, J.; Yang, Y.; Wang, X. Biochemical and Transcriptome Analyses of a Novel Chlorophyll-Deficient Chlorina Tea Plant Cultivar. BMC Plant Biol. 2014, 14, 352. [Google Scholar] [CrossRef] [PubMed]
- Sun, N.; Dey, A.; Xiao, Z.; Wedd, A.G.; Hodgson, K.O.; Hedman, B.; Solomon, E.I. Solvation Effects on S K-Edge XAS Spectra of Fe−S Proteins: Normal and Inverse Effects on WT and Mutant Rubredoxin. J. Am. Chem. Soc. 2010, 132, 12639–12647. [Google Scholar] [CrossRef]
- Rao, G.; Pattenaude, S.A.; Alwan, K.; Blackburn, N.J.; Britt, R.D.; Rauchfuss, T.B. The Binuclear Cluster of [FeFe] Hydrogenase Is Formed with Sulfur Donated by Cysteine of an [Fe(Cys)(CO)2 (CN)] Organometallic Precursor. Proc. Natl. Acad. Sci. USA 2019, 116, 20850–20855. [Google Scholar] [CrossRef]
- Wingler, A.; Masclaux-Daubresse, C.; Fischer, A.M. Sugars, Senescence, and Ageing in Plants and Heterotrophic Organisms. J. Exp. Bot. 2009, 60, 1063–1066. [Google Scholar] [CrossRef] [PubMed]
- Raheel, C. Matthew Biochemistry, Glycolysis. Available online: https://www.ncbi.nlm.nih.gov/books/NBK482303/ (accessed on 3 January 2024).
- Liu, Q.; Zhu, F.; Liu, X.; Lu, Y.; Yao, K.; Tian, N.; Tong, L.; Figge, D.A.; Wang, X.; Han, Y.; et al. Non-Oxidative Pentose Phosphate Pathway Controls Regulatory T Cell Function by Integrating Metabolism and Epigenetics. Nat. Metab. 2022, 4, 559–574. [Google Scholar] [CrossRef] [PubMed]
- Gupta, R.; Gupta, N. Glycolysis and Gluconeogenesis. In Fundamentals of Bacterial Physiology and Metabolism; Springer: Singapore, 2021; pp. 267–287. ISBN 9789811607226. [Google Scholar]
- Wingler, A.; Henriques, R. Sugars and the Speed of Life—Metabolic Signals That Determine Plant Growth, Development and Death. Physiol. Plant. 2022, 174, e13656. [Google Scholar] [CrossRef] [PubMed]


Disclaimer/Publisher’s Note: The statements, opinions and data contained in all publications are solely those of the individual author(s) and contributor(s) and not of MDPI and/or the editor(s). MDPI and/or the editor(s) disclaim responsibility for any injury to people or property resulting from any ideas, methods, instructions or products referred to in the content. |
© 2024 by the authors. Licensee MDPI, Basel, Switzerland. This article is an open access article distributed under the terms and conditions of the Creative Commons Attribution (CC BY) license (https://creativecommons.org/licenses/by/4.0/).
Share and Cite
Zhu, P.-K.; Zeng, M.-Y.; Lin, Y.-H.; Tang, Y.; He, T.-Y.; Zheng, Y.-S.; Chen, L.-Y. Variability in Leaf Color Induced by Chlorophyll Deficiency: Transcriptional Changes in Bamboo Leaves. Curr. Issues Mol. Biol. 2024, 46, 1503-1515. https://doi.org/10.3390/cimb46020097
Zhu P-K, Zeng M-Y, Lin Y-H, Tang Y, He T-Y, Zheng Y-S, Chen L-Y. Variability in Leaf Color Induced by Chlorophyll Deficiency: Transcriptional Changes in Bamboo Leaves. Current Issues in Molecular Biology. 2024; 46(2):1503-1515. https://doi.org/10.3390/cimb46020097
Chicago/Turabian StyleZhu, Peng-Kai, Mei-Yin Zeng, Yu-Han Lin, Yu Tang, Tian-You He, Yu-Shan Zheng, and Ling-Yan Chen. 2024. "Variability in Leaf Color Induced by Chlorophyll Deficiency: Transcriptional Changes in Bamboo Leaves" Current Issues in Molecular Biology 46, no. 2: 1503-1515. https://doi.org/10.3390/cimb46020097
APA StyleZhu, P.-K., Zeng, M.-Y., Lin, Y.-H., Tang, Y., He, T.-Y., Zheng, Y.-S., & Chen, L.-Y. (2024). Variability in Leaf Color Induced by Chlorophyll Deficiency: Transcriptional Changes in Bamboo Leaves. Current Issues in Molecular Biology, 46(2), 1503-1515. https://doi.org/10.3390/cimb46020097