Abstract
Approximately 50% of tumors carry mutations in TP53; thus, evaluation of the features of mutant p53 is crucial to understanding the mechanisms underlying cell transformation and tumor progression. HaCaT keratinocytes represent a valuable model for research in this area since they are considered normal, although they bear two gain-of-function mutations in TP53. In the present study, transcriptomic and proteomic profiling were employed to examine the functions of mutant p53 and to investigate the impact of its complete abolishment. Our findings indicate that CRISPR-mediated TP53 knockout results in significant changes at the transcriptomic and proteomic levels. The knockout of TP53 significantly increased the migration rate and altered the expression of genes associated with invasion, migration, and EMT but suppressed the epidermal differentiation program. These outcomes suggest that, despite being dysfunctional, p53 may still possess oncosuppressive functions. However, despite being considered normal keratinocytes, HaCaT cells exhibit oncogenic properties.
1. Introduction
The transcription factor p53 is widely known as a tumor suppressor and ‘the guardian of the genome’ [1]. Mutations in TP53, resulting in the loss of oncosuppressive functions of the encoded protein p53, represent an important stage in cancer progression, which applies to tumors originating from keratinocytes [2]. This, in turn, may lead to the accumulation of other oncogenic mutations in genes such as NOTCH2, EGFR, and PIK3CA [3].
Mutations in TP53 are found in approximately 50% of skin cancer cases; thus, investigation of the features of mutant p53 is crucial for understanding the mechanisms underlying cell transformation and tumor progression [4]. HaCaT keratinocytes, a line of spontaneously immortalized human keratinocytes, represent a convenient model for research in this field [5]. Although HaCaT cells are traditionally defined as normal non-tumoral keratinocytes and are commonly used as an alternative to primary keratinocytes [6,7,8], they also bear two UV-signature gain-of-function (GOF) mutations in both alleles of TP53 (R282Q and H179Y) [9]. The novel properties of p53 obtained through mutations are manifested in its capacity to bind atypical response elements and its altered affinity to other transcription factors, which in turn results in the suppression of their biological functions [10]. Although two earlier studies involved functional inactivation of p53 (shRNA-mediated knockdown), both studies focused on investigating specific properties of p53, such as its interaction and cooperation with other transcription factors including p63 and NF-kB B [10,11]. It has been reported that mutant p53 in cancer cells can suppress different targets of normal p53, whereas inactivation of mutant p53 in these cells results in cell cycle arrest and apoptosis induction [12]. In contrast, several studies have indicated that mutant p53 in HaCaT cells is at least partially functional, as it induces apoptosis and cell cycle arrest in UV-irradiated HaCaT cells [13,14]. Nonetheless, many features of mutant p53 in HaCaT cells remain unclear.
The presence of mutant p53 is not the only feature distinguishing HaCaT cells from primary keratinocytes. HaCaT cells are characterized by aberrant NF-kB activity, which is associated with increased sensitivity to UVB-induced apoptosis [15]. Moreover, after chronic exposure to UVB, HaCaT cells exhibit properties of an aggressive form of skin cancer, such as altered proliferation and migration rate and induction of the epithelial–mesenchymal transition (EMT) [16]. Consequently, it would be erroneous to assume that the abolishment of mutant p53 would eliminate the differences between HaCaT cells and primary keratinocytes. However, HaCaT cells are of interest in the context of the biology of keratinocytes bearing UV-induced mutations in TP53.
Functional inactivation of TP53 is a powerful tool for investigating the features of mutant p53, its functional status, and its properties. In addition, the functional characteristics of p53-deficient HaCaT may provide new data regarding HaCaT biology and their resemblance to that of normal and transformed cells. Previously, we generated a stable HaCaT cell line with CRISPR-inactivated TP53 [17]. The present study was based on a complex analysis of omics data obtained from TP53-KO HaCaT cells and aimed to elucidate the functions and properties of mutant p53 in HaCaT keratinocytes.
2. Materials and Methods
2.1. Cell Culture and Treatment
HaCaT cells were purchased from DKFZ Collection (CLS Cell Lines Service, 300493, Eppelheim, Germany). TP53-KO HaCaT cells were generated using the CRISPR/Cas system as previously described [17]. Employing paired Cas9n D10A mutant nucleases resulted in multiple insertions and deletions in the alleged TP53 region (positions 7676184–7676212).
The cells were cultured in DMEM/F12 (1:1) medium containing 10% fetal bovine serum, penicillin/streptomycin (100 U/mL and 100 μg/mL), and 1% GlutaMAXTM (all from Gibco, Billings, MT, USA). Cells were cultured in 25 cm2 tissue-treated flasks or 60 mm Petri dishes (Corning, New York, NY, USA), and the culture medium was replaced every other day. For gene expression evaluation, cells were seeded in 6-well culture plates at a density of 3.0 × 10⁵ cells per well (Corning, NY, USA) and grown until they reached full confluence (48 h). The medium was then replaced with fresh medium containing calcium chloride (2.8 mM) and the cells were cultured for 9 days. For culture at the air–liquid interface, the cells were seeded into 24-well plates with cell culture inserts (Wuxi NEST Biotechnology, Wuxi, China) at a density of 5.0 × 10⁵ cells per insert. Regular culture medium was supplemented with calcium chloride (2.8 mM), ascorbic acid (50 µg/mL), and 2 ng/mL keratinocyte growth factor (Gibco, Billings, MT, USA). The cells were cultured submerged for 48 h, after which the medium was discarded from the inserts. The cells were cultured at the air–liquid interface for 14 days. The culture medium was replaced daily with a fresh medium.
2.2. Transcriptomic Analysis
For transcriptomic analysis, HaCaT cells were seeded onto 100 mm Petri dishes (Corning, NY, USA) at a density of 1.0 × 10⁶ cells per plate. After 24 h, the cells were collected by trypsinization followed by RNA isolation. Total RNA was isolated according to the manufacturer’s protocol and quantified using a NanoDrop-1000 spectrophotometer (Thermo Fisher Scientific, Waltham, MA, USA). Transcriptome data were obtained by high-throughput paired-end sequencing using an Illumina NovaSeq 6000 with a read length of 100 bp. The TruSeq Stranded mRNA Library Prep Kit was used to prepare the RNA libraries. All steps were performed in accordance with the manufacturer’s protocol. Transcriptome profiling was performed in triplicate with a separate process of RNA extraction for each replicate. Raw sequencing data were uploaded to the NCBI SRA (https://www.ncbi.nlm.nih.gov, accessed on 30 November 2023). The accession number is PRJNA1005459 for both WT and TP53-KO cells.
2.3. Proteomic Analysis
Previously published proteomic data have been used to identify differentially expressed proteins between cell lines. Proteomic profiling is described in detail in the original data descriptor paper [17]. Briefly, cell pellets were lysed in lysis buffer, and protein precipitation was performed using the methanol–chloroform method. Protein extracts were prepared for MS analysis by diluting in denaturation buffer and adding trypsin for in-solution digestion. Peptides were separated via HPLC and analyzed using LC-MS/MS. Raw proteomic data were deposited to the ProteomeXchange Consortium via the PRIDE partner repository (http://www.proteomexchange.org/Project, accessed on 19 January 2024, accession: PXD030700).
2.4. Bioinformatic Analysis
To ensure the quality of the fastq files, we employed FastQC [18]. Salmon [19] was used to quantify the expression in transcripts per million units (TPMs). Gene expression was calculated by aggregating all TPMs for the corresponding transcripts. The identification was performed against a concatenated target/decoy version of the Homo sapiens complement of the UniProtKB (July 2021). Raw proteome data were processed according to the protocol described earlier [17]. Concisely, we used MaxQuant software (version 1.6.3.4) for label-free quantitation.
The R software environment was used for the computation and visualization of transcriptomic and proteomic data (ver. 4.1) (R: The R Project for Statistical Computing https://www.r-project.org/, accessed on 8 August 2023). We used the DESeq2 package [20] for differential gene expression analysis. For visualization, we used EnhancedVolcano for the volcano plot (https://github.com/kevinblighe/EnhancedVolcano, accessed on 25 July 2023) and ClusterProfiler for geneset enrichment analysis [21] as described in Poverennaya et al. [22]. As a source of biological knowledge for transcriptomic data, we utilized the Wikipathways [23] and PROGENy databases [24]. We used a previously published dataset to count differential protein expression [17]. To enrich differentially expressed proteins in our proteomic results with biological knowledge, we leveraged Gene Ontology (GO), specifically focusing on molecular function (MF) orthogonal ontology [25]. The general EMT score was estimated based on gene expression signatures. The computation was performed using a two-sample Kolmogorov–Smirnov test [26].
2.5. RT-qPCR
Total RNA was isolated using the RNeasy Kit (QIAGEN, Venlo, The Netherlands), according to the manufacturer’s instructions. cDNA synthesis was performed using the MMLV reverse-transcription kit (Evrogen, Moscow, Russia) utilizing 1 µg of RNA per reaction. SYBR label (Evrogen, Russia) was used for quantitative PCR in the Bio-rad CFX connect system. Relative gene expression was calculated with the ΔΔCt method with GAPDH and ACTB as reference genes [27]. The results of two biological and three technical replicates were used for the analysis and are presented as the mean ± SEM. Raw data were analyzed using the CFX Maestro 1.0 software (v. 4.0.0325.0418). The stability of housekeeping genes employed for normalization was evaluated using CFX Maestro 1.0 software (v. 4.0.0325.0418). The primer sequences used for the analysis are listed in Table 1.

Table 1.
Primers used in this study.
2.6. Migration Assay
An Incucyte® ZOOM System (Sartorius, Göttingen, Germany) was used for the scratch test. WT and TP53-KO cells were seeded in an Incucyte® Imagelock 96-well plate at a density of 2.0 × 10⁶ cells per well and grown until they reached a full monolayer (24 h). To suppress proliferation, the cells were pretreated with mitomycin C. In brief, 2 h prior to wounding, the culture medium was replaced with serum-free medium containing 10 µg/mL mitomycin C (Merck, Rahway, NJ, USA). The injury was inflicted using an IncuCyte 96-pin wound-making tool (Essen Bioscience, Göttingen, Germany). Once the injury was inflicted, cells were rinsed twice with fresh medium and cultured for 24 h. Images were captured hourly. The wound area was calculated using Incucyte® ZOOM Software (v. 2016A) (Sartorius, Germany).
2.7. Confocal Fluorescent Microscopy
The culture inserts were fixed in 10% buffered formaldehyde, permeabilized with 0.1% Triton X-100, and blocked with 1% BSA in PBS-Tween 20TM for 30 min under rotation (room temperature). A keratin 1 (CK1) primary antibody was used for detection and a secondary Alexa 488-conjugated antibody was used for visualization (Finetest, Hubei, China). Hoechst 33342 (Thermo Fisher Scientific, USA) was used for nuclei visualization. Images were obtained using an inverted confocal laser scanning microscope Zeiss LSM 880 with AiryScan, a 32-channel GaAsP-PMT area detector, a Plan-Apochromat 40×/1.3 Oil DIC M27 (WD = 0.2 mm), and a (UV) VIS-IR objective with Scan zoom 2. A Z-stack of a 27–30 µm depth was scanned for one field of view in two randomly chosen locations for each sample with a 0.1 µm × 0.1 µm pixel size and a 106.27 µm × 106.27 µm image size in AiryScan SR mode with a 2.05 µs pixel time. AiryScan processing, Z-stack maximal intensity projection, and histogram Min/Max correction were performed using the Zeiss ZEN 2.3. Zeiss LSM 880 with Airyscan is equipment belonging to the Core Centrum of the Institute of Developmental Biology RAS, Moscow, Russia.
2.8. Proliferation Assay
For cell proliferation evaluation, a CytoTrace™ Red fluorescent probe was used (AAT Bioquest, Pleasanton, CA, USA). The cells were seeded in 100 mm Petri dishes at a density of 3.0 × 10⁵ (Corning, USA) and cultured as described in Section 2.1 for 24 h. The day after seeding, the culture medium was replaced with DMEM/F12 serum-free medium containing fluorescent dye for 30 min. After incubation, the medium was replaced with a regular culture medium. Cells were cultured for 48 h, harvested by trypsinization, and fixed in 4% buffered formaldehyde. The control cells (day 0) were collected immediately after incubation with the fluorescent probe. Fluorescence was analyzed with a ZE5 flow cytometer (Bio-rad, Hercules, CA, USA). The raw data were analyzed using Floreada.io software (https://floreada.io/, assessed on 10 November 2023). The graph represents the median fluorescence intensity (MFI) delta between the control cells and the cells collected 48 h post-seeding.
2.9. Flow Cytometry
For flow cytometry analysis, the cells were cultured under standard conditions in 6-well culture plates (Corning, USA), as described in Section 2.1. Cells were harvested by trypsinization and rinsed twice with HBSS (Capricorn Scientific, Ebsdorfergrund, Germany). After washing, the cells were resuspended in FACS Buffer (DPBS without Ca2+/Mg2+, 2 mM EDTA, 1% FBS). An APC-conjugated anti-human PD-L1 antibody (Sony Biotechnology, San Jose, CA, USA) was used for PD-L1 detection. An APC-conjugated anti-human CD324 antibody (Miltenyi Biotec, Bergisch Gladbach, Germany) was used for CD324 staining. For CD325 staining, an APC-conjugated anti-human CD325 antibody was used (BioLegend, San Jose, CA, USA). The cells were stained in the dark for 15 min at RT. The samples were analyzed using a NovoCyte Flow Cytometer (Acea Biosciences, San Diego, CA, USA). Novo Express software (v. 1.2.4) was used for raw data analysis. The stain index (SI) was calculated using the following formula: (MFI of positive peak—MFI of negative peak)/2 × standard deviation of negative peak.
2.10. Statistical Analysis
Proteomic and transcriptomic profiling, migration assays, and ICC were conducted in at least 3 biological replicates. For RT-qPCR, there were two independent biological replicates, each performed in triplicate. The graphs represent experimental data as means ± SEMs. Statistical analysis was carried out using one-way ANOVA with Tukey’s post hoc test. GraphPad Prism Version 8.0 software was employed for graph design (GraphPad Software LLC, San Diego, CA, USA).
3. Results
3.1. Transcriptomic Differences
RNA-seq was primarily performed within the framework of omics profiling. Transcriptomic analysis identified 12 825 and 12 368 genes in wild-type (WT) and TP53-KO cells, respectively (TPM, transcripts per million > 0). Differential expression analysis revealed 395 genes with altered expression (Figure 1A, Supplementary Table S1). Among the genes with altered expression, 86 genes were upregulated and 309 genes were downregulated in TP53-KO cells compared with WT. Genes with differential expression were sorted in decreasing order of log2 fold change (log2FC) and filtered according to the criterion of discovery rate (FDR < 0.05).
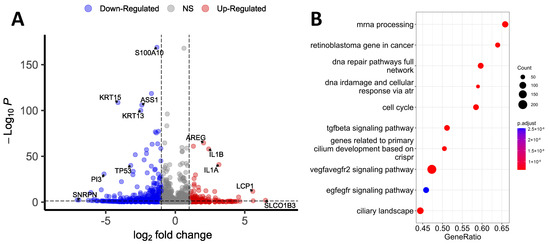
Figure 1.
Transcriptomic profiling of WT and TP53-KO HaCaT cells. (A) Volcano plot showing differentially expressed genes between WT and TP53-KO cells. (B) Gene Set Enrichment Analysis of differentially expressed genes between WT and TP53-KO cells.
We conducted a Gene Set Enrichment Analysis (GSEA) of filtered genes to identify the pathways affected by the knockout of TP53 (Figure 1B). According to the results, the most enriched pathways were ‘mRNA processing’ and ‘retinoblastoma gene in cancer’. Pathways like ‘DNA repair pathways full network’, ‘DNA IRdamage’, ‘cellular response via atr’, and ‘cell cycle’ correspond to the established role of p53 in the regulation of cell cycle control and DNA reparation [1]. The enrichment of pathways like ‘genes related to primary cilium development’ and ‘ciliary landscape’ was unanticipated, but these outcomes may provide a basis for further investigation since altered ciliation is common for patients with atopic dermatitis and psoriasis, and HaCaT cells represent a convenient model for the investigation of ciliation [28].
Among the genes with altered expression, SLCO1B3 had the highest log2FC (log2FC = 6.49). This gene encodes transmembrane receptor H, which facilitates the intracellular transport of a broad range of organic anions [29,30]. A high log2FC was also observed for LCP-1 (log2FC = 5.57), which encodes plastin-2. This protein activates cell migration and invasion, and its altered expression correlates with poor prognosis in cases of lung squamous cell carcinoma [31]. ISM1 was upregulated (log2FC = 3.97) in knockout cells. This gene is known for its functions in the regulation of the immune response and the suppression of angiogenesis [32]. Several cytokine-coding genes were upregulated in TP53-KO cells, including IL1A (log2FC = 3.14) and IL1B (log2FC = 2.4). In addition, IL1R1 was upregulated (log2FC = 4.55). CD274 (PD-L1) expression was markedly increased in TP53-KO cells (log2FC= 3.10). Altered expression of PD-L1 may be associated with the evasion of the immune response and is common for many tumors [33]. PD-L1 is also an important mediator of the EMT [34]. AREG expression was also markedly increased (log2FC = 2.03). This gene is associated with a psoriasis-like skin phenotype [35] and induces the EMT in pancreatic cancer cells through EGFR/ERK/NF-kB [36]. The protein encoded by this gene is an autocrine growth factor and mitogen for astrocytes, Schwann cells, and fibroblasts. This protein interacts with the EGF/TGF-α receptor to promote the growth of normal epithelial cells and inhibits the growth of some aggressive carcinoma cell lines. As a result of TP53 knockout, MMP13 expression significantly increased (log2FC = 2.57). This gene encodes a member of the M10 peptidase family of matrix metalloproteinases (MMPs). Proteins of this family are involved in the breakdown of the extracellular matrix in normal physiological processes, as well as in pathological processes, including metastasis [37,38]. In addition to MMP13, the expression of TIMP2 (log2FC = −2.90), a tissue inhibitor of metalloproteinases, was markedly reduced in the TP53-knockout cells. The expression of various metalloproteinases and suppression of their inhibitors are not typical for epithelial cells and can be considered a marker of EMT [37]. As a result of knockout, DLC-1 expression also increased (log2FC = 2.93). DLC-1 encodes GTPase-activating protein (GAP) [39]. The GAP family of proteins is involved in the regulation of cytoskeletal changes. The DLC-1 gene acts as a tumor suppressor gene in a number of common cancers, including prostate, lung, colorectal, and breast cancer [40]. Phosphorylated DLC-1 increases cell migration velocity but reduces directionality [41]. In addition, LPXN was upregulated in TP53-KO cells (log2FC = 2.10). The encoded protein leupaxin regulates migration and cell adhesion [42].
The expression of MAGED1 was significantly decreased in TP53-KO cells (log2FC = −6.93). MAGED1 is ubiquitously expressed and plays a role in anti-tumorigenesis in various cell types. MAGED1 repression is a characteristic of tumor cells. Likewise, the expression of FBP1, which acts as a rate-limiting enzyme in gluconeogenesis, is commonly reduced in tumor cells [43]. In TP53-KO cells, FBP1 expression was markedly reduced (log2FC = −5.32). Notably, in gastric cancer, a decrease in the level of this gene leads to EMT activation [44]. CD9 expression was reduced (log2FC = −1.26) in TP53-KO cells. This gene plays an important role in the suppression of cancer cell motility and metastasis [45].
Several cytokeratin-coding genes decreased in TP53-KO cells. Specifically, KRT4, KRT13, KRT15, KRT6B, and KRT16 were found to be downregulated (log2FC = −6.07, −2.47, −4.12, −3.11, −2.75, respectively). Keratin 13 (KRT13) dimerizes with type I keratin 4 and forms intermediate filaments that primarily line the cytoskeleton of specific epithelial cells. Reduced KRT13 expression is observed in oral dysplasia, squamous cell carcinomas, and carcinomas in situ [46]. Keratin 13 expression is also decreased in TGF-β1-induced EMT [47]. In addition, in cells with TP53 knockout, the expression of key markers of epidermal differentiation, IVL and KRT10, was noticeably reduced (log2FC = −1.25 and −3.87, respectively) [6,48,49].
Enrichment analysis also identified the signaling pathways that were most significantly affected by TP53 knockout (Figure 2). In knockout cells, activation of the MAPK, EGFR, NF-kB, PI3K, TNFa, and Wnt signaling pathways was most pronounced. The PI3K/AKT pathway is one of the most commonly activated signaling pathways in several human cancers, including melanoma, basal cell carcinoma (BCC), and squamous cell carcinoma (SCC) [50]. Hyperactivation of the MAPK pathway is important for cell transformation [51]. Wnt is activated upon wounding in the skin and is involved in each subsequent stage of the healing process [52].
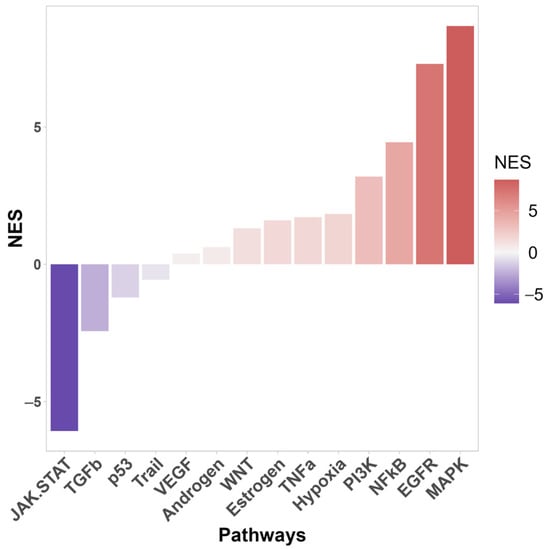
Figure 2.
Signal pathway activity of differentially expressed genes between WT and TP53-KO cells using PROGENy database. NES—normalized enrichment score.
The NF-kB signaling pathway plays a key role in maintaining skin homeostasis [53] and acts as a major transcriptional regulator of inflammation and immunity [54]. NF-kB is also as a key positive regulator of PD-L1 expression in cancer [55,56]. NF-κB directly induces the transcription of CD274 by binding to its promoter and can also regulate PD-L1 at the post-transcriptional level [55].
3.2. Proteomic Differences
In the present study, we addressed previously published primary data obtained from proteomic analysis of WT and TP53-KO HaCaT cells to evaluate proteomic differences between cell lines [17]. In the aforementioned paper, we published the raw data obtained from both cell lines at a confluence of 50–60% (control) and after culture in a monolayer (full confluence) for 72 h. Samples were categorized based on the presence of mutations and confluency. In the present study, we focused on GO analysis of proteins with differential expression between lines in the subconfluent and full-confluent states. First, we analyzed the data of the control (subconfluent) group. As a result, 2644 proteins were identified in both cell lines. Among these proteins, 43 were significantly differentially expressed between the cell lines. The expression of five proteins was reduced in HaCaT cells after the TP53 knockout, whereas thirty-eight proteins were upregulated.
Enrichment analysis (Gene Ontology terms) was employed to assess the impact of TP53 knockout at the proteome level (Figure 3). The main differences were associated with such biological processes as translation, peptide biosynthetic process, peptide metabolic process, cytoplasmic translation, and cellular nitrogen compound metabolic process. Cell component analysis revealed enrichment in the cytosol, cell–substrate junction, focal adhesion, anchoring junction, and cell–substrate anchoring junction in TP53-KO cells. In addition, we analyzed the data obtained from cells cultured in a monolayer for 72 h (Supplementary Table S1). Functional annotation of a total of 79 proteins with differential expression between WT and TP53-KO cells revealed enrichment in terms like ‘RNA binding’ (FDR = 1.08−8), ‘Cadherin binding’ (FDR = 2.57−2), and ‘Cell adhesion molecule binding’ (FDR = 2.48−2).
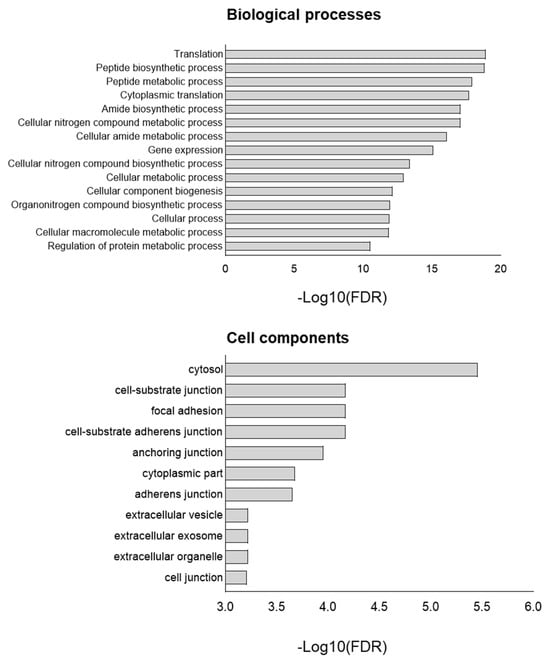
Figure 3.
GO of proteins upregulated in TP53-KO cells compared to WT. −Log10(FDR)—−log10 false discovery rate.
3.3. p53-Defficient HaCaT Cells Display the Features of EMT
Differential expression analysis revealed that TP53-KO cells exhibited features of tumor cells and signs of EMT. Therefore, we conducted a general EMT score evaluation [26]. According to the results obtained, the general EMT score values for WT and TP53-KO HaCaT cells were −0.416 and −0.267, respectively (where −1 is fully epithelial and +1 is fully mesenchymal). These changes indicate that TP53 knockout in HaCaT cells results in increased expression of EMT signature genes, whereas p53 appears to inhibit the implementation of this program (Figure 4A). To verify the results of the EMT score analysis, we assessed E-cadherin (CD324) and N-cadherin (CD325) expression by flow cytometry analysis (Figure 4B). E-cadherin expression was significantly higher in WT cells, whereas N-cadherin expression was higher in TP53-KO cells. Such changes in E-/N-cadherin expression are typical of cells undergoing EMT [57].
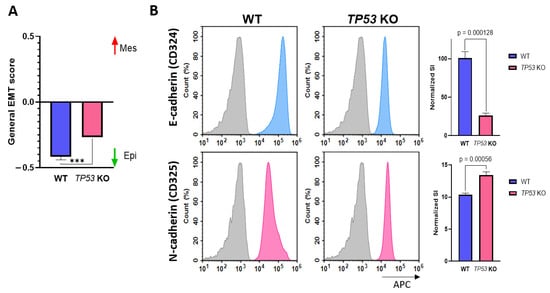
Figure 4.
Verification of EMT in WT and TP53-KO HaCaT. (A) Evaluation of general EMT score in parental and TP53-KO HaCaT keratinocytes (−1—fully epithelial, +1—fully mesenchymal). Data are presented as mean ± SEM. ***—p value < 0.001. (B) Detection of E-cadherin and N-cadherin in flow cytometry analysis. Grey—unstained cells (isotypic control), blue—E-cadherin staining, pink—N-cadherin staining. Data are presented as mean ± SEM.
3.4. Knockout of TP53 Enhances Migration and Suppresses Epidermal Differentiation in HaCaT Cells
We postulated that the outcomes of omics data analysis in TP53-KO cells may indicate altered motility and migration rates compared to those in WT HaCaT cells. To test this hypothesis, we performed a migration assay (scratch test) to determine the effect of TP53 inactivation on cell migration (Figure 5A,C). According to the scratch test results, TP53-KO cells filled the wound area faster than WT cells (Figure 5C). Thus, the wound closure times for WT and TP53-KO cells were 18–22 and 12–14 h, respectively. As proliferation may strongly affect wound closure rates, we measured proliferation rates in WT and TP53-KO cells using the CytotraceTM fluorescent probe (Figure 5B). A proliferation assay revealed that TP53 inactivation results in decreased proliferation rates. Additionally, cells were pretreated with mitomycin C to suppress proliferation during wound closure, as previously reported [58,59]. As with untreated cells, TP53-KO cells filled the wound area faster than WT cells. After mitomycin C treatment, TP53-KO cells filled the lesion within 16–18 h, whereas WT cells filled the lesion in more than 24 h (Figure 5A,C, Video S1). Under both experimental conditions, the wound was closed as a result of collective migration (cohesive migration following leader cells). No individual cells colonizing the wounds were observed.
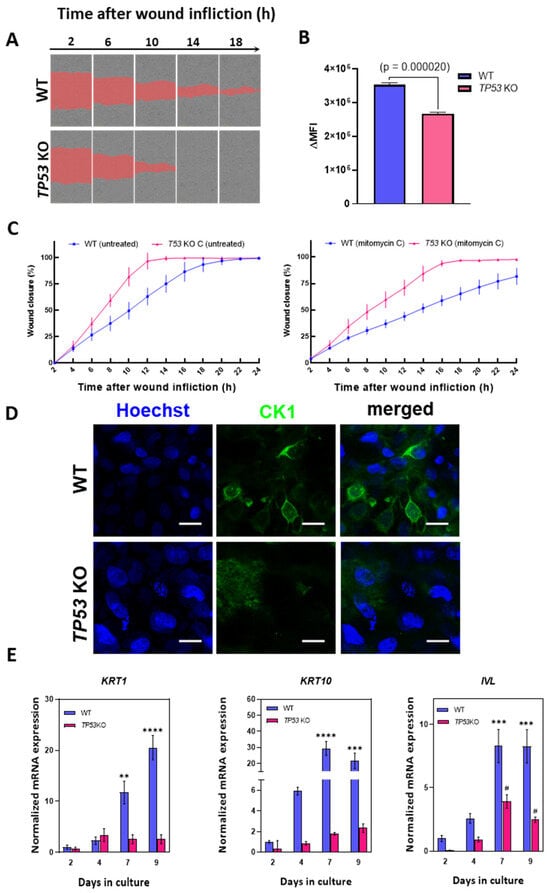
Figure 5.
Analysis of migration and differentiation in parental and TP53-KO HaCaT keratinocytes (A) Scratch test: comparison of wound closure rates in WT and TP53-KO HaCaT (mitomycin C-treated). The images represent one of five technical replicates. (B) Analysis of the proliferation rate in WT and TP53-KO cells using CytotraceTM Red fluorescent probe. Data are presented as mean ± SEM. (C) The rates of wound closure by untreated (left) and mitomycin C-pretreated (right) WT and TP53-KO cells. Data are presented as mean ± SEM. (D) Keratin 1 (CK1) staining in WT and TP53-KO cells after 14 days of culture in cell culture inserts (air–liquid interface). Scale bar: 20 µm. (E) Analysis of epidermal differentiation markers in parental and TP53-KO HaCaT cells during culture in high-calcium medium. Data are presented as mean ± SEM. ****—p value < 0.0001; ***—p value < 0.001; **—p value < 0.005 compared to WT control (day 2); #—p value < 0.05 compared to TP53-KO control (day 2).
Proteomic and transcriptomic analyses revealed a significant decrease in involucrin (IVL) protein and mRNA expression. Involucrin is an important marker of epidermal differentiation of keratinocytes [60]; thus, we evaluated the expression of several epidermal differentiation markers during the induction of this program. Epidermal differentiation was induced by prolonged (9 days) cultivation in high-calcium medium (2.8 mM) as suggested by Wilson et al. [61].
KRT1, KRT10, and IVL were selected as target genes. These genes are expressed during keratinocyte differentiation and are considered key markers of advanced stages of differentiation [6,49,62]. Analysis of the mRNA level revealed an increase in the expression of all three markers in WT cells, but not in TP53-KO cells, in which this program was either completely suppressed or delayed (Figure 5E).
Culturing at the air–liquid interface induces epidermal differentiation [63]. We assessed keratin 1 (CK1) expression in cell cultures following a 14-day incubation period under air–liquid interface conditions, utilizing cell culture inserts to induce epidermal differentiation. ICC staining revealed that keratin 1 was only detected in the WT cells, which was consistent with the qPCR results (Figure 5D).
3.5. p53-Defficient HaCaT keratinocytes Possess Altered PD-L1 Expression
Altered CD274 (PD-L1) expression in TP53-KO HaCaT cells is of particular interest in the context of keratinocyte biology and transformation. Thus, PD-L1 expression was verified at the protein level using flow cytometry analysis (Figure 6). The analysis revealed that the PD-L1 stain index (SI) was significantly higher in TP53-KO HaCaT cells than in WT cells.
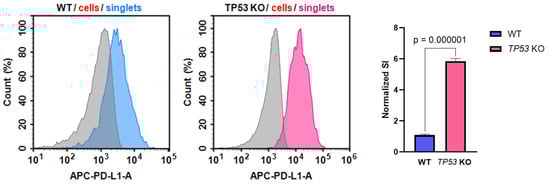
Figure 6.
Expression of PD-L1 in WT and TP53-KO HaCaT cells. Grey—unstained cells (isotypic control), blue—PD-L1 staining in WT cells, pink—PD-L1 staining in TP53 KO cells. Data are presented as mean ± SEM.
4. Discussion
Given the extremely broad network of transcriptional activity of mutant p53 in HaCaT cells, we assessed the impact of p53 inactivation on HaCaT cells using transcriptomic and proteomic profiling. Proteomic profiling revealed that TP53 knockout significantly affected translation, metabolic processes, and processes related to protein biosynthesis (Figure 3). Cell component analysis (Gene Ontology) revealed significant changes in proteins related to terms such as ‘cell-substrate junction’, ‘focal adhesion’, ‘cell-substate adherens junction’, ‘anchoring junction’, and others. At the transcriptomic level, processes associated with the activation of several signaling pathways, including PI3K, EGFR, NF-kB, and WNT, have garnered considerable interest (Figure 2). Some signaling pathways were downregulated (JAK-STAT, TGFB). In addition, several migration-associated genes such as LCP-1, CD274, DLC-1, AREG, and others were upregulated.
Based on the results of omics profiling, we hypothesized that p53 inactivation affects the migration rate of HaCaT cells. We employed a wound-healing assay (scratch test) to show that TP53-KO HaCaT cells had an increased rate of wound closure compared to WT cells. Additionally, we pretreated cells with mitomycin C to rule out the influence of proliferation on wound closure (Figure 5A,C). As with untreated cells, the wound closure rate was significantly higher in TP53-KO cells. The decreased proliferation rate of TP53-KO cells, compared to WT cells, was shown further using the CytotraceTM fluorescent probe (Figure 5B). Thus, we established that p53 inactivation results in altered migratory activity of WT and TP53-KO HaCaT cells. Notably, collective migration is typical for HaCaT cells. During this type of migration, cells cohesively migrate following the leader cells, whereas individual cells colonizing the wound may not be observed [58,59]. HaCaT keratinocytes retain the ability to implement the epidermal differentiation program [5,6,49]. Moreover, it has been shown that p53 is involved in the regulation of HaCaT cell differentiation [64]. We report that involucrin expression was significantly higher in wild-type cells than in TP53-KO HaCaT cells. In addition, the expression of differentiation markers, such as KRT1, KRT10, and IVL, was markedly reduced in TP53-knockout cells upon the induction of differentiation (Figure 5D,E). Notably, the inactivation of p53 in primary keratinocytes has very different consequences. Freije et al. showed that TP53 knockdown leads to cell death by inducing squamous differentiation [65]. However, we did not observe a trend toward spontaneous cell death or induction of differentiation in TP53-KO HaCaT cells.
An increased migration rate and impaired differentiation are important hallmarks of the EMT. Transcriptomic profiling revealed several EMT features in TP53-KO HaCaT cells, including the upregulation of important EMT mediators, such as CD274 and AREG. EMT score evaluation revealed that TP53 inactivation resulted in a shift in the transcriptomic profile to a mesenchymal-like phenotype (Figure 4A). Additionally, we confirmed these results by measuring E-/N-cadherin expression in WT and p53-deficient cells (Figure 4B). Overall, the results clearly indicated signs of EMT in TP53-KO HaCaT cells. Notably, the observed collective migration does not contradict the implementation of the EMT program, since this migration type is common for cells with a partial EMT phenotype [66,67].
Altered CD274 (PD-L1) expression was observed in TP53-KO HaCaT cells (Figure 6). In normal keratinocytes, PD-L1 expression is maintained at a low level, whereas overexpression of PD-L1 significantly characterizes tumors including cSCC and melanoma [68,69]. In melanomas, altered PD-L1 expression is frequently observed in malignant melanocytes and immune cells in the tumor microenvironment [70]. This is consistent with the altered migratory activity and transcriptomic alterations, as altered PD-L1 expression is largely characteristic of tumor cells. These findings, along with the results of omics profiling, indicate that TP53-KO cells possess a pro-oncogenic phenotype.
The role of p53, especially its mutant forms, in tumor progression is unclear. HaCaT cells provide a convenient model for studying UV signature mutations in TP53 and their effects on various processes in human keratinocytes. At the same time, HaCaT cells are considered normal keratinocytes, while mutant p53 in HaCaT cells is referred to as nonfunctional or defective. CRISPR-mediated TP53 knockout leads to significant changes at the transcriptomic level. The core proteomic differences between wild-type and TP53-KO HaCaT cells manifested as altered translation, protein biosynthesis, and cell adhesion. In addition, p53-deficient HaCaT cells are characterized by increased migration rates and reduced epidermal differentiation capacity, displaying signs of EMT and a pro-oncogenic phenotype.
The oncosuppressive functions of p53 are not limited by its antiproliferative activity but extend to other processes, including the regulation of migration. The impact of p53 on cell motility is largely manifested through actin cytoskeleton regulation via Rho signaling [71,72]. P53 also maintains a transcriptional program, preventing the EMT. Loss of this program in p53-null tumors results in the expression of an EMT-like phenotype [73]. Furthermore, p53 suppresses the EMT by regulating non-coding miRNAs of the miR200 family [74,75]. Our results are in line with these data, as TP53 knockout results in altered migration and other features of the EMT. The implementation of pro-tumor programs in p53-deficient HaCaT cells may indicate that, despite the presence of mutations in TP53, the encoded protein retains its tumor suppressor functions.
Supplementary Materials
The following supporting information can be downloaded at https://www.mdpi.com/article/10.3390/cimb46020094/s1; Table S1: Differences between WT and TP53-KO cells at transcriptome and proteome levels. Video S1: Wound-healing assay.
Author Contributions
Conceptualization, A.R. and N.L.; methodology, D.R., V.A. and A.V.; software, V.A. and E.P.; validation, D.R., V.A. and A.R.; formal analysis, D.R. and N.L.; investigation, D.R., V.A., I.V. and A.V.; resources, N.L. and E.P.; data curation, D.R., V.A. and E.P.; writing—original draft preparation, D.R. and V.A.; writing—review and editing, N.L. and A.N.; visualization, D.R. and V.A.; supervision, A.R. and N.L.; project administration, A.R.; funding acquisition, N.L. All authors have read and agreed to the published version of the manuscript.
Funding
The work was performed within the framework of the Program for Basic Research in the Russian Federation for a long-term period (2021–2030) (№ 122022800481-0).
Institutional Review Board Statement
Not applicable.
Informed Consent Statement
Not applicable.
Data Availability Statement
Raw transcriptome data files are publicly available on the NCBI SRA (https://www.ncbi.nlm.nih.gov, accessed on 14 August 2023). The submission number is PRJNA1005459 for both WT and TP53-KO cells.
Acknowledgments
The authors thank Bogomiakova M.E. for assistance with the flow cytometry analysis.
Conflicts of Interest
The authors declare no conflicts of interest.
References
- Levine, A.J. p53: 800 million years of evolution and 40 years of discovery. Nat. Rev. Cancer 2020, 20, 471–480. [Google Scholar] [CrossRef]
- Nehal, K.S.; Bichakjian, C.K. Update on Keratinocyte Carcinomas. N. Engl. J. Med. 2018, 379, 363–374. [Google Scholar] [CrossRef]
- Piipponen, M.; Riihilä, P.; Nissinen, L.; Kähäri, V.-M. The Role of p53 in Progression of Cutaneous Squamous Cell Carcinoma. Cancers 2021, 13, 4507. [Google Scholar] [CrossRef] [PubMed]
- Giglia-Mari, G.; Sarasin, A. TP53 mutations in human skin cancers. Hum. Mutat. 2003, 21, 217–228. [Google Scholar] [CrossRef] [PubMed]
- Boukamp, P.; Petrussevska, R.T.; Breitkreutz, D.; Hornung, J.; Markham, A.; Fusenig, N.E. Normal keratinization in a spontaneously immortalized aneuploid human keratinocyte cell line. J. Cell Biol. 1988, 106, 761–771. [Google Scholar] [CrossRef] [PubMed]
- Colombo, I.; Sangiovanni, E.; Maggio, R.; Mattozzi, C.; Zava, S.; Corbett, Y.; Fumagalli, M.; Carlino, C.; Corsetto, P.A.; Scaccabarozzi, D.; et al. HaCaT Cells as a Reliable In Vitro Differentiation Model to Dissect the Inflammatory/Repair Response of Human Keratinocytes. Mediators Inflamm. 2017, 2017, 7435621. [Google Scholar] [CrossRef]
- Shkrigunov, T.; Kisrieva, Y.; Samenkova, N.; Larina, O.; Zgoda, V.; Rusanov, A.; Romashin, D.; Luzgina, N.; Karuzina, I.; Lisitsa, A.; et al. Comparative proteoinformatics revealed the essentials of SDS impact on HaCaT keratinocytes. Sci. Rep. 2022, 12, 21437. [Google Scholar] [CrossRef]
- Li, J.-Y.; Cui, D.-L.; Xie, Y.-M.; Su, J.-Z.; Zhang, M.-Y.; Niu, Y.-Y.; Xiang, P. Mechanisms of Cd-Induced Cytotoxicity in Normal Human Skin Keratinocytes: Implication for Human Health. Int. J. Mol. Sci. 2022, 23, 11767. [Google Scholar] [CrossRef]
- Lehman, T.A.; Modali, R.; Boukamp, P.; Stanek, J.; Bennett, W.P.; Welsh, J.A.; Metcalf, R.A.; Stampfer, M.R.; Fusenig, N.; Rogan, E.M. p53 mutations in human immortalized epithelial cell lines. Carcinogenesis 1993, 14, 833–839. [Google Scholar] [CrossRef]
- Martynova, E.; Pozzi, S.; Basile, V.; Dolfini, D.; Zambelli, F.; Imbriano, C.; Pavesi, G.; Mantovani, R. Gain-of-function p53 mutants have widespread genomic locations partially overlapping with p63. Oncotarget 2012, 3, 132–143. [Google Scholar] [CrossRef]
- Müller, I.; Beissert, S.; Kulms, D. Anti-Apoptotic NF-κB and “Gain of Function” mutp53 in Concert Act Pro-Apoptotic in Response to UVB+IL-1 via Enhanced TNF Production. J. Investig. Dermatol. 2015, 135, 851–860. [Google Scholar] [CrossRef] [PubMed]
- Vikhanskaya, F.; Lee, M.K.; Mazzoletti, M.; Broggini, M.; Sabapathy, K. Cancer-derived p53 mutants suppress p53-target gene expression—Potential mechanism for gain of function of mutant p53. Nucleic Acids Res. 2007, 35, 2093–2104. [Google Scholar] [CrossRef] [PubMed]
- El-Mahdy, M.A.; Zhu, Q.; Wang, Q.-E.; Wani, G.; Patnaik, S.; Zhao, Q.; Arafa, E.-S.; Barakat, B.; Mir, S.N.; Wani, A.A. Naringenin Protects HaCaT Human Keratinocytes Against UVB-induced Apoptosis and Enhances the Removal of Cyclobutane Pyrimidine Dimers from the Genome. Photochem. Photobiol. 2008, 84, 307–316. [Google Scholar] [CrossRef] [PubMed]
- Reagan-Shaw, S.; Breur, J.; Ahmad, N. Enhancement of UVB radiation-mediated apoptosis by sanguinarine in HaCaT human immortalized keratinocytes. Mol. Cancer Ther. 2006, 5, 418–429. [Google Scholar] [CrossRef] [PubMed]
- Lewis, D.A.; Hengeltraub, S.F.; Gao, F.C.; Leivant, M.A.; Spandau, D.F. Aberrant NF-κB Activity in HaCaT Cells Alters their Response to UVB Signaling. J. Investig. Dermatol. 2006, 126, 1885–1892. [Google Scholar] [CrossRef] [PubMed]
- Tyagi, N.; Bhardwaj, A.; Srivastava, S.K.; Arora, S.; Marimuthu, S.; Deshmukh, S.K.; Singh, A.P.; Carter, J.E.; Singh, S. Development and Characterization of a Novel in vitro Progression Model for UVB-Induced Skin Carcinogenesis. Sci. Rep. 2015, 5, 13894. [Google Scholar] [CrossRef] [PubMed]
- Rusanov, A.L.; Romashin, D.D.; Kozhin, P.M.; Karagyaur, M.N.; Loginov, D.S.; Tikhonova, O.V.; Zgoda, V.G.; Luzgina, N.G. Impact of p53 Knockout on Protein Data Set of HaCaT Cells in Confluent and Subconfluent Conditions. Data 2022, 7, 27. [Google Scholar] [CrossRef]
- Trivedi, U.H.; Cézard, T.; Bridgett, S.; Montazam, A.; Nichols, J.; Blaxter, M.; Gharbi, K. Quality control of next-generation sequencing data without a reference. Front. Genet. 2014, 5, 111. [Google Scholar] [CrossRef]
- Patro, R.; Duggal, G.; Love, M.I.; Irizarry, R.A.; Kingsford, C. Salmon provides fast and bias-aware quantification of transcript expression. Nat. Methods 2017, 14, 417–419. [Google Scholar] [CrossRef]
- Love, M.I.; Huber, W.; Anders, S. Moderated estimation of fold change and dispersion for RNA-seq data with DESeq2. Genome Biol. 2014, 15, 550. [Google Scholar] [CrossRef]
- Carlsson, H.; Petersson, S.; Enerbäck, C. Cluster analysis of S100 gene expression and genes correlating to psoriasin (S100A7) expression at different stages of breast cancer development. Int. J. Oncol. 2005, 27, 1473–1481. [Google Scholar] [PubMed]
- Poverennaya, E.V.; Pyatnitskiy, M.A.; Dolgalev, G.V.; Arzumanian, V.A.; Kiseleva, O.I.; Kurbatov, I.Y.; Kurbatov, L.K.; Vakhrushev, I.V.; Romashin, D.D.; Kim, Y.S.; et al. Exploiting Multi-Omics Profiling and Systems Biology to Investigate Functions of TOMM34. Biology 2023, 12, 198. [Google Scholar] [CrossRef]
- Martens, M.; Ammar, A.; Riutta, A.; Waagmeester, A.; Slenter, D.N.; Hanspers, K.; Miller, R.A.; Digles, D.; Lopes, E.N.; Ehrhart, F.; et al. WikiPathways: Connecting communities. Nucleic Acids Res. 2020, 49, D613–D621. [Google Scholar] [CrossRef] [PubMed]
- Schubert, M.; Klinger, B.; Klünemann, M.; Sieber, A.; Uhlitz, F.; Sauer, S.; Garnett, M.J.; Blüthgen, N.; Saez-Rodriguez, J. Perturbation-response genes reveal signaling footprints in cancer gene expression. Nat. Commun. 2018, 9, 20. [Google Scholar] [CrossRef]
- Gene Ontology Consortium; Aleksander, S.A.; Balhoff, J.; Carbon, S.; Cherry, J.M.; Drabkin, H.J.; Ebert, D.; Feuermann, M.; Gaudet, P.; Harris, N.L.; et al. The Gene Ontology knowledgebase in 2023. Genetics 2023, 224, iyad031. [Google Scholar] [CrossRef]
- Tan, T.Z.; Miow, Q.H.; Miki, Y.; Noda, T.; Mori, S.; Huang, R.Y.-J.; Thiery, J.P. Epithelial-mesenchymal transition spectrum quantification and its efficacy in deciphering survival and drug responses of cancer patients. EMBO Mol. Med. 2014, 6, 1279–1293. [Google Scholar] [CrossRef] [PubMed]
- Livak, K.J.; Schmittgen, T.D. Analysis of relative gene expression data using real-time quantitative PCR and the 2(-Delta Delta C(T)) Method. Methods San Diego Calif. 2001, 25, 402–408. [Google Scholar] [CrossRef]
- Blanchard, G.; Pich, C.; Hohl, D. HaCaT cells as a model system to study primary cilia in keratinocytes. Exp. Dermatol. 2022, 31, 1276–1280. [Google Scholar] [CrossRef]
- Mahagita, C.; Grassl, S.M.; Piyachaturawat, P.; Ballatori, N. Human organic anion transporter 1B1 and 1B3 function as bidirectional carriers and do not mediate GSH-bile acid cotransport. Am. J. Physiol. Gastrointest. Liver Physiol. 2007, 293, G271–G278. [Google Scholar] [CrossRef]
- König, J.; Cui, Y.; Nies, A.T.; Keppler, D. Localization and genomic organization of a new hepatocellular organic anion transporting polypeptide. J. Biol. Chem. 2000, 275, 23161–23168. [Google Scholar] [CrossRef]
- Shapanis, A.; Lai, C.; Smith, S.; Coltart, G.; Sommerlad, M.; Schofield, J.; Parkinson, E.; Skipp, P.; Healy, E. Identification of proteins associated with development of metastasis from cutaneous squamous cell carcinomas (cSCCs) via proteomic analysis of primary cSCCs. Br. J. Dermatol. 2021, 184, 709–721. [Google Scholar] [CrossRef]
- Valle-Rios, R.; Maravillas-Montero, J.L.; Burkhardt, A.M.; Martinez, C.; Buhren, B.A.; Homey, B.; Gerber, P.A.; Robinson, O.; Hevezi, P.; Zlotnik, A. Isthmin 1 is a secreted protein expressed in skin, mucosal tissues, and NK, NKT, and th17 cells. J. Interferon Cytokine Res. 2014, 34, 795–801. [Google Scholar] [CrossRef]
- Dickinson, S.E.; Khawam, M.; Kirschnerova, V.; Vaishampayan, P.; Centuori, S.M.; Saboda, K.; Calvert, V.S.; Petricoin, E.F.; Curiel-Lewandrowski, C. Increased PD-L1 Expression in Human Skin Acutely and Chronically Exposed to UV Irradiation. Photochem. Photobiol. 2021, 97, 778–784. [Google Scholar] [CrossRef]
- Ock, C.-Y.; Kim, S.; Keam, B.; Kim, M.; Kim, T.M.; Kim, J.-H.; Jeon, Y.K.; Lee, J.-S.; Kwon, S.K.; Hah, J.H.; et al. PD-L1 expression is associated with epithelial-mesenchymal transition in head and neck squamous cell carcinoma. Oncotarget 2016, 7, 15901–15914. [Google Scholar] [CrossRef]
- Yu, Z.; Yu, Q.; Xu, H.; Dai, X.; Yu, Y.; Cui, L.; Chen, Y.; Gu, J.; Zhang, X.; Guo, C.; et al. IL-17A Promotes Psoriasis-Associated Keratinocyte Proliferation through ACT1-Dependent Activation of YAP-AREG Axis. J. Investig. Dermatol. 2022, 142, 2343–2352. [Google Scholar] [CrossRef] [PubMed]
- Wang, L.; Wang, L.; Zhang, H.; Lu, J.; Zhang, Z.; Wu, H.; Liang, Z. AREG mediates the epithelial-mesenchymal transition in pancreatic cancer cells via the EGFR/ERK/NF-κB signalling pathway. Oncol. Rep. 2020, 43, 1558–1568. [Google Scholar] [CrossRef] [PubMed]
- Cabral-Pacheco, G.A.; Garza-Veloz, I.; Castruita-De la Rosa, C.; Ramirez-Acuña, J.M.; Perez-Romero, B.A.; Guerrero-Rodriguez, J.F.; Martinez-Avila, N.; Martinez-Fierro, M.L. The Roles of Matrix Metalloproteinases and Their Inhibitors in Human Diseases. Int. J. Mol. Sci. 2020, 21, 9739. [Google Scholar] [CrossRef] [PubMed]
- Napoli, S.; Scuderi, C.; Gattuso, G.; Di Bella, V.; Candido, S.; Basile, M.S.; Libra, M.; Falzone, L. Functional Roles of Matrix Metalloproteinases and Their Inhibitors in Melanoma. Cells 2020, 9, 1151. [Google Scholar] [CrossRef] [PubMed]
- Sjoestroem, C.; Khosravi, S.; Cheng, Y.; Safaee Ardekani, G.; Martinka, M.; Li, G. DLC1 expression is reduced in human cutaneous melanoma and correlates with patient survival. Mod. Pathol. 2014, 27, 1203–1211. [Google Scholar] [CrossRef] [PubMed][Green Version]
- Wang, D.; Qian, X.; Rajaram, M.; Durkin, M.E.; Lowy, D.R. DLC1 is the principal biologically-relevant down-regulated DLC family member in several cancers. Oncotarget 2016, 7, 45144–45157. [Google Scholar] [CrossRef] [PubMed]
- Cao, X.; Kaneko, T.; Li, J.S.; Liu, A.-D.; Voss, C.; Li, S.S.C. A phosphorylation switch controls the spatiotemporal activation of Rho GTPases in directional cell migration. Nat. Commun. 2015, 6, 7721. [Google Scholar] [CrossRef] [PubMed]
- Dierks, S.; von Hardenberg, S.; Schmidt, T.; Bremmer, F.; Burfeind, P.; Kaulfuß, S. Leupaxin stimulates adhesion and migration of prostate cancer cells through modulation of the phosphorylation status of the actin-binding protein caldesmon. Oncotarget 2015, 6, 13591–13606. [Google Scholar] [CrossRef][Green Version]
- Wang, Z.; He, T.; Lv, W.; Hu, J. Down-regulation of FBP1 in lung adenocarcinoma cells promotes proliferation and invasion through SLUG mediated epithelial mesenchymal transformation. Transl. Cancer Res. 2023, 12, 236–246. [Google Scholar] [CrossRef] [PubMed]
- Li, J.; Wang, Y.; Li, Q.-G.; Xue, J.-J.; Wang, Z.; Yuan, X.; Tong, J.-D.; Xu, L.-C. Downregulation of FBP1 Promotes Tumor Metastasis and Indicates Poor Prognosis in Gastric Cancer via Regulating Epithelial-Mesenchymal Transition. PLoS ONE 2016, 11, e0167857. [Google Scholar] [CrossRef] [PubMed]
- Ondruššek, R.; Kvokačková, B.; Kryštofová, K.; Brychtová, S.; Souček, K.; Bouchal, J. Prognostic value and multifaceted roles of tetraspanin CD9 in cancer. Front. Oncol. 2023, 13, 1140738. [Google Scholar] [CrossRef] [PubMed]
- Bloor, B.K.; Seddon, S.V.; Morgan, P.R. Gene expression of differentiation-specific keratins in oral epithelial dysplasia and squamous cell carcinoma. Oral Oncol. 2001, 37, 251–261. [Google Scholar] [CrossRef] [PubMed]
- Hatta, M.; Miyake, Y.; Uchida, K.; Yamazaki, J. Keratin 13 gene is epigenetically suppressed during transforming growth factor-β1-induced epithelial-mesenchymal transition in a human keratinocyte cell line. Biochem. Biophys. Res. Commun. 2018, 496, 381–386. [Google Scholar] [CrossRef]
- Collier, A.E.; Wek, R.C.; Spandau, D.F. Human keratinocyte differentiation requires translational control by the eIF2α kinase GCN2. J. Investig. Dermatol. 2017, 137, 1924–1934. [Google Scholar] [CrossRef]
- Sanz-Gómez, N.; Freije, A.; Gandarillas, A. Keratinocyte Differentiation by Flow Cytometry. Methods Mol. Biol. 2020, 2109, 83–92. [Google Scholar] [CrossRef]
- Teng, Y.; Fan, Y.; Ma, J.; Lu, W.; Liu, N.; Chen, Y.; Pan, W.; Tao, X. The PI3K/Akt Pathway: Emerging Roles in Skin Homeostasis and a Group of Non-Malignant Skin Disorders. Cells 2021, 10, 1219. [Google Scholar] [CrossRef]
- Braicu, C.; Buse, M.; Busuioc, C.; Drula, R.; Gulei, D.; Raduly, L.; Rusu, A.; Irimie, A.; Atanasov, A.G.; Slaby, O.; et al. A Comprehensive Review on MAPK: A Promising Therapeutic Target in Cancer. Cancers 2019, 11, 1618. [Google Scholar] [CrossRef] [PubMed]
- Whyte, J.L.; Smith, A.A.; Helms, J.A. Wnt Signaling and Injury Repair. Cold Spring Harb. Perspect. Biol. 2012, 4, a008078. [Google Scholar] [CrossRef] [PubMed]
- Fullard, N.; Moles, A.; O’Reilly, S.; van Laar, J.M.; Faini, D.; Diboll, J.; Reynolds, N.J.; Mann, D.A.; Reichelt, J.; Oakley, F. The c-Rel Subunit of NF-κB Regulates Epidermal Homeostasis and Promotes Skin Fibrosis in Mice. Am. J. Pathol. 2013, 182, 2109–2120. [Google Scholar] [CrossRef]
- Wullaert, A.; Bonnet, M.C.; Pasparakis, M. NF-κB in the regulation of epithelial homeostasis and inflammation. Cell Res. 2011, 21, 146–158. [Google Scholar] [CrossRef] [PubMed]
- Antonangeli, F.; Natalini, A.; Garassino, M.C.; Sica, A.; Santoni, A.; Di Rosa, F. Regulation of PD-L1 Expression by NF-κB in Cancer. Front. Immunol. 2020, 11, 584626. [Google Scholar] [CrossRef] [PubMed]
- Betzler, A.C.; Theodoraki, M.-N.; Schuler, P.J.; Döscher, J.; Laban, S.; Hoffmann, T.K.; Brunner, C. NF-κB and Its Role in Checkpoint Control. Int. J. Mol. Sci. 2020, 21, 3949. [Google Scholar] [CrossRef] [PubMed]
- Yang, J.; Antin, P.; Berx, G.; Blanpain, C.; Brabletz, T.; Bronner, M.; Campbell, K.; Cano, A.; Casanova, J.; Christofori, G.; et al. Guidelines and definitions for research on epithelial-mesenchymal transition. Nat. Rev. Mol. Cell Biol. 2020, 21, 341–352. [Google Scholar] [CrossRef]
- Takada, K.; Komine-Aizawa, S.; Hirohata, N.; Trinh, Q.D.; Nishina, A.; Kimura, H.; Hayakawa, S. Poly I:C induces collective migration of HaCaT keratinocytes via IL-8. BMC Immunol. 2017, 18, 19. [Google Scholar] [CrossRef]
- Su, L.; Fu, L.; Li, X.; Zhang, Y.; Li, Z.; Wu, X.; Li, Y.; Bai, X.; Hu, D. Loss of CAR promotes migration and proliferation of HaCaT cells, and accelerates wound healing in rats via Src-p38 MAPK pathway. Sci. Rep. 2016, 6, 19735. [Google Scholar] [CrossRef]
- Watt, F.M. Involucrin and other markers of keratinocyte terminal differentiation. J. Investig. Dermatol. 1983, 81, 100s–103s. [Google Scholar] [CrossRef]
- Wilson, V.G. Growth and Differentiation of HaCaT Keratinocytes. In Epidermal Cells: Methods and Protocols; Turksen, K., Ed.; Methods in Molecular Biology; Springer: New York, NY, USA, 2014; pp. 33–41. [Google Scholar] [CrossRef]
- Wang, S.; Drummond, M.L.; Guerrero-Juarez, C.F.; Tarapore, E.; MacLean, A.L.; Stabell, A.R.; Wu, S.C.; Gutierrez, G.; That, B.T.; Benavente, C.A.; et al. Single cell transcriptomics of human epidermis identifies basal stem cell transition states. Nat. Commun. 2020, 11, 4239. [Google Scholar] [CrossRef] [PubMed]
- Rosdy, M.; Clauss, L.C. Terminal epidermal differentiation of human keratinocytes grown in chemically defined medium on inert filter substrates at the air-liquid interface. J. Investig. Dermatol. 1990, 95, 409–414. [Google Scholar] [CrossRef] [PubMed]
- Paramio, J.M.; Segrelles, C.; Laín, S.; Gómez-Casero, E.; Lane, D.P.; Lane, E.B.; Jorcano, J.L. p53 is phosphorylated at the carboxyl terminus and promotes the differentiation of human HaCaT keratinocytes. Mol. Carcinog. 2000, 29, 251–262. [Google Scholar] [CrossRef] [PubMed]
- Freije, A.; Molinuevo, R.; Ceballos, L.; Cagigas, M.; Alonso-Lecue, P.; Rodriguez, R.; Menendez, P.; Aberdam, D.; De Diego, E.; Gandarillas, A. Inactivation of p53 in Human Keratinocytes Leads to Squamous Differentiation and Shedding via Replication Stress and Mitotic Slippage. Cell Rep. 2014, 9, 1349–1360. [Google Scholar] [CrossRef] [PubMed]
- Saxena, K.; Jolly, M.K.; Balamurugan, K. Hypoxia, partial EMT and collective migration: Emerging culprits in metastasis. Transl. Oncol. 2020, 13, 100845. [Google Scholar] [CrossRef]
- Lu, P.; Lu, Y. Born to Run? Diverse Modes of Epithelial Migration. Front. Cell Dev. Biol. 2021, 9, 704939. Available online: https://www.frontiersin.org/articles/10.3389/fcell.2021.704939 (accessed on 20 December 2023). [CrossRef] [PubMed]
- Slater, N.A.; Googe, P.B. PD-L1 expression in cutaneous squamous cell carcinoma correlates with risk of metastasis. J. Cutan. Pathol. 2016, 43, 663–670. [Google Scholar] [CrossRef]
- Schaper, K.; Köther, B.; Hesse, K.; Satzger, I.; Gutzmer, R. The pattern and clinicopathological correlates of programmed death-ligand 1 expression in cutaneous squamous cell carcinoma. Br. J. Dermatol. 2017, 176, 1354–1356. [Google Scholar] [CrossRef]
- Sunshine, J.C.; Nguyen, P.L.; Kaunitz, G.J.; Cottrell, T.R.; Berry, S.; Esandrio, J.; Xu, H.; Ogurtsova, A.; Bleich, K.B.; Cornish, T.C.; et al. PD-L1 Expression in Melanoma: A Quantitative Immunohistochemical Antibody Comparison. Clin. Cancer Res. Off. J. Am. Assoc. Cancer Res. 2017, 23, 4938–4944. [Google Scholar] [CrossRef]
- Roger, L.; Gadea, G.; Roux, P. Control of cell migration: A tumour suppressor function for p53? Biol. Cell 2006, 98, 141–152. [Google Scholar] [CrossRef]
- Gadea, G.; de Toledo, M.; Anguille, C.; Roux, P. Loss of p53 promotes RhoA-ROCK-dependent cell migration and invasion in 3D matrices. J. Cell Biol. 2007, 178, 23–30. [Google Scholar] [CrossRef] [PubMed]
- Shiota, M.; Izumi, H.; Onitsuka, T.; Miyamoto, N.; Kashiwagi, E.; Kidani, A.; Hirano, G.; Takahashi, M.; Naito, S.; Kohno, K. Twist and p53 reciprocally regulate target genes via direct interaction. Oncogene 2008, 27, 5543–5553. [Google Scholar] [CrossRef] [PubMed]
- Chang, C.-J.; Chao, C.-H.; Xia, W.; Yang, J.-Y.; Xiong, Y.; Li, C.-W.; Yu, W.-H.; Rehman, S.K.; Hsu, J.L.; Lee, H.-H.; et al. p53 regulates epithelial-mesenchymal transition (EMT) and stem cell properties through modulating miRNAs. Nat. Cell Biol. 2011, 13, 317–323. [Google Scholar] [CrossRef] [PubMed]
- Tamura, M.; Sasaki, Y.; Kobashi, K.; Takeda, K.; Nakagaki, T.; Idogawa, M.; Tokino, T. CRKL oncogene is downregulated by p53 through miR-200s. Cancer Sci. 2015, 106, 1033–1040. [Google Scholar] [CrossRef]


Disclaimer/Publisher’s Note: The statements, opinions and data contained in all publications are solely those of the individual author(s) and contributor(s) and not of MDPI and/or the editor(s). MDPI and/or the editor(s) disclaim responsibility for any injury to people or property resulting from any ideas, methods, instructions or products referred to in the content. |
© 2024 by the authors. Licensee MDPI, Basel, Switzerland. This article is an open access article distributed under the terms and conditions of the Creative Commons Attribution (CC BY) license (https://creativecommons.org/licenses/by/4.0/).