Article

OCT4 Expression in Gliomas Is Dependent on Cell Metabolism

1
Petersburg Nuclear Physics Institute Named by B.P. Konstantinov of National Research Centre “Kurchatov Institute”, Orlova Roscha 1, 188300 Gatchina, Russia
2
Institute of Biomedical Systems and Biotechnologies, Peter the Great St. Petersburg Polytechnic University, Politehnicheskaya 29, 195251 St. Petersburg, Russia
3
H.Turner National Medical Research Center for Children’s Orthopedics and Trauma Surgery of the Ministry of Health of the Russian Federation, Parkovaya 64-68, Pushkin, 196603 St. Petersburg, Russia
4
National Research Center “Kurchatov Institute”, Akademika Kurchatova pl. 1, 123182 Moscow, Russia
5
Institute of Cytology, Russian Academy of Sciences, Tikhoretsky Ave. 4, 194064 St. Petersburg, Russia
*
Authors to whom correspondence should be addressed.
Curr. Issues Mol. Biol. 2024, 46(2), 1107-1120; https://doi.org/10.3390/cimb46020070
Submission received: 28 November 2023 / Revised: 16 January 2024 / Accepted: 21 January 2024 / Published: 25 January 2024
(This article belongs to the Section Biochemistry, Molecular and Cellular Biology)

Abstract

:
The OCT4 transcription factor is necessary to maintain cell stemness in the early stages of embryogenesis and is involved in the formation of induced pluripotent stem cells, but its role in oncogenesis is not yet entirely clear. In this work, OCT4 expression was investigated in malignant gliomas. Twenty glioma cell lines and a sample of normal adult brain tissue were used. OCT4 expression was found in all studied glioma cell lines but was not detected in normal adult brain tissue. For one of these lines, OCT4 knockdown caused tumor cell death. By varying the culture conditions of these cells, we unexpectedly found that OCT4 expression increased when cells were incubated in serum-free medium, and this effect was significantly enhanced in serum-free and L-glutamine-free medium. L-glutamine and the Krebs cycle, which is slowed down in serum-free medium according to our NMR data, are sources of α-KG. Thus, our data indicate that OCT4 expression in gliomas may be regulated by the α-KG-dependent metabolic reprogramming of cells.

1. Introduction

Malignant gliomas are invasive and rapidly progressing primary brain tumors that lead to the quick death of patients. The development of gliomas is associated with a loss of cell differentiation, anaplasia. A population of cancer stem cells capable of forming a tumor and supporting its growth was found in malignant gliomas. These cells expressed stemness markers, could grow as spheres in a serum-free medium with growth factors EGF and FGF-2 [1,2] and formed tumors in the brain of immunodeficient mice, reproducing histological features of human gliomas [3,4].
The stem cell status is maintained by a special set of transcription factors. OCT4, encoded by the POU5F1 gene, has an essential place among them. It contains conservative Pou and Homeo domains connected by a flexible loop that allows them to bind to large grooves on opposite sides of DNA. OCT4 recognizes the consensus ATGCAAAT sequence, which is often adjacent to the binding sites of other transcription factors, for example, SOX2, which can form complexes with OCT4. OCT4 regulates the expression of such genes as FGF4, UTF1, NANOG, SOX2 and POU5F1 itself [5]. In addition, OCT4 has been shown to be a pioneer factor. It binds to DNA at the site of its entry into and exit from the nucleosome and promotes the removal of nucleosomes, opening gene regulatory regions to other transcription factors [6].
In embryogenesis, OCT4 expression appears at the eight-cell stage, is absent in the trophectoderm, where it is suppressed by CDX2, is present in all cells of the inner mass of the blastocyst and is involved in the formation of epiblasts and primitive endoderm [7]. OCT4 is part of a combination of genes capable of converting dermal fibroblasts into induced pluripotent stem cells (iPSCs), which can differentiate into cells of all germ layers [8,9]. Interestingly, transfection of OCT4 alone was sufficient to convert human neural stem cells into iPSCs [10].
Normally, OCT4 expression is present only in the early stages of development and is absent in the nervous system, including the brain. It has been shown that OCT4 expression gradually ceases with a concomitant increase in the methylation status of its promoter during the directed differentiation of human embryonic stem cells into neural stem cells. This process occurs through an intermediate stage that contains both embryonic (including OCT4) and neural stem cell markers [11]. At the same time, OCT4 expression was detected in gliomas [12,13,14,15,16,17,18,19], indicating that this gene is involved in cell malignancy.
In this work, we investigated the expression of OCT4 and its role in tumor cell survival in our previously obtained glioma cell lines [20]. By changing cell growing conditions, we unexpectedly discovered that OCT4 expression in gliomas is associated with the metabolic reprogramming of cells.

2. Materials and Methods

2.1. Glioma Cell Lines and Normal Adult Brain Tissue

Glioma cell lines A-172 and T98G from the Vertebrate cell culture collection of the Institute of Cytology of the Russian Academy of Sciences, primary and secondary cell cultures of 18 glioblastomas (WHO grade IV), previously obtained in the laboratory of cell biology (National Research Center “Kurchatov Institute”—PNPI), as well as a sample of morphologically normal adult brain tissue adjacent to one of the gliomas [20], were used in the present study.
Cells were grown in DMEM/F12 (1:1) with L-glutamine (BioloT, St. Petersburg, Russia) containing 10% fetal bovine blood serum (Cytiva, HyClone). In a number of experiments, recombinant human growth factors EGF, FGF-2 (PanEco, Moscow, Russia) and PDGF BB (ProSpec, Rehovot, Israel) at a concentration of 20 ng/mL were used instead of serum. Serum and L-glutamine deprivation was carried out in DMEM/F-12 medium (1:1) without glutamine (PanEco, Moscow, Russia), whereas L-glutamine was added to 2 mM in the control. Cells were separated from the substrate with Versene solution. The number of cells was assessed using a LUNA-II Automated Cell Counter (Logos Biosystems, Anyang-Si, Republic of Korea) after mixing the cell suspension with trypan blue (1:1).
A comparative analysis of the proliferative activity of cells incubated in a medium with a standard content of serum and L-glutamine, as well as without serum, L-glutamine or both, was performed in real time using the xCELLigence RTCA DP System (ACEA Biosciences, Inc, Santa Clara, CA, USA). Cells were seeded onto a 16-well E-plate at 5 × 10³ per well in a medium with serum and L-glutamine, incubated overnight, washed and, after adding the appropriate medium, incubated for 7 days with a continuous recording of electrical resistance every 15 min. All samples within each experiment were in duplicates.

2.2. OCT4 Gene Knockdown

Knockdown was performed using siRNA against OCT4 (Dharmacon ON-TARGETplus SMARTpool human POU5F1 siRNA, Lafayette, CO, USA) and control siRNA (Dharmacon ON-TARGETplus control siRNA, Lafayette, CO, USA) at a concentration of 60 fmol/μL, which was introduced into cells using lipofectamine (Thermo Scientific DharmaFECT, Waltham, MA, USA) according to the manufacturer’s instructions. Cells were seeded into 24-well plates at 5 × 10³ cells per well, incubated with siRNA for 72 h and then separated from the substrate with Trypsin-Versene solution (BioloT, St. Petersburg, Russia) and reseeded into new 24-well plates at 1/10 suspension per well. Cell survival was assessed 6 days after reseeding, when the cells in the control wells almost reached a monolayer. An MTS test with resazurin and subsequent staining of the wells with crystal violet were carried out according to standard protocols. Fluorescence was detected using an EnSpire Multimode Plate Reader (PerkinElmer, Shelton, Connecticut, USA). The stained plates were photographed using the ChemiDoc system (Bio-Rad, Hercules, CA, USA), and the resulting images were processed in ImageJ. Experiments were carried out in triplicate. To test the efficiency of the knockdown, cells were seeded at 5 × 10⁵ cells per 25 cm2 flasks and incubated for 48 h with siRNA at the same concentration, and the protein levels were determined via Western blotting.

2.3. Western Blotting of OCT4A Protein

Cells were incubated at 4 °C for 30 min with lysis buffer (10 mM Tris-HCl (pH 8.9), 0.1% Triton X-100, 5 mM PMSF, 5 mM MgCl2, 5 units/mL DNase I, 20 mM β-mercaptoethanol). The resulting cell lysates were mixed with 4× standard loading buffer (0.25 M Tris (pH 6.8), 8% SDS, 40% glycerol, 20% β-mercaptoethanol, 0.2% bromophenol blue) in a 3:1 ratio and boiled for 5 min. Total protein levels were determined using the Bradford method to load equal amounts of protein onto the electrophoresis lanes. The electrophoretic separation of proteins was carried out in a 10% polyacrylamide gel containing 0.1% SDS, followed by the transfer of proteins to a PVDF membrane (Thermo Scientific, Waltham, MA, USA). To stain the membranes, we used primary mouse monoclonal antibodies to the OCT4A isoform (BD Pharmingen, San Diego, CA, USA) at a dilution of 1:2000 and GAPDH (Merck Millipore, Burlington, MA, USA) at a dilution of 1:500, as well as secondary goat antibodies against mouse immunoglobulins (Thermo Scientific, Waltham, MA, USA) conjugated with horseradish peroxidase at a dilution of 1:20,000. The chemiluminescent detection of electrophoretic zones was performed using the Clarity Western ECL Blotting Substrate kit (Bio-Rad, Hercules, CA, USA).

2.4. RNA Extraction and Real-Time RT-PCR

Total RNA was isolated from 2 × 10⁶ cells using an Aurum total RNA minikit (Bio-Rad, Hercules, CA, USA) and GeneJET RNA Purification Kit (Thermo Scientific, Waltham, MA, USA) according to the manufacturers’ protocols. DNA was removed using DNase-I (Thermo Scientific, Waltham, MA, USA) or 12 M LiCl. The amount of isolated RNA was assessed using a NanoDrop One spectrophotometer (Thermo Scientific, Waltham, MA, USA). Reverse transcription was performed using MMLV reverse transcriptase and primer oligo(dT)15 (Bio-Rad iScript cDNA Synthesis Kit, Hercules, CA, USA and Evrogen, Moscow, Russia) according to the manufacturers’ protocols.
The PCR reaction mixture (50 μL) contained 200 μM of each dNTP, 2.5 units of HS-Taq DNA polymerase (Evrogen, Moscow, Russia), 300 nM of each oligonucleotide (Syntol, Moscow, Russia) and 2 μg of cDNA. Sequences of primers and fluorescently labeled probes are shown in Table 1.
The reaction was carried out on DT-322 (DNA-Technology, Moscow, Russia) and CFX96 C1000 (Bio-Rad, Hercules, CA, USA) detecting thermal cyclers for 45 cycles. The program included preheating (1 min at 95 °C), DNA denaturation (15 s at 95 °C), primer annealing and amplification (1 min at 60 °C). The mRNA levels of tested genes were normalized on that of GAPDH or actin β. The absence of genomic DNA was monitored using RNA samples without reverse transcription.

2.5. Confocal Scanning Microscopy and Flow Cytometry

Cells grown on coverslips in Petri dishes or transferred into suspension (106 cells) were fixed with 4% formaldehyde (10 min at 4 °C), washed 2 times with PBS, permeabilized with 0.5% Triton-X100 (10 min at 20 °C), blocked with 3% BSA (15 min at 20 °C), incubated with primary monoclonal mouse antibodies to the OCT4A isoform labeled with Alexa647 (BD Pharmingen, San Diego, CA, USA), diluted with 1% BSA 1:20 (1 h at 20 °C) and washed 3 times with PBS. Negative control samples were supplemented with 1% BSA instead of antibodies. Samples for confocal microscopy were mounted in a solution of DAPI and VECTA SHIELD, and samples for flow cytometry were diluted in 300 μL PBS. Analysis was performed on a Leica TCS SP5X confocal scanning microscope at 60× magnification (Mannheim, Germany) and a CytoFLEX flow cytometer (Beckman Coulter, Brea, CA, USA). All experiments were performed at least three times.

2.6. NMR

GCL13 cells were seeded into 25 cm2 flasks and grown to a near monolayer. They were then washed to remove serum, and 10 mL DMEM/F-12 (1:1) (BioloT, St. Petersburg, Russia) with or without 10% serum was added. Then, 0.5 mL of the medium was taken from the flasks every day for 7 days and stored at −20 °C. When all samples were collected, they were thawed and purified from protein via incubation with 64% methanol at −20 °C for 30 min and centrifugation at 13,400 rpm for 10 min. Equal volumes of the collected supernatants were dried on a Concentrator plus complete system (Eppendorf, Hamburg, Germany) and dissolved in 600 μL D2O containing 1mM imidazole and 0.1 mM TSP as internal standards to determine the chemical shifts, metabolite concentrations and pH.
The spectra were recorded on a DirectDrive 700 NMR spectrometer (Varian, Inc., Palo Alto, CA, USA) containing an HCN probehead with a magnetic field gradient along the Z axis. The PRESAT pulse sequence from the spectrometer pulse program library was used to suppress the signal from the solvent (HDO).
The pulse sequence parameters are as follows: duration of the exciting pulse Pw = 6.7 μs, acquisition time of free induction decay (FID) Taq = 4 s, relaxation delay Rd = 12 s and number of repetitions of the pulse sequence Ns = 16.
The spectra were processed in the MestReNova Version 14.1 program (Mestrelab Research S.L., Santiago, Spain) using automatic phase correction. Baseline correction was performed using cubic splines at specified points in areas where there was no signal. The imidazole signal was used as a reference signal for integration, and the chemical shifts were determined from the position of the TSP signal (δ: 0.0 ppm). The concentrations were determined by integrating the signals δ: 5.25 and 4.66 ppm for glucose, δ: 1.34 ppm for lactate and δ: 2.68 ppm for citrate.

2.7. Sequencing of the IDH1 and IDH2 Gene Regions Containing Hot Spots

The primers were selected so that the amplified regions of IDH1 and IDH2 contained all the hot spots of these genes. The primer sequences are shown in Table 2.
DNA was isolated from 2 × 10⁶ cells using the KR-012 DNA isolation reagent kit (Omnix, St. Petersburg, Russia) according to the manufacturer’s protocol. The PCR reaction mixture (60 μL) contained 2.5 units of HS-Taq DNA polymerase (Evrogen, Moscow, Russia), 250 μM of each dNTP, 750 nM of forward and reverse primers (Alkor Bio, St. Petersburg, Russia) and 14 ng of DNA. The reaction was carried out on a T100 Thermal Cycler (Bio-Rad, Hercules, CA, USA) for 35 cycles. The program included preheating (5 min at 95 °C), DNA denaturation (30 s at 95 °C), primer annealing (25 s at 60 °C) and amplification (45 s at 72 °C). The size of the resulting fragments was confirmed via electrophoresis in a 6% acrylamide gel followed by staining with ethidium bromide solution.
The sequencing of DNA fragments was carried out using the Sanger method at the Evrogen (Moscow, Russia). The results were analyzed using the SnapGene Viewer 6.0.7 program.

2.8. Statistical Data Processing

Statistical data analysis was performed using GraphPad Prism 9.5.1 software. The processing of flow cytometry data and their visualization was carried out using the freely available Floreada.io plugin. The error in measuring the relative levels of OCT4A and OCT4B RNA for gliomas and norm was calculated through the relative error of the 2dCt function and the mean absolute error for the difference in threshold cycles of the reference and target genes, ln2*MAE(dCt). Error bars in other histograms indicate the standard deviation for at least three independent experiments. Data in histograms were compared using the nonparametric Mann–Whitney U test or a one-way ANOVA followed by a Tukey’s HSD test. Values of p < 0.05 were accepted as statistically significant differences.

3. Results

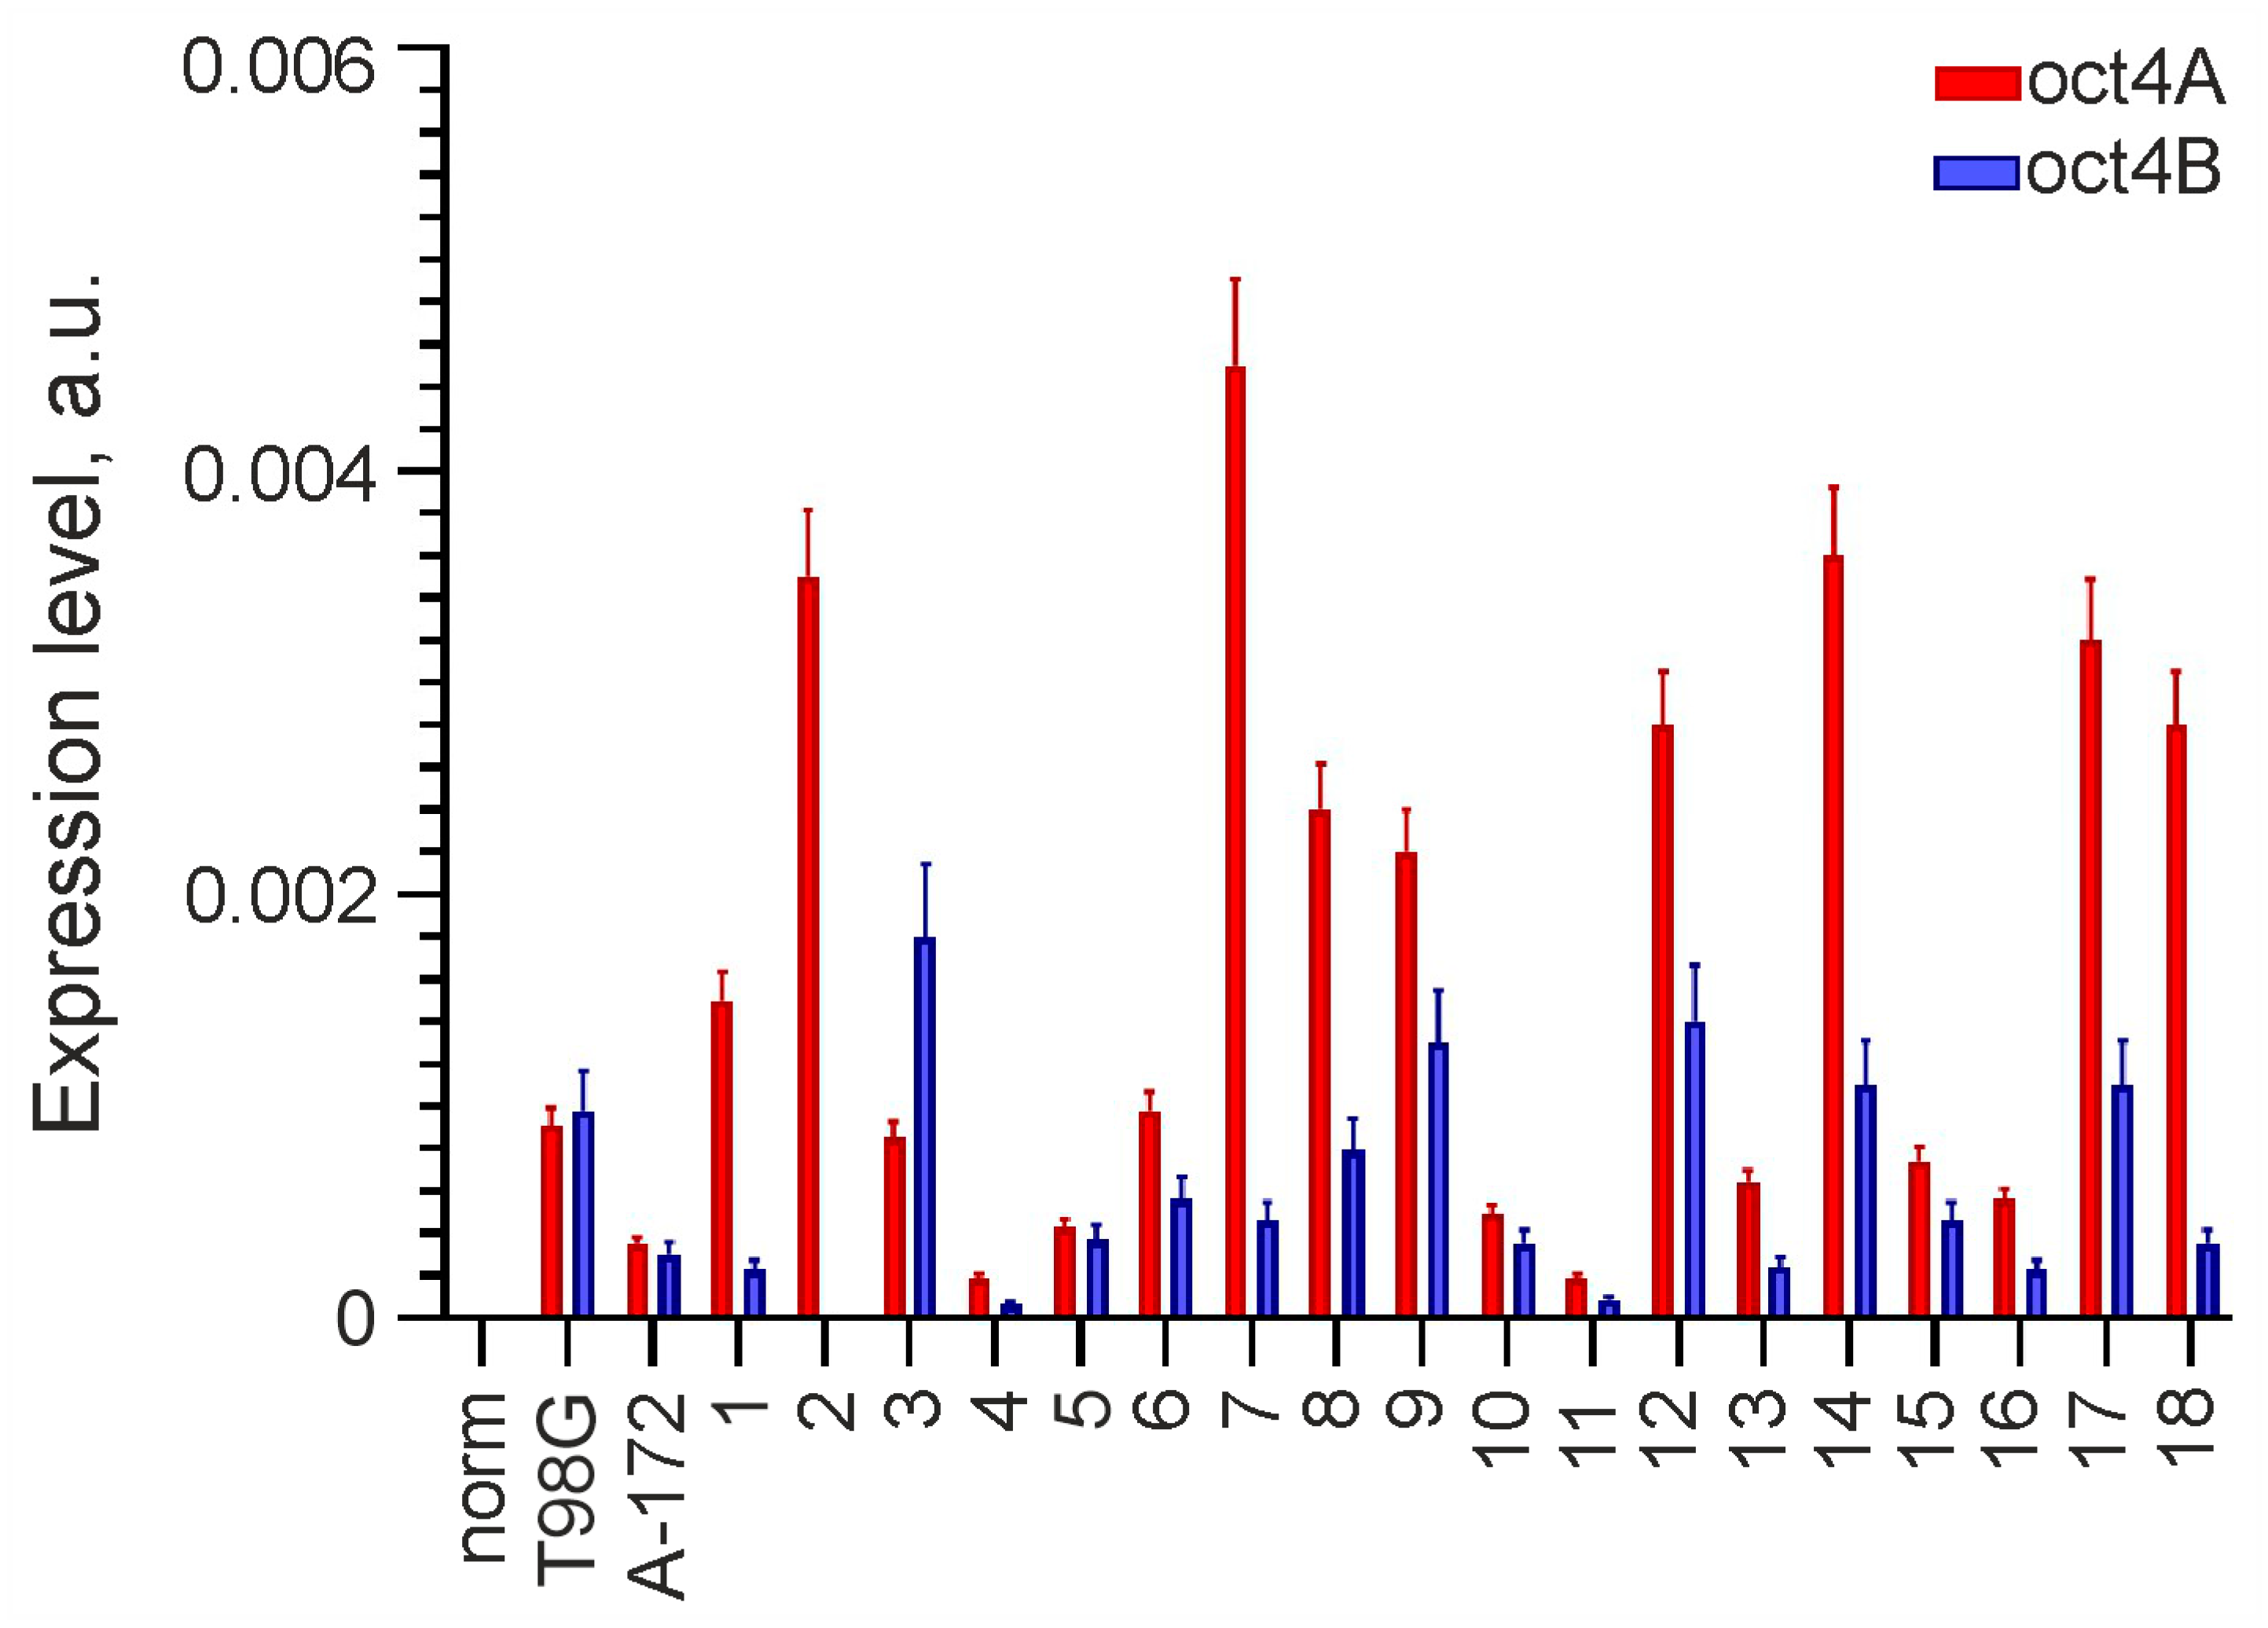
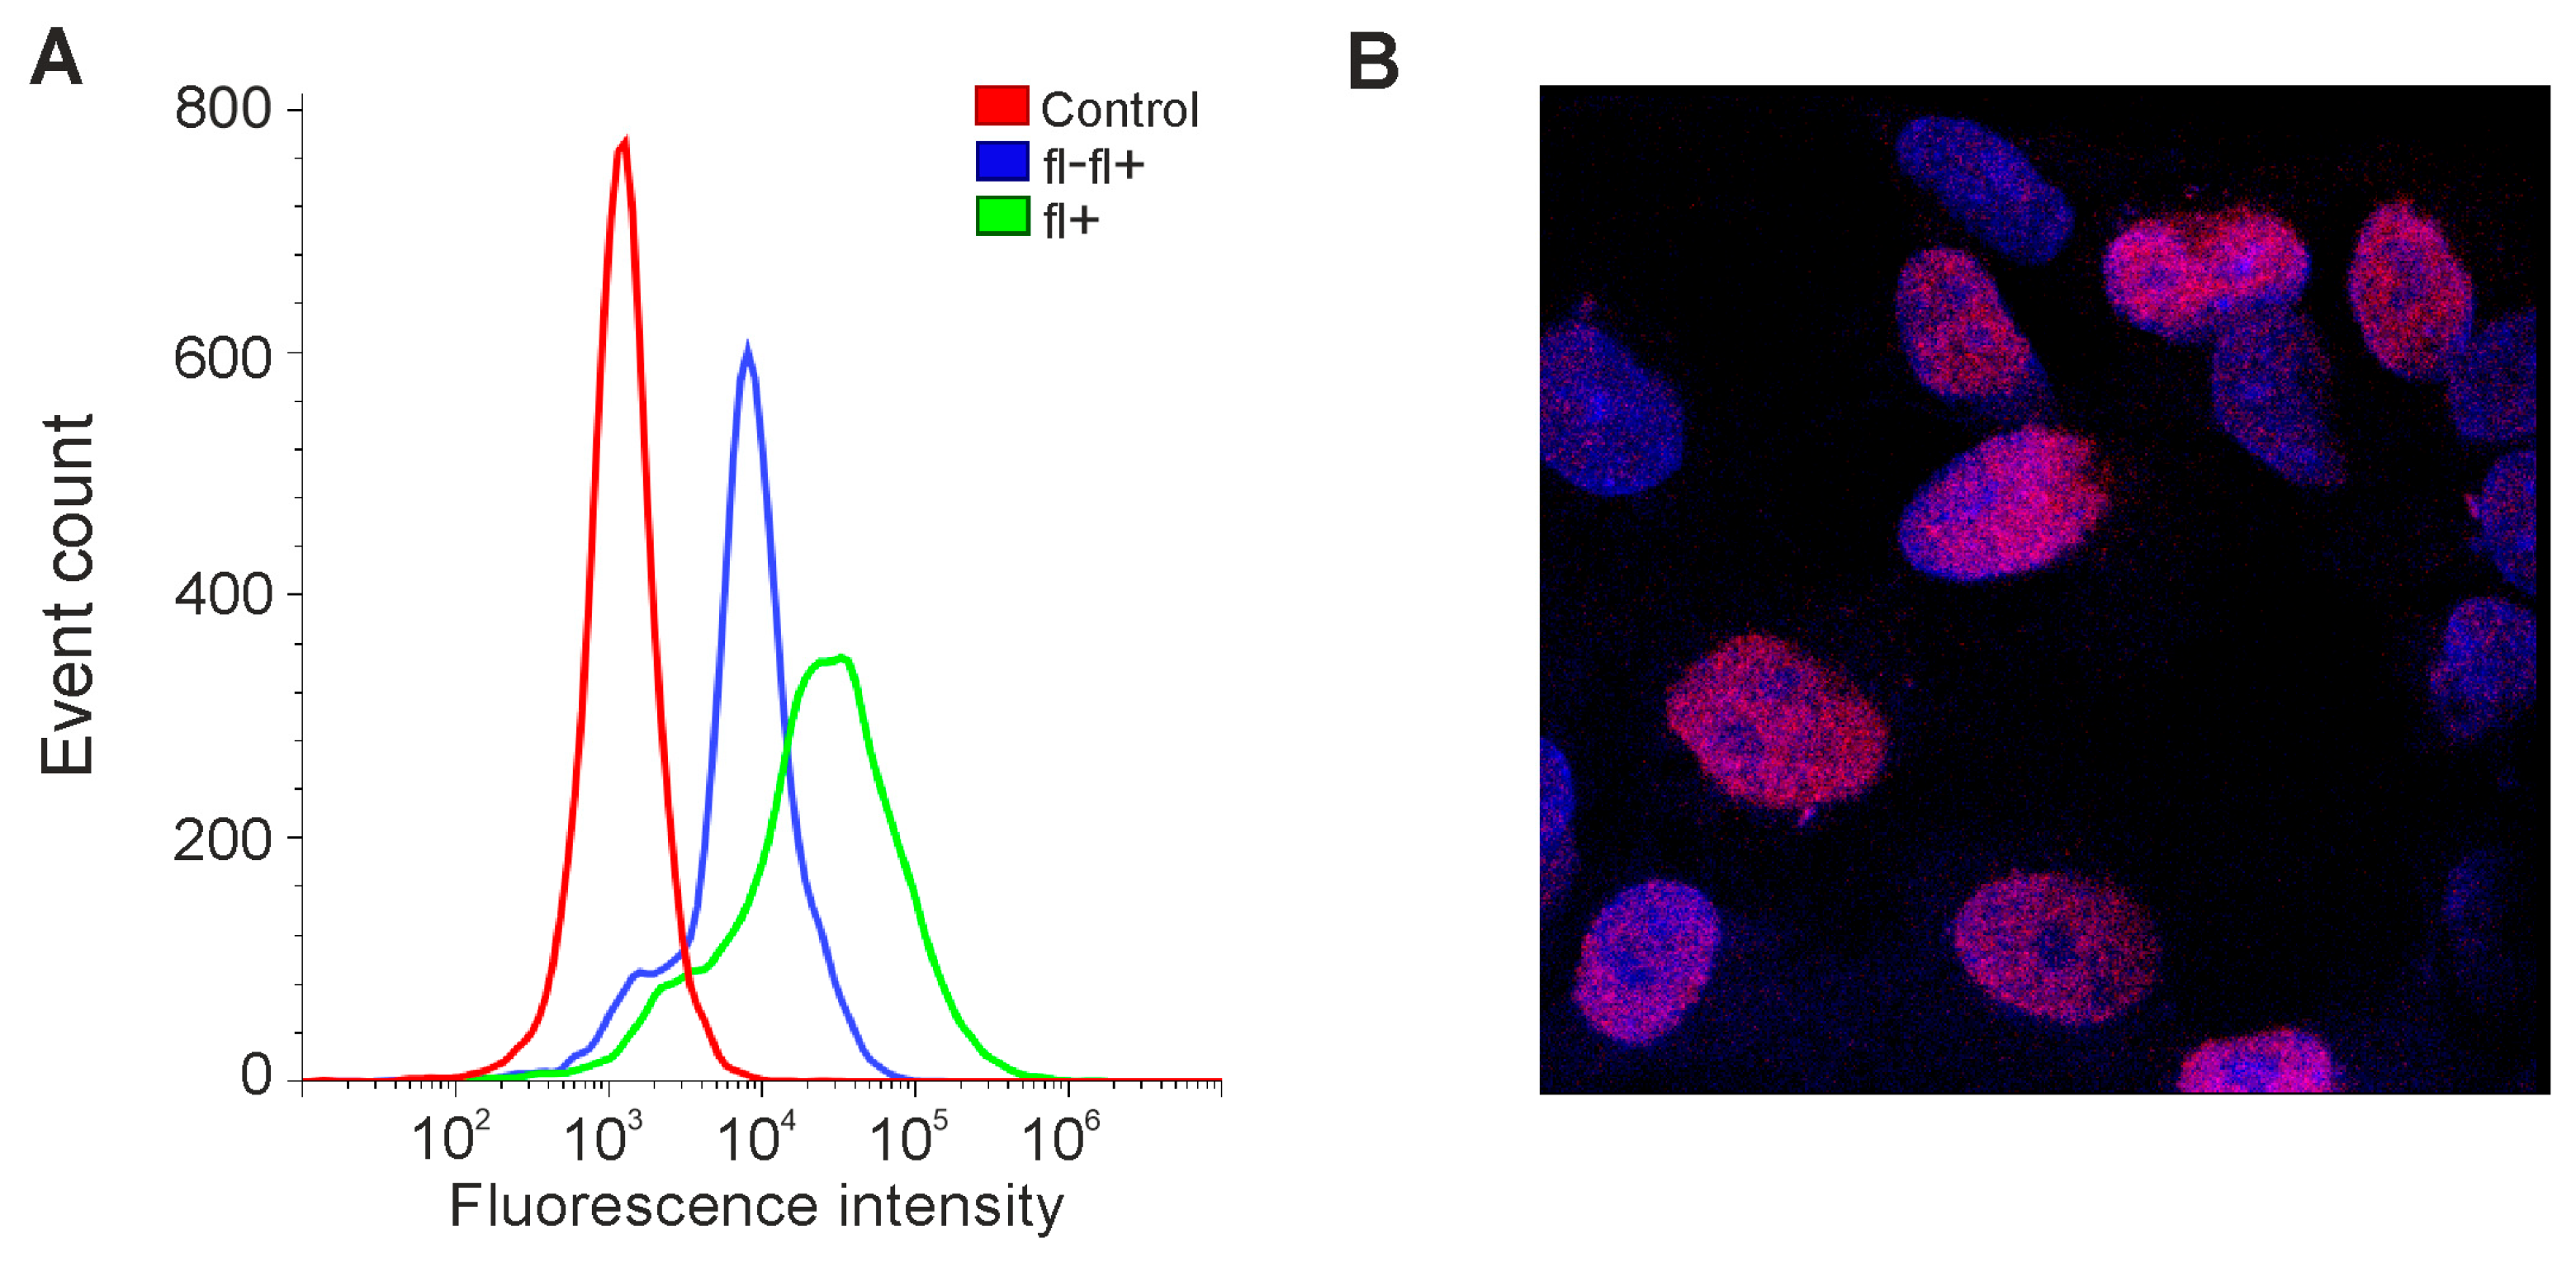
3.1. Expression of OCT4 Is Observed in Malignant Gliomas but Is Absent in Norm

Analysis of OCT4 expression was performed using real-time RT-PCR on 20 glioma lines, including A-172, T98G and primary cultures, and one sample of normal adult brain tissue adjacent to one of the gliomas. OCT4 expression was found in all studied gliomas but was not detected in norm. In 19 of 20 gliomas, OCT4 RNA was represented by both the OCT4A isoform encoding the transcription factor and the OCT4B isoform encoding the protein unable to bind DNA. The OCT4A isoform alone was detected in only one line (GCL2). The results are presented as a histogram in Figure 1.

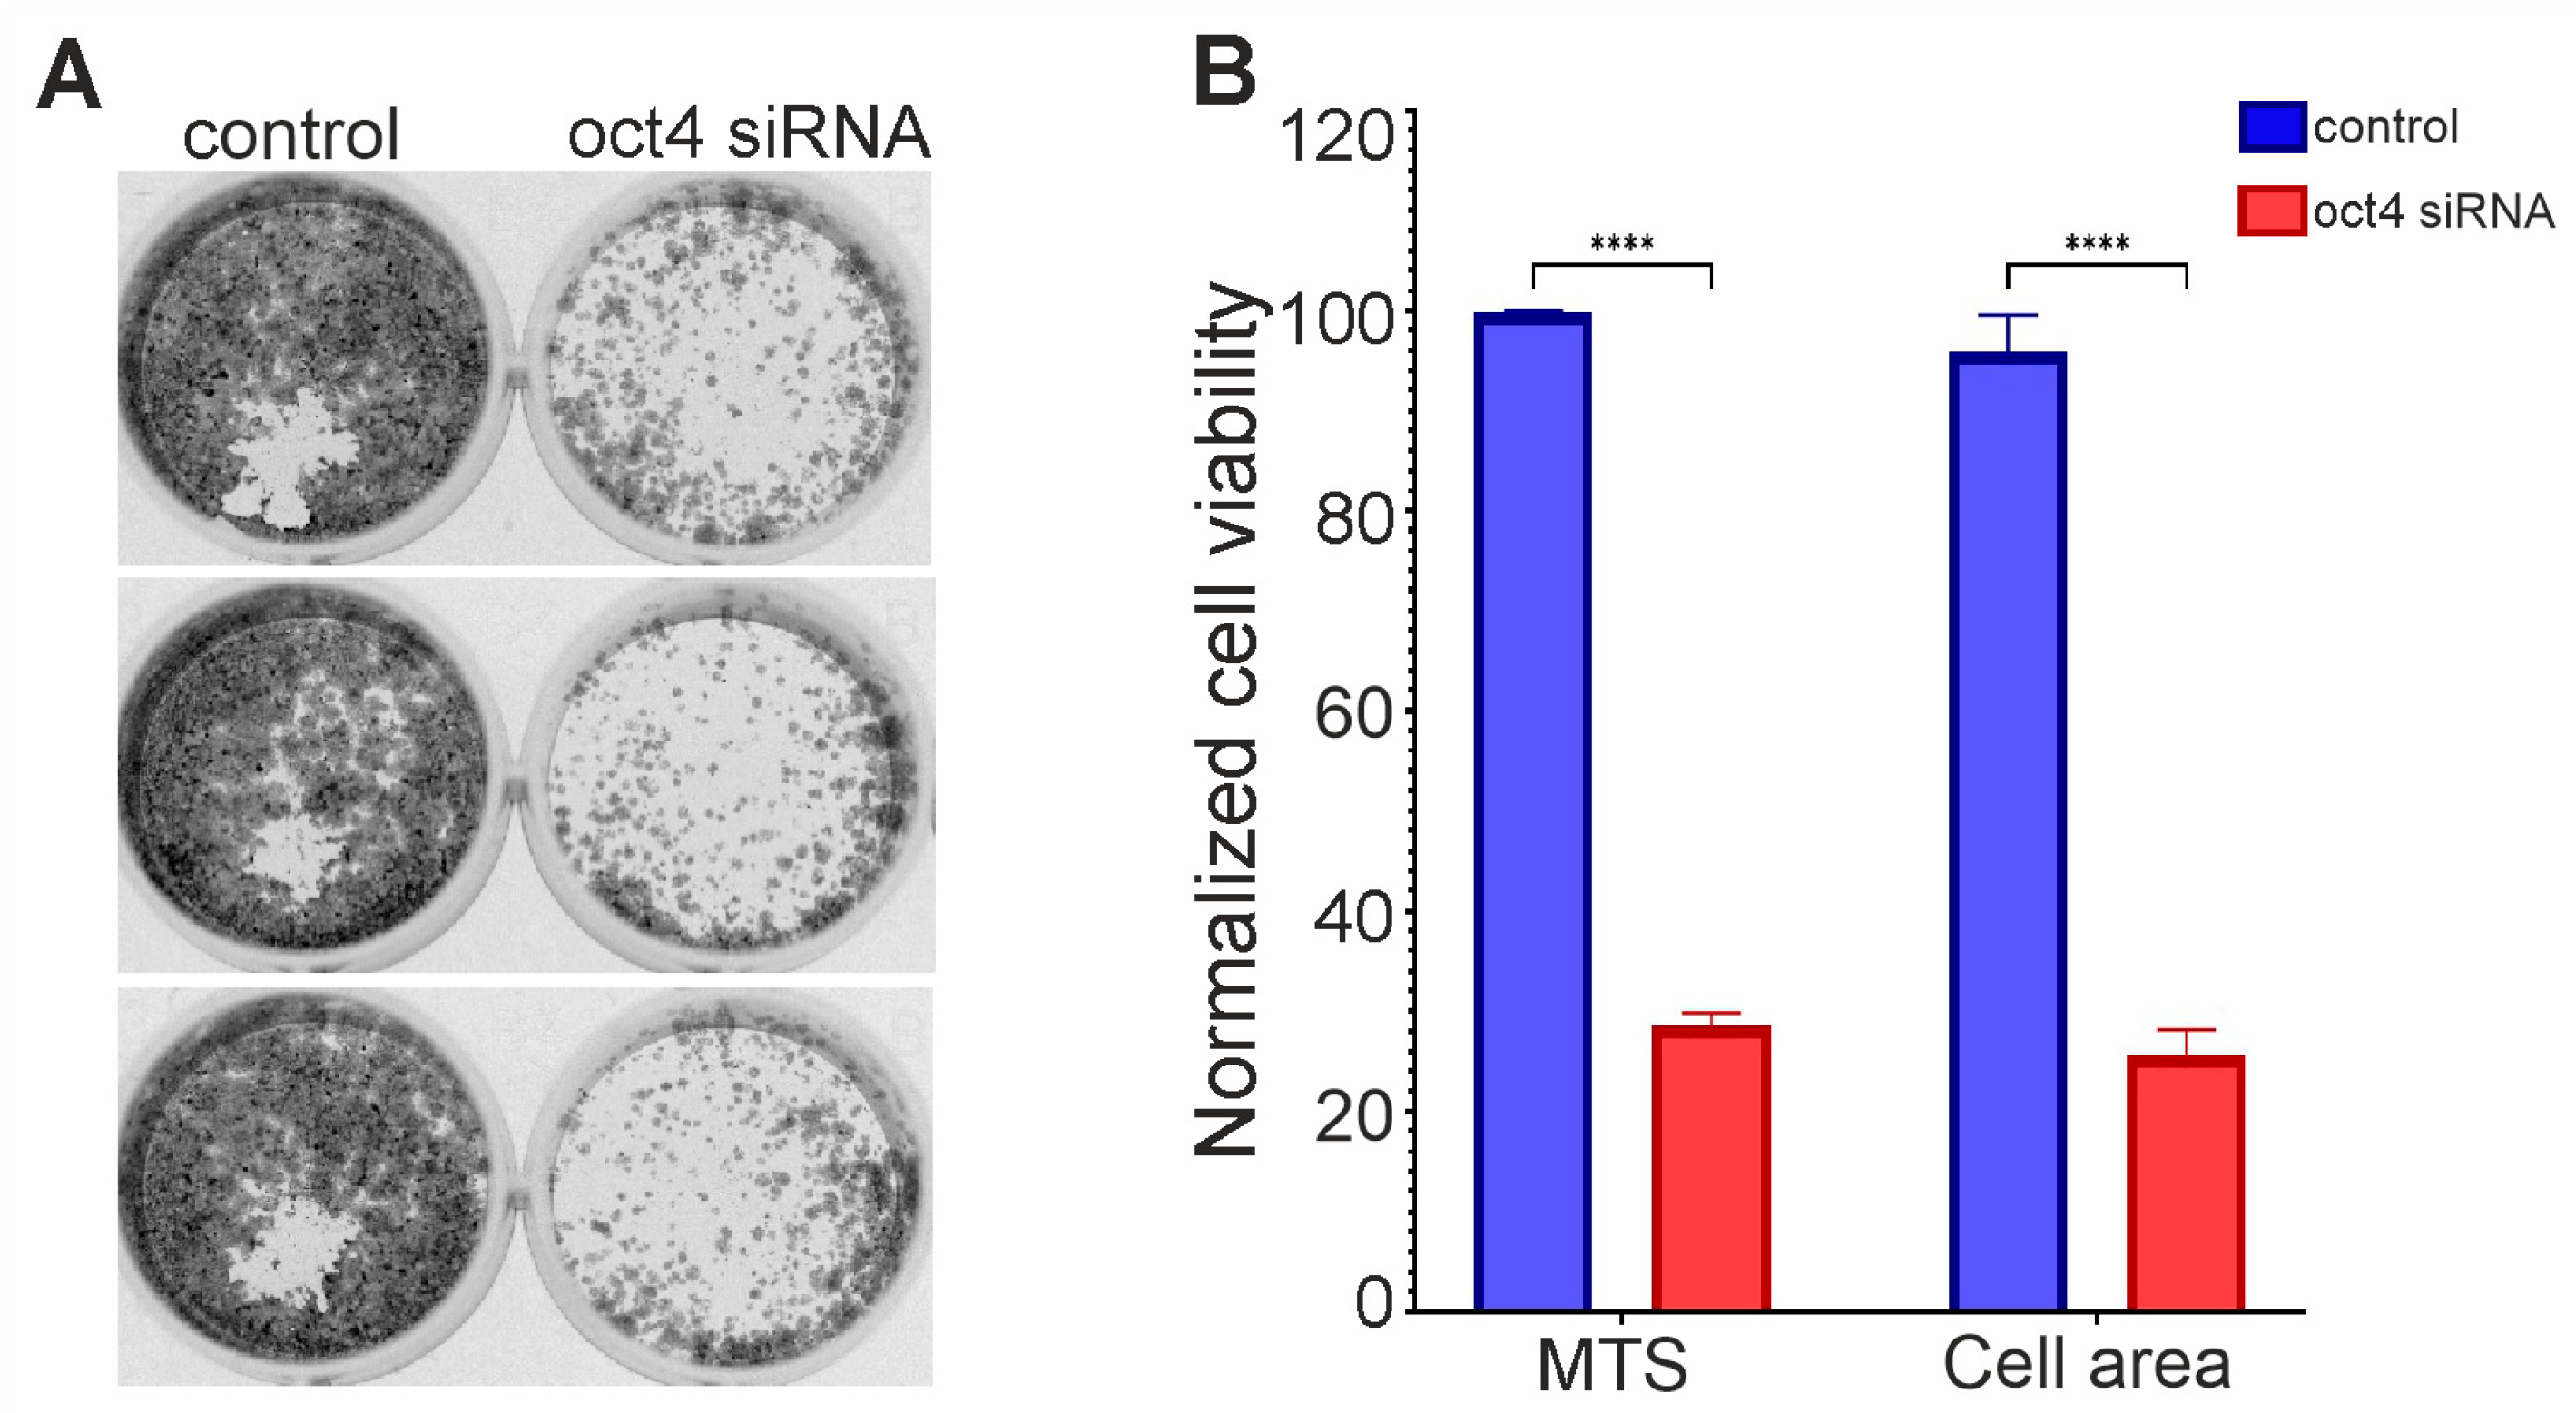
3.2. OCT4 Knockdown can Lead to Glioma Cell Death

Several primary cultures produced well-growing secondary lines. In one of them, the knockdown of OCT4 significantly reduced cell survival relative to the control (Figure 2). This line is designated here as GCL13 according to the order in the histogram of Figure 1. Images of wells with cells stained with crystal violet after incubation with siRNA for 72 h and reseeding are shown in Figure 2A. After OCT4 knockdown, cell survival, as measured by MTS fluorescence or the crystal violet-stained cell layer area, was reduced by more than 3-fold relative to the control (Figure 2B). A Western blot showed decreased OCT4A protein levels in GCL13 cells after incubation with siRNA for 48 h (data not presented here). The GCL13 was chosen as a model for further study of the function of OCT4 in gliomas.

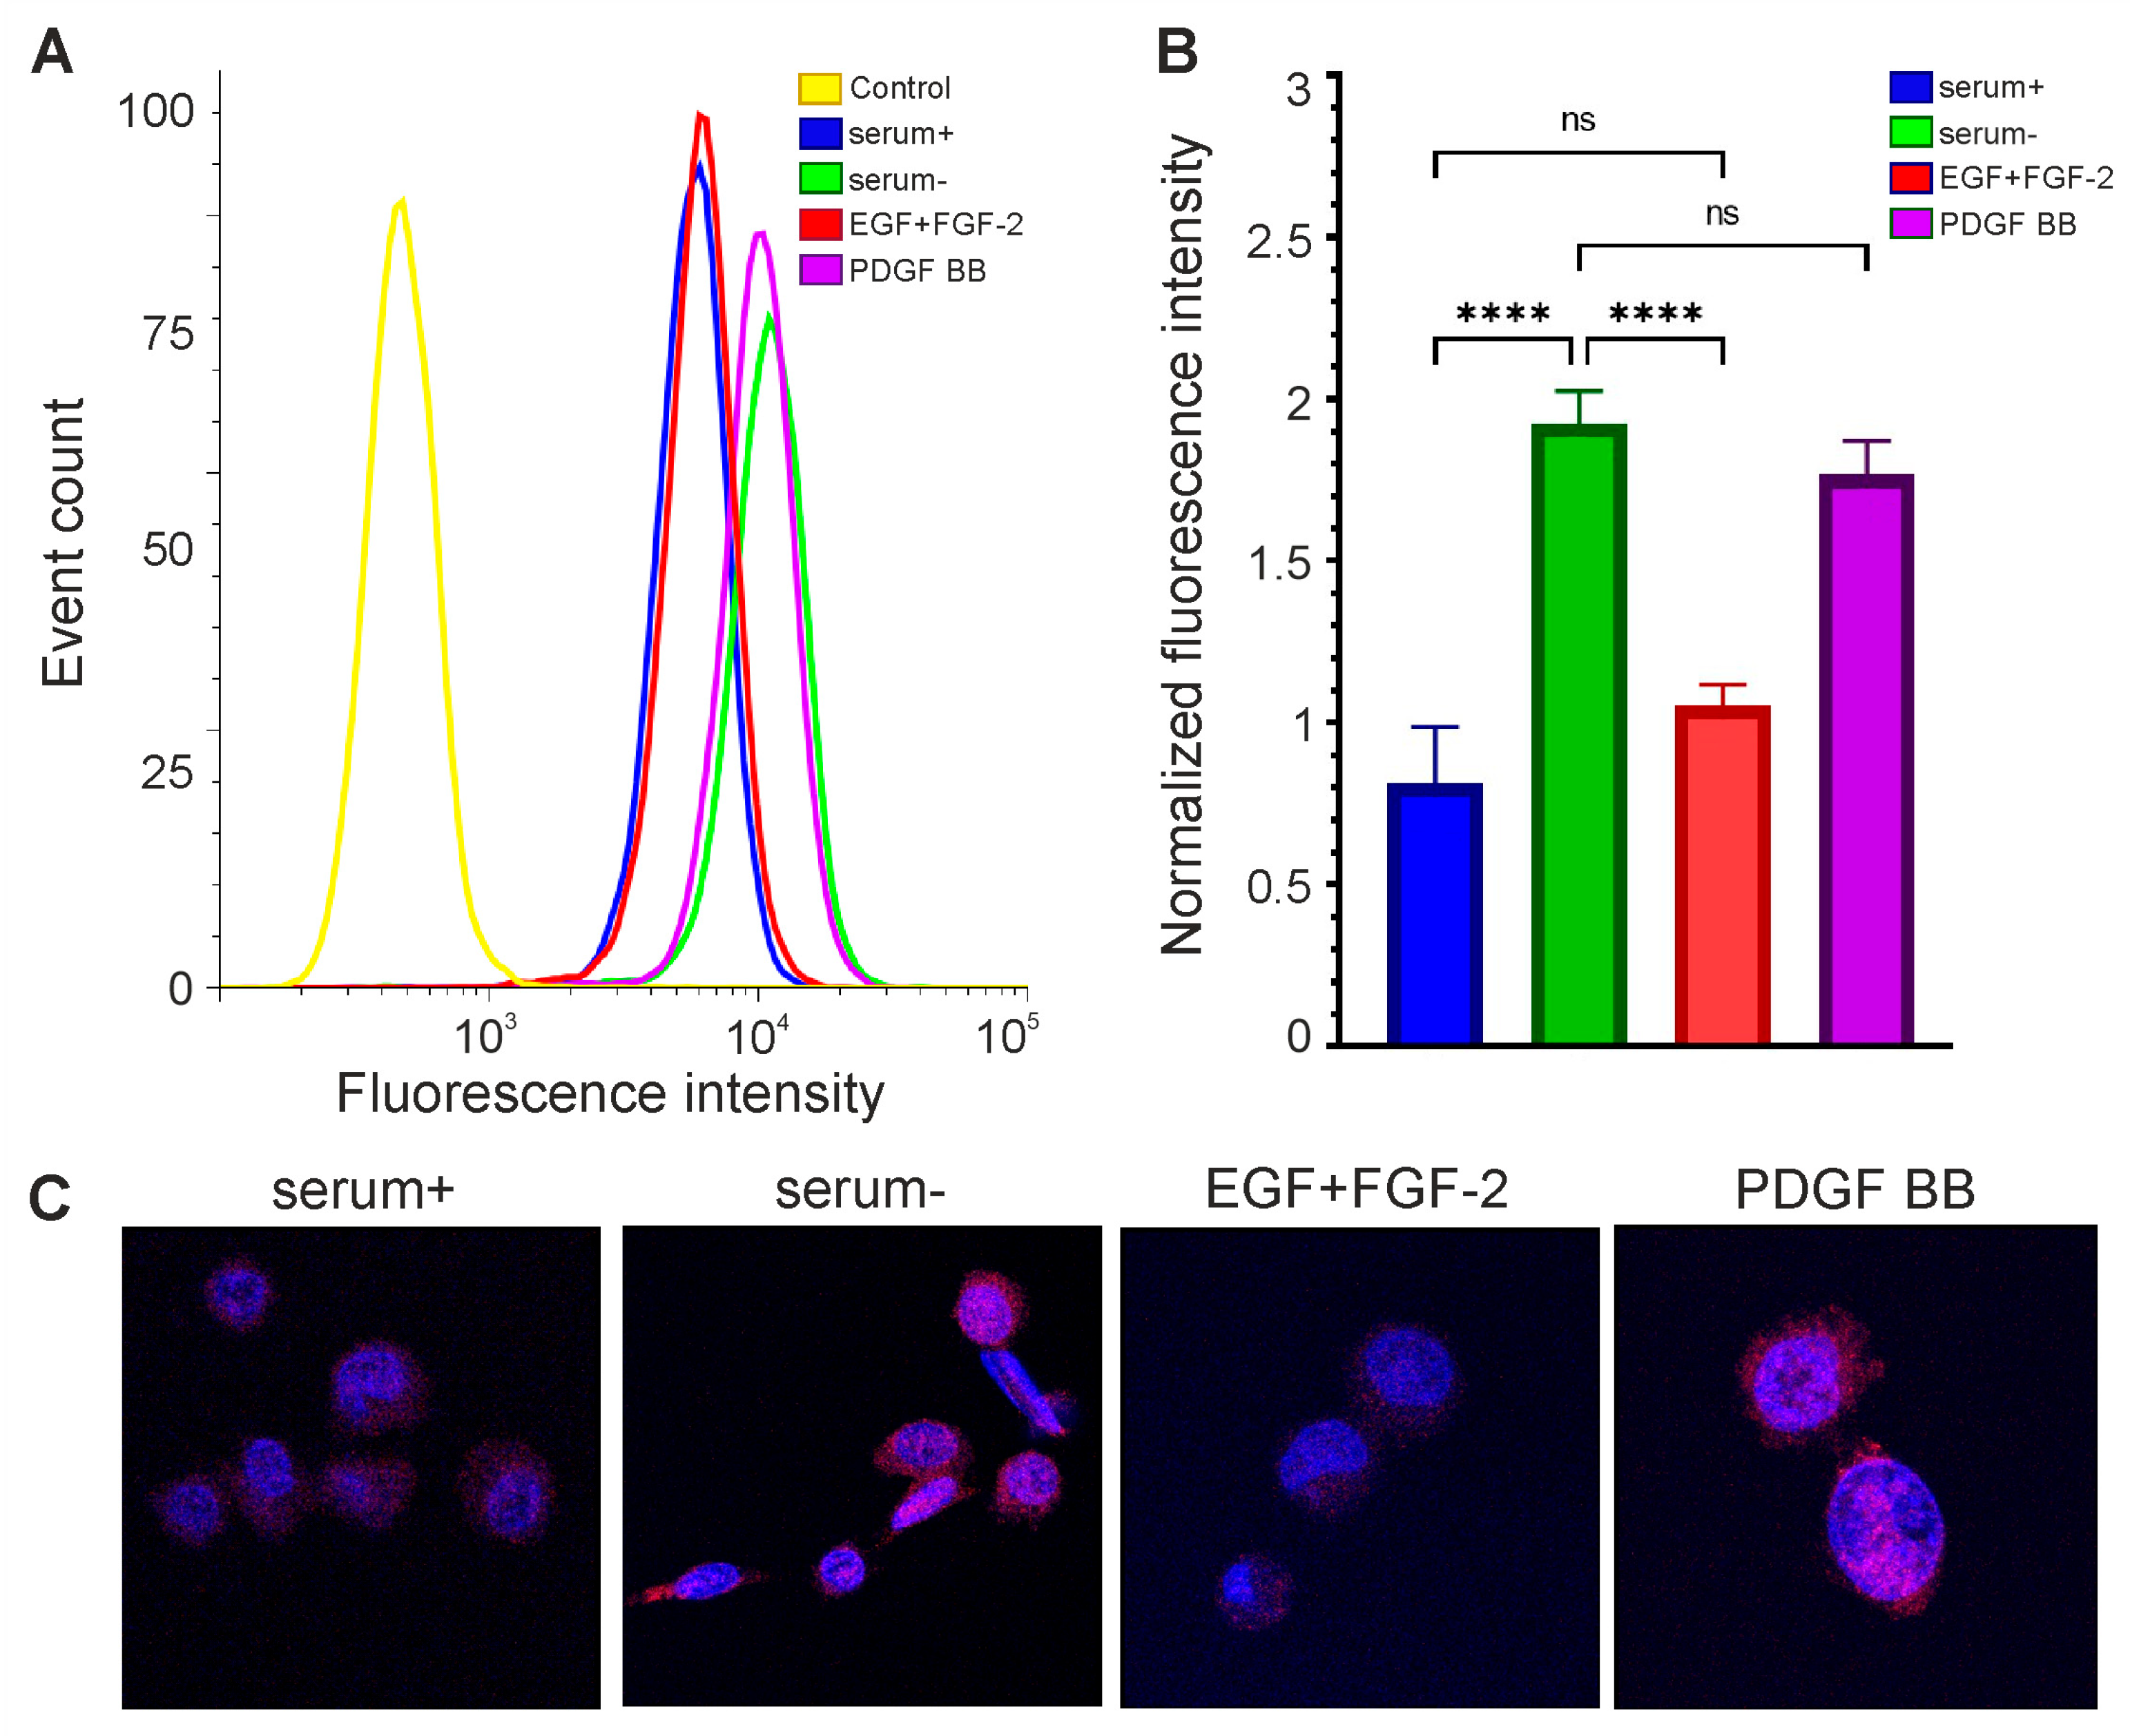
3.3. Expression of OCT4 in Gliomas Depends on Cell Culture Conditions

The growth factors EGF and FGF-2 are used to grow neural stem cells in culture instead of serum, which induces cell differentiation [21,22]. The growth of glioblastomas of the proneuronal subtype depends on PDGFRA, so another growth factor, PDGF, is used for their cultivation [23]. It has been shown that under these conditions, malignant glioma cells can restore OCT4 expression [23,24].
We decided to test whether the expression level of OCT4 could be increased in our lines in this way. GCL13 cells were incubated for 48 h in serum-free DMEM/F12 supplemented with EGF and FGF-2 or PDGF BB alone at a concentration of 20 ng/mL for each factor. Cells incubated in medium with 10% serum or without serum were used as a control. Cells were then stained with a primary mouse monoclonal antibody to OCT4A labeled Alexa647, and OCT4A levels were detected via flow cytometry and confocal microscopy. Human teratocarcinoma line PA-1 was used as a positive control for antibody specificity (Figure 3).
As expected, in the PA-1 line, OCT4A protein was localized in the nuclei, and its levels varied in different cells (Figure 3B). If cells were incubated first with unlabeled and then with labeled antibodies against OCT4A, the level of fluorescence dropped, confirming the specificity of the selected antibodies (Figure 3A). At the same time, in glioma GCL13, stained with the same antibodies, OCT4A could be located in the nuclei but was mainly detected in the cytoplasm evenly in all cells (Figure 4C). Examples of the detection of OCT4A protein in some other glioma cell lines (GCL12, GCL15, GCL16) via confocal microscopy are shown in Supplementary Figure S1.
The addition of growth factors EGF and FGF-2 did not increase OCT4A levels in GCL13 cells relative to the 10% serum control (Figure 4). At the same time, the level of OCT4A was significantly increased in serum-free medium (Figure 4). In serum-free medium supplemented with PDGF BB, OCT4A levels were almost the same as in serum-free medium, indicating that this growth factor did not affect OCT4 expression (Figure 4). The localization of OCT4A did not change in any case (Figure 4C). Thus, incubation in serum-free medium was sufficient to increase OCT4 expression in this culture, while the growth factors EGF and FGF-2 reduced it to the basal level.

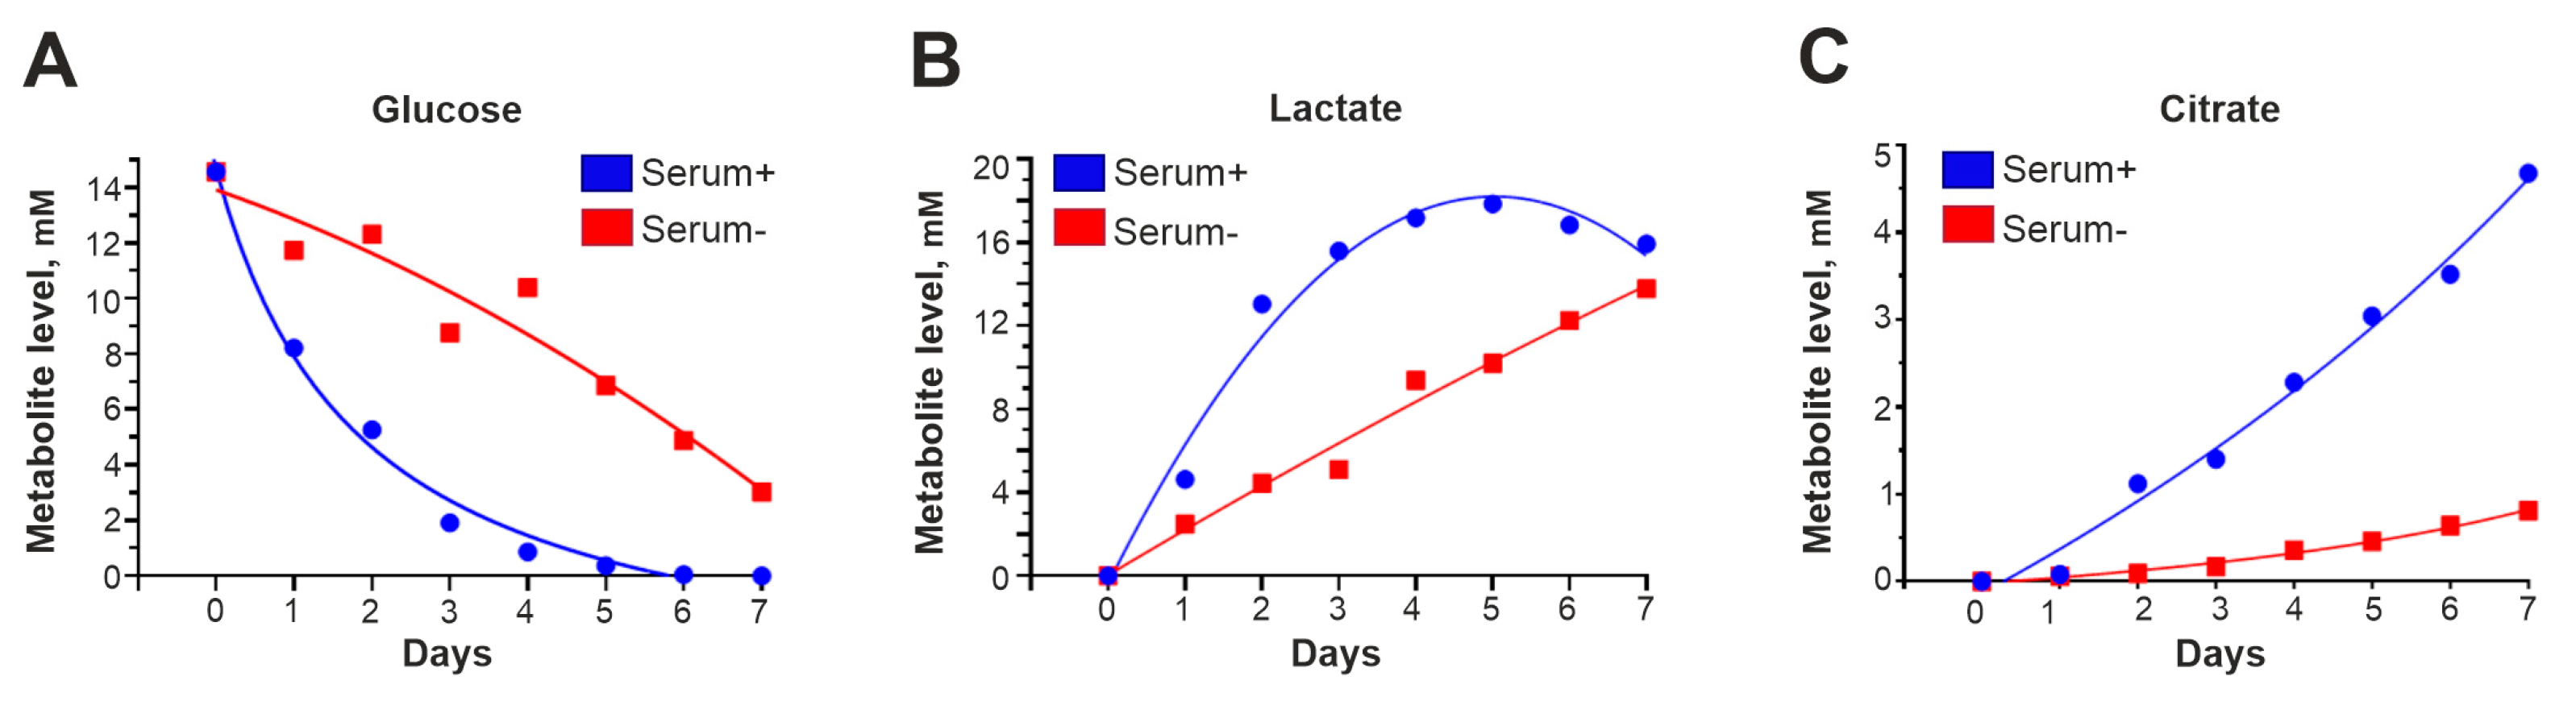
3.4. In Serum-Free Medium, Glucose Is Absorbed More Slowly, and the Levels of Intermediates Involved in Glycolysis and the Krebs Cycle Are Reduced

Some metabolites are coenzymes for proteins that regulate gene expression and participate in the metabolic reprogramming of cells. For example, α-ketoglutarate (α-KG) supports the activity of 5′-methylcytosine hydroxylases of the ten-eleven translocation (TET) family and histone demethylases with the JmjC domain, which change the state of chromatin through the demethylation of DNA and histones [25,26]. We noticed that in the absence of serum, cells oxidized the medium with lactic acid much more slowly than in a medium with 10% serum or the growth factors EGF and FGF2. Thus, the increase in oct4 expression that we observed could be due to the metabolic reprogramming of the cells.
To investigate how transfer to a serum-free medium changes the metabolic state of the cells, condensed medium from GCL13 cells incubated with or without 10% serum was collected every day for a week and then analyzed via NMR. Peaks corresponding to glucose, lactate (a marker of glycolysis) and citrate (a marker of the Krebs cycle) were well resolved in the resulting spectra, so we focused on these metabolites.
According to the NMR data, in condensed medium without serum, glucose levels decreased (Figure 5A), and levels of lactate (Figure 5B) and citrate (Figure 5C) accumulated significantly more slowly than in medium with 10% serum. Serum-free medium lacks insulin and other growth factors that stimulate glucose uptake and energy metabolism, including glycolysis and the Krebs cycle. Thus, the rate of these processes is reduced, so the levels of associated intermediates, including α-KG, are also reduced.

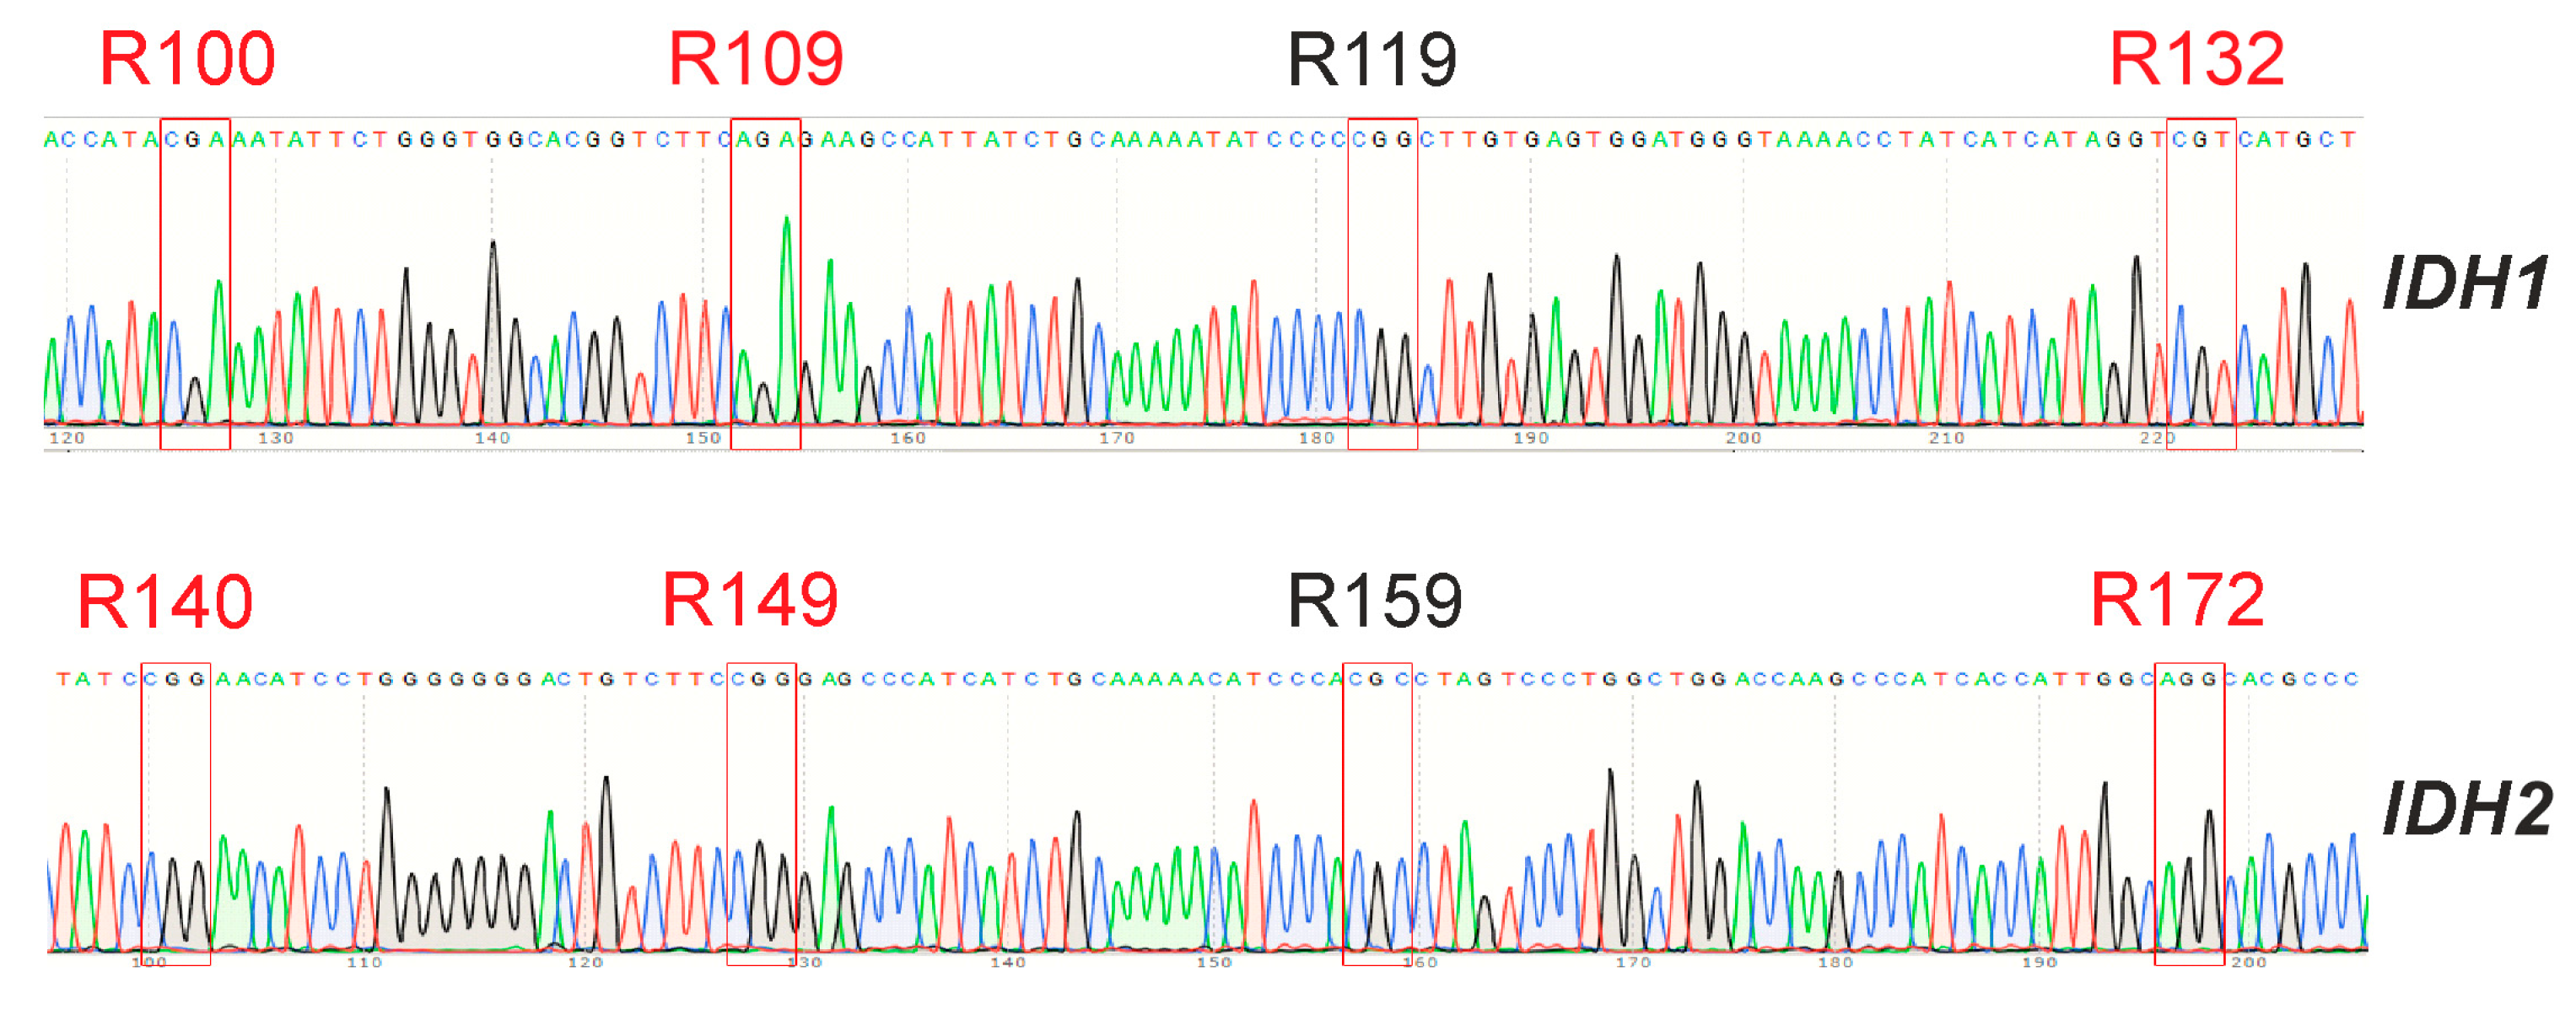
3.5. GCL13 Does Not Have Mutations in the Hot Spots of the IDH1 and IDH2 Genes

Isocitrate dehydrogenases IDH1 and IDH2 normally catalyze the reversible conversion of isocitrate to α-ketoglutarate (α-KG) in the Krebs cycle. Malignant gliomas may contain mutations in the genes of these enzymes [27]. These mutations are detected in most WHO grade II and III gliomas and secondary glioblastomas derived from them but are almost never found in primary glioblastomas [28]. All identified mutations are located in the fourth exons of these genes and lead to substitutions in one of the three conserved arginine residues in the active site of the enzymes: R100, R109 and R132 in IDH1 and R140, R149 and R172 in IDH2 [28]. Such enzymes lose the ability to bind isocitrate and can only carry out the incorrect reverse reaction, converting α-KG to D-2hydroxyglutarate (2HG) but not to isocitrate [29]. This results in the suppression of the activity of α-KG-dependent dioxygenases, due to a decrease in the level of α-KG and the accumulation of 2HG, which competitively inhibits these enzymes [26].
For the GCL13 line, the status of the IDH1 and IDH2 genes was determined. Sequencing results are presented in Figure 6. The obtained data did not differ from the reference sequences of the corresponding fragments of these genes from the NCBI database (NG_023319.2, NG_23302.1). Thus, hot spot mutations in these genes were not identified.

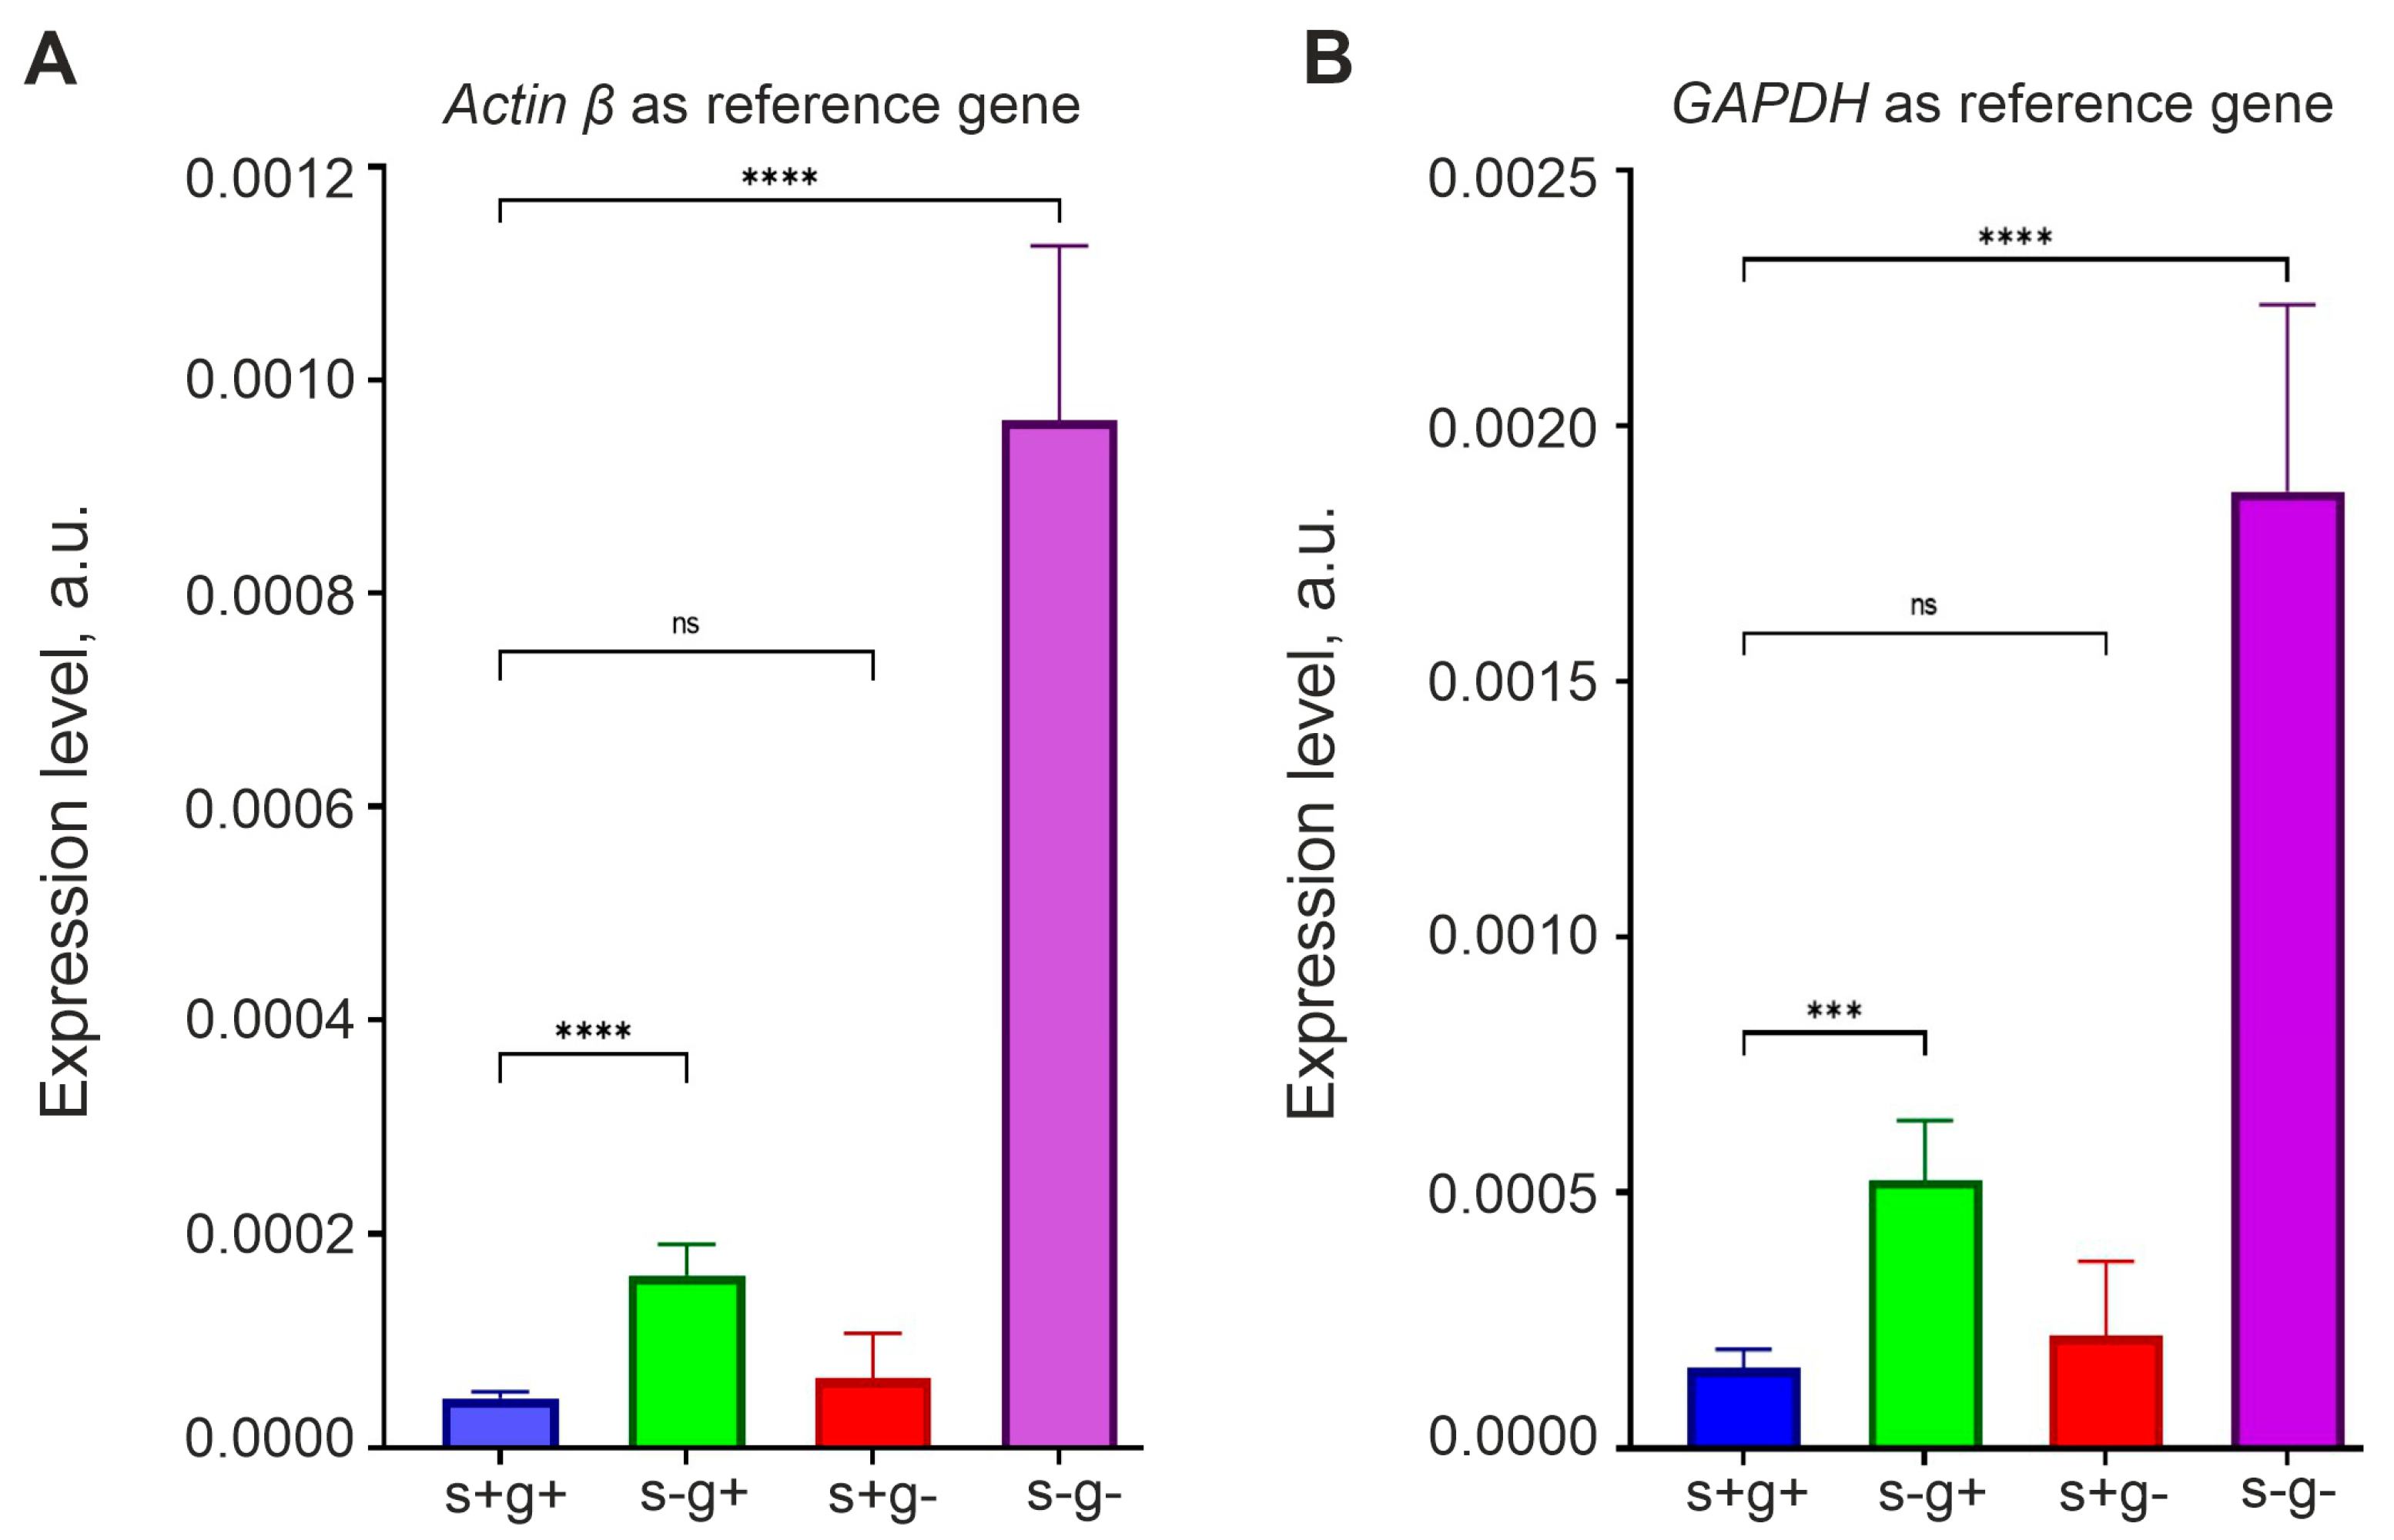
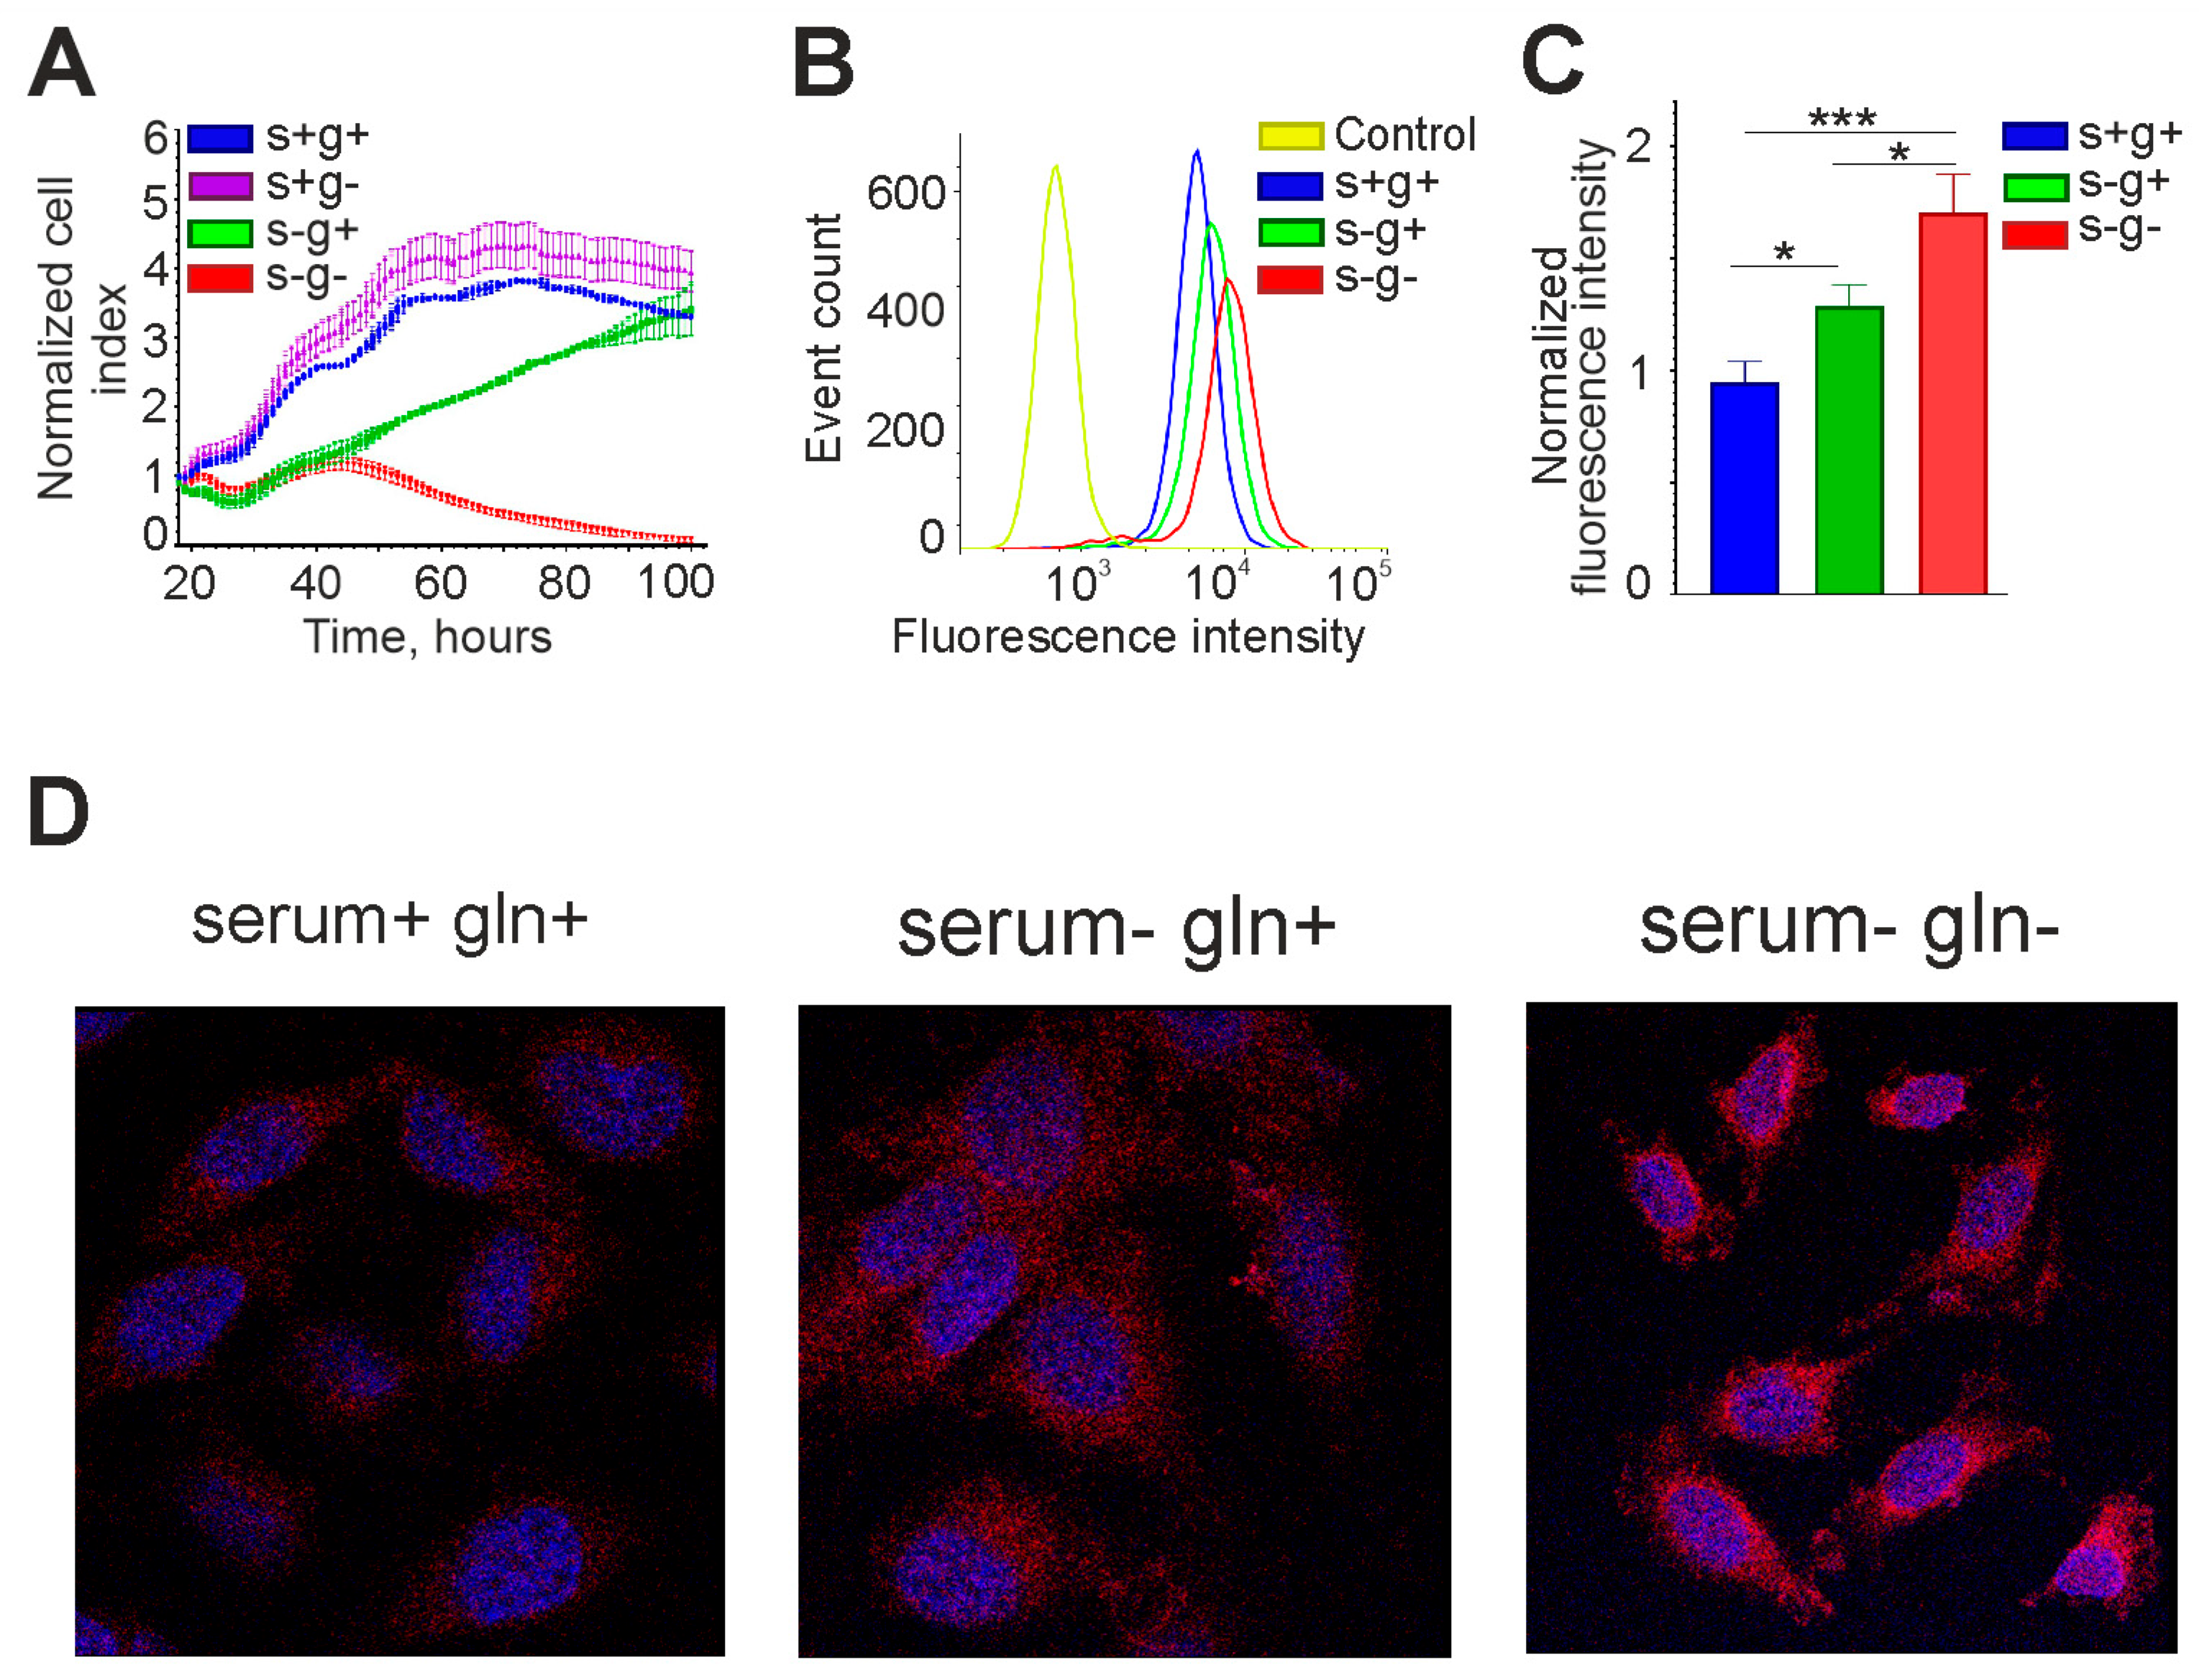
3.6. Expression of OCT4 Increases in Glioma Cells Incubated in Medium without Serum and L-Glutamine

The sources of α-KG are the Krebs cycle and L-glutamine. If OCT4 expression is negatively regulated by α-KG, then it should increase in serum-free and L-glutamine-free medium, since both pathways for the synthesis of this metabolite would be suppressed.
To test this hypothesis, we incubated GCL13 cells for 48 h in medium that did not contain L-glutamine, serum or both. Cells grown in medium with a standard content of L-glutamine (2 mM) and serum (10%) were used as a control. OCT4 expression was measured via real-time RT-PCR using primers for the OCT4A isoform. We used two reference genes, actin β and GAPGH, to show that relative OCT4 mRNA level changes independently of the reference gene to which it is normalized. The results are presented as histograms in Figure 7. The figure shows that serum deprivation (with a slow Krebs cycle!) for 48 h led to a significant increase in OCT4 mRNA levels, and this effect was enhanced in medium without serum and L-glutamine. In addition, the result did not depend on the choice of the reference gene.
Interestingly, in medium with 10% serum without L-glutamine, the OCT4 mRNA level was the same as in the control. L-glutamine is essential for nucleic acid synthesis and cell proliferation, so if it is not available in the environment, it can be synthesized from mitochondrial α-KG, which passes into the cytoplasm [30,31]. In our experiments, cells could not grow long in medium without serum and L-glutamine, whereas in the presence of serum their growth rate was almost the same as in the control (Figure 8A). Thus, L-glutamine was either contained in serum or synthesized from α-KG produced in the Krebs cycle. It is also interesting to note that in the serum-free medium with L-glutamine, cell growth slowed down relative to the control, but did not stop, indicating autocrine regulation (Figure 8A).
The effect of lack of serum and glutamine in the culture medium on OCT4A protein level was also tested. Flow cytometry and confocal microscopy data are presented in Figure 8. OCT4A protein level was increased in serum-free medium, and this effect was further enhanced in serum-free and L-glutamine-free medium, confirming the real-time RT-PCR data.

4. Discussion

OCT4 expression was detected in almost all malignant gliomas of adult patients [13,14,18,19] and 12.5% of pediatric diffuse intrinsic pontine gliomas (DIPGs) [16] but was not found in normal brain tissue [13,19]. The fraction of cells containing OCT4 and its expression level were significantly higher in high-grade gliomas than in low-grade gliomas [13,14,15,17,18,19]. The OCT4 protein was localized predominantly in the nucleus [13,17] but could also be present in the cytoplasm of cells [14,19] and was often detected together with other stem cell markers, for example, SOX2 [14,15,18]. In glioblastomas, an increase in OCT4 protein levels was observed in blood vessels but not in necrotic areas and pseudopalisade cells [19]. In WHO grade III astrocytomas with the R132H mutation in IDH1, OCT4 expression levels were on average higher than in wild-type gliomas and were associated with a worse patient prognosis [19]. OCT4 has been shown to enhance SOX2 expression by forming a complex with SOX4 at its enhancer [32]. Knockdown of OCT4 reduced cell proliferation and their ability to form spheres or tumors in the brains of immunodeficient mice increased sensitivity to temozolomide but did not induce apoptosis [32]. Exogenous expression of OCT4 in glioblastoma cells significantly enhanced their motility and invasion. At the same time, there was a change in the expression profile of integrins and an increase in focal cell adhesion, as well as the expression and activity of the matrix metalloprotease MMP-13 [33].
In accordance with previously obtained data, we found OCT4 expression in all studied glioma lines but not in normal adult brain tissue. In almost all lines, OCT4 RNA was represented by both the OCT4A isoform, which encodes a transcription factor, and the OCT4B isoform, which is not associated with transcription regulation. At the same time, in contrast to the data of other researchers, the OCT4A protein was mainly present in the cytoplasm and significantly less in the nuclei of glioma cells. The antibodies and staining procedure were tested using the teratocarcinoma model line PA-1, where this protein was detected exclusively in the nuclei. It is possible that gliomas have a mechanism that keeps OCT4A outside the nucleus and thereby limits its activity as a transcription factor. Our discrepancies with previous data may be due to different cell growth conditions. Most studies used paraffin sections of tumors [14,19] or primary cultures initially growing as spheres in serum-free medium supplemented with growth factors EGF and FGF-2 [23,32], whereas our primary cultures grew as a monolayer in medium containing 10% serum. Interestingly, OCT4 knockdown carried out under these conditions led to cell death in one of our lines, and this result is new for gliomas. Thus, this protein is functionally significant in gliomas and may be required for tumor cell survival. The GCL13 line (also called as Gl-Tr [34]) we obtained will serve as a model for further studying the function of OCT4 in gliomas.
Previous data indicate that OCT4 expression and its transcriptional activity are associated with the tumor-initiating cell population. For example, OCT4 expression was detected in tumor cells circulating in the blood of patients with glioblastomas, which could repopulate the site of the original tumor after its surgical removal or give rise to new, more aggressive lesions [35]. In another study, U87 MG cells were modified with a construct containing a promoter with a binding motif for the OCT4 and SOX2 complex, a fluorescent reporter and a gene for an enzyme that activates the replication inhibitor ganciclovir and inoculated into the brains of immunodeficient mice. Treatment with ganciclovir significantly increased the survival of mice but could not completely eliminate fluorescence. If treatment was interrupted, tumor growth continued after a certain time, indicating that some tumor-initiating cells remained dormant [36]. However, according to our observations, OCT4A was present in GCL13 cells grown with 10% serum. In contrast to PA-1, all GCL13 cells in the fields selected on the confocal microscope were uniformly stained for OCT4A. Therefore, in gliomas, OCT4 expression alone cannot be a specific marker of tumor-initiating cells.
Serum is often used to culture cells, but even in low concentrations it causes their differentiation. To preserve cell stemness, it is replaced with specially selected combinations of growth factors. In a medium containing the growth factors EGF and FGF-2 instead of serum, glioma cells show increased expression of stemness phenotype markers and can form spheres, just like normal neural stem cells [1]. OCT4 protein levels increased in some glioma lines when cells were transferred from 10% serum to these conditions [24]. In another study, freshly resected glioblastoma multiforme cells were grown in a special serum-free medium supplemented with EGF and FGF-2 or PDGFA alone. Expression of OCT4 and other stem cell markers appeared only after 48 h. Cells lost OCT4 and NANOG expression and the ability to form spheres when the activity of these growth factor receptors, ERK or the transcription factor EGR1 was inhibited [23]. However, according to our data, incubation in serum-free medium itself increased the expression of OCT4, while the growth factors EGF and FGF-2 reduced it to the basal level. This can be explained by a decrease in PI3K/Akt/mTOR activity due to the lack of insulin and other growth factors that stimulate this signaling cascade. It has been shown that in gliomas OCT4 expression is maintained by the transcription factors FOXO1 and FOXO3 and suppressed by PI3K/Akt/mTOR, and its level is significantly enhanced when PI3K is inhibited simultaneously with mTOR or MEK [37]. Interestingly, EGR1 directly activates the expression of the phosphatase PTEN, which inhibits PI3K/Akt/mTOR [38], so the discrepancy between our data and previous work [23] may be resolved by studying the dynamics of the described mechanisms.
In addition, reduced PI3K/Akt/mTOR activity will lead to a slower cell metabolism, including glycolysis and the Krebs cycle. Accordingly, the levels of intermediates involved in these processes should decrease, which we observed for lactic and citric acids using NMR. One of these intermediates is α-KG, which supports the activity of a number of enzymes that regulate gene expression and take part in the metabolic reprogramming of cells. We suggested that a decrease in α-KG levels would cause an increase in OCT4 expression through epigenetic changes. Since the source of this metabolite is not only the Krebs cycle but also L-glutamine, the simultaneous suppression of both pathways of α-KG synthesis should have significantly enhanced the effect. Using medium without serum and L-glutamine, we indeed observed a significant increase in OCT4 expression in both RNA and protein, consistent with our hypothesis. Thus, α-KG-dependent cell reprogramming may regulate OCT4 expression in gliomas, but the enzymes and epigenetic modifications that are involved in this process remain to be elucidated.

5. Conclusions

Taken together, our data confirm that OCT4 expression is present in malignant gliomas but is absent in normal adult brain tissue. In addition, we show for the first time that OCT4 may be required for glioma cell survival. The increase in OCT4 expression in serum-free and L-glutamine-free medium indicates that this process is regulated by metabolic reprogramming systems that remain to be identified.

Supplementary Materials

The following supporting information can be downloaded at: https://www.mdpi.com/article/10.3390/cimb46020070/s1. Figure S1. Detection of Oct4A protein in glioma cells by confocal microscopy. The cells of some glioma cell lines (GCL13, GCL16, GCL12, GCL15) were immunostained with antibodies for oct4A (red) and stained with DAPY (blue). Primary monoclonal mouse antibodies to oct4A (BD Pharmingen) and then secondary goat antibodies to mouse antibodies labeled with Alexa594 (Invitrogen, Waltham, MA, USA) were used.

Author Contributions

Conceptualization, A.V., M.F. and T.S.; methodology, A.V., M.F., K.S., R.P., E.V., T.S. and R.K.; validation, A.V., K.S., R.P., E.V., R.K., V.B., S.E., M.S. and A.Y.; formal analysis, L.G., A.V. and K.S.; investigation, A.V., K.S., R.P., E.V., R.K., V.B., S.E., M.S. and A.Y.; resources, M.F. and A.L.K.; data curation, A.V. and L.G.; writing—original draft preparation, A.V.; writing—review and editing, A.V., T.S. and R.K.; visualization, A.V., L.G. and T.S.; supervision, M.F. and T.S.; project administration, A.L.K.; funding acquisition, A.L.K. All authors have read and agreed to the published version of the manuscript.

Funding

This work was carried out with the support of the Ministry of Science and Higher Education of the Russian Federation (project 075-15-2021-1360) and within the framework of the state assignment of NRC “Kurchatov Institute”-PNPI.

Institutional Review Board Statement

Not applicable.

Informed Consent Statement

Not applicable.

Data Availability Statement

All data generated or analyzed during this study are included in this published article and its Supplementary Information Files.

Acknowledgments

The authors would like to thank Natalia Feodorova and Yury Kil for helpful discussion and also Elena Semina for technical assistance. A.V. sincerely thanks his mother Irina S Volnitskaya and grandmother Nina M. Stankevich for their care and moral support.

Conflicts of Interest

The authors declare no conflicts of interest.

References

  1. Ignatova, T.N.; Kukekov, V.G.; Laywell, E.D.; Suslov, O.N.; Vrionis, F.D.; Steindler, D.A. Human cortical glial tumors contain neural stem-like cells expressing astroglial and neuronal markers in vitro. Glia 2002, 39, 193–206. [Google Scholar] [CrossRef]
  2. Hemmati, H.D.; Nakano, I.; Lazareff, J.A.; Masterman-Smith, M.; Geschwind, D.H.; Bronner-Fraser, M.; Kornblum, H.I. Cancerous stem cells can arise from pediatric brain tumors. Proc. Natl. Acad. Sci. USA 2003, 100, 15178–15183. [Google Scholar] [CrossRef]
  3. Galli, R.; Binda, E.; Orfanelli, U.; Cipelletti, B.; Gritti, A.; De Vitis, S.; Fiocco, R.; Foroni, C.; Dimeco, F.; Vescovi, A. Isolation and characterization of tumorigenic, stem-like neural precursors from human glioblastoma. Cancer Res. 2004, 64, 7011–7021. [Google Scholar] [CrossRef]
  4. Singh, S.K.; Hawkins, C.; Clarke, I.D.; Squire, J.A.; Bayani, J.; Hide, T.; Henkelman, R.M.; Cusimano, M.D.; Dirks, P.B. Identification of human brain tumour initiating cells. Nature 2004, 432, 396–401. [Google Scholar] [CrossRef]
  5. Bakhmet, E.I.; Tomilin, A.N. Key features of the POU transcription factor Oct4 from an evolutionary perspective. Cell Mol. Life Sci. 2021, 78, 7339–7353. [Google Scholar] [CrossRef] [PubMed]
  6. Michael, A.K.; Grand, R.S.; Isbel, L.; Cavadini, S.; Kozicka, Z.; Kempf, G.; Bunker, R.D.; Schenk, A.D.; Graff-Meyer, A.; Pathare, G.R.; et al. Mechanisms of OCT4-SOX2 motif readout on nucleosomes. Science 2020, 368, 1460–1465. [Google Scholar] [CrossRef] [PubMed]
  7. Rizzino, A.; Wuebben, E.L. Sox2/Oct4: A delicately balanced partnership in pluripotent stem cells and embryogenesis. Biochim. Biophys. Acta. 2016, 1859, 780–791. [Google Scholar] [CrossRef]
  8. Takahashi, K.; Tanabe, K.; Ohnuki, M.; Narita, M.; Ichisaka, T.; Tomoda, K.; Yamanaka, S. Induction of pluripotent stem cells from adult human fibroblasts by defined factors. Cell 2007, 131, 861–872. [Google Scholar] [CrossRef]
  9. Yu, J.; Vodyanik, M.A.; Smuga-Otto, K.; Antosiewicz-Bourget, J.; Frane, J.L.; Tian, S.; Nie, J.; Jonsdottir, G.A.; Ruotti, V.; Stewart, R.; et al. Induced pluripotent stem cell lines derived from human somatic cells. Science 2007, 318, 1917–1920. [Google Scholar] [CrossRef] [PubMed]
  10. Kim, J.B.; Greber, B.; Araúzo-Bravo, M.J.; Meyer, J.; Park, K.I.; Zaehres, H.; Schöler, H.R. Direct reprogramming of human neural stem cells by OCT4. Nature 2009, 461, 649–653. [Google Scholar] [CrossRef]
  11. Noisa, P.; Ramasamy, T.S.; Lamont, F.R.; Yu, J.S.; Sheldon, M.J.; Russell, A.; Jin, X.; Cui, W. Identification and characterisation of the early differentiating cells in neural differentiation of human embryonic stem cells. PLoS ONE 2012, 7, e37129. [Google Scholar] [CrossRef]
  12. Ben-Porath, I.; Thomson, M.W.; Carey, V.J.; Ge, R.; Bell, G.W.; Regev, A.; Weinberg, R.A. An embryonic stem cell-like gene expression signature in poorly differentiated aggressive human tumors. Nat. Genet. 2008, 40, 499–507. [Google Scholar] [CrossRef]
  13. Du, Z.; Jia, D.; Liu, S.; Wang, F.; Li, G.; Zhang, Y.; Cao, X.; Ling, E.A.; Hao, A. Oct4 is expressed in human gliomas and promotes colony formation in glioma cells. Glia 2009, 57, 724–733. [Google Scholar] [CrossRef] [PubMed]
  14. Guo, Y.; Liu, S.; Wang, P.; Zhao, S.; Wang, F.; Bing, L.; Zhang, Y.; Ling, E.A.; Gao, J.; Hao, A. Expression profile of embryonic stem cell-associated genes Oct4, Sox2 and Nanog in human gliomas. Histopathology 2011, 59, 763–775. [Google Scholar] [CrossRef]
  15. Holmberg, J.; He, X.; Peredo, I.; Orrego, A.; Hesselager, G.; Ericsson, C.; Hovatta, O.; Oba-Shinjo, S.M.; Marie, S.K.; Nistér, M.; et al. Activation of neural and pluripotent stem cell signatures correlates with increased malignancy in human glioma. PLoS ONE 2011, 6, e18454. [Google Scholar] [CrossRef] [PubMed]
  16. Ballester, L.Y.; Wang, Z.; Shandilya, S.; Miettinen, M.; Burger, P.C.; Eberhart, C.G.; Rodriguez, F.J.; Raabe, E.; Nazarian, J.; Warren, K.; et al. Morphologic characteristics and immunohistochemical profile of diffuse intrinsic pontine gliomas. Am. J. Surg. Pathol. 2013, 37, 1357–1364. [Google Scholar] [CrossRef]
  17. Elsir, T.; Edqvist, P.H.; Carlson, J.; Ribom, D.; Bergqvist, M.; Ekman, S.; Popova, S.N.; Alafuzoff, I.; Ponten, F.; Nistér, M.; et al. A study of embryonic stem cell-related proteins in human astrocytomas: Identification of Nanog as a predictor of survival. Int. J. Cancer 2014, 134, 1123–1131. [Google Scholar] [CrossRef]
  18. Hattermann, K.; Flüh, C.; Engel, D.; Mehdorn, H.M.; Synowitz, M.; Mentlein, R.; Held-Feindt, J. Stem cell markers in glioma progression and recurrence. Int. J. Oncol. 2016, 49, 1899–1910. [Google Scholar] [CrossRef] [PubMed]
  19. Krogh Petersen, J.; Jensen, P.; Dahl Sørensen, M.; Winther Kristensen, B. Expression and Prognostic Value of Oct-4 in Astrocytic Brain Tumors. PLoS ONE 2016, 11, e0169129. [Google Scholar] [CrossRef]
  20. Volnitskiy, A.; Shtam, T.; Burdakov, V.; Kovalev, R.; Konev, A.; Filatov, M. Abnormal activity of transcription factors gli in high-grade gliomas. PLoS ONE 2019, 14, e0211980. [Google Scholar] [CrossRef]
  21. Reynolds, B.A.; Weiss, S. Generation of neurons and astrocytes from isolated cells of the adult mammalian central nervous system. Science 1992, 255, 1707–1710. [Google Scholar] [CrossRef]
  22. Kukekov, V.G.; Laywell, E.D.; Suslov, O.; Davies, K.; Scheffler, B.; Thomas, L.B.; O’Brien, T.F.; Kusakabe, M.; Steindler, D.A. Multipotent stem/progenitor cells with similar properties arise from two neurogenic regions of adult human brain. Exp. Neurol. 1999, 156, 333–344. [Google Scholar] [CrossRef]
  23. Almairac, F.; Turchi, L.; Sakakini, N.; Debruyne, D.N.; Elkeurti, S.; Gjernes, E.; Polo, B.; Bianchini, L.; Fontaine, D.; Paquis, P.; et al. ERK-Mediated Loss of miR-199a-3p and Induction of EGR1 Act as a “Toggle Switch” of GBM Cell Dedifferentiation into NANOG- and OCT4-Positive Cells. Cancer Res. 2020, 80, 3236–3250. [Google Scholar] [CrossRef]
  24. Balça-Silva, J.; do Carmo, A.; Tão, H.; Rebelo, O.; Barbosa, M.; Moura-Neto, V.; Sarmento-Ribeiro, A.B.; Lopes, M.C.; Moreira, J.N. Nucleolin is expressed in patient-derived samples and glioblastoma cells, enabling improved intracellular drug delivery and cytotoxicity. Exp. Cell Res. 2018, 370, 68–77. [Google Scholar] [CrossRef]
  25. Tahiliani, M.; Koh, K.P.; Shen, Y.; Pastor, W.A.; Bandukwala, H.; Brudno, Y.; Agarwal, S.; Iyer, L.M.; Liu, D.R.; Aravind, L.; et al. Conversion of 5-methylcytosine to 5-hydroxymethylcytosine in mammalian DNA by MLL partner TET1. Science 2009, 324, 930–935. [Google Scholar] [CrossRef] [PubMed]
  26. Xu, W.; Yang, H.; Liu, Y.; Yang, Y.; Wang, P.; Kim, S.H.; Ito, S.; Yang, C.; Wang, P.; Xiao, M.T.; et al. Oncometabolite 2-hydroxyglutarate is a competitive inhibitor of α-ketoglutarate-dependent dioxygenases. Cancer Cell 2011, 19, 17–30. [Google Scholar] [CrossRef] [PubMed]
  27. Parsons, D.W.; Jones, S.; Zhang, X.; Lin, J.C.; Leary, R.J.; Angenendt, P.; Mankoo, P.; Carter, H.; Siu, I.M.; Gallia, G.L.; et al. An integrated genomic analysis of human glioblastoma multiforme. Science 2008, 321, 1807–1812. [Google Scholar] [CrossRef] [PubMed]
  28. Yan, H.; Parsons, D.W.; Jin, G.; McLendon, R.; Rasheed, B.A.; Yuan, W.; Kos, I.; Batinic-Haberle, I.; Jones, S.; Riggins, G.J.; et al. IDH1 and IDH2 mutations in gliomas. N. Engl. J. Med. 2009, 360, 765–773. [Google Scholar] [CrossRef]
  29. Dang, L.; White, D.W.; Gross, S.; Bennett, B.D.; Bittinger, M.A.; Driggers, E.M.; Fantin, V.R.; Jang, H.G.; Jin, S.; Keenan, M.C.; et al. Cancer-associated IDH1 mutations produce 2-hydroxyglutarate. Nature 2009, 462, 739–744. [Google Scholar] [CrossRef]
  30. Cheng, T.; Sudderth, J.; Yang, C.; Mullen, A.R.; Jin, E.S.; Matés, J.M.; DeBerardinis, R.J. Pyruvate carboxylase is required for glutamine-independent growth of tumor cells. Proc. Natl. Acad. Sci. USA 2011, 108, 8674–8679. [Google Scholar] [CrossRef] [PubMed]
  31. Tardito, S.; Oudin, A.; Ahmed, S.U.; Fack, F.; Keunen, O.; Zheng, L.; Miletic, H.; Sakariassen, P.Ø.; Weinstock, A.; Wagner, A.; et al. Glutamine synthetase activity fuels nucleotide biosynthesis and supports growth of glutamine-restricted glioblastoma. Nat. Cell Biol. 2015, 17, 1556–1568. [Google Scholar] [CrossRef]
  32. Ikushima, H.; Todo, T.; Ino, Y.; Takahashi, M.; Saito, N.; Miyazawa, K.; Miyazono, K. Glioma-initiating cells retain their tumorigenicity through integration of the Sox axis and Oct4 protein. J. Biol. Chem. 2011, 286, 41434–41441. [Google Scholar] [CrossRef] [PubMed]
  33. Kobayashi, K.; Takahashi, H.; Inoue, A.; Harada, H.; Toshimori, S.; Kobayashi, Y.; Goto, K.; Sugimoto, K.; Yano, H.; Ohnishi, T.; et al. Oct-3/4 promotes migration and invasion of glioblastoma cells. J. Cell Biochem. 2012, 113, 508–517. [Google Scholar] [CrossRef]
  34. Naryzhny, S.; Volnitskiy, A.; Kopylov, A.; Zorina, E.; Kamyshinsky, R.; Bairamukov, V.; Garaeva, L.; Shlikht, A.; Shtam, T. Proteome of Glioblastoma-Derived Exosomes as a Source of Biomarkers. Biomedicines 2020, 8, 216. [Google Scholar] [CrossRef] [PubMed]
  35. Liu, T.; Xu, H.; Huang, M.; Ma, W.; Saxena, D.; Lustig, R.A.; Alonso-Basanta, M.; Zhang, Z.; O’Rourke, D.M.; Zhang, L.; et al. Circulating Glioma Cells Exhibit Stem Cell-like Properties. Cancer Res. 2018, 78, 6632–6642. [Google Scholar] [CrossRef] [PubMed]
  36. Guerra-Rebollo, M.; Garrido, C.; Sánchez-Cid, L.; Soler-Botija, C.; Meca-Cortés, O.; Rubio, N.; Blanco, J. Targeting of replicating CD133 and OCT4/SOX2 expressing glioma stem cells selects a cell population that reinitiates tumors upon release of therapeutic pressure. Sci. Rep. 2019, 9, 9549. [Google Scholar] [CrossRef]
  37. Martinez, E.; Vazquez, N.; Lopez, A.; Fanniel, V.; Sanchez, L.; Marks, R.; Hinojosa, L.; Cuello, V.; Cuevas, M.; Rodriguez, A.; et al. The PI3K pathway impacts stem gene expression in a set of glioblastoma cell lines. J. Cancer Res. Clin. Oncol. 2020, 146, 593–604. [Google Scholar] [CrossRef]
  38. Virolle, T.; Adamson, E.D.; Baron, V.; Birle, D.; Mercola, D.; Mustelin, T.; de Belle, I. The Egr-1 transcription factor directly activates PTEN during irradiation-induced signalling. Nat. Cell Biol. 2001, 3, 1124–1128. [Google Scholar] [CrossRef]
Figure 1. Expression of OCT4 in glioma cell lines and normal adult brain tissue. OCT4 mRNA is represented by isoforms OCT4A and OCT4B, and its levels are normalized to that of GAPDH. GCL2 and GCL13 correspond to numbers 2 and 13 on the histogram.
Cimb 46 00070 g001
Figure 2. Knockdown of OCT4 in GCL13 cells: (A) images of wells with cells stained with crystal violet after incubation with siRNA for 72 h and reseeding; (B) cell survival assessed by MTS fluorescence or cell layer area stained with crystal violet. The significance of differences between groups was determined using the Mann–Whitney U test: **** p < 0.00005. All experiments were performed at least three times.
Cimb 46 00070 g002
Figure 3. Detection of OCT4A protein in PA-1 cells. (A) Flow cytometry: control—here and further, incubation without antibodies; fl-fl+—incubation first with unlabeled and then with fluorescently labeled antibodies to OCT4; fl+—incubation only with fluorescently labeled antibodies to OCT4. (B) Confocal microscopy: here and further, blue—DAPI; red—OCT4A.
Cimb 46 00070 g003
Figure 4. The level of OCT4A protein in glioma cells depends on their growth conditions. Flow cytometry (A,B) and confocal microscopy (C) are performed on GCL13 cells incubated with 10% serum (serum+), no serum (serum-), growth factors EGF and FGF-2 (EGF+FGF-2), or PDGF BB alone (PDGF BB) for 48 h. Panel (B) shows the average fluorescence intensity. The significance of differences between groups was determined via a one-way ANOVA followed by a Tukey’s HSD test: **** p < 0.00005, ns—nonsignificant (p > 0.05). All experiments were performed at least three times.
Cimb 46 00070 g004
Figure 5. Cell metabolism is slowed in the absence of serum. The graphs in panels (AC) show how the levels of glucose, lactic acid and citric acid in condensed medium with 10% serum (serum+) or without serum (serum-) changed during the week.
Cimb 46 00070 g005
Figure 6. Sequences of regions of the IDH1 and IDH2 genes containing hot spots for GCL13. Hotspot triplets corresponding to conserved arginine residues that can be replaced are outlined in red.
Cimb 46 00070 g006
Figure 7. Serum and L-glutamine deprivation enhances OCT4 expression in glioma cells. RT-PCR was performed on GCL13 cells incubated for 48 h in medium with serum and L-glutamine (s+g+), without serum (s-g+) or L-glutamine (s+g-) or both (s-g-). OCT4 mRNA levels are normalized to that of actin β (A) or GAPDH (B). The significance of differences between groups was determined via a one-way ANOVA followed by a Tukey’s HSD test: ns—p > 0.05—no statistical difference, *** p < 0.0005, **** p < 0.00005. All experiments were performed at least three times.
Cimb 46 00070 g007
Figure 8. The OCT4A protein level in glioma cells increases upon serum and L-glutamine deprivation. (A) Growth curves of GCL13 cells incubated for 3 days in medium with serum and L-glutamine (s+g+), without serum (s-g+), L-glutamine (s+g-), or both (s-g-). The selected fragments of the curves correspond to registration for 3 days. (B,C) Flow cytometry was performed on GCL13 cells incubated for 48 h in medium with serum (s+g+), without serum (s-g+), or without serum and L-glutamine (s-g-). Panel (C) shows the average fluorescence intensity. The significance of differences between groups was determined by one-way ANOVA followed by Tukey’s HSD test: * p < 0.05, *** p < 0.0005. All experiments were performed at least three times. (D) Confocal microscopy was performed on GCL13 cells incubated for 48 h in medium with serum (serum+ gln+), without serum (serum- gln+), or without serum and L-glutamine (serum- gln-).
Cimb 46 00070 g008
Table 1. Primers and fluorescently labeled probes.
Forward PrimerReverse PrimerProbe (FAM-BHQ1)
Analysis of oct4 expression in gliomas and norm
OCT4Aaagctggagaaggagaagctcagatggtcgtttggctgaaactcgagcaatttgccaagctc
OCT4Bgttcttacaagtcttctgcctcagatggtcgtttggctgaaactcgagcaatttgccaagctc
GAPDHcatgggtgtgaaccatgagaaggtcatgagtccttccacgataacagcctcaagatcatcagcaatgcct
Serum and L-glutamine deprivation
OCT4Aaagctggagaaggagaagctcagatggtcgtttggctgaaactcgagcaatttgccaagctcc
actin βatgcagaaggagatcactgcatactcctgcttgctgatccatcattgctcctcctgagcgcaa
GAPDHtcatgggtgtgaaccatgagatggcatggactgtggtcatgatcatcagcaatgcctcctgca
Table 2. Sequencing primers.
Forward PrimerReverse PrimerFragment Length
IDH1gagaatcgtgatgccaccaattggaaatttctgggccatga340 bp
IDH2tctggctgtgttgttgcttgagagacaagaggatggctag325 bp
Disclaimer/Publisher’s Note: The statements, opinions and data contained in all publications are solely those of the individual author(s) and contributor(s) and not of MDPI and/or the editor(s). MDPI and/or the editor(s) disclaim responsibility for any injury to people or property resulting from any ideas, methods, instructions or products referred to in the content.

