
mtDNA Single-Nucleotide Variants Associated with Type 2 Diabetes
 , , , , , , , ,
Abstract
1. Introduction
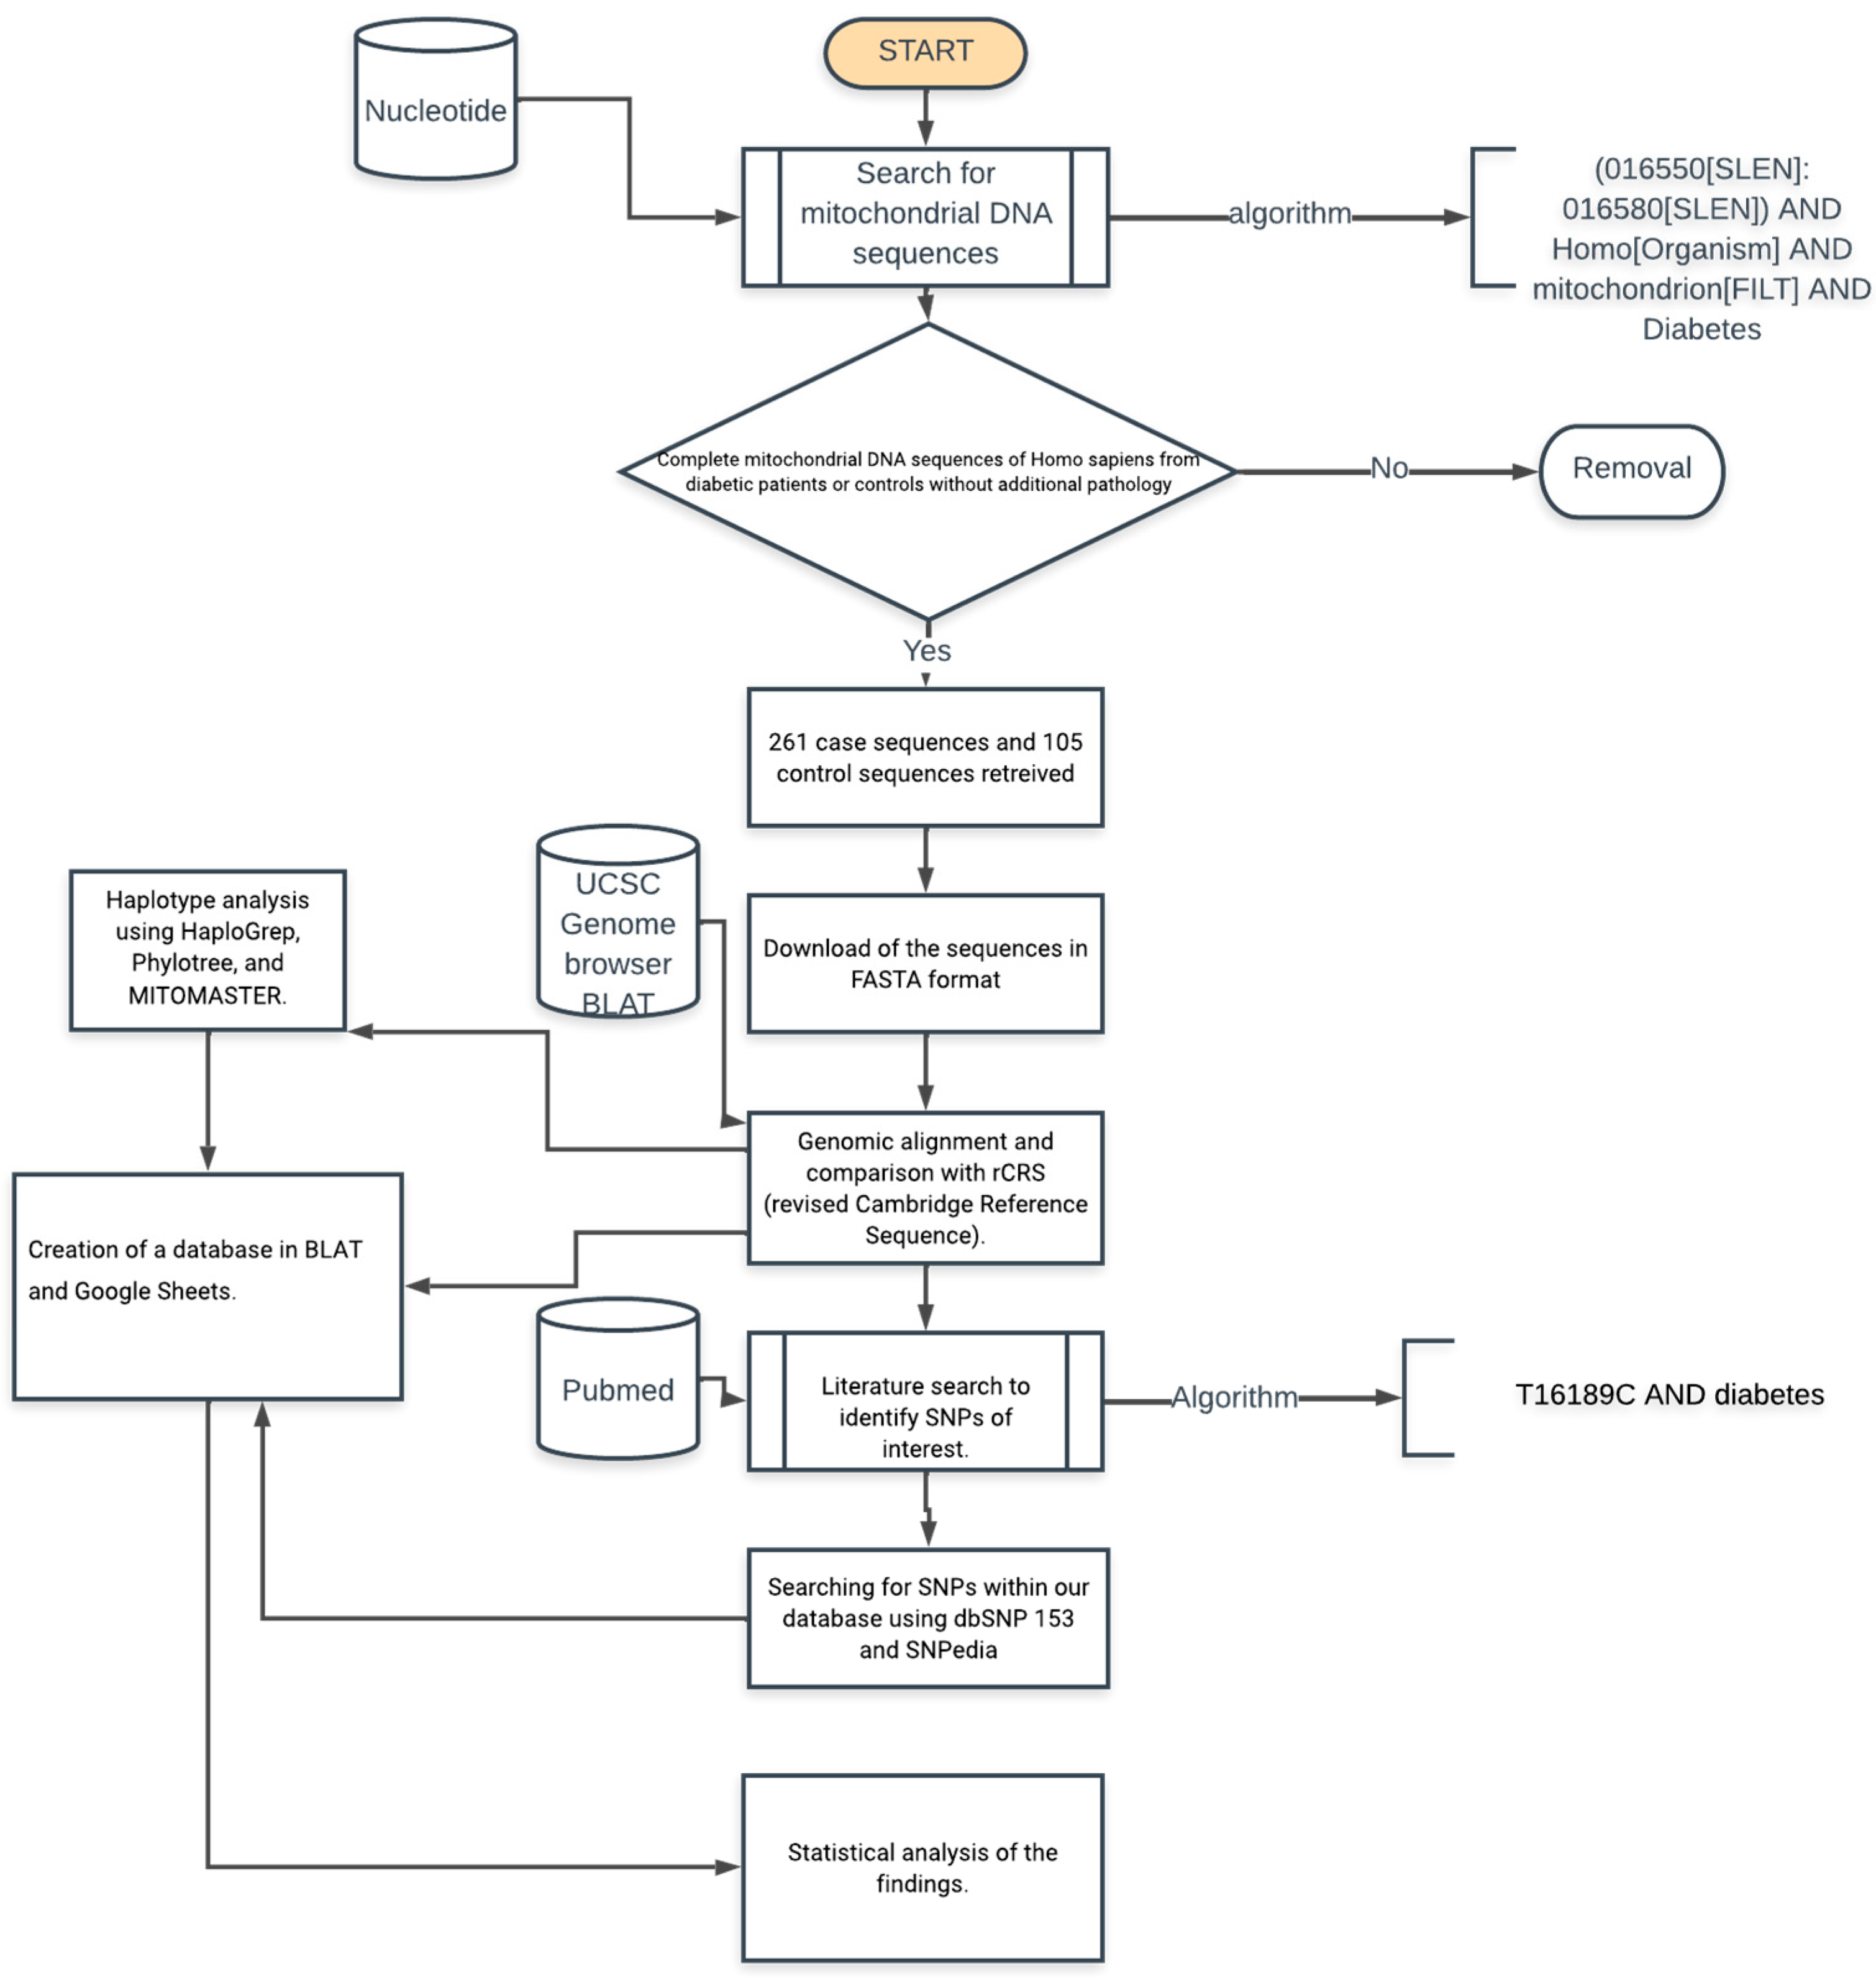
2. Materials and Methods
3. Results
4. Discussion
5. Conclusions
Limitations
Supplementary Materials
Author Contributions
Funding
Data Availability Statement
Acknowledgments
Conflicts of Interest
References
- Liu, J.; Ren, Z.-H.; Qiang, H.; Wu, J.; Shen, M.; Zhang, L.; Lyu, J. Trends in the incidence of diabetes mellitus: Results from the Global Burden of Disease Study 2017 and implications for diabetes mellitus prevention. BMC Public Health 2020, 20, 1415. [Google Scholar] [CrossRef] [PubMed]
- Zhou, B.; Lu, Y.; Hajifathalian, K.; Bentham, J.; Cesare, M.D.; Danaei, G.; Bixby, H.; Cowan, M.J.; Ali, M.K.; Taddei, C.; et al. Worldwide trends in diabetes since 1980: A pooled analysis of 751 population-based studies with 4·4 million participants. Lancet 2016, 387, 1513–1530. [Google Scholar] [CrossRef]
- Cousin, E.; Schmidt, M.I.; Ong, K.L.; Lozano, R.; Afshin, A.; Abushouk, A.I.; Agarwal, G.; Agudelo-Botero, M.; Al-Aly, Z.; Alcalde-Rabanal, J.E.; et al. Burden of diabetes and hyperglycaemia in adults in the Americas, 1990–2019: A systematic analysis for the Global Burden of Disease Study 2019. Lancet Diabetes Endocrinol. 2022, 10, 655–667. [Google Scholar] [CrossRef] [PubMed]
- Lin, X.; Xu, Y.; Pan, X.; Xu, J.; Ding, Y.; Sun, X.; Song, X.; Ren, Y.; Shan, P.-F. Global, regional, and national burden and trend of diabetes in 195 countries and territories: An analysis from 1990 to 2025. Sci. Rep. 2020, 10, 14790. [Google Scholar] [CrossRef]
- Prasad, R.B.; Groop, L. Genetics of Type 2 Diabetes—Pitfalls and Possibilities. Genes 2015, 6, 87. [Google Scholar] [CrossRef] [PubMed]
- Cooper, A.J.; Gupta, S.R.; Moustafa, A.F.; Chao, A.M. Sex/Gender Differences in Obesity Prevalence, Comorbidities, and Treatment. Curr. Obes. Rep. 2021, 10, 458–466. [Google Scholar] [CrossRef]
- Kautzky-Willer, A.; Harreiter, J.; Pacini, G. Sex and Gender Differences in Risk, Pathophysiology and Complications of Type 2 Diabetes Mellitus. Endocr. Rev. 2016, 37, 278–316. [Google Scholar] [CrossRef]
- Chen, Z.-Z.; Gerszten, R.E. Metabolomics and Proteomics in Type 2 Diabetes. Circ. Res. 2020, 126, 1613–1627. [Google Scholar] [CrossRef]
- Sangwung, P.; Petersen, K.F.; Shulman, G.I.; Knowles, J.W. Mitochondrial Dysfunction, Insulin Resistance, and Potential Genetic Implications. Endocrinology 2020, 161, bqaa017. [Google Scholar] [CrossRef]
- Højlund, K.; Beck-Nielsen, H. Impaired glycogen synthase activity and mitochondrial dysfunction in skeletal muscle: Markers or mediators of insulin resistance in type 2 diabetes? Curr. Diabetes Rev. 2006, 2, 375–395. [Google Scholar] [CrossRef]
- Højlund, K.; Mogensen, M.; Sahlin, K.; Beck-Nielsen, H. Mitochondrial dysfunction in type 2 diabetes and obesity. Endocrinol. Metab. Clin. N. Am. 2008, 37, 713–731. [Google Scholar] [CrossRef]
- Ahmad, E.; Lim, S.; Lamptey, R.; Webb, D.R.; Davies, M.J. Type 2 diabetes. Lancet 2022, 400, 1803–1820. [Google Scholar] [CrossRef] [PubMed]
- Langenberg, C.; Lotta, L.A. Genomic insights into the causes of type 2 diabetes. Lancet 2018, 391, 2463–2474. [Google Scholar] [CrossRef] [PubMed]
- Kronenberg, F.; Eckardt, K.-U. Mitochondrial DNA and Kidney Function. Clin. J. Am. Soc. Nephrol. 2022, 17, 942–944. [Google Scholar] [CrossRef]
- Li, J.; Jiang, R.; Cong, X.; Zhao, Y. UCP2 gene polymorphisms in obesity and diabetes, and the role of UCP2 in cancer. FEBS Lett. 2019, 593, 2525–2534. [Google Scholar] [CrossRef]
- Martín-Jiménez, R.; Lurette, O.; Hebert-Chatelain, E. Damage in Mitochondrial DNA Associated with Parkinson’s Disease. DNA Cell Biol. 2020, 39, 1421–1430. [Google Scholar] [CrossRef]
- Swan, E.J.; Salem, R.M.; Sandholm, N.; Tarnow, L.; Rossing, P.; Lajer, M.; Groop, P.H.; Maxwell, A.P.; McKnight, A.J. Genetic risk factors affecting mitochondrial function are associated with kidney disease in people with Type 1 diabetes. Diabet. Med. 2015, 32, 1104–1109. [Google Scholar] [CrossRef]
- Wu, H.-M.; Li, T.; Wang, Z.-F.; Huang, S.-S.; Shao, Z.-Q.; Wang, K.; Zhong, H.-Q.; Chen, S.-F.; Zhang, X.; Zhu, J.-H. Mitochondrial DNA variants modulate genetic susceptibility to Parkinson’s disease in Han Chinese. Neurobiol. Dis. 2018, 114, 17–23. [Google Scholar] [CrossRef]
- Lightowlers, R.N.; Chinnery, P.F.; Turnbull, D.M.; Howell, N. Mammalian mitochondrial genetics: Heredity, heteroplasmy and disease. Trends Genet. 1997, 13, 450–455. [Google Scholar] [CrossRef]
- Naue, J.; Hörer, S.; Sänger, T.; Strobl, C.; Hatzer-Grubwieser, P.; Parson, W.; Lutz-Bonengel, S. Evidence for frequent and tissue-specific sequence heteroplasmy in human mitochondrial DNA. Mitochondrion 2015, 20, 82–94. [Google Scholar] [CrossRef]
- Fex, M.; Nicholas, L.M.; Vishnu, N.; Medina, A.; Sharoyko, V.V.; Nicholls, D.G.; Spégel, P.; Mulder, H. The pathogenetic role of β-cell mitochondria in type 2 diabetes. J. Endocrinol. 2018, 236, R145–R159. [Google Scholar] [CrossRef] [PubMed]
- Kwak, S.H.; Park, K.S.; Lee, K.-U.; Lee, H.K. Mitochondrial metabolism and diabetes. J. Diabetes Investig. 2010, 1, 161–169. [Google Scholar] [CrossRef] [PubMed]
- Weksler-Zangen, S. Is Type 2 Diabetes a Primary Mitochondrial Disorder? Cells 2022, 11, 1617. [Google Scholar] [CrossRef] [PubMed]
- Mulder, H. Transcribing β-cell mitochondria in health and disease. Mol. Metab. 2017, 6, 1040–1051. [Google Scholar] [CrossRef] [PubMed]
- Guo, L.-J.; Oshida, Y.; Fuku, N.; Takeyasu, T.; Fujita, Y.; Kurata, M.; Sato, Y.; Ito, M.; Tanaka, M. Mitochondrial genome polymorphisms associated with type-2 diabetes or obesity. Mitochondrion 2005, 5, 15–33. [Google Scholar] [CrossRef] [PubMed]
- Li, C.; Xiang, Y.; Zhang, Y.; Tang, D.; Chen, Y.; Xue, W.; Wang, X.; Chen, J.; Dai, Y. A preliminary analysis of mitochondrial DNA atlas in the type 2 diabetes patients. Int. J. Diabetes Dev. Ctries. 2022, 42, 713–720. [Google Scholar] [CrossRef]
- Liao, W.-Q.; Pang, Y.; Yu, C.-A.; Wen, J.-Y.; Zhang, Y.-G.; Li, X.-H. Novel mutations of mitochondrial DNA associated with type 2 diabetes in Chinese Han population. Tohoku J. Exp. Med. 2008, 215, 377–384. [Google Scholar] [CrossRef]
- Sikhayeva, N.; Iskakova, A.; Saigi-Morgui, N.; Zholdybaeva, E.; Eap, C.-B.; Ramanculov, E. Association between 28 single nucleotide polymorphisms and type 2 diabetes mellitus in the Kazakh population: A case-control study. BMC Med. Genet. 2017, 18, 76. [Google Scholar] [CrossRef]
- Dela, F.; Helge, J.W. Insulin resistance and mitochondrial function in skeletal muscle. Int. J. Biochem. Cell Biol. 2013, 45, 11–15. [Google Scholar] [CrossRef]
- Hesselink, M.K.C.; Schrauwen-Hinderling, V.; Schrauwen, P. Skeletal muscle mitochondria as a target to prevent or treat type 2 diabetes mellitus. Nat. Rev. Endocrinol. 2016, 12, 633–645. [Google Scholar] [CrossRef]
- Floris, M.; Sanna, D.; Castiglia, P.; Putzu, C.; Sanna, V.; Pazzola, A.; De Miglio, M.R.; Sanges, F.; Pira, G.; Azara, A.; et al. MTHFR, XRCC1 and OGG1 genetic polymorphisms in breast cancer: A case-control study in a population from North Sardinia. BMC Cancer 2020, 20, 234. [Google Scholar] [CrossRef]
- Morino, K.; Petersen, K.F.; Shulman, G.I. Molecular Mechanisms of Insulin Resistance in Humans and Their Potential Links With Mitochondrial Dysfunction. Diabetes 2006, 55 (Suppl. 2), S9–S15. [Google Scholar] [CrossRef] [PubMed]
- Petersen, K.F.; Befroy, D.; Dufour, S.; Dziura, J.; Ariyan, C.; Rothman, D.L.; DiPietro, L.; Cline, G.W.; Shulman, G.I. Mitochondrial Dysfunction in the Elderly: Possible Role in Insulin Resistance. Science 2003, 300, 1140–1142. [Google Scholar] [CrossRef] [PubMed]
- Kelley, D.E.; He, J.; Menshikova, E.V.; Ritov, V.B. Dysfunction of Mitochondria in Human Skeletal Muscle in Type 2 Diabetes. Diabetes 2002, 51, 2944–2950. [Google Scholar] [CrossRef]
- Kruszynska, Y.T.; Mulford, M.I.; Baloga, J.; Yu, J.G.; Olefsky, J.M. Regulation of skeletal muscle hexokinase II by insulin in nondiabetic and NIDDM subjects. Diabetes 1998, 47, 1107–1113. [Google Scholar] [CrossRef] [PubMed]
- He, J.; Watkins, S.; Kelley, D.E. Skeletal Muscle Lipid Content and Oxidative Enzyme Activity in Relation to Muscle Fiber Type in Type 2 Diabetes and Obesity. Diabetes 2001, 50, 817–823. [Google Scholar] [CrossRef]
- Befroy, D.E.; Petersen, K.F.; Dufour, S.; Mason, G.F.; de Graaf, R.A.; Rothman, D.L.; Shulman, G.I. Impaired mitochondrial substrate oxidation in muscle of insulin-resistant offspring of type 2 diabetic patients. Diabetes 2007, 56, 1376–1381. [Google Scholar] [CrossRef]
- Morino, K.; Petersen, K.F.; Dufour, S.; Befroy, D.; Frattini, J.; Shatzkes, N.; Neschen, S.; White, M.F.; Bilz, S.; Sono, S.; et al. Reduced mitochondrial density and increased IRS-1 serine phosphorylation in muscle of insulin-resistant offspring of type 2 diabetic parents. J. Clin. Investig. 2005, 115, 3587–3593. [Google Scholar] [CrossRef]
- Petersen, K.F.; Dufour, S.; Befroy, D.; Garcia, R.; Shulman, G.I. Impaired mitochondrial activity in the insulin-resistant offspring of patients with type 2 diabetes. N. Engl. J. Med. 2004, 350, 664–671. [Google Scholar] [CrossRef]
- Ritov, V.B.; Menshikova, E.V.; He, J.; Ferrell, R.E.; Goodpaster, B.H.; Kelley, D.E. Deficiency of subsarcolemmal mitochondria in obesity and type 2 diabetes. Diabetes 2005, 54, 8–14. [Google Scholar] [CrossRef]
- Mogensen, M.; Sahlin, K.; Fernström, M.; Glintborg, D.; Vind, B.F.; Beck-Nielsen, H.; Højlund, K. Mitochondrial Respiration Is Decreased in Skeletal Muscle of Patients With Type 2 Diabetes. Diabetes 2007, 56, 1592–1599. [Google Scholar] [CrossRef] [PubMed]
- Asmann, Y.W.; Stump, C.S.; Short, K.R.; Coenen-Schimke, J.M.; Guo, Z.; Bigelow, M.L.; Nair, K.S. Skeletal Muscle Mitochondrial Functions, Mitochondrial DNA Copy Numbers, and Gene Transcript Profiles in Type 2 Diabetic and Nondiabetic Subjects at Equal Levels of Low or High Insulin and Euglycemia. Diabetes 2006, 55, 3309–3319. [Google Scholar] [CrossRef] [PubMed]
- Stump, C.S.; Short, K.R.; Bigelow, M.L.; Schimke, J.M.; Nair, K.S. Effect of insulin on human skeletal muscle mitochondrial ATP production, protein synthesis, and mRNA transcripts. Proc. Natl. Acad. Sci. USA 2003, 100, 7996–8001. [Google Scholar] [CrossRef]
- Szendroedi, J.; Schmid, A.I.; Chmelik, M.; Toth, C.; Brehm, A.; Krssak, M.; Nowotny, P.; Wolzt, M.; Waldhausl, W.; Roden, M. Muscle mitochondrial ATP synthesis and glucose transport/phosphorylation in type 2 diabetes. PLoS Med. 2007, 4, e154. [Google Scholar] [CrossRef]
- Phielix, E.; Schrauwen-Hinderling, V.B.; Mensink, M.; Lenaers, E.; Meex, R.; Hoeks, J.; Kooi, M.E.; Moonen-Kornips, E.; Sels, J.-P.; Hesselink, M.K.C.; et al. Lower intrinsic ADP-stimulated mitochondrial respiration underlies in vivo mitochondrial dysfunction in muscle of male type 2 diabetic patients. Diabetes 2008, 57, 2943–2949. [Google Scholar] [CrossRef]
- Schrauwen, P.; Hesselink, M.K.C. Oxidative capacity, lipotoxicity, and mitochondrial damage in type 2 diabetes. Diabetes 2004, 53, 1412–1417. [Google Scholar] [CrossRef] [PubMed]
- Schrauwen-Hinderling, V.B.; Kooi, M.E.; Hesselink, M.K.C.; Jeneson, J.a.L.; Backes, W.H.; van Echteld, C.J.A.; van Engelshoven, J.M.A.; Mensink, M.; Schrauwen, P. Impaired in vivo mitochondrial function but similar intramyocellular lipid content in patients with type 2 diabetes mellitus and BMI-matched control subjects. Diabetologia 2007, 50, 113–120. [Google Scholar] [CrossRef]
- Boushel, R.; Gnaiger, E.; Schjerling, P.; Skovbro, M.; Kraunsøe, R.; Dela, F. Patients with type 2 diabetes have normal mitochondrial function in skeletal muscle. Diabetologia 2007, 50, 790–796. [Google Scholar] [CrossRef]
- Hittel, D.S.; Hathout, Y.; Hoffman, E.P.; Houmard, J.A. Proteome Analysis of Skeletal Muscle From Obese and Morbidly Obese Women. Diabetes 2005, 54, 1283–1288. [Google Scholar] [CrossRef]
- Højlund, K.; Wrzesinski, K.; Larsen, P.M.; Fey, S.J.; Roepstorff, P.; Handberg, A.; Dela, F.; Vinten, J.; McCormack, J.G.; Reynet, C.; et al. Proteome Analysis Reveals Phosphorylation of ATP Synthase β-Subunit in Human Skeletal Muscle and Proteins with Potential Roles in Type 2 Diabetes *. J. Biol. Chem. 2003, 278, 10436–10442. [Google Scholar] [CrossRef]
- Ptitsyn, A.; Hulver, M.; Cefalu, W.; York, D.; Smith, S.R. Unsupervised clustering of gene expression data points at hypoxia as possible trigger for metabolic syndrome. BMC Genom. 2006, 7, 318. [Google Scholar] [CrossRef]
- Lott, M.T.; Leipzig, J.N.; Derbeneva, O.; Xie, H.M.; Chalkia, D.; Sarmady, M.; Procaccio, V.; Wallace, D.C. MtDNA Variation and Analysis Using Mitomap and Mitomaster. Curr. Protoc. Bioinform. 2013, 44, 1.23.1–1.23.26. [Google Scholar] [CrossRef]
- Van Oven, M.; Kayser, M. Updated comprehensive phylogenetic tree of global human mitochondrial DNA variation. Hum. Mutat. 2009, 30, E386–E394. [Google Scholar] [CrossRef]
- Galicia-Garcia, U.; Benito-Vicente, A.; Jebari, S.; Larrea-Sebal, A.; Siddiqi, H.; Uribe, K.B.; Ostolaza, H.; Martín, C. Pathophysiology of Type 2 Diabetes Mellitus. Int. J. Mol. Sci. 2020, 21, 6275. [Google Scholar] [CrossRef] [PubMed]
- Andrews, R.M.; Kubacka, I.; Chinnery, P.F.; Lightowlers, R.N.; Turnbull, D.M.; Howell, N. Reanalysis and revision of the Cambridge reference sequence for human mitochondrial DNA. Nat. Genet. 1999, 23, 147. [Google Scholar] [CrossRef]
- Kong, Q.-P.; Bandelt, H.-J.; Sun, C.; Yao, Y.-G.; Salas, A.; Achilli, A.; Wang, C.-Y.; Zhong, L.; Zhu, C.-L.; Wu, S.-F.; et al. Updating the East Asian mtDNA phylogeny: A prerequisite for the identification of pathogenic mutations. Hum. Mol. Genet. 2006, 15, 2076–2086. [Google Scholar] [CrossRef]
- Mishmar, D.; Ruiz-Pesini, E.; Golik, P.; Macaulay, V.; Clark, A.G.; Hosseini, S.; Brandon, M.; Easley, K.; Chen, E.; Brown, M.D.; et al. Natural selection shaped regional mtDNA variation in humans. Proc. Natl. Acad. Sci. USA 2003, 100, 171–176. [Google Scholar] [CrossRef]
- Ruiz-Pesini, E.; Mishmar, D.; Brandon, M.; Procaccio, V.; Wallace, D.C. Effects of Purifying and Adaptive Selection on Regional Variation in Human mtDNA. Science 2004, 303, 223–226. [Google Scholar] [CrossRef]
- Torroni, A.; Achilli, A.; Macaulay, V.; Richards, M.; Bandelt, H.-J. Harvesting the fruit of the human mtDNA tree. Trends Genet. 2006, 22, 339–345. [Google Scholar] [CrossRef]
- Umetsu, K.; Yuasa, I. Recent progress in mitochondrial DNA analysis. Leg. Med. 2005, 7, 259–262. [Google Scholar] [CrossRef]
- Gaona, E.G.; Gregorio, A.G.; Jiménez, C.G.; López-Olaiz, M.A.; Mendoza-Ramírez, P.; Fernandez-Guzman, D.; Zuñiga, L.Y.; Sánchez-Parada, M.G.; Santiago, A.E.G.; Pintos, L.M.R.; et al. Mitochondrial-derived Peptide Single-nucleotide Polymorphisms Associated with Cardiovascular Complications in Type 2 Diabetes (2022100025). Preprints 2022, 2022100025. [Google Scholar] [CrossRef]
- Avital, G.; Buchshtav, M.; Zhidkov, I.; Tuval (Feder), J.; Dadon, S.; Rubin, E.; Glass, D.; Spector, T.D.; Mishmar, D. Mitochondrial DNA heteroplasmy in diabetes and normal adults: Role of acquired and inherited mutational patterns in twins. Hum. Mol. Genet. 2012, 21, 4214–4224. [Google Scholar] [CrossRef] [PubMed]
- Nissanka, N.; Moraes, C.T. Mitochondrial DNA heteroplasmy in disease and targeted nuclease-based therapeutic approaches. EMBO Rep. 2020, 21, e49612. [Google Scholar] [CrossRef] [PubMed]
- Rambani, V.; Hromnikova, D.; Gasperikova, D.; Skopkova, M. Mitochondria and mitochondrial disorders: An overview update. Endocr. Regul. 2022, 56, 232–248. [Google Scholar] [CrossRef] [PubMed]
- Vringer, E.; Tait, S.W.G. Mitochondria and cell death-associated inflammation. Cell Death Differ. 2023, 30, 304–312. [Google Scholar] [CrossRef] [PubMed]
- Kadowaki, T.; Kadowaki, H.; Mori, Y.; Tobe, K.; Sakuta, R.; Suzuki, Y.; Tanabe, Y.; Sakura, H.; Awata, T.; Goto, Y.; et al. A Subtype of Diabetes Mellitus Associated with a Mutation of Mitochondrial DNA. N. Engl. J. Med. 1994, 330, 962–968. [Google Scholar] [CrossRef]
- Tawata, M.; Ohtaka, M.; Iwase, E.; Ikegishi, Y.; Aida, K.; Onaya, T. New mitochondrial DNA homoplasmic mutations associated with Japanese patients with type 2 diabetes. Diabetes 1998, 47, 276–277. [Google Scholar] [CrossRef]
- Wang, D.; Taniyama, M.; Suzuki, Y.; Katagiri, T.; Ban, Y. Association of the mitochondrial DNA 5178A/C polymorphism with maternal inheritance and onset of type 2 diabetes in Japanese patients. Exp. Clin. Endocrinol. Diabetes 2001, 109, 361–364. [Google Scholar] [CrossRef]
- Yang, B.T.; Dayeh, T.A.; Volkov, P.A.; Kirkpatrick, C.L.; Malmgren, S.; Jing, X.; Renström, E.; Wollheim, C.B.; Nitert, M.D.; Ling, C. Increased DNA Methylation and Decreased Expression of PDX-1 in Pancreatic Islets from Patients with Type 2 Diabetes. Mol. Endocrinol. 2012, 26, 1203–1212. [Google Scholar] [CrossRef]
- Poulton, J.; Luan, J.; Macaulay, V.; Hennings, S.; Mitchell, J.; Wareham, N.J. Type 2 diabetes is associated with a common mitochondrial variant: Evidence from a population-based case-control study. Hum. Mol. Genet. 2002, 11, 1581–1583. [Google Scholar] [CrossRef]
- Tang, D.-L.; Zhou, X.; Li, X.; Zhao, L.; Liu, F. Variation of mitochondrial gene and the association with type 2 diabetes mellitus in a Chinese population. Diabetes Res. Clin. Pract. 2006, 73, 77–82. [Google Scholar] [CrossRef] [PubMed]
- Davey Smith, G.; Ebrahim, S. ‘Mendelian randomization’: Can genetic epidemiology contribute to understanding environmental determinants of disease? Int. J. Epidemiol. 2003, 32, 1–22. [Google Scholar] [CrossRef] [PubMed]
- Hallgrimsson, B.; Green, R.M.; Katz, D.C.; Fish, J.L.; Bernier, F.P.; Roseman, C.C.; Young, N.M.; Cheverud, J.M.; Marcucio, R.S. The developmental-genetics of canalization. Semin. Cell Dev. Biol. 2019, 88, 67–79. [Google Scholar] [CrossRef] [PubMed]
- Lamolle, G.; Musto, H.; Lamolle, G.; Musto, H. Genoma Humano. Aspectos estructurales. An. Fac. Med. 2018, 5, 12–28. [Google Scholar] [CrossRef]
- Justino, J.R.; dos Reis, C.F.; Fonseca, A.L.; de Souza, S.J.; Stransky, B. An integrated approach to identify bimodal genes associated with prognosis in câncer. Genet. Mol. Biol. 2021, 44, e20210109. [Google Scholar] [CrossRef]
- Moody, L.; Mantha, S.; Chen, H.; Pan, Y.-X. Computational methods to identify bimodal gene expression and facilitate personalized treatment in cancer patients. J. Biomed. Inform. 2019, 100, 100001. [Google Scholar] [CrossRef]
- Moody, L.; Xu, G.B.; Pan, Y.-X.; Chen, H. Genome-wide cross-cancer analysis illustrates the critical role of bimodal miRNA in patient survival and drug responses to PI3K inhibitors. PLoS Comput. Biol. 2022, 18, e1010109. [Google Scholar] [CrossRef]
- Santander-Lucio, H.; Totomoch-Serra, A.; Muñoz, M.d.L.; García-Hernández, N.; Pérez-Ramírez, G.; Valladares-Salgado, A.; Pérez-Muñoz, A.A. Variants in the Control Region of Mitochondrial Genome Associated with type 2 Diabetes in a Cohort of Mexican Mestizos. Arch. Med. Res. 2023, 54, 113–123. [Google Scholar] [CrossRef]
- Parsons, M.J.; D’Souza, U.M.; Arranz, M.-J.; Kerwin, R.W.; Makoff, A.J. The 1438A/G polymorphism in the 5-hydroxytryptamine type 2A receptor gene affects promoter activity. Biol. Psychiatry 2004, 56, 406–410. [Google Scholar] [CrossRef]
- Kwak, S.H.; Park, K.S. Role of mitochondrial DNA variation in the pathogenesis of diabetes mellitus. Front. Biosci. Landmark 2016, 21, 1151–1167. [Google Scholar] [CrossRef]
- Sudoyo, H.; Suryadi, H.; Sitorus, N.; Soegondo, S.; Pranoto, A.; Marzuki, S. Mitochondrial Genome and Susceptibility to Diabetes Mellitus. In Tropical Diseases: From Molecule to Bedside; Marzuki, S., Verhoef, J., Snippe, H., Eds.; Springer: Boston, MA, USA, 2003; pp. 19–36. [Google Scholar] [CrossRef]
- Liou, C.-W.; Lin, T.-K.; Chen, J.-B.; Tiao, M.-M.; Weng, S.-W.; Chen, S.-D.; Chuang, Y.-C.; Chuang, J.-H.; Wang, P.-W. Association between a common mitochondrial DNA D-loop polycytosine variant and alteration of mitochondrial copy number in human peripheral blood cells. J. Med. Genet. 2010, 47, 723–728. [Google Scholar] [CrossRef] [PubMed]
- Soini, H.K.; Moilanen, J.S.; Finnila, S.; Majamaa, K. Mitochondrial DNA sequence variation in Finnish patients with matrilineal diabetes mellitus. BMC Res. Notes 2012, 5, 350. [Google Scholar] [CrossRef] [PubMed]
- Mkaouar-Rebai, E.; Tlili, A.; Masmoudi, S.; Charfeddine, I.; Fakhfakh, F. New polymorphic mtDNA restriction site in the 12S rRNA gene detected in Tunisian patients with non-syndromic hearing loss. Biochem. Biophys. Res. Commun. 2008, 369, 849–852. [Google Scholar] [CrossRef] [PubMed]
- Nahili, H.; Charif, M.; Boulouiz, R.; Bounaceur, S.; Benrahma, H.; Abidi, O.; Chafik, A.; Rouba, H.; Kandil, M.; Barakat, A. Prevalence of the mitochondrial A 1555G mutation in Moroccan patients with non-syndromic hearing loss. Int. J. Pediatr. Otorhinolaryngol. 2010, 74, 1071–1074. [Google Scholar] [CrossRef] [PubMed]
- Tabebi, M.; Charfi, N.; Kallabi, F.; Alila-Fersi, O.; Ben Mahmoud, A.; Tlili, A.; Keskes-Ammar, L.; Kamoun, H.; Abid, M.; Mnif, M.; et al. Whole mitochondrial genome screening of a family with maternally inherited diabetes and deafness (MIDD) associated with retinopathy: A putative haplotype associated to MIDD and a novel MT-CO2 m.8241T>G mutation. J. Diabetes Its Complicat. 2017, 31, 253–259. [Google Scholar] [CrossRef]
- Alwehaidah, M.S.; Al-Kafaji, G.; Bakhiet, M.; Alfadhli, S. Next-generation sequencing of the whole mitochondrial genome identifies novel and common variants in patients with psoriasis, type 2 diabetes mellitus and psoriasis with comorbid type 2 diabetes mellitus. Biomed. Rep. 2021, 14, 41. [Google Scholar] [CrossRef]
- Diaz-Morales, N.; Lopez-Domenech, S.; Iannantuoni, F.; Lopez-Gallardo, E.; Sola, E.; Morillas, C.; Rocha, M.; Ruiz-Pesini, E.; Victor, V.M. Mitochondrial DNA Haplogroup JT is Related to Impaired Glycaemic Control and Renal Function in Type 2 Diabetic Patients. J. Clin. Med. 2018, 7, 220. [Google Scholar] [CrossRef]
- Czibula, G.; Bocicor, M.-I.; Czibula, I.G. Promoter Sequences Prediction Using Relational Association Rule Mining. Evol. Bioinform. 2012, 8, EBO.S9376. [Google Scholar] [CrossRef]
- Leung, K.-S.; Wong, K.-C.; Chan, T.-M.; Wong, M.-H.; Lee, K.-H.; Lau, C.-K.; Tsui, S.K.W. Discovering protein–DNA binding sequence patterns using association rule mining. Nucleic Acids Res. 2010, 38, 6324–6337. [Google Scholar] [CrossRef]
- Mallik, S.; Mukhopadhyay, A.; Maulik, U. RANWAR: Rank-Based Weighted Association Rule Mining from Gene Expression and Methylation Data. IEEE Trans. NanoBioscience 2015, 14, 59–66. [Google Scholar] [CrossRef]
- Oellrich, A.; Jacobsen, J.; Papatheodorou, I.; The Sanger Mouse Genetics Project; Smedley, D. Using association rule mining to determine promising secondary phenotyping hypotheses. Bioinformatics 2014, 30, i52–i59. [Google Scholar] [CrossRef] [PubMed]
- Wong, M.-H.; Sze-To, H.-Y.; Lo, L.-Y.; Chan, T.-M.; Leung, K.-S. Discovering Binding Cores in Protein-DNA Binding Using Association Rule Mining with Statistical Measures. IEEE/ACM Trans. Comput. Biol. Bioinform. 2015, 12, 142–154. [Google Scholar] [CrossRef] [PubMed]


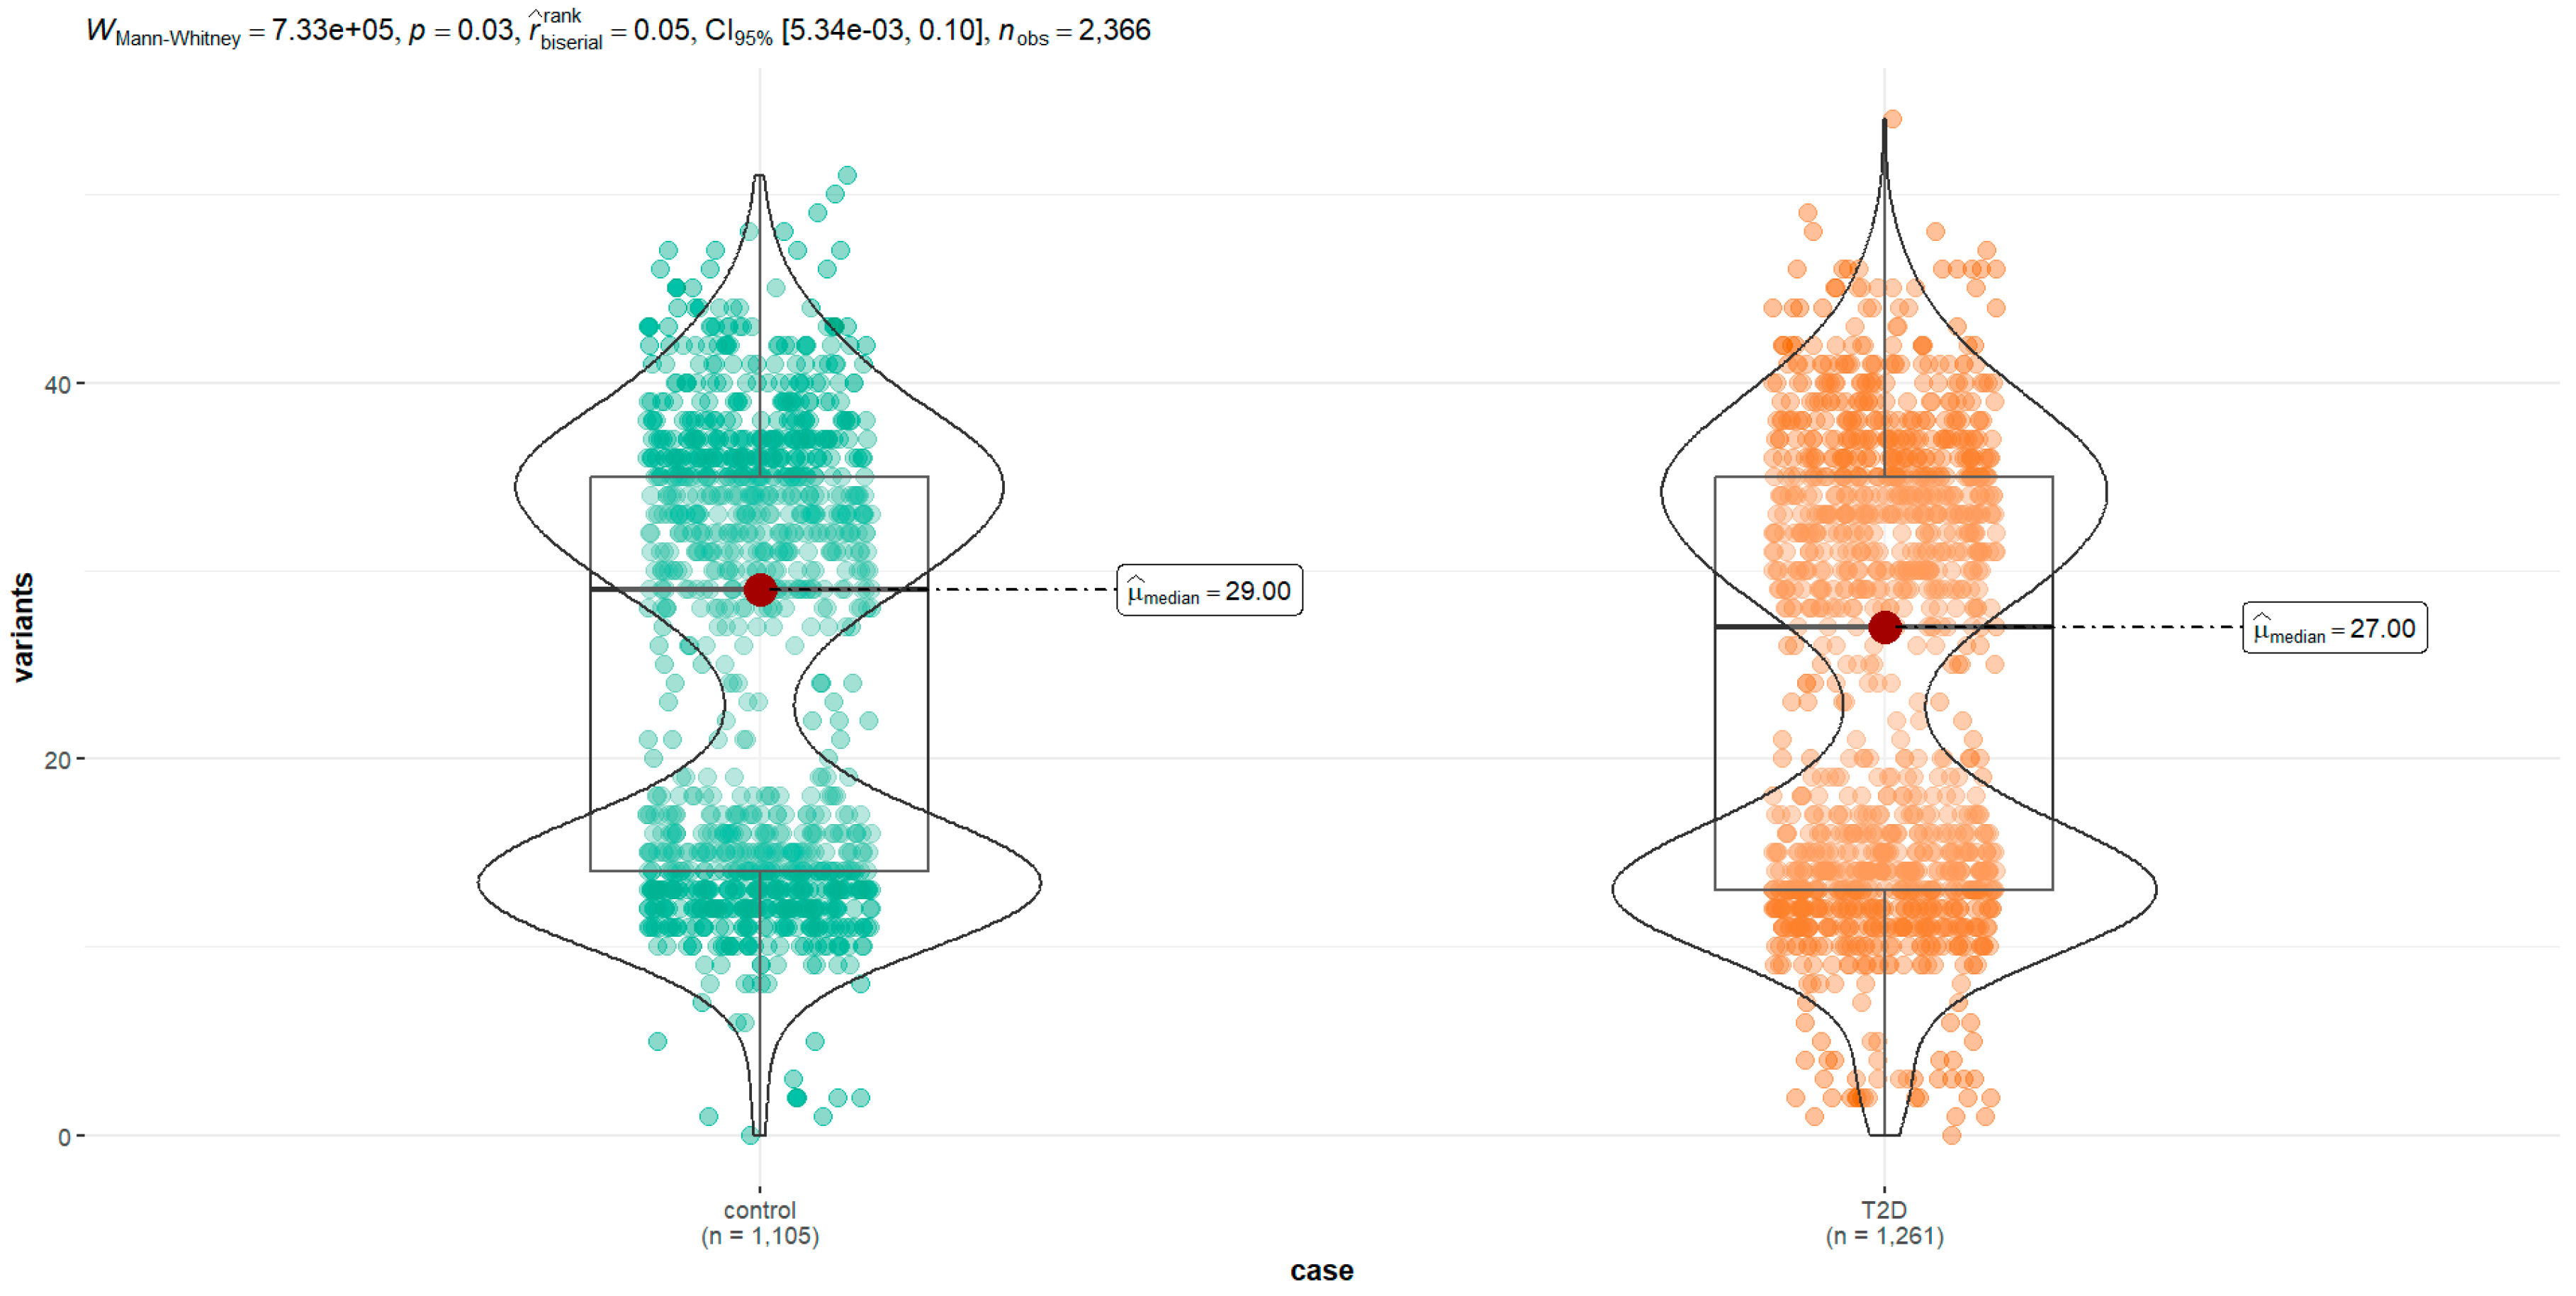
| Group (n) | Min. | 1st Qu. | Median | Mean | Mode | 3rd Qu. | IQR | Max. | SD | Variance | Skewness | Kurtosis | Da | p-Value a |
|---|---|---|---|---|---|---|---|---|---|---|---|---|---|---|
| All (2336) | 0 | 14.0 | 28.0 | 24.73 | 13.0 | 35.0 | 21 | 54.0 | 11.53 | 132.93 | −0.01 | −1.14 | 0.2 | <2 × 10⁻¹⁶ |
| Type 2 diabetes (1261) | 0 | 14.0 | 27 | 24.3 | 13.1 | 35.0 | 22 | 54.0 | 11.7 | 136 | 0 | −1.38 | 0.07 | <2 × 10⁻¹⁶ |
| Control (1105) | 0 | 14.0 | 29 | 25.2 | 13.0 | 35.0 | 21 | 51.0 | 11.4 | 129 | −0.02 | −1.45 | 0.3 | <2× 10⁻¹⁶ |
| mtDNA Region | NCBI dbSNP ID | Polymorphism | Variant | All n = 2366 (%) | Controls n = 1105 (%) | T2D n = 1261 (%) | Odds Ratio | CI95% | p -Value |
|---|---|---|---|---|---|---|---|---|---|
| Hypervariable segment 2 (locus MT-HV2, 57-372) | - | m.73A>G | A | 981 (41.5) | 441 (45.0) | 540 (55.0) | 0.012 | ||
| G | 1374 (58.1) | 663 (48.3) | 711 (51.7) | 0.88 | 0.74–1.03 | 0.114 | |||
| Other | 11 (0.46) | 1 (9.09) | 10 (90.9) | 8.17 | 1.56–150.17 | 0.046 | |||
| Gene MT-RNR1 coding for the 12S ribosomal RNA | rs28358571 | m.1189T>C | T | 2230 (94.3) | 1035 (46.4) | 1195 (53.6) | 0.002 | ||
| C | 120 (5.07) | 68 (56.7) | 52 (43.3) | 0.66 | 0.46–0.96 | 0.029 | |||
| Other | 16 (0.68) | 2 (12.5) | 14 (87.5) | 6.06 | 1.69–38.67 | 0.017 | |||
| rs111033321 | m.1193T>C | T | 2353 (99.5) | 1104 (46.9) | 1249 (53.1) | 0.07 | |||
| C | 1 (0.04) | 0 (0.00) | 1 (100) | NC | |||||
| Other | 12 (0.51) | 1 (8.33) | 11 (91.7) | 9.72 | 1.89–177.88 | 0.030 | |||
| rs111033356 | m.1420T>C | T | 2354 (99.5) | 1104 (46.9) | 1250 (53.1) | 0.17 | |||
| Other | 12 (0.51) | 1 (8.33) | 11 (91.7) | 9.72 | 1.89–177.74 | 0.030 | |||
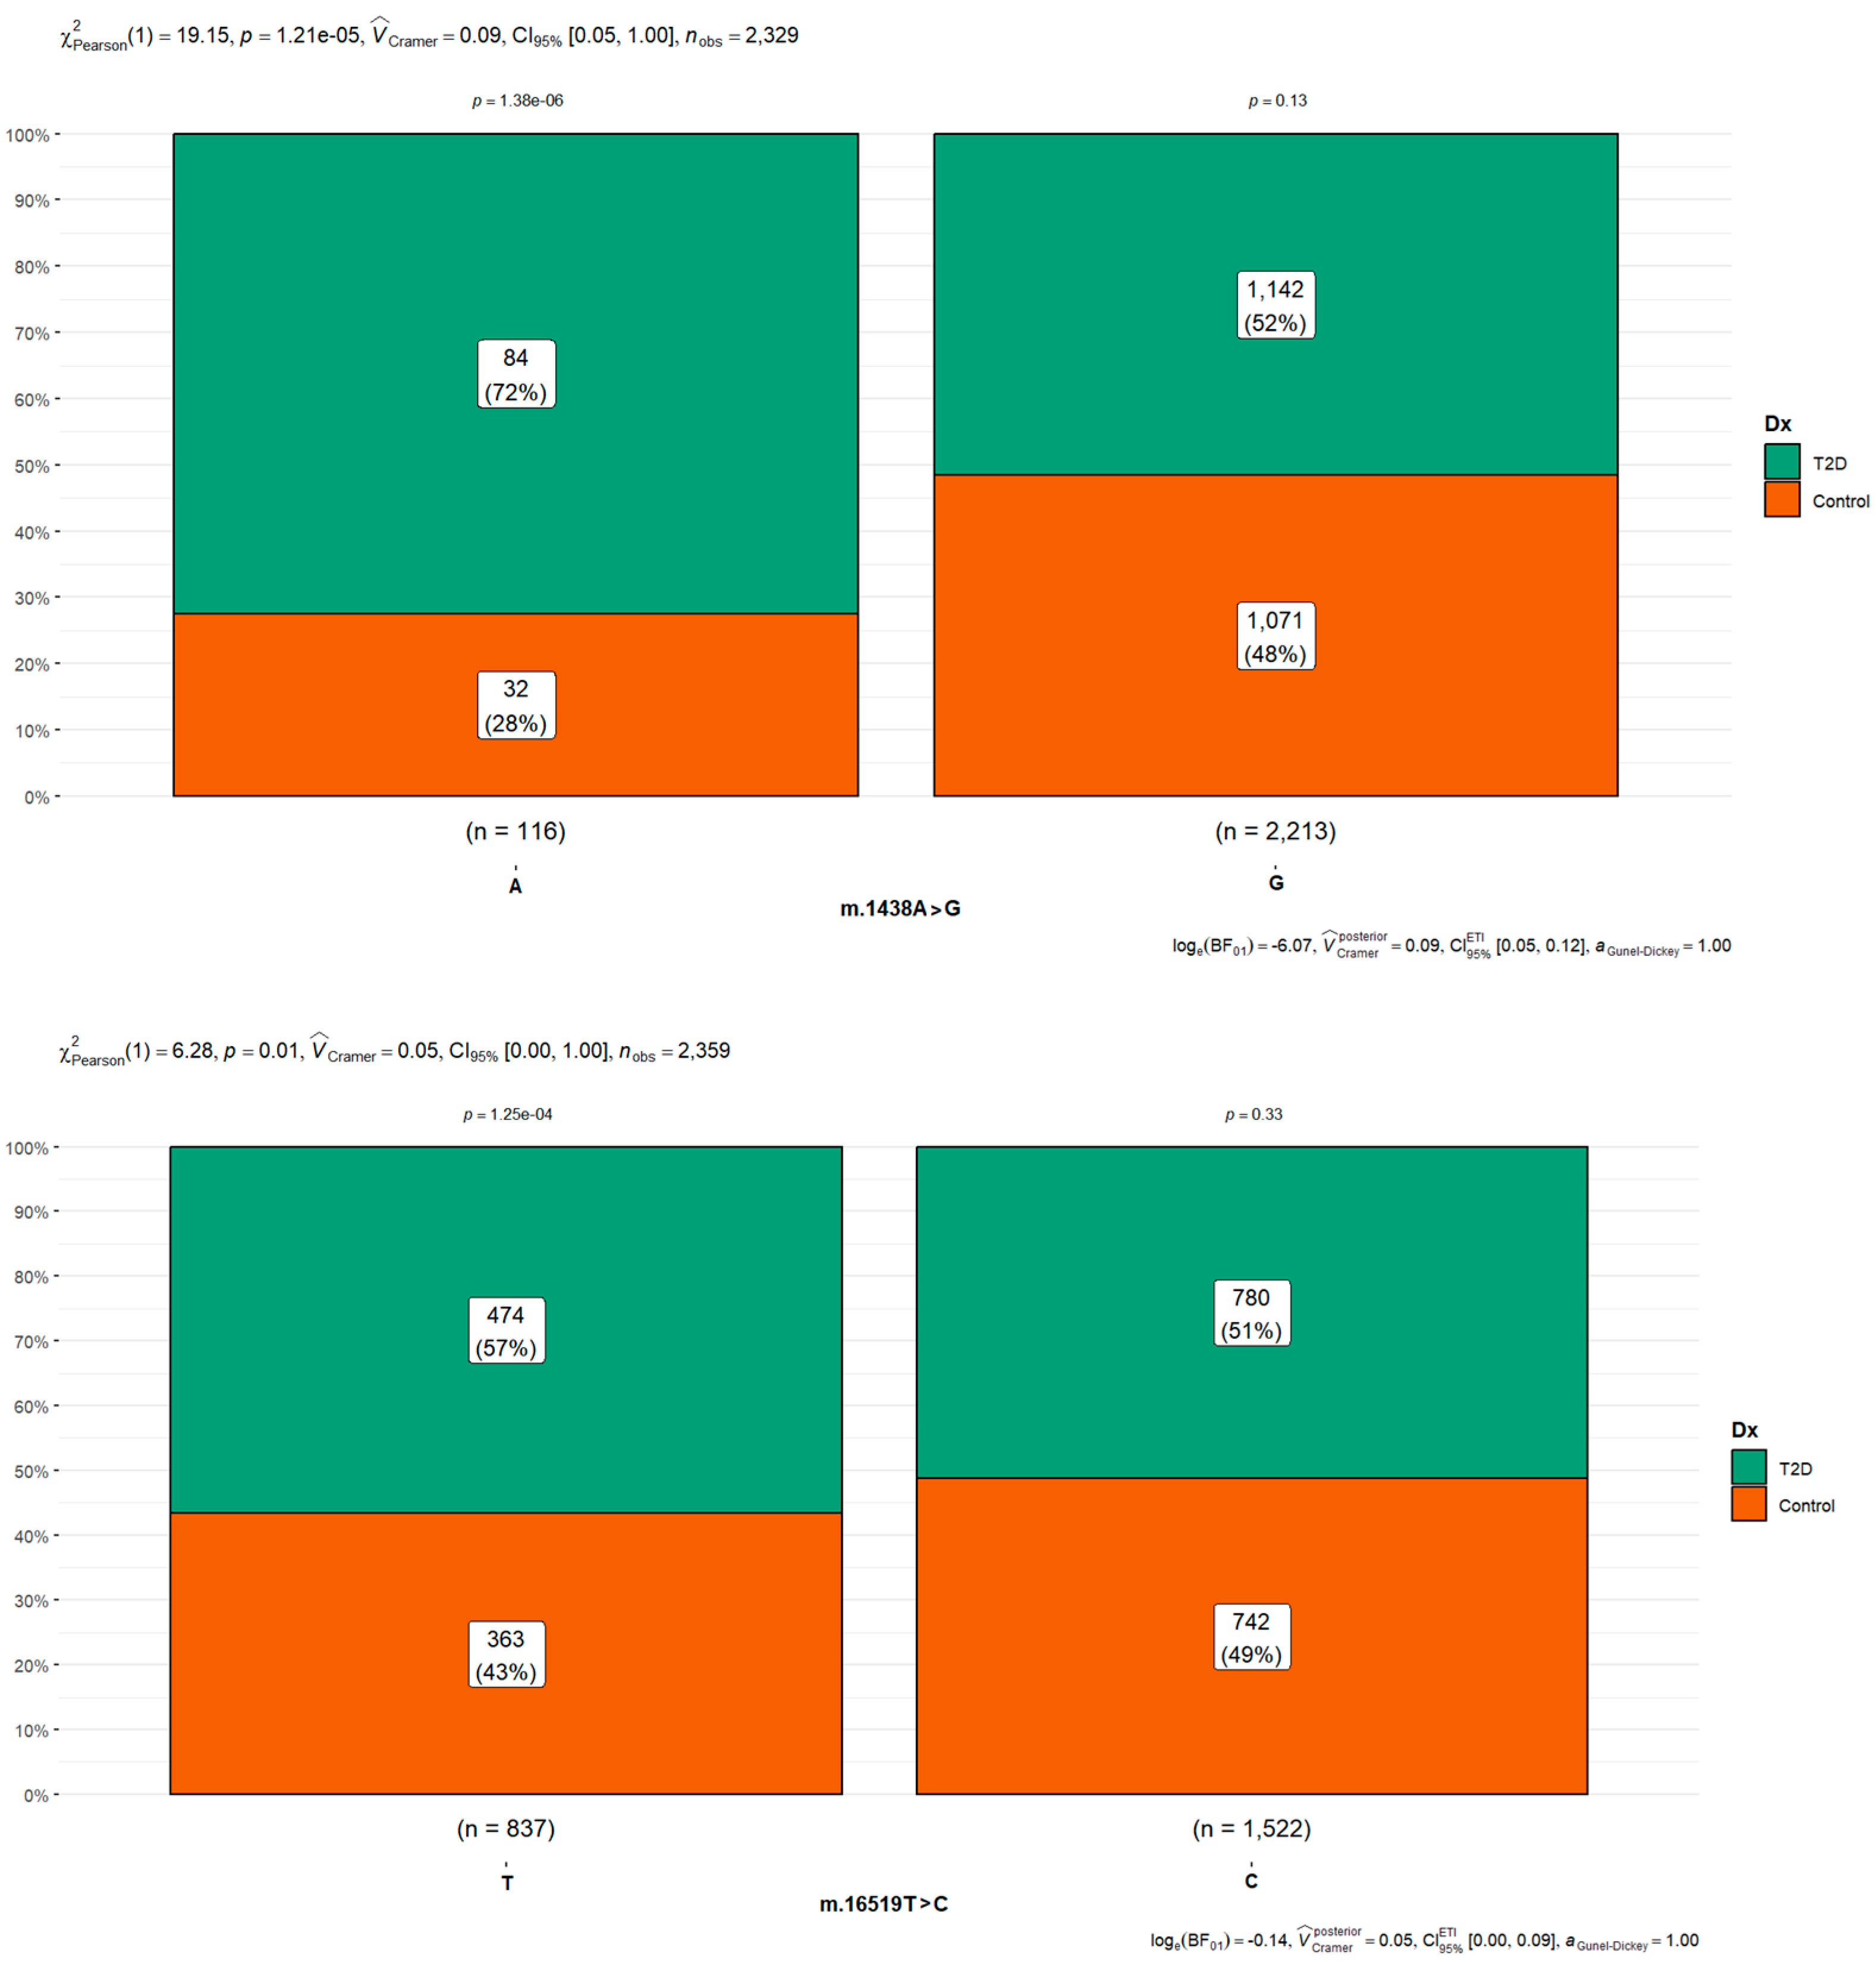
| rs2001030 | m.1438A>G | A | 116 (4.90) | 32 (27.6) | 84 (72.4) | <0.001 | |||
| G | 2213 (93.5) | 1071 (48.4) | 1142 (51.6) | 0.41 | 0.26–0.61 | <0.001 | |||
| Other | 37 (1.56) | 2 (5.41) | 35 (94.6) | 6.67 | 1.88–42.53 | 0.012 | |||
| Gene MT-RNR2 coding for the 16S ribosomal RNA | rs28358576 | m.1811A>G | A | 2088 (88.3) | 954 (45.7) | 1134 (54.3) | <0.001 | ||
| G | 272 (11.5) | 151 (55.5) | 121 (44.5) | 0.67 | 0.52–0.67 | 0.002 | |||
| Other | 6 (0.25) | 0 (0.00) | 6 (100) | NC | |||||
| rs878870626 | m.2667T>C | T | 2356 (99.6) | 1104 (46.9) | 1252 (53.1) | 0.024 | |||
| Other | 10 (0.42) | 1 (10.0) | 9 (90.0) | 7.94 | 1.49–146.47 | 0.049 | |||
| rs199838004 | m.3027T>C | T | 2337 (98.8) | 1099 (47.0) | 1238 (53.0) | 0.007 | |||
| C* | 24 (1.01) | 6 (25.0) | 18 (75.0) | 2.66 | 1.11–7.37 | 0.038 | |||
| Other | 5 (0.21) | 0 (0.00) | 5 (100) | NC | |||||
| Gene MT-ND3 coding for subunit of complex I (NADH dehydrogenase). First nucleotide of codon 114 (ACC) for threonine. | rs2853826 | m.10398A>G | A | 1809 (76.5) | 848 (46.9) | 961 (53.1) | <0.001 | ||
| G | 534 (22.6) | 255 (47.8) | 279 (52.2) | 0.97 | 0.80–1.17 | 0.722 | |||
| Other | 23 (0.97) | 2 (8.70) | 21 (91.3) | 9.27 | 2.71–58.04 | 0.003 | |||
| Gene MT-CYB coding for the cytochrome b subunit of complex III (ubiquinol:cytochrome c oxidoreductase). Third nucleotide of codon 10 (CTA) for leucine. | - | m.14766C>T | C | 1351 (57.1) | 498 (36.9) | 853 (63.1) | 0.001 | ||
| T | 1011 (42.7) | 607 (60.0) | 404 (40.0) | 0.39 | 0.36–0.46 | 0.001 | |||
| Other | 4 (0.17) | 0 (0.00) | 4 (100) | NC | |||||
| hypervariable segment 1 (locus MT-HV1, 16024-16383) | rs147029798 | m.16126T>C | T | 1922 (81.2) | 871 (45.3) | 1051 (54.7) | 0.001 | ||
| C | 439 (18.6) | 234 (53.3) | 205 (46.7) | 0.73 | 0.59–0.89 | 0.003 | |||
| Other | 5 (0.21) | 0 (0.00) | 5 (100) | NC | |||||
| Control región Noncoding position | rs3937033 | m.16519T>C | T | 837 (35.4) | 363 (43.4) | 474 (56.6) | 0.001 | ||
| C | 1522 (64.3) | 742 (48.8) | 780 (51.2) | 0.81 | 0.68–0.95 | 0.012 | |||
| Other | 7 (0.30) | 0 (0.00) | 7 (100) | NC |
Disclaimer/Publisher’s Note: The statements, opinions and data contained in all publications are solely those of the individual author(s) and contributor(s) and not of MDPI and/or the editor(s). MDPI and/or the editor(s) disclaim responsibility for any injury to people or property resulting from any ideas, methods, instructions or products referred to in the content. |
© 2023 by the authors. Licensee MDPI, Basel, Switzerland. This article is an open access article distributed under the terms and conditions of the Creative Commons Attribution (CC BY) license (https://creativecommons.org/licenses/by/4.0/).
Share and Cite
Garcia-Gaona, E.; García-Gregorio, A.; García-Jiménez, C.; López-Olaiz, M.A.; Mendoza-Ramírez, P.; Fernandez-Guzman, D.; Pillado-Sánchez, R.A.; Soto-Pacheco, A.D.; Yareni-Zuñiga, L.; Sánchez-Parada, M.G.; et al. mtDNA Single-Nucleotide Variants Associated with Type 2 Diabetes. Curr. Issues Mol. Biol. 2023, 45, 8716-8732. https://doi.org/10.3390/cimb45110548
Garcia-Gaona E, García-Gregorio A, García-Jiménez C, López-Olaiz MA, Mendoza-Ramírez P, Fernandez-Guzman D, Pillado-Sánchez RA, Soto-Pacheco AD, Yareni-Zuñiga L, Sánchez-Parada MG, et al. mtDNA Single-Nucleotide Variants Associated with Type 2 Diabetes. Current Issues in Molecular Biology. 2023; 45(11):8716-8732. https://doi.org/10.3390/cimb45110548
Chicago/Turabian StyleGarcia-Gaona, Enrique, Alhelí García-Gregorio, Camila García-Jiménez, Mildred Alejandra López-Olaiz, Paola Mendoza-Ramírez, Daniel Fernandez-Guzman, Rolando Alberto Pillado-Sánchez, Axel David Soto-Pacheco, Laura Yareni-Zuñiga, María Guadalupe Sánchez-Parada, and et al. 2023. "mtDNA Single-Nucleotide Variants Associated with Type 2 Diabetes" Current Issues in Molecular Biology 45, no. 11: 8716-8732. https://doi.org/10.3390/cimb45110548
APA StyleGarcia-Gaona, E., García-Gregorio, A., García-Jiménez, C., López-Olaiz, M. A., Mendoza-Ramírez, P., Fernandez-Guzman, D., Pillado-Sánchez, R. A., Soto-Pacheco, A. D., Yareni-Zuñiga, L., Sánchez-Parada, M. G., González-Santiago, A. E., Román-Pintos, L. M., Castañeda-Arellano, R., Hernández-Ortega, L. D., Mercado-Sesma, A. R., Orozco-Luna, F. d. J., Villa-Angulo, C., Villa-Angulo, R., & Baptista-Rosas, R. C. (2023). mtDNA Single-Nucleotide Variants Associated with Type 2 Diabetes. Current Issues in Molecular Biology, 45(11), 8716-8732. https://doi.org/10.3390/cimb45110548