
Higher NADH Dehydrogenase [Ubiquinone] Iron–Sulfur Protein 8 (NDUFS8) Serum Levels Correlate with Better Insulin Sensitivity in Type 1 Diabetes

 , and
, and
Abstract
:1. Introduction
2. Methodology
2.1. Study Design
2.2. Insulin Resistance Markers
2.3. Blood Tests
2.4. NADH Dehydrogenase [Ubiquinone] Iron–Sulfur Protein 8 Measurement
2.5. Statistical Analysis
3. Results
4. Discussion
5. Conclusions
Author Contributions
Funding
Institutional Review Board Statement
Informed Consent Statement
Data Availability Statement
Conflicts of Interest
References
- Bluestone, J.A.; Herold, K.; Eisenbarth, G. Genetics, pathogenesis and clinical interventions in type 1 diabetes. Nature 2010, 464, 1293–1300. [Google Scholar] [CrossRef] [PubMed]
- Giugliano, D.; Ceriello, A.; Paolisso, G. Oxidative stress and diabetic vascular complications. Diabetes Care 1996, 19, 257–267. [Google Scholar] [CrossRef] [PubMed]
- Desai, S.; Deshmukh, A. Mapping Of Type 1 Diabetes Mellitus. Curr. Diabetes Rev. 2020, 16, 438–441. [Google Scholar] [CrossRef] [PubMed]
- Kretowski, A.; Kowalska, I.; Peczyñska, J.; Urban, M.; Green, A.; Kinalska, I. The large increase in incidence of Type I diabetes mellitus in Poland. Diabetologia 2001, 44 (Suppl. 3), B48–B50. [Google Scholar] [CrossRef]
- Patterson, C.C.; Dahlquist, G.G.; Gyürüs, E.; Green, A.; Soltész, G.; Group, E.S. Incidence trends for childhood type 1 diabetes in Europe during 1989–2003 and predicted new cases 2005-20: A multicentre prospective registration study. Lancet 2009, 373, 2027–2033. [Google Scholar] [CrossRef]
- Nielsen, H.B.; Ovesen, L.L.; Mortensen, L.H.; Lau, C.J.; Joensen, L.E. Type 1 diabetes, quality of life, occupational status and education level—A comparative population-based study. Diabetes Res. Clin. Pract. 2016, 121, 62–68. [Google Scholar] [CrossRef]
- Diabetes Control and Complications Trial Research Group. Effect of intensive diabetes treatment on the development and progression of long-term complications in adolescents with insulin-dependent diabetes mellitus: Diabetes Control and Complications Trial. J. Pediatr. 1994, 125, 177–188. [Google Scholar] [CrossRef]
- Šimonienė, D.; Platūkiene, A.; Prakapienė, E.; Radzevičienė, L.; Veličkiene, D. Insulin Resistance in Type 1 Diabetes Mellitus and Its Association with Patient’s Micro- and Macrovascular Complications, Sex Hormones, and Other Clinical Data. Diabetes Ther. 2020, 11, 161–174. [Google Scholar] [CrossRef]
- Mao, Y.; Zhong, W. Changes of insulin resistance status and development of complications in type 1 diabetes mellitus: Analysis of DCCT/EDIC study. Diabetes Res. Clin. Pract. 2022, 184, 109211. [Google Scholar] [CrossRef]
- Lotfy, M.; Adeghate, J.; Kalasz, H.; Singh, J.; Adeghate, E. Chronic Complications of Diabetes Mellitus: A Mini Review. Curr. Diabetes Rev. 2017, 13, 3–10. [Google Scholar] [CrossRef] [Green Version]
- Cree-Green, M.; Stuppy, J.J.; Thurston, J.; Bergman, B.C.; Coe, G.V.; Baumgartner, A.D.; Bacon, S.; Scherzinger, A.; Pyle, L.; Nadeau, K.J. Youth With Type 1 Diabetes Have Adipose, Hepatic, and Peripheral Insulin Resistance. J. Clin. Endocrinol. Metab. 2018, 103, 3647–3657. [Google Scholar] [CrossRef] [PubMed]
- Priya, G.; Kalra, S. A Review of Insulin Resistance in Type 1 Diabetes: Is There a Place for Adjunctive Metformin? Diabetes Ther. 2018, 9, 349–361. [Google Scholar] [CrossRef] [PubMed]
- Chillarón, J.J.; Goday, A.; Flores-Le-Roux, J.A.; Benaiges, D.; Carrera, M.J.; Puig, J.; Cano-Pérez, J.F.; Pedro-Botet, J. Estimated glucose disposal rate in assessment of the metabolic syndrome and microvascular complications in patients with type 1 diabetes. J. Clin. Endocrinol. Metab. 2009, 94, 3530–3534. [Google Scholar] [CrossRef] [PubMed]
- Zheng, X.; Huang, B.; Luo, S.; Yang, D.; Bao, W.; Li, J.; Yao, B.; Weng, J.; Yan, J. A new model to estimate insulin resistance via clinical parameters in adults with type 1 diabetes. Diabetes Metab. Res. Rev. 2017, 33, e2880. [Google Scholar] [CrossRef] [PubMed]
- Uruska, A.; Araszkiewicz, A.; Zozulinska-Ziolkiewicz, D.; Uruski, P.; Wierusz-Wysocka, B. Insulin resistance is associated with microangiopathy in type 1 diabetic patients treated with intensive insulin therapy from the onset of disease. Exp. Clin. Endocrinol. Diabetes 2010, 118, 478–484. [Google Scholar] [CrossRef] [PubMed]
- Chillarón, J.J.; Sales, M.P.; Flores-Le-Roux, J.A.; Murillo, J.; Benaiges, D.; Castells, I.; Goday, A.; Cano, J.F.; Pedro-Botet, J. Insulin resistance and hypertension in patients with type 1 diabetes. J. Diabetes Complicat. 2011, 25, 232–236. [Google Scholar] [CrossRef] [PubMed]
- Brownlee, M. The pathobiology of diabetic complications: A unifying mechanism. Diabetes 2005, 54, 1615–1625. [Google Scholar] [CrossRef]
- Betteridge, D.J. What is oxidative stress? Metabolism 2000, 49 (Suppl. 1), 3–8. [Google Scholar] [CrossRef]
- Cadenas, E.; Boveris, A.; Ragan, C.I.; Stoppani, A.O. Production of superoxide radicals and hydrogen peroxide by NADH-ubiquinone reductase and ubiquinol-cytochrome c reductase from beef-heart mitochondria. Arch. Biochem. Biophys. 1977, 180, 248–257. [Google Scholar] [CrossRef]
- Dröge, W. Free radicals in the physiological control of cell function. Physiol. Rev. 2002, 82, 47–95. [Google Scholar] [CrossRef] [Green Version]
- Cadenas, E.; Davies, K.J. Mitochondrial free radical generation, oxidative stress, and aging. Free Radic. Biol. Med. 2000, 29, 222–230. [Google Scholar] [CrossRef]
- Korshunov, S.S.; Skulachev, V.P.; Starkov, A.A. High protonic potential actuates a mechanism of production of reactive oxygen species in mitochondria. FEBS Lett. 1997, 416, 15–18. [Google Scholar] [CrossRef]
- Tang, W.H.; Martin, K.A.; Hwa, J. Aldose reductase, oxidative stress, and diabetic mellitus. Front. Pharmacol. 2012, 3, 87. [Google Scholar] [CrossRef] [PubMed]
- Wu, J.; Jin, Z.; Zheng, H.; Yan, L.J. Sources and implications of NADH/NAD(+) redox imbalance in diabetes and its complications. Diabetes Metab. Syndr. Obes. 2016, 9, 145–153. [Google Scholar] [CrossRef]
- Hernandez-Mijares, A.; Rocha, M.; Apostolova, N.; Borras, C.; Jover, A.; Bañuls, C.; Sola, E.; Victor, V.M. Mitochondrial complex I impairment in leukocytes from type 2 diabetic patients. Free Radic. Biol. Med. 2011, 50, 1215–1221. [Google Scholar] [CrossRef] [PubMed]
- Victor, V.M.; Rocha, M.; Bañuls, C.; Sanchez-Serrano, M.; Sola, E.; Gomez, M.; Hernandez-Mijares, A. Mitochondrial complex I impairment in leukocytes from polycystic ovary syndrome patients with insulin resistance. J. Clin. Endocrinol. Metab. 2009, 94, 3505–3512. [Google Scholar] [CrossRef]
- Koopman, W.J.; Verkaart, S.; Visch, H.J.; van Emst-de Vries, S.; Nijtmans, L.G.; Smeitink, J.A.; Willems, P.H. Human NADH:ubiquinone oxidoreductase deficiency: Radical changes in mitochondrial morphology? Am. J. Physiol. Cell Physiol. 2007, 293, C22–C29. [Google Scholar] [CrossRef]
- De Sury, R.; Martinez, P.; Procaccio, V.; Lunardi, J.; Issartel, J.P. Genomic structure of the human NDUFS8 gene coding for the iron-sulfur TYKY subunit of the mitochondrial NADH:ubiquinone oxidoreductase. Gene 1998, 215, 1–10. [Google Scholar] [CrossRef]
- Procaccio, V.; Wallace, D.C. Late-onset Leigh syndrome in a patient with mitochondrial complex I NDUFS8 mutations. Neurology 2004, 62, 1899–1901. [Google Scholar] [CrossRef]
- DeFronzo, R.A.; Tobin, J.D.; Andres, R. Glucose clamp technique: A method for quantifying insulin secretion and resistance. Am. J. Physiol. 1979, 237, E214–E223. [Google Scholar] [CrossRef]
- Akbari, M.; Kirkwood, T.B.L.; Bohr, V.A. Mitochondria in the signaling pathways that control longevity and health span. Ageing Res. Rev. 2019, 54, 100940. [Google Scholar] [CrossRef] [PubMed]
- Song, X.; Hu, W.; Yu, H.; Wang, H.; Zhao, Y.; Korngold, R. Existence of Circulating Mitochondria in Human and Animal Peripheral Blood. Int. J. Mol. Sci. 2020, 21, 2122. [Google Scholar] [CrossRef] [PubMed]
- Torralba, D.; Baixauli, F.; Sánchez-Madrid, F. Mitochondria Know No Boundaries: Mechanisms and Functions of Intercellular Mitochondrial Transfer. Front. Cell Dev. Biol. 2016, 4, 107. [Google Scholar] [CrossRef]
- Puhm, F.; Afonyushkin, T.; Resch, U.; Obermayer, G.; Rohde, M.; Penz, T.; Schuster, M.; Wagner, G.; Rendeiro, A.F.; Melki, I.; et al. Mitochondria Are a Subset of Extracellular Vesicles Released by Activated Monocytes and Induce Type I IFN and TNF Responses in Endothelial Cells. Circ. Res. 2019, 125, 43–52. [Google Scholar] [CrossRef] [PubMed]
- Pollara, J.; Edwards, R.W.; Lin, L.; Bendersky, V.A.; Brennan, T.V. Circulating mitochondria in deceased organ donors are associated with immune activation and early allograft dysfunction. JCI Insight 2018, 3, e121622. [Google Scholar] [CrossRef]
- Phinney, D.G.; Di Giuseppe, M.; Njah, J.; Sala, E.; Shiva, S.; St Croix, C.M.; Stolz, D.B.; Watkins, S.C.; Di, Y.P.; Leikauf, G.D.; et al. Mesenchymal stem cells use extracellular vesicles to outsource mitophagy and shuttle microRNAs. Nat. Commun. 2015, 6, 8472. [Google Scholar] [CrossRef]
- Al Amir Dache, Z.; Otandault, A.; Tanos, R.; Pastor, B.; Meddeb, R.; Sanchez, C.; Arena, G.; Lasorsa, L.; Bennett, A.; Grange, T.; et al. Blood contains circulating cell-free respiratory competent mitochondria. FASEB J. 2020, 34, 3616–3630. [Google Scholar] [CrossRef]
- Stier, A. Human blood contains circulating cell-free mitochondria, but are they really functional? Am. J. Physiol. Endocrinol. Metab. 2021, 320, E859–E863. [Google Scholar] [CrossRef]
- Mahrouf-Yorgov, M.; Augeul, L.; Da Silva, C.C.; Jourdan, M.; Rigolet, M.; Manin, S.; Ferrera, R.; Ovize, M.; Henry, A.; Guguin, A.; et al. Mesenchymal stem cells sense mitochondria released from damaged cells as danger signals to activate their rescue properties. Cell Death Differ. 2017, 24, 1224–1238. [Google Scholar] [CrossRef]
- Zhao, Y.; Jiang, Z.; Delgado, E.; Li, H.; Zhou, H.; Hu, W.; Perez-Basterrechea, M.; Janostakova, A.; Tan, Q.; Wang, J.; et al. Platelet-Derived Mitochondria Display Embryonic Stem Cell Markers and Improve Pancreatic Islet β-cell Function in Humans. Stem Cells Transl. Med. 2017, 6, 1684–1697. [Google Scholar] [CrossRef]
- Zhao, Y.; Huang, Z.; Lazzarini, P.; Wang, Y.; Di, A.; Chen, M. A unique human blood-derived cell population displays high potential for producing insulin. Biochem. Biophys. Res. Commun. 2007, 360, 205–211. [Google Scholar] [CrossRef] [PubMed]
- Grazioli, S.; Pugin, J. Mitochondrial Damage-Associated Molecular Patterns: From Inflammatory Signaling to Human Diseases. Front. Immunol. 2018, 9, 832. [Google Scholar] [CrossRef] [PubMed]
- Rodríguez-Nuevo, A.; Zorzano, A. The sensing of mitochondrial DAMPs by non-immune cells. Cell Stress 2019, 3, 195–207. [Google Scholar] [CrossRef] [PubMed]
- Herzig, S.; Shaw, R.J. AMPK: Guardian of metabolism and mitochondrial homeostasis. Nat. Rev. Mol. Cell Biol. 2018, 19, 121–135. [Google Scholar] [CrossRef]
- Burkewitz, K.; Zhang, Y.; Mair, W.B. AMPK at the nexus of energetics and aging. Cell Metab. 2014, 20, 10–25. [Google Scholar] [CrossRef]
- Hardie, D.G.; Ross, F.A.; Hawley, S.A. AMPK: A nutrient and energy sensor that maintains energy homeostasis. Nat. Rev. Mol. Cell Biol. 2012, 13, 251–262. [Google Scholar] [CrossRef]
- Egan, D.F.; Shackelford, D.B.; Mihaylova, M.M.; Gelino, S.; Kohnz, R.A.; Mair, W.; Vasquez, D.S.; Joshi, A.; Gwinn, D.M.; Taylor, R.; et al. Phosphorylation of ULK1 (hATG1) by AMP-activated protein kinase connects energy sensing to mitophagy. Science 2011, 331, 456–461. [Google Scholar] [CrossRef]
- Pollard, A.K.; Craig, E.L.; Chakrabarti, L. Mitochondrial Complex 1 Activity Measured by Spectrophotometry Is Reduced across All Brain Regions in Ageing and More Specifically in Neurodegeneration. PLoS ONE 2016, 11, e0157405. [Google Scholar] [CrossRef]
- Petrosillo, G.; Matera, M.; Moro, N.; Ruggiero, F.M.; Paradies, G. Mitochondrial complex I dysfunction in rat heart with aging: Critical role of reactive oxygen species and cardiolipin. Free Radic. Biol. Med. 2009, 46, 88–94. [Google Scholar] [CrossRef]
- Zhao, Y.; Wang, H.; Mazzone, T. Identification of stem cells from human umbilical cord blood with embryonic and hematopoietic characteristics. Exp. Cell Res. 2006, 312, 2454–2464. [Google Scholar] [CrossRef]
- Zhao, Y.; Jiang, Z.; Zhao, T.; Ye, M.; Hu, C.; Yin, Z.; Li, H.; Zhang, Y.; Diao, Y.; Li, Y.; et al. Reversal of type 1 diabetes via islet β cell regeneration following immune modulation by cord blood-derived multipotent stem cells. BMC Med. 2012, 10, 3. [Google Scholar] [CrossRef] [PubMed]
- Li, Y.; Yan, B.; Wang, H.; Li, H.; Li, Q.; Zhao, D.; Chen, Y.; Zhang, Y.; Li, W.; Zhang, J.; et al. Hair regrowth in alopecia areata patients following Stem Cell Educator therapy. BMC Med. 2015, 13, 87. [Google Scholar] [CrossRef]
- Delgado, E.; Perez-Basterrechea, M.; Suarez-Alvarez, B.; Zhou, H.; Revuelta, E.M.; Garcia-Gala, J.M.; Perez, S.; Alvarez-Viejo, M.; Menendez, E.; Lopez-Larrea, C.; et al. Modulation of Autoimmune T-Cell Memory by Stem Cell Educator Therapy: Phase 1/2 Clinical Trial. EBioMedicine 2015, 2, 2024–2036. [Google Scholar] [CrossRef]
- Zhao, Y.; Jiang, Z.; Zhao, T.; Ye, M.; Hu, C.; Zhou, H.; Yin, Z.; Chen, Y.; Zhang, Y.; Wang, S.; et al. Targeting insulin resistance in type 2 diabetes via immune modulation of cord blood-derived multipotent stem cells (CB-SCs) in stem cell educator therapy: Phase I/II clinical trial. BMC Med. 2013, 11, 160. [Google Scholar] [CrossRef]
- Chen, J.; Stimpson, S.E.; Fernandez-Bueno, G.A.; Mathews, C.E. Mitochondrial Reactive Oxygen Species and Type 1 Diabetes. Antioxid. Redox Signal. 2018, 29, 1361–1372. [Google Scholar] [CrossRef] [PubMed]
- Matulewicz, N.; Karczewska-Kupczewska, M. Insulin resistance and chronic inflammation. Postepy Hig. I Med. Dosw. 2016, 70, 1245–1258. [Google Scholar]
- Park, K.; Gross, M.; Lee, D.H.; Holvoet, P.; Himes, J.H.; Shikany, J.M.; Jacobs, D.R. Oxidative stress and insulin resistance: The coronary artery risk development in young adults study. Diabetes Care 2009, 32, 1302–1307. [Google Scholar] [CrossRef] [PubMed]
- Mijaljica, D.; Prescott, M.; Devenish, R.J. Mitophagy and mitoptosis in disease processes. Methods Mol. Biol. 2010, 648, 93–106. [Google Scholar] [CrossRef]
- Gerber, P.A.; Rutter, G.A. The Role of Oxidative Stress and Hypoxia in Pancreatic Beta-Cell Dysfunction in Diabetes Mellitus. Antioxid. Redox Signal. 2017, 26, 501–518. [Google Scholar] [CrossRef]
- Hurrle, S.; Hsu, W.H. The etiology of oxidative stress in insulin resistance. Biomed. J. 2017, 40, 257–262. [Google Scholar] [CrossRef]
- Chen, J.; Gusdon, A.M.; Mathews, C.E. Role of genetics in resistance to type 1 diabetes. Diabetes Metab. Res. Rev. 2011, 27, 849–853. [Google Scholar] [CrossRef] [PubMed]
- Dionne, F.T.; Turcotte, L.; Thibault, M.C.; Boulay, M.R.; Skinner, J.S.; Bouchard, C. Mitochondrial DNA sequence polymorphism, VO2max, and response to endurance training. Med. Sci. Sports Exerc. 1993, 25, 766–774. [Google Scholar] [CrossRef] [PubMed]


| All Subjects n = 36 | eGDR above Median n = 16 | eGDR below Median n = 20 | p | |
|---|---|---|---|---|
| Sex males n (%) | 24 (67) | 10 (63) | 14 (70) | 0.640 |
| Smokers n (%) | 13 (36) | 6 (38) | 7 (35) | 0.878 |
| Pack-years [years] | 0.0 (0.0–2.4) | 0.0 (0.0–1.25) | 0.0 (0.0–4.0) | 0.690 |
| Age [years] | 39.5 (28.0–46.5) | 29.0 (24.5–35.0) | 43.0 (39.5–48.5) | 0.003 |
| Diabetes duration [years] | 22.0 (15.0–26.0) | 18.5 (12.5–23.5) | 25.0 (20.0–27.5) | 0.039 |
| Weight [kg] | 74.6 (64.8–84.8) | 66.5 (61.5–74.6) | 78.5 (69.1–88.8) | 0.063 |
| BMI [kg/m2] | 24.3 (22.4–27.1) | 23.0 (22.2–24.3) | 25.9 (23.4–27.3) | 0.025 |
| Waist circumference [cm] | 0.88 (0.83–0.92) | 82.0 (76.0–91.5) | 91.0 (85.5–105.5) | 0.003 |
| Systolic blood pressure [mmHg] | 122 (113–130) | 122 (113–127) | 125 (114–134) | 0.278 |
| Diastolic blood pressure [mmHg] | 80 (73–85) | 80 (70–85) | 80 (74–86) | 0.405 |
| A1C [%] | 8.3 (7.3–9.1) | 8.4 (7.3–9.3) | 8.2 (7.3–9.1) | 0.762 |
| Total cholesterol [mmol/L] | 172.0 (157.0–203.5) | 170.5 (161.5–199.0) | 177.5 (151.0–219.0) | 0.664 |
| LDL [mmol/L] | 93.5 (73.5–116.5) | 93.5 (77.0–116.5) | 92.5 (68.0–124.5) | 0.985 |
| HDL [mmol/L] | 64.0 (54.0–70.0) | 64.0 (53.5–69.5) | 66.0 (54.5–71.0) | 0.584 |
| Triglycerides [mmol/L] | 101.5 (87.0–114.5) | 102.5 (84.0–112.5) | 94.0 (88.0–128.0) | 0.895 |
| TG/HDL-c | 1.67 (1.24–1.99) | 1.52 (1.03–1.93) | 1.77 (1.33–2.06) | 0.458 |
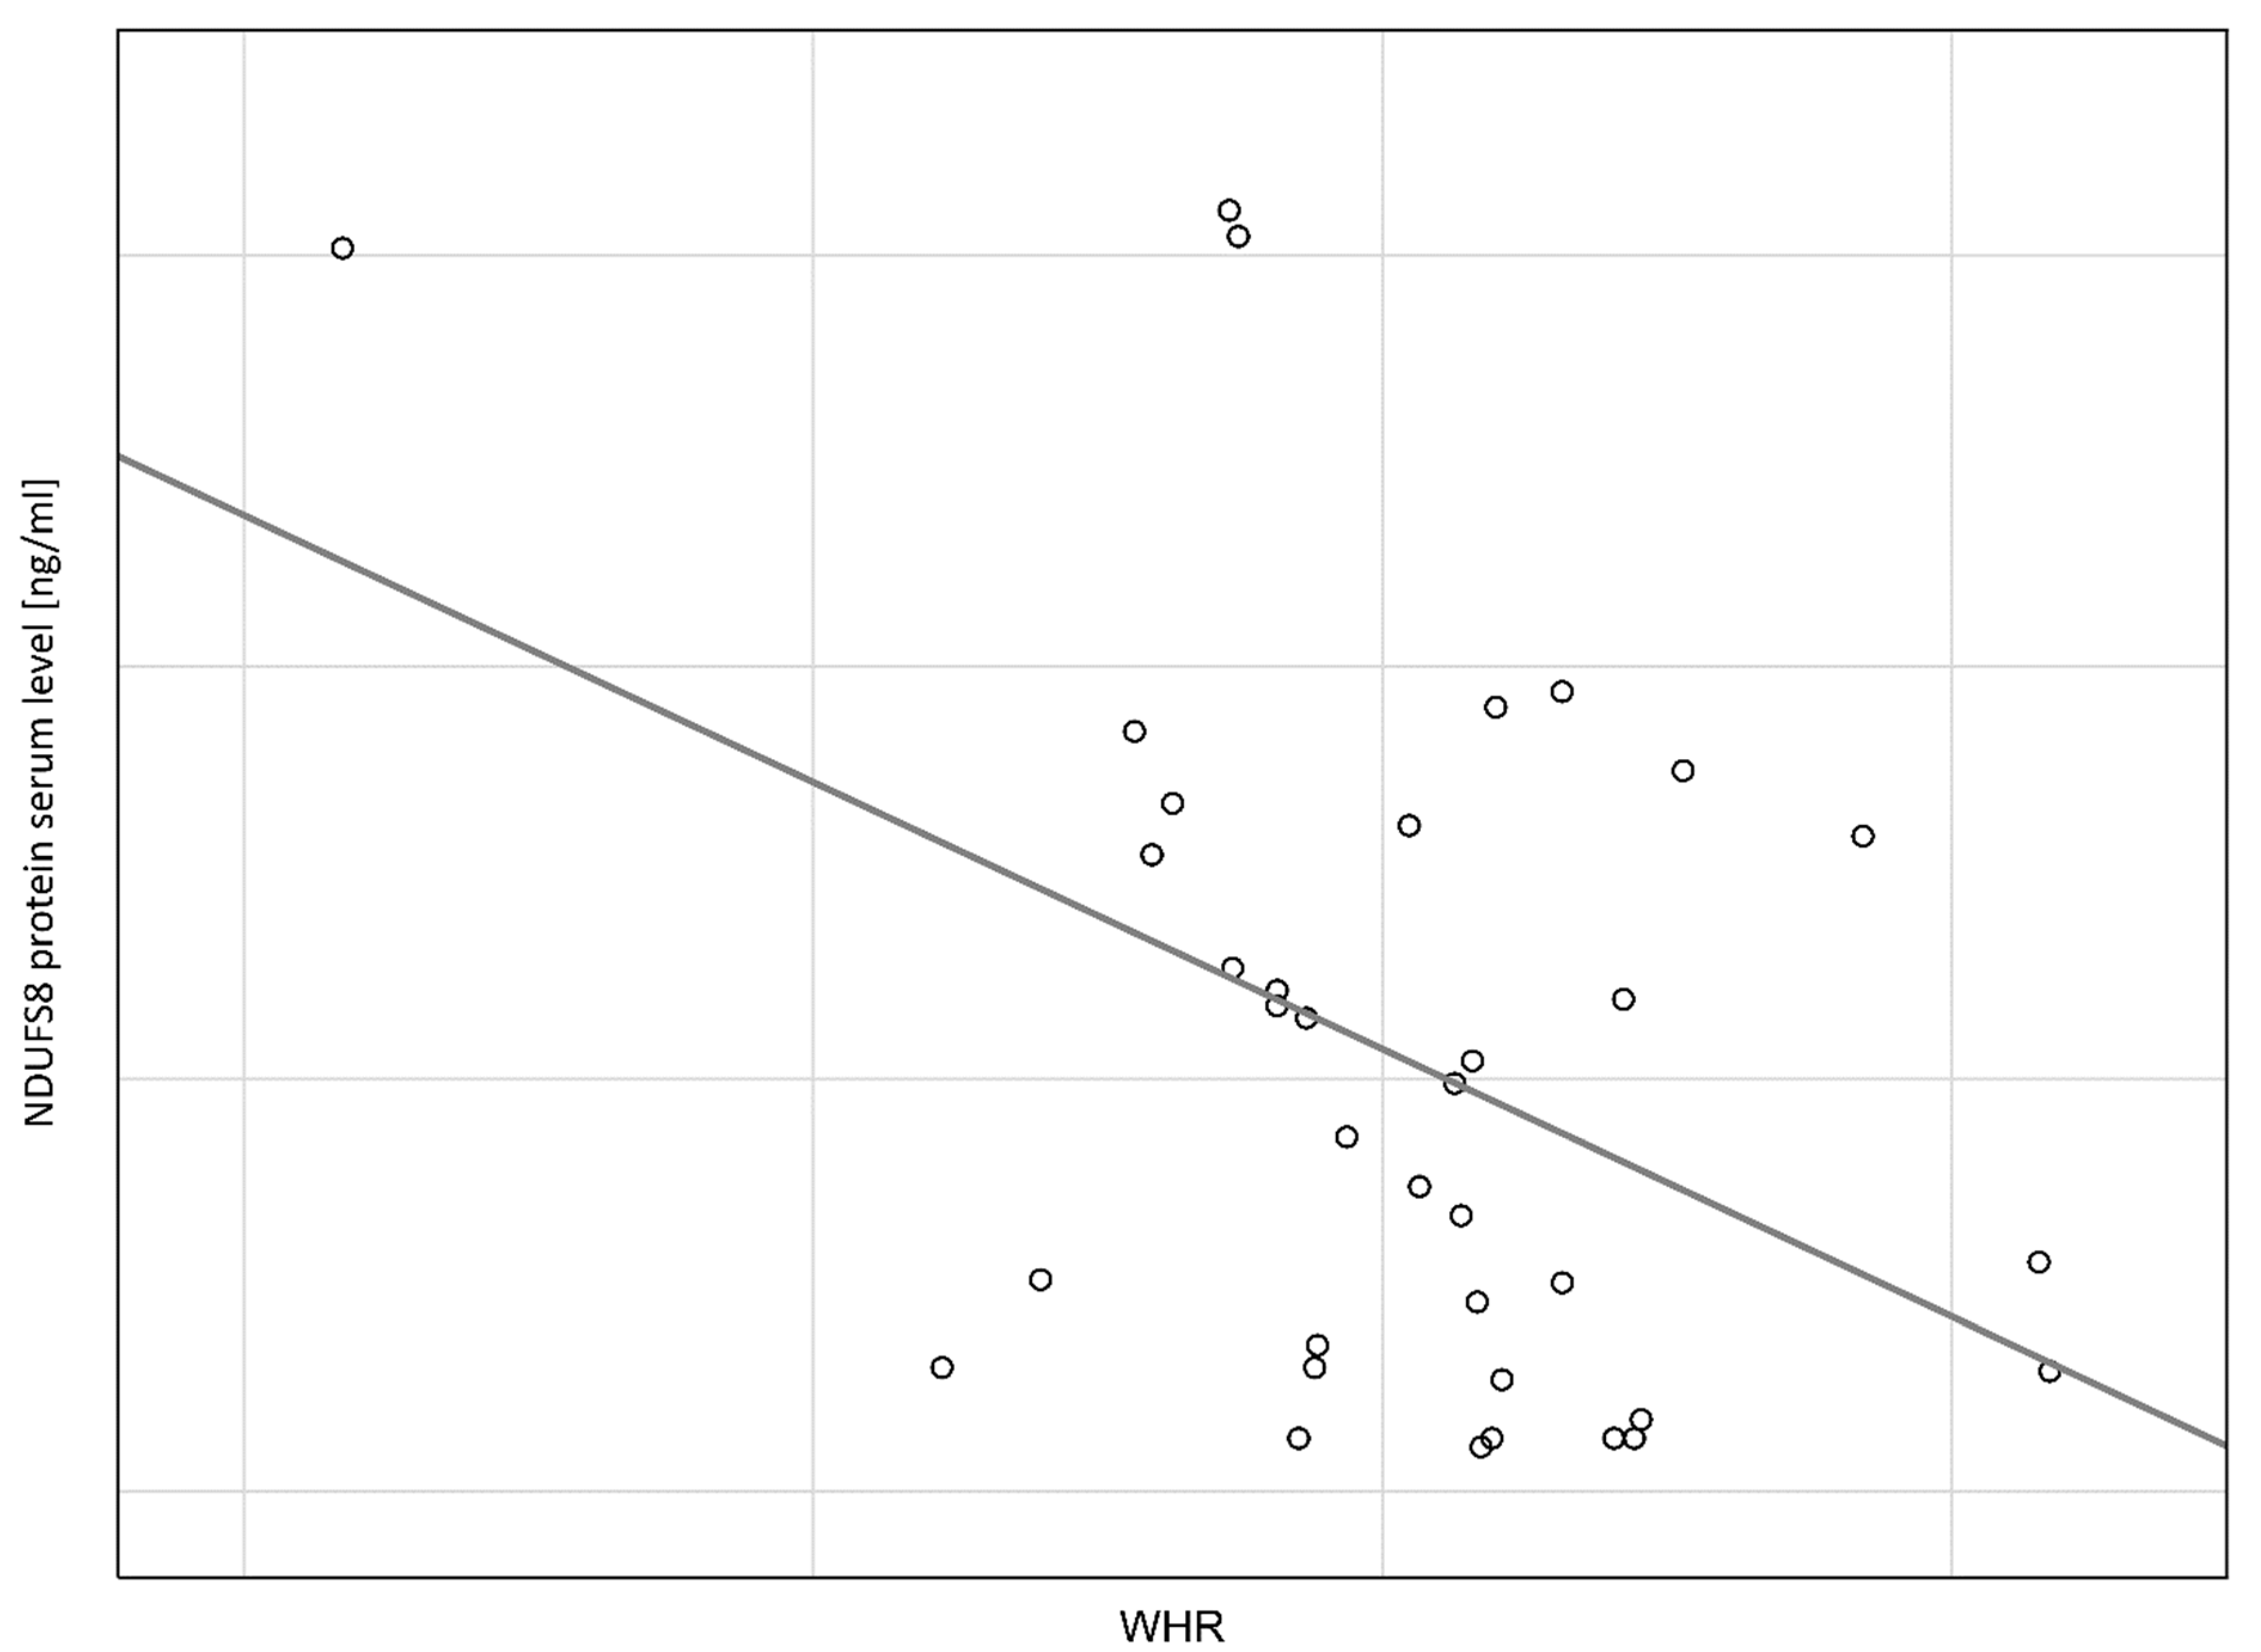
| WHR waist [cm]/hip [cm] | 0.88 (0.83–0.92) | 0.83 (0.79–0.87) | 0.89 (0.86–0.94) | 0.002 |
| NDUFS8 protein [ng/mL] | 2.25 (0.72–3.81) | 2.90 (1.42–4.60) | 1.22 (0.37–2.89) | 0.008 |
| OR (95% CI:). p | AOR (95% CI:). p | |
|---|---|---|
| Age * | 0.91 (0.85–0.98). 0.003 | 0.81 (0.67–0.97). 0.019 |
| Diabetes duration * | 0.93 (0.86–1.02). 0.105 | 0.99 (0.86–1.17). 0.002 |
| Pack–years * | 0.88 (0.69–1.11). 0.150 | 0.54 (0.25–1.18). 0.121 |
| NDUFS8 protein * | 1.71 (1.10–2.67). 0.005 | 2.38 (1.04–5.48). 0.042 |
| N = 36 | b * | Standard Error b * | b | Standard Error b | t (31) | p |
|---|---|---|---|---|---|---|
| Free word | −3.06635 | 1.952344 | −1.57060 | 0.126 | ||
| Age | 0.281414 | 0.205495 | 0.04566 | 0.033343 | 1.36945 | 0.181 |
| Duration of diabetes | −0.030173 | 0.189812 | −0.00747 | 0.046986 | −0.15896 | 0.875 |
| Pack–years | −0.085595 | 0.158055 | −0.00010 | 0.000176 | −0.54155 | 0.592 |
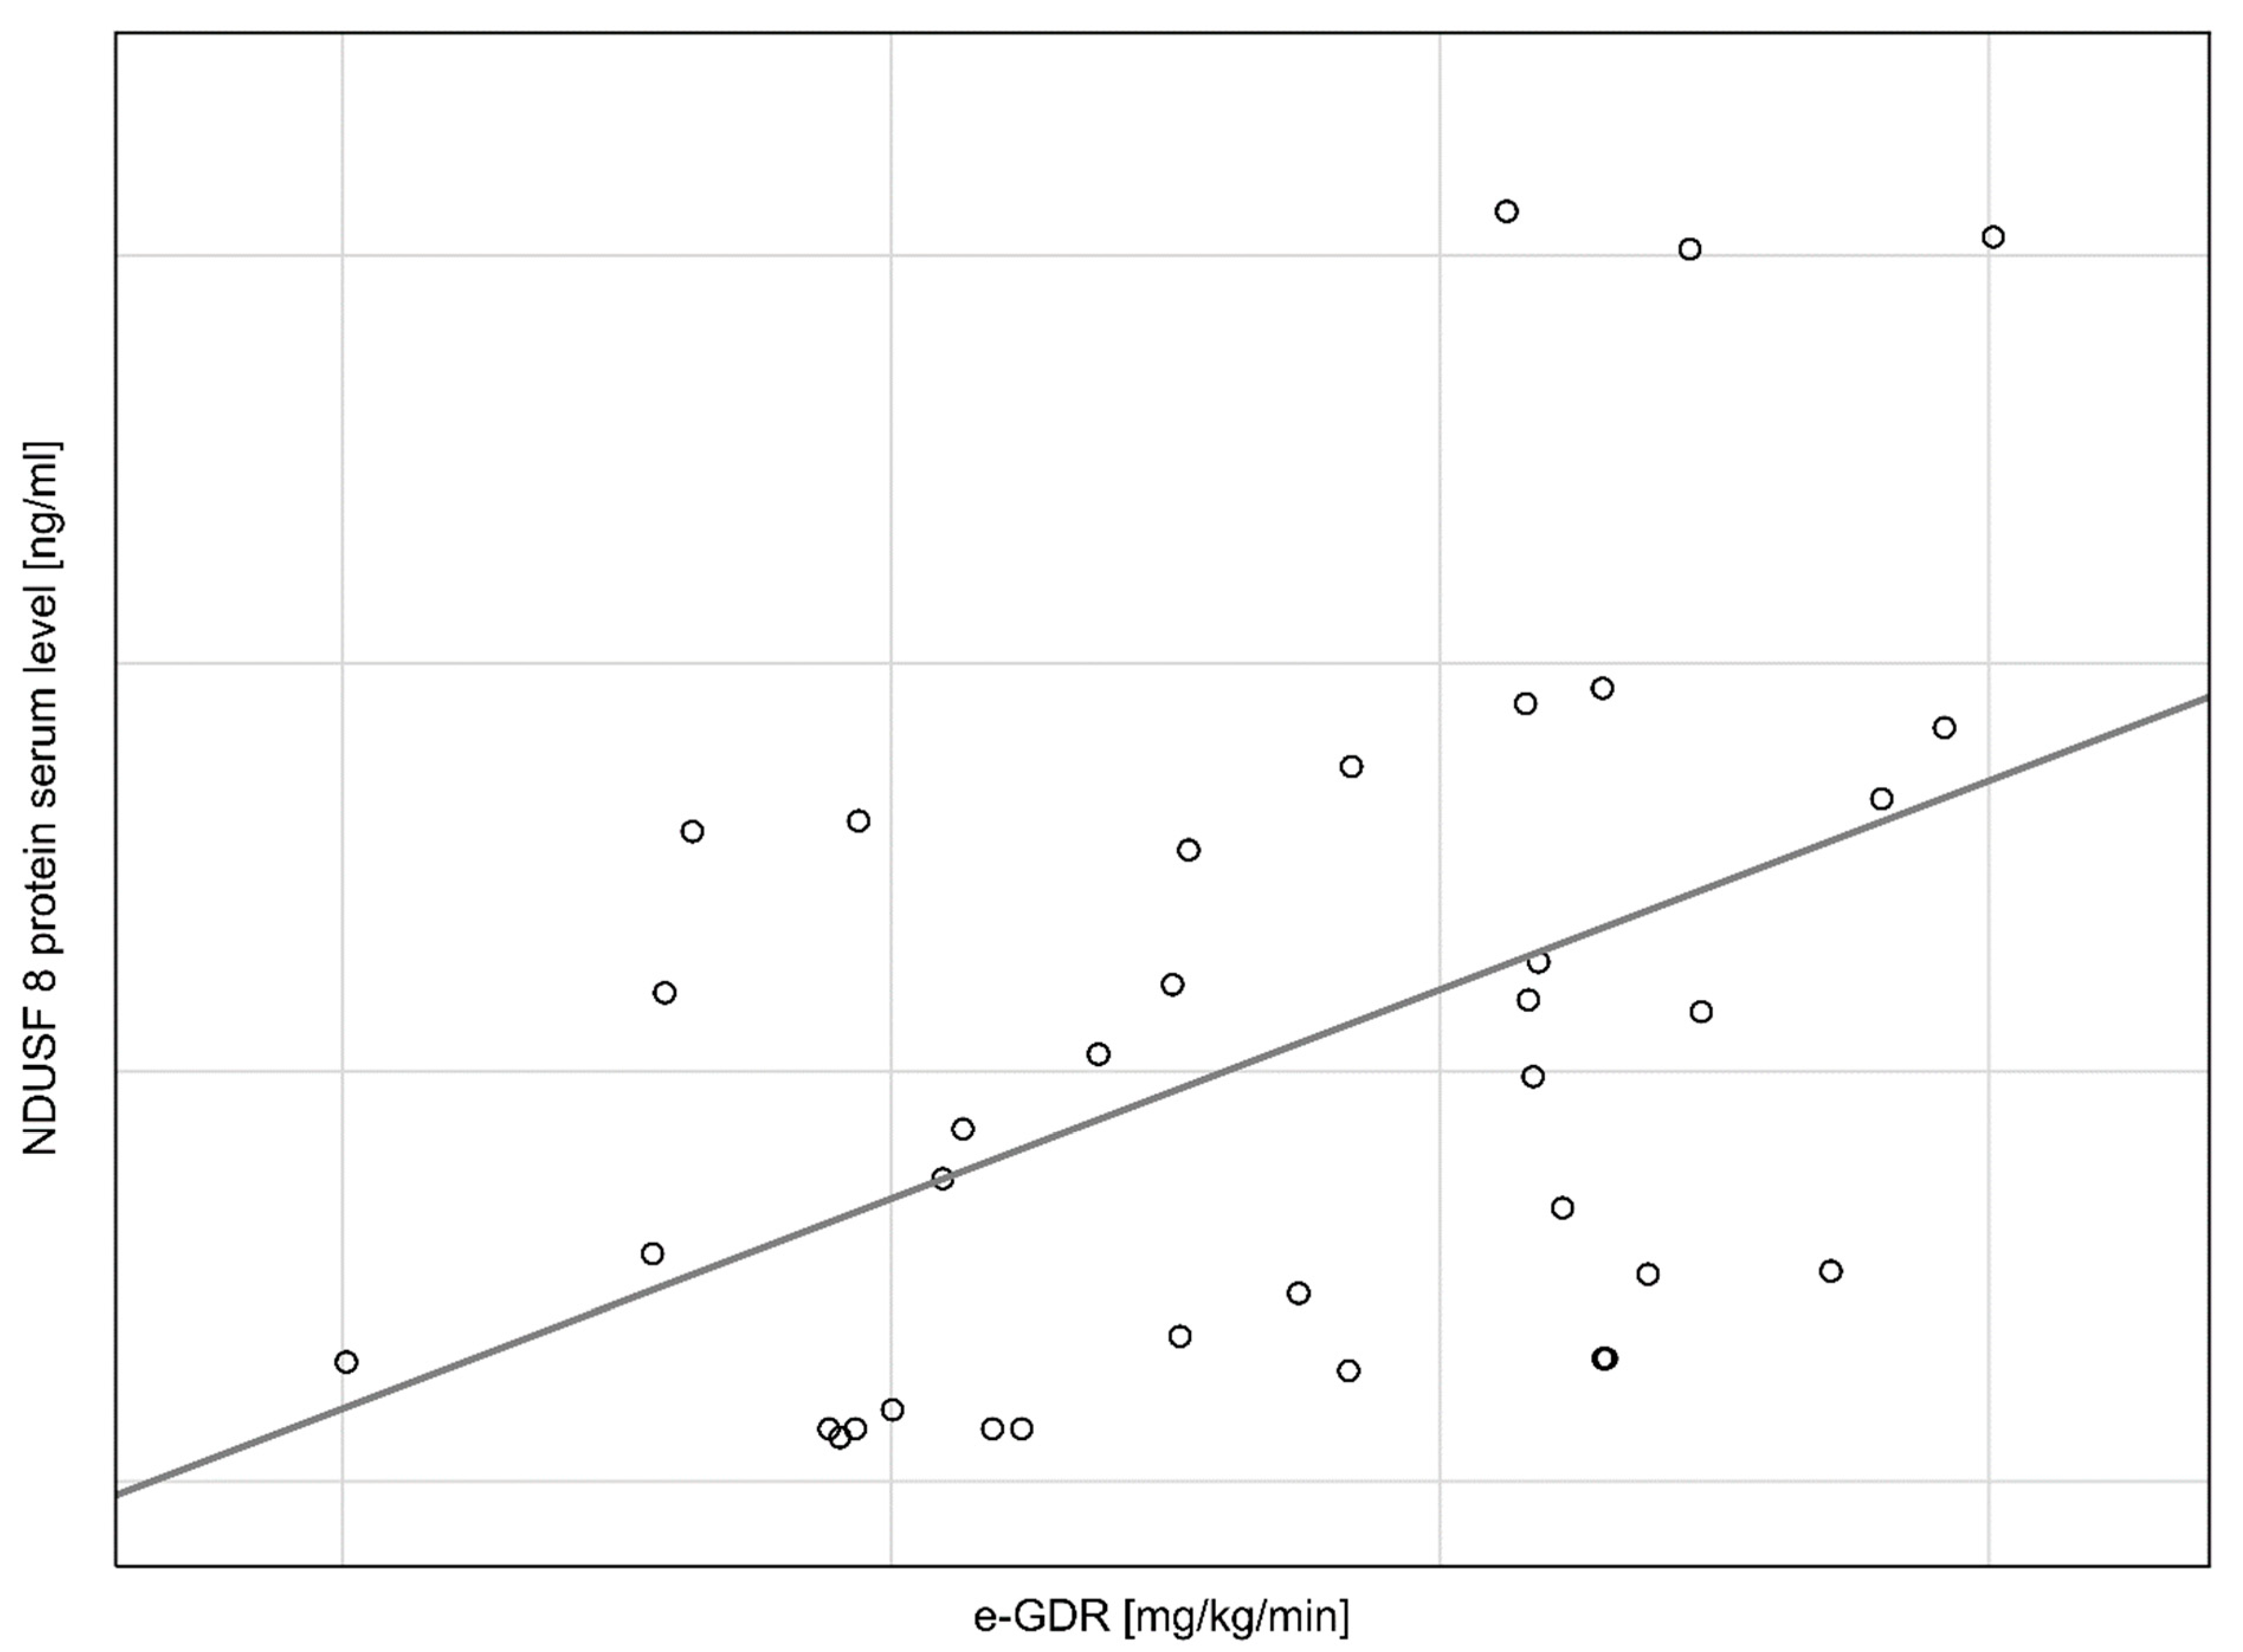
| e-GDR | 0.554108 | 0.173041 | 0.54410 | 0.169915 | 3.20218 | 0.003 |
Publisher’s Note: MDPI stays neutral with regard to jurisdictional claims in published maps and institutional affiliations. |
© 2022 by the authors. Licensee MDPI, Basel, Switzerland. This article is an open access article distributed under the terms and conditions of the Creative Commons Attribution (CC BY) license (https://creativecommons.org/licenses/by/4.0/).
Share and Cite
Flotyńska, J.; Klause, D.; Kulecki, M.; Cieluch, A.; Chomicka-Pawlak, R.; Zozulińska-Ziółkiewicz, D.; Uruska, A. Higher NADH Dehydrogenase [Ubiquinone] Iron–Sulfur Protein 8 (NDUFS8) Serum Levels Correlate with Better Insulin Sensitivity in Type 1 Diabetes. Curr. Issues Mol. Biol. 2022, 44, 3872-3883. https://doi.org/10.3390/cimb44090266
Flotyńska J, Klause D, Kulecki M, Cieluch A, Chomicka-Pawlak R, Zozulińska-Ziółkiewicz D, Uruska A. Higher NADH Dehydrogenase [Ubiquinone] Iron–Sulfur Protein 8 (NDUFS8) Serum Levels Correlate with Better Insulin Sensitivity in Type 1 Diabetes. Current Issues in Molecular Biology. 2022; 44(9):3872-3883. https://doi.org/10.3390/cimb44090266
Chicago/Turabian StyleFlotyńska, Justyna, Daria Klause, Michał Kulecki, Aleksandra Cieluch, Regina Chomicka-Pawlak, Dorota Zozulińska-Ziółkiewicz, and Aleksandra Uruska. 2022. "Higher NADH Dehydrogenase [Ubiquinone] Iron–Sulfur Protein 8 (NDUFS8) Serum Levels Correlate with Better Insulin Sensitivity in Type 1 Diabetes" Current Issues in Molecular Biology 44, no. 9: 3872-3883. https://doi.org/10.3390/cimb44090266
APA StyleFlotyńska, J., Klause, D., Kulecki, M., Cieluch, A., Chomicka-Pawlak, R., Zozulińska-Ziółkiewicz, D., & Uruska, A. (2022). Higher NADH Dehydrogenase [Ubiquinone] Iron–Sulfur Protein 8 (NDUFS8) Serum Levels Correlate with Better Insulin Sensitivity in Type 1 Diabetes. Current Issues in Molecular Biology, 44(9), 3872-3883. https://doi.org/10.3390/cimb44090266