Article

MiR-942-3p as a Potential Prognostic Marker of Gastric Cancer Associated with AR and MAPK/ERK Signaling Pathway

1
School of Electronics and Information Engineering, Hangzhou Dianzi University, Hangzhou 310018, China
2
School of Automation, Hangzhou Dianzi University, Hangzhou 310018, China
3
School of Electronic Engineering and Computer Science, Queen Mary University of London, London E1 4NS, UK
*
Authors to whom correspondence should be addressed.
Curr. Issues Mol. Biol. 2022, 44(9), 3835-3848; https://doi.org/10.3390/cimb44090263
Submission received: 18 July 2022 / Revised: 20 August 2022 / Accepted: 22 August 2022 / Published: 24 August 2022
(This article belongs to the Special Issue Molecules at Play in Cancer)

Abstract

:
Gastric cancer is a common tumor with high morbidity and mortality. MicroRNA (miRNA) can regulate gene expression at the translation level and various tumorigenesis processes, playing an important role in tumor occurrence and prognosis. This study aims to screen miRNA associated with gastric cancer prognosis as biomarkers and explore the regulatory genes and related signaling pathways. In this work, R language was used for the standardization and differential analysis of miRNA and mRNA expression profiles. Samples were randomly divided into a testing group and a training group. Subsequently, we built the five miRNAs (has-miR-9-3p, has-miR-135b-3p, has-miR-143-5p, has-miR-942-3p, has-miR-196-3p) prognostic modules, verified and evaluated their prediction ability by the Cox regression analysis. They can be used as an independent factor in the prognosis of gastric cancer. By predicting and analyzing potential biological functions of the miRNA target genes, this study found that the AR gene was not only a hub gene in the PPI network, but also associated with excessive survival of patients. In conclusion, this study demonstrated that hsa-miR-942-3p could be a potential prognostic marker of gastric cancer associated with the AR and MAPK/ERK signaling pathways. The results of this study provide insights into the occurrence and development of gastric cancer.

Graphical Abstract

1. Introduction

Gastric cancer is one of the most common tumors and its overall survival rate is only about 10% [1]. Some treatments are developing rapidly, including surgery, radiotherapy, chemotherapy, and targeted therapy. However, the recurrence rate and poor prognosis remain a troubling issue. At present, some biomarkers related to the occurrence and prognosis of gastric cancer have been found [2] but their reliability has not been completely verified. Therefore, it is essential to screen new biomarkers or therapeutic targets for the prognosis of gastric cancer patients.
MicroRNA (miRNA) is a non-coding molecule, which can regulate gene expression at the translation level. Some studies have shown that miRNAs regulate various tumorigenesis processes (cell proliferation, cell differentiation, and cell apoptosis) by combining tumor suppressor genes or oncogenes. Yang L et al. found that miR-9-3p was a down-regulated gene of glioma cells. Its low expression resulted in increased levels of Herpud1 that could protect glioma cells from apoptosis [3]. Chen Z et al. showed that miR-143-5p could promote cadmium-induced apoptosis of LLC-PK1 cells by acting on the target gene AKT3 and inhibiting the Akt/Bad signaling pathway [4]. Ma R et al. verified that up-regulated miR-196b could induce a proliferative phenotype, leading to a poor prognosis in glioblastoma patients [5]. Chen M et al. showed that miR-135b could play the role of oncogenes by regulating the PI3K/Akt, HIF-1/FIH, Hippo, p53 signaling pathways, promote tumor cell proliferation, migration, invasion, promote tumor angiogenesis, affect the prognosis of tumor patients, and reduce the total survival and survival time. Moreover, the expression of miR-135b in serum can be used as a biomarker for the diagnosis of a tumor [6]. In addition, miRNA also plays a great role in the treatment of gastric cancer [7]. Lin A et al. concluded that miRNA-449b was associated with the occurrence of gastric cancer and lymph node metastasis [8]. Ma X et al. found that the expression level of miRNA-375 in gastric cancer was related to the degree of tumor differentiation, which could be considered a clinical monitoring target [9]. Han W and Su X found that miRNA-30c showed low expression in gastric cancer tissues and was involved in the occurrence and development of gastric cancer by changing cell proliferation, apoptosis, and cell cycle [10]. With this in mind, the studies of miRNA in gastric cancer still need to be pushed forward and further investigated.
In this study, we constructed, validated, and evaluated five miRNAs and the results showed that they could be used as independent prognostic factors in gastric cancer. More importantly, we detected the target gene AR of hsa-miR-942-3p which was the core target gene and closely related to the prognosis and survival of gastric cancer patients. In short, hsa-miR-942-3p may be a potential prognostic marker of gastric cancer related to the AR and mitogen-activated protein kinase (MAPK)/extracellular signal-regulated kinase (ERK) signaling pathways.

2. Materials and Methods

2.1. Data Downloading and Processing

The miRNA and mRNA profiles data were gained from The Cancer Genome Atlas (TCGA) database (https://www.cancer.gov, accessed on 20 August 2022 (Table 1). The miRNA expression profiles included 45 normal and 446 tumor samples, and the mRNA expression profiles included 32 normal and 375 tumor samples. Clinical information (443) for all gastric cancer samples was also downloaded (Table 2).

2.2. Detection of Differentially Expressed miRNAs and mRNA Combined with Clinical Information

Standardization and differential analysis of expression profiles were performed using R language (p < 0.05 and |logFC| > 1.0) [11]. Thereafter, clinical information on patients was combined with the disposed of miRNAs and mRNAs.

2.3. Construction of Sample Grouping and Prognostic Module

Samples were divided into training group and testing group randomly by R language package. Univariate Cox regression analysis was used to detect the miRNAs with p < 0.05 in the training group. Multivariate Cox regression was used to build the miRNA module prognostic biomarkers with different overall survival [12]. Then, we established the risk score of a prognostic miRNA signature and detected the Proportional Hazards Assumption of the Cox module. The module was used to assess the survival prognosis of patients in three groups by the Kaplan–Meier curve. Log-rank tests were classified into a high-risk and low-risk group according to the risk score of the median value grouping. R language (“survivalROC” package) was used to evaluate miRNA predictive power by receiver operating characteristic (ROC) curve [13].

2.4. Independent Prognostic Ability of miRNA

The univariate Cox regression was analyzed to test the relationship between the prognostic miRNA and the overall survival of patients in the training group. Clinical factors were also analyzed by multivariate Cox regression to serve as independent prognostic elements.

2.5. miRNA Target Genes Prediction and Functions Analysis

The miRNA information was downloaded from three prediction databases (targetScan, miRTarBase, and miRDB). The target genes of miRNA were obtained and crosschecked in at least two databases. Using the Cytoscape and Venn software to draw the relation between miRNAs and the target genes. Differentially expressed genes (DEGs) and target genes were taken at the intersection to test whether these target genes were involved in the progression of gastric cancer. Kyoto Encyclopedia of Genes and Genomes (KEGG) enrichment pathway and Gene Ontology (GO) analysis displayed the potential function of all the intersection genes through R language (“org.Hs.eg.db” package and “clusterProfiler” package) [14].

2.6. Screening Core Target Genes and Survival Analysis

The protein–protein interaction (PPI) network between the target genes was obtained from STRING websites [15] while the medium confidence is 0.400. Then, the top ten hub genes were detected through Cytoscape plug-in CytoHubba. In addition, Kaplan–Meier curves were used to detect whether the intersection genes showed a relationship with overall survival.

3. Results

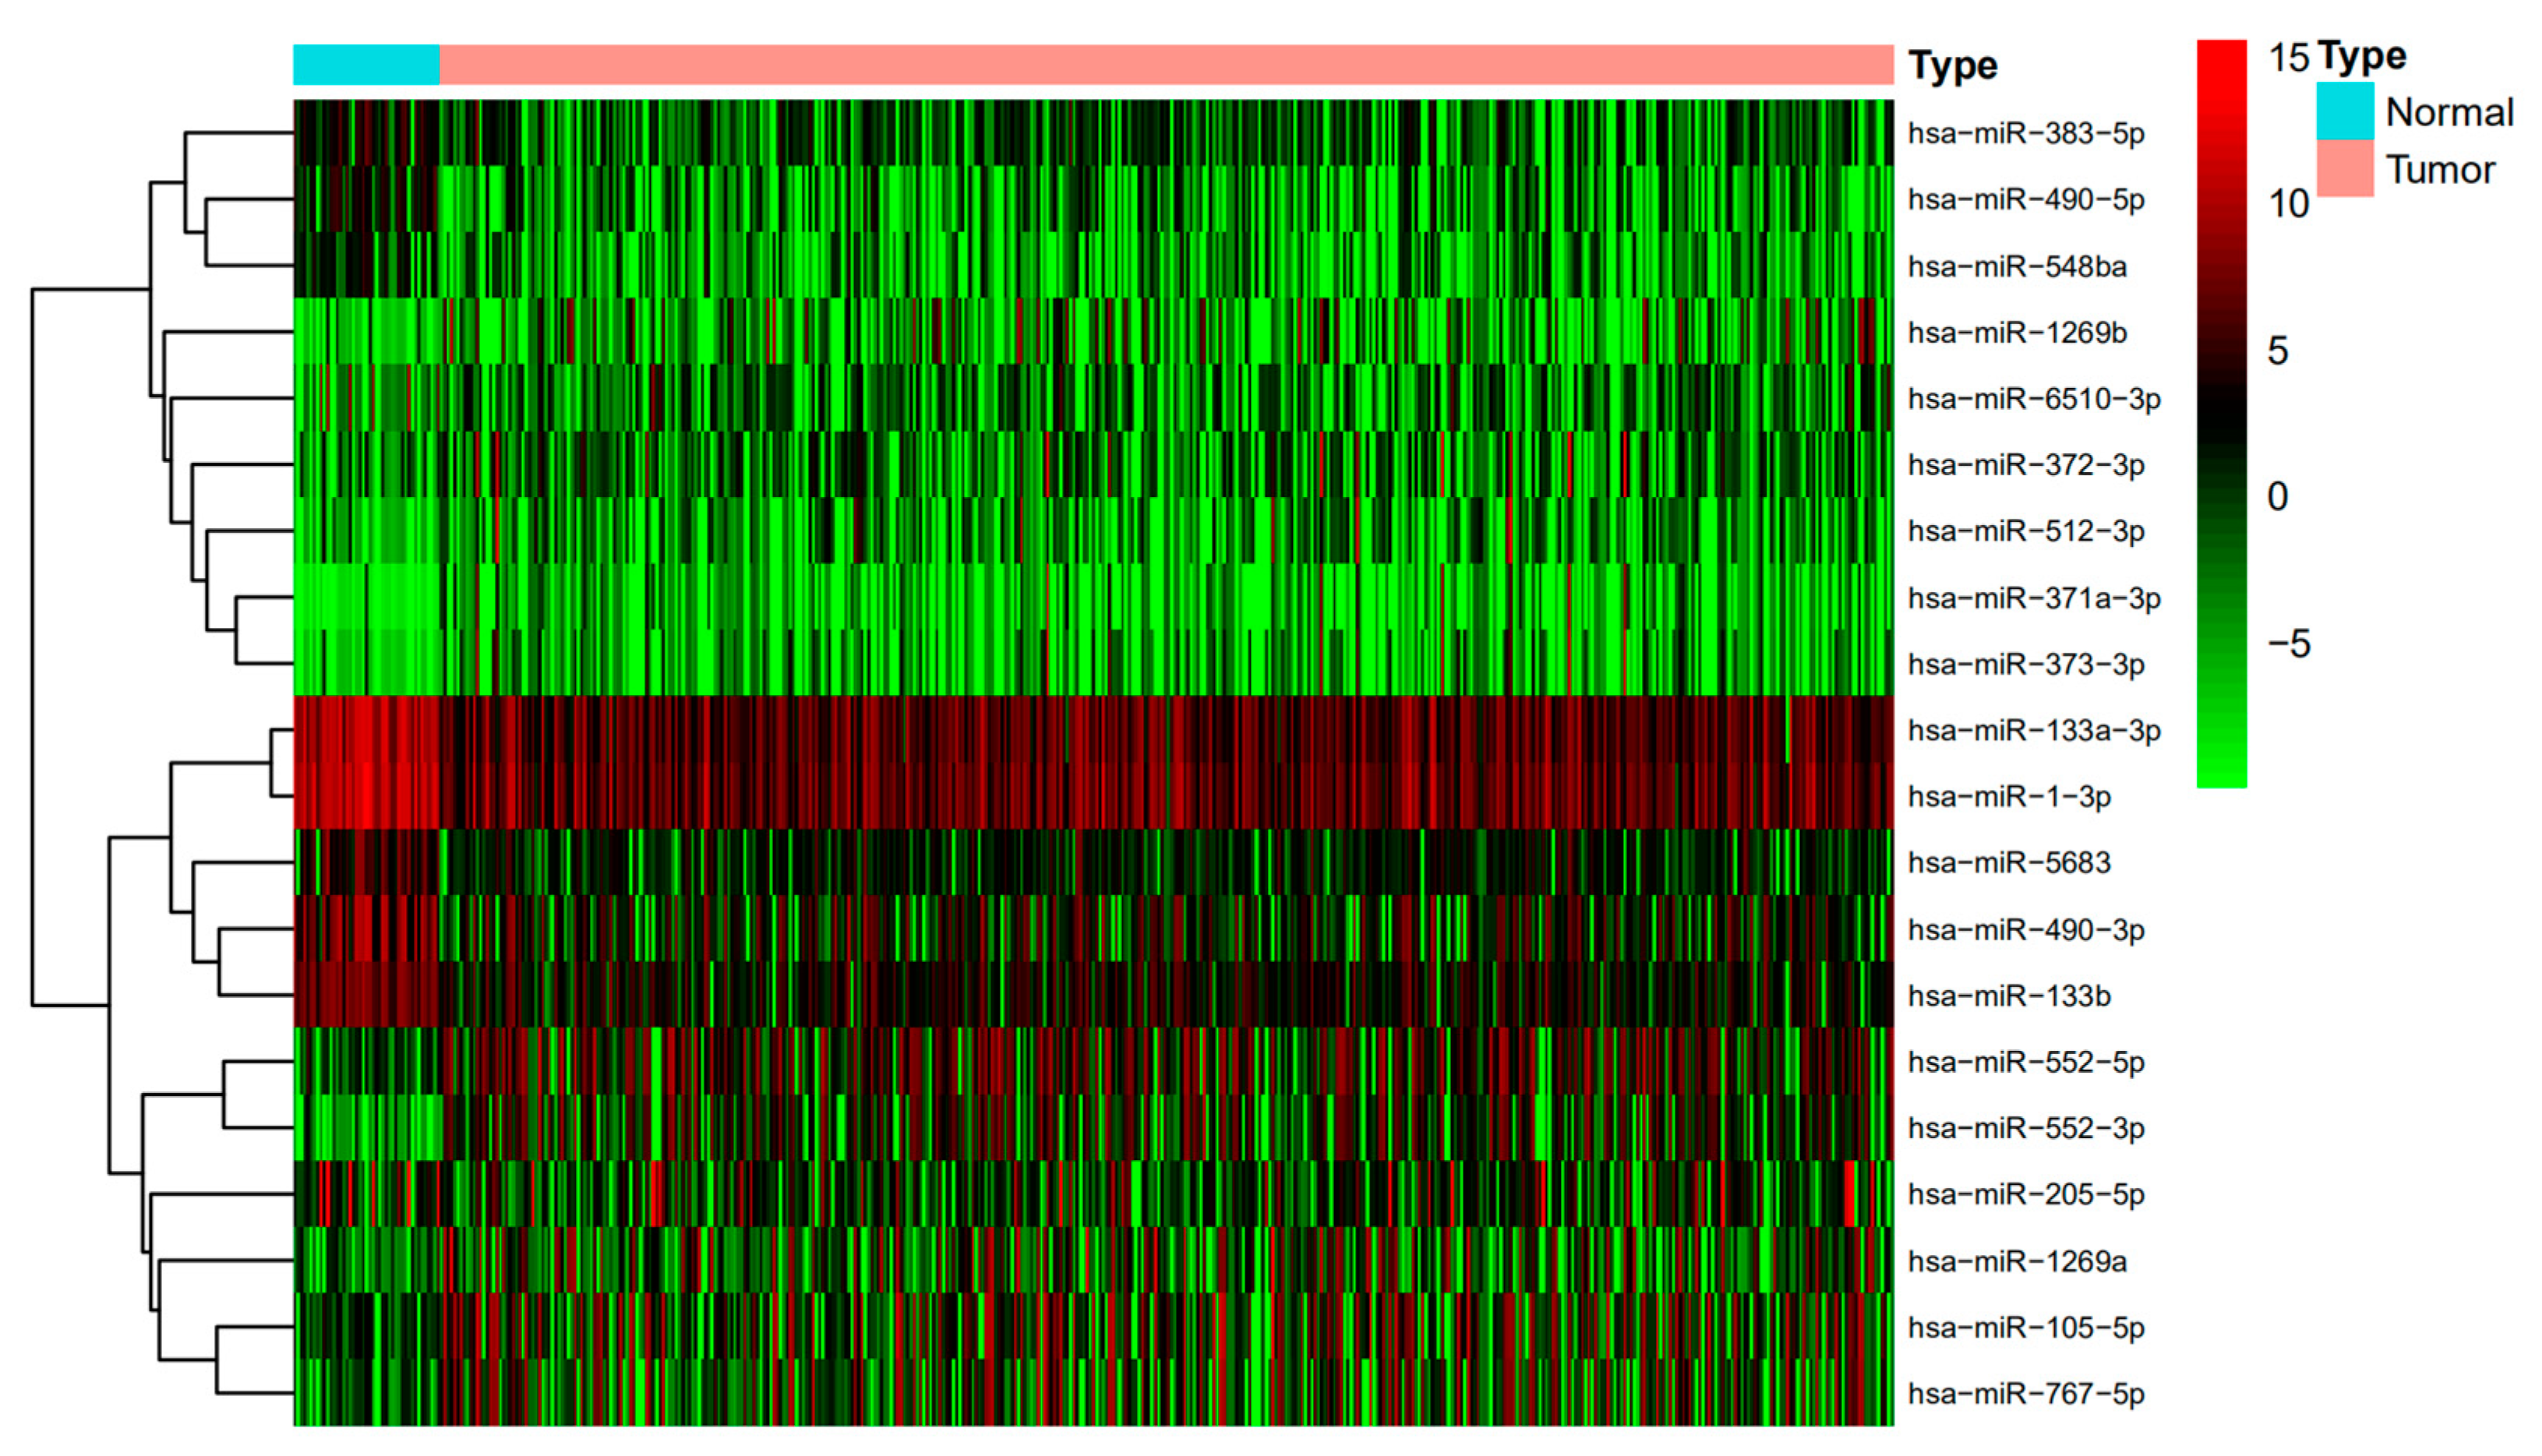
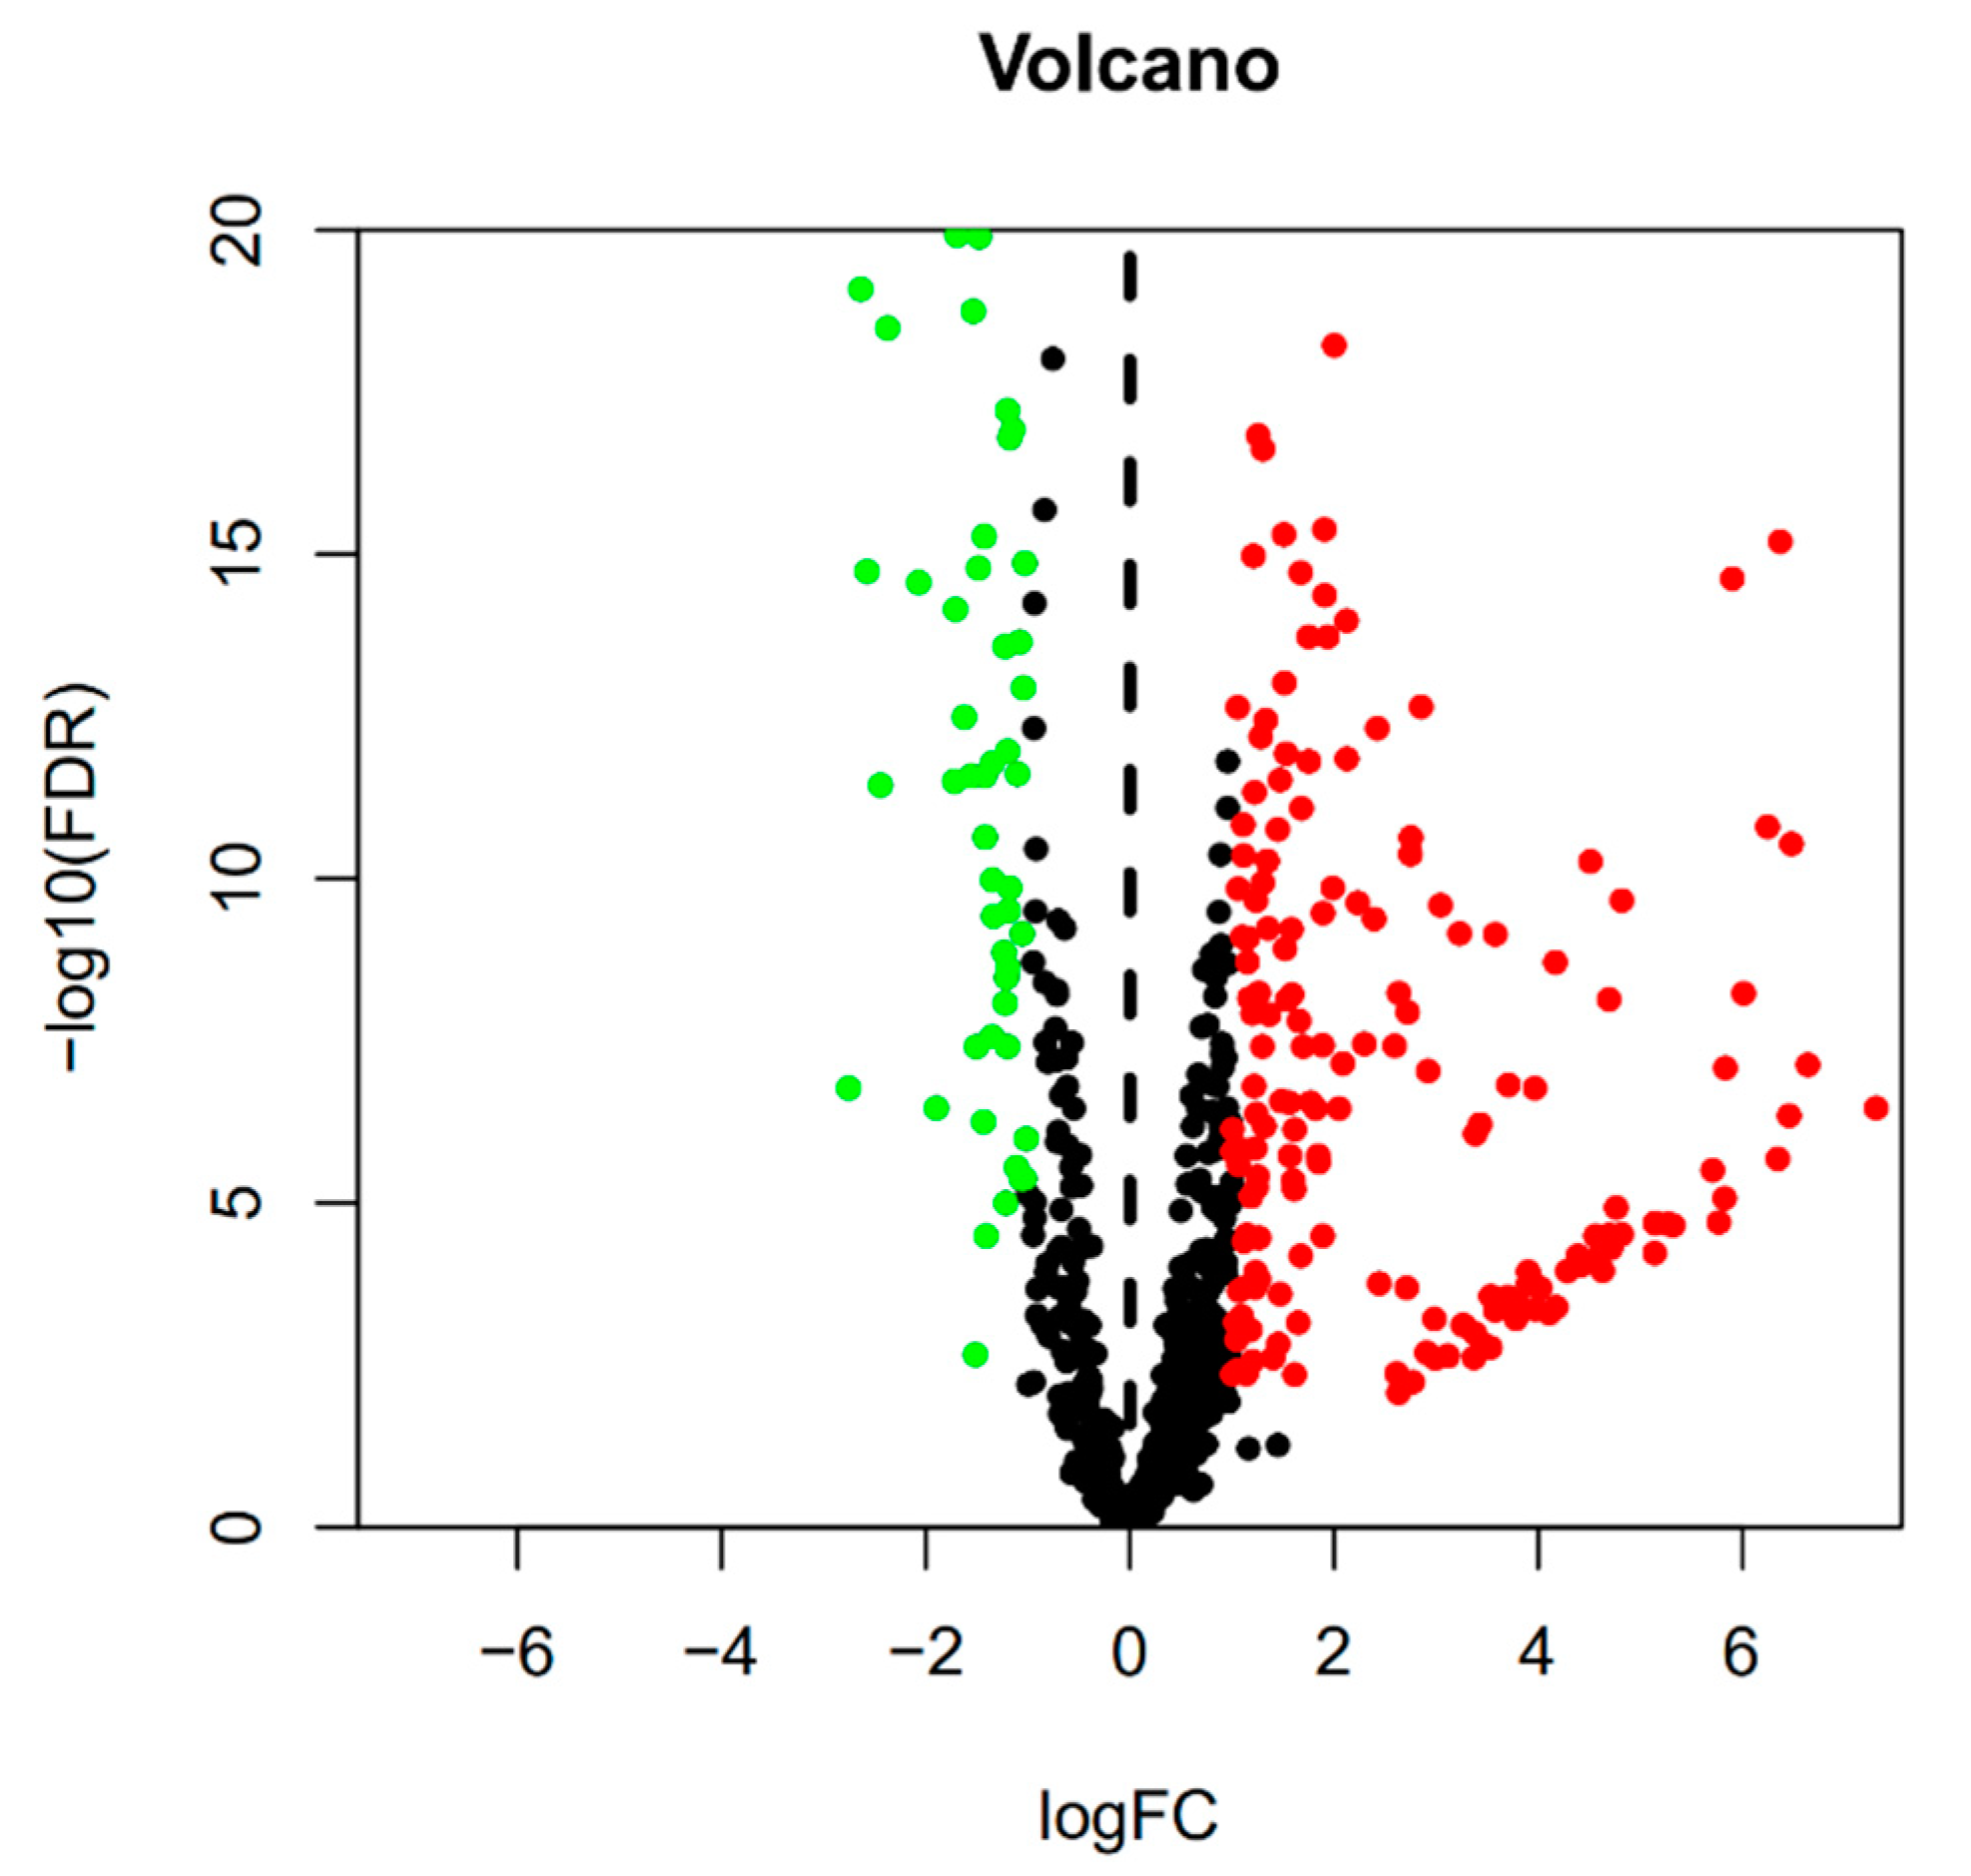
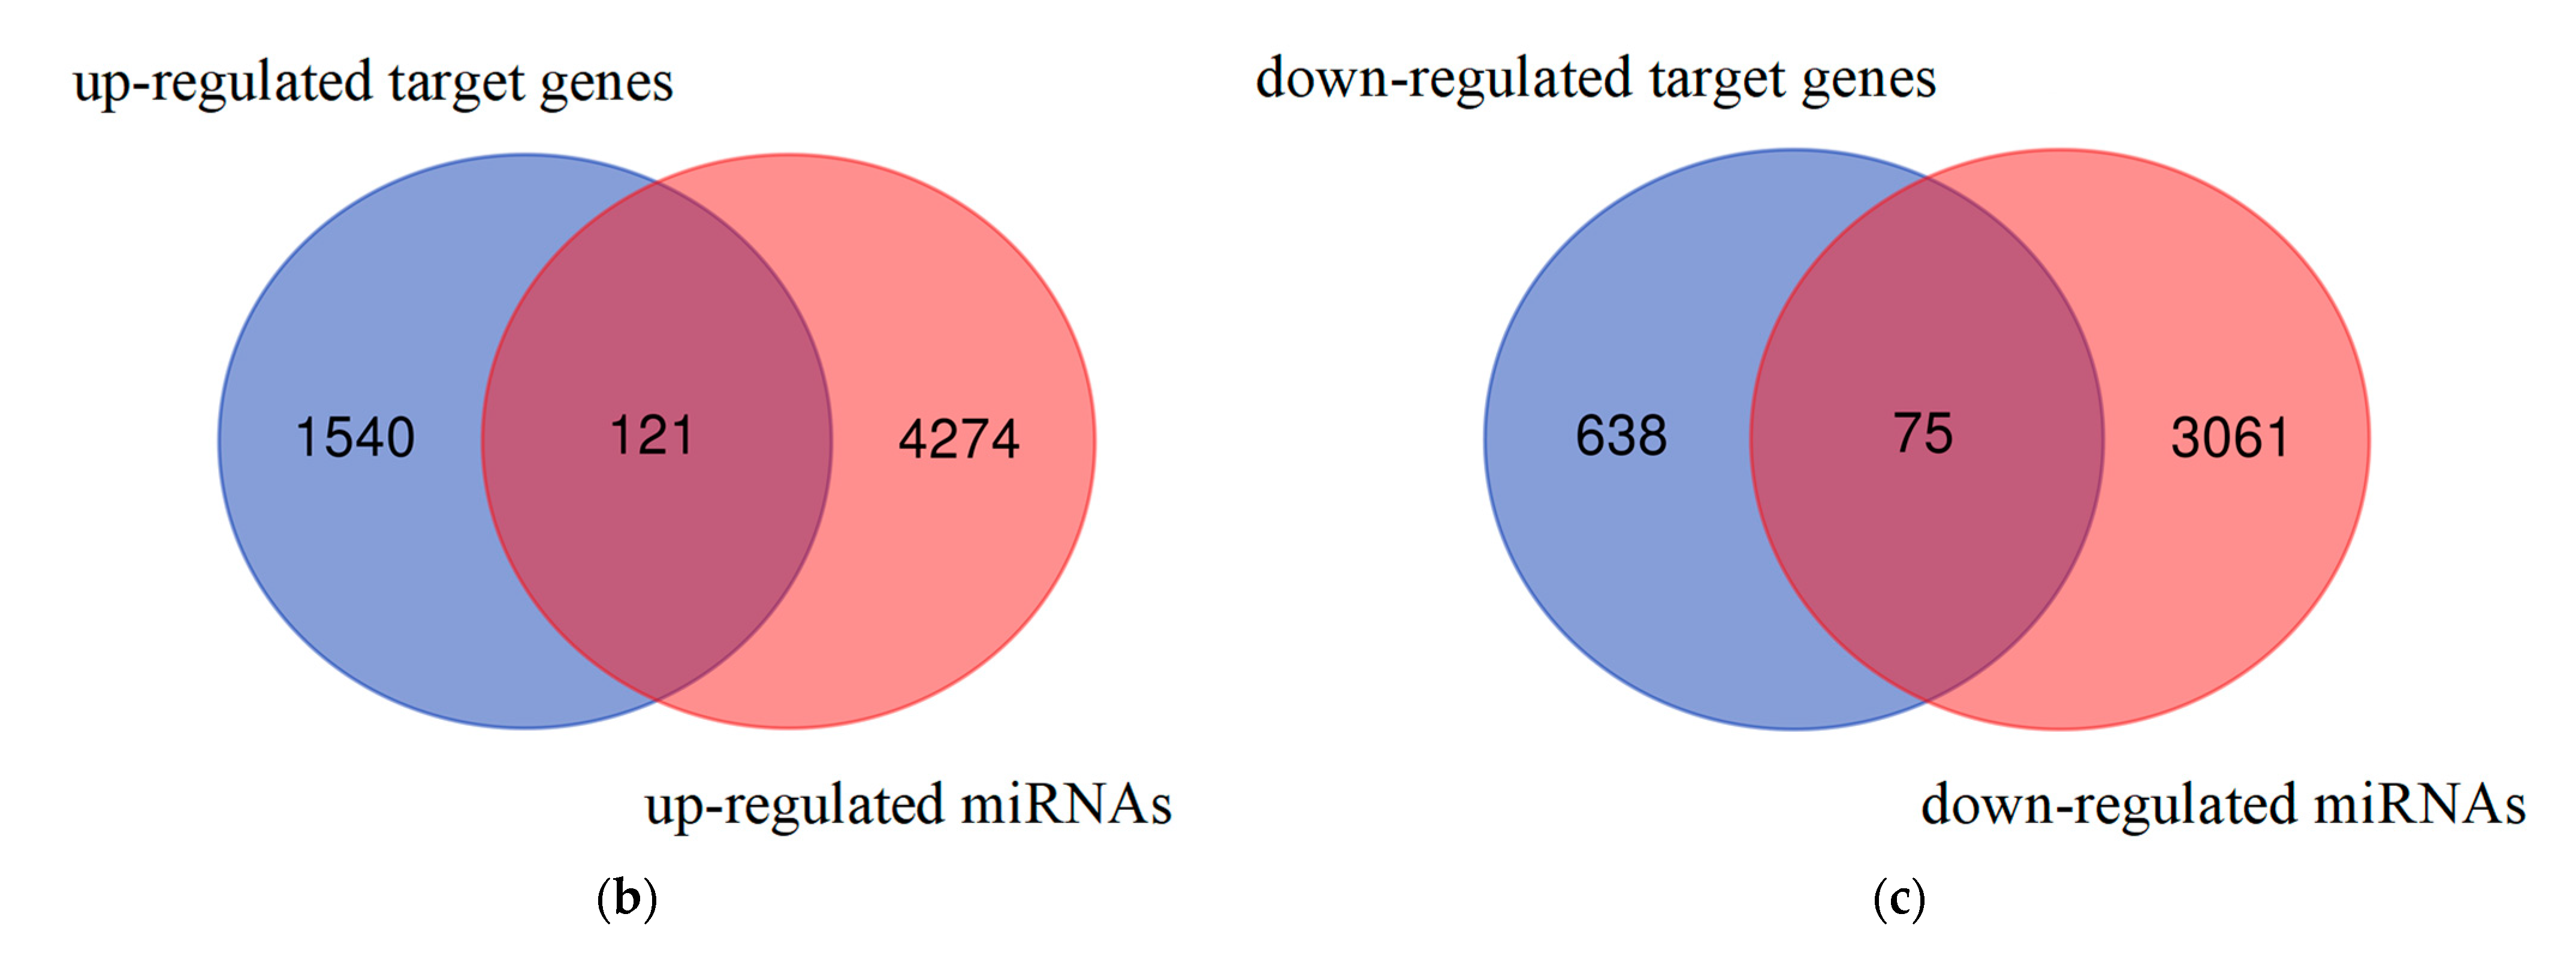
3.1. Detection of Differentially Expressed miRNAs and Differentially Expressed mRNAs

The miRNA expression profiles displayed 267 differentially expressed miRNAs (DEmiRNAs) (185 up-regulated and 82 down-regulated) (Figure 1 and Figure 2). The mRNA expression profiles displayed 7531 differentially expressed mRNAs (DEmRNAs) (4395 up-regulated and 3136 down-regulated) (adjust p-value < 0.05 and |logFC| > 1.0).

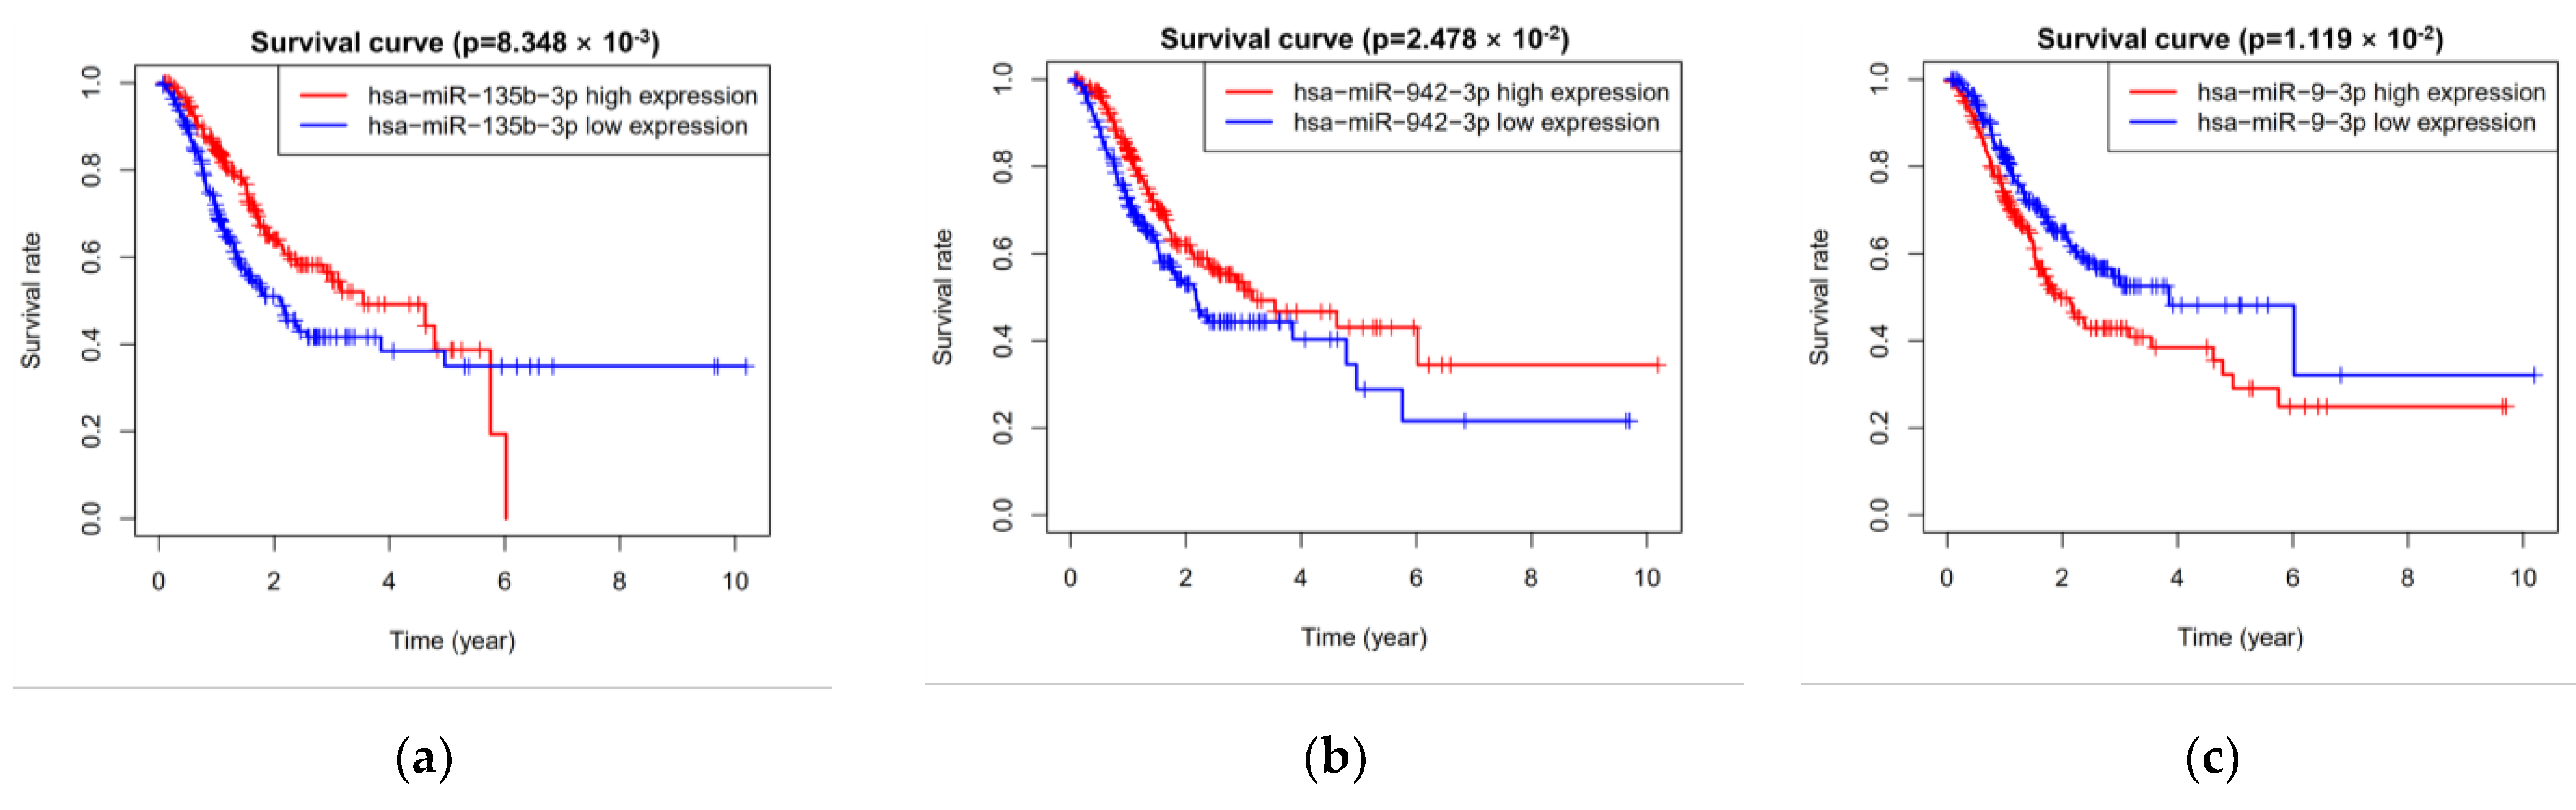
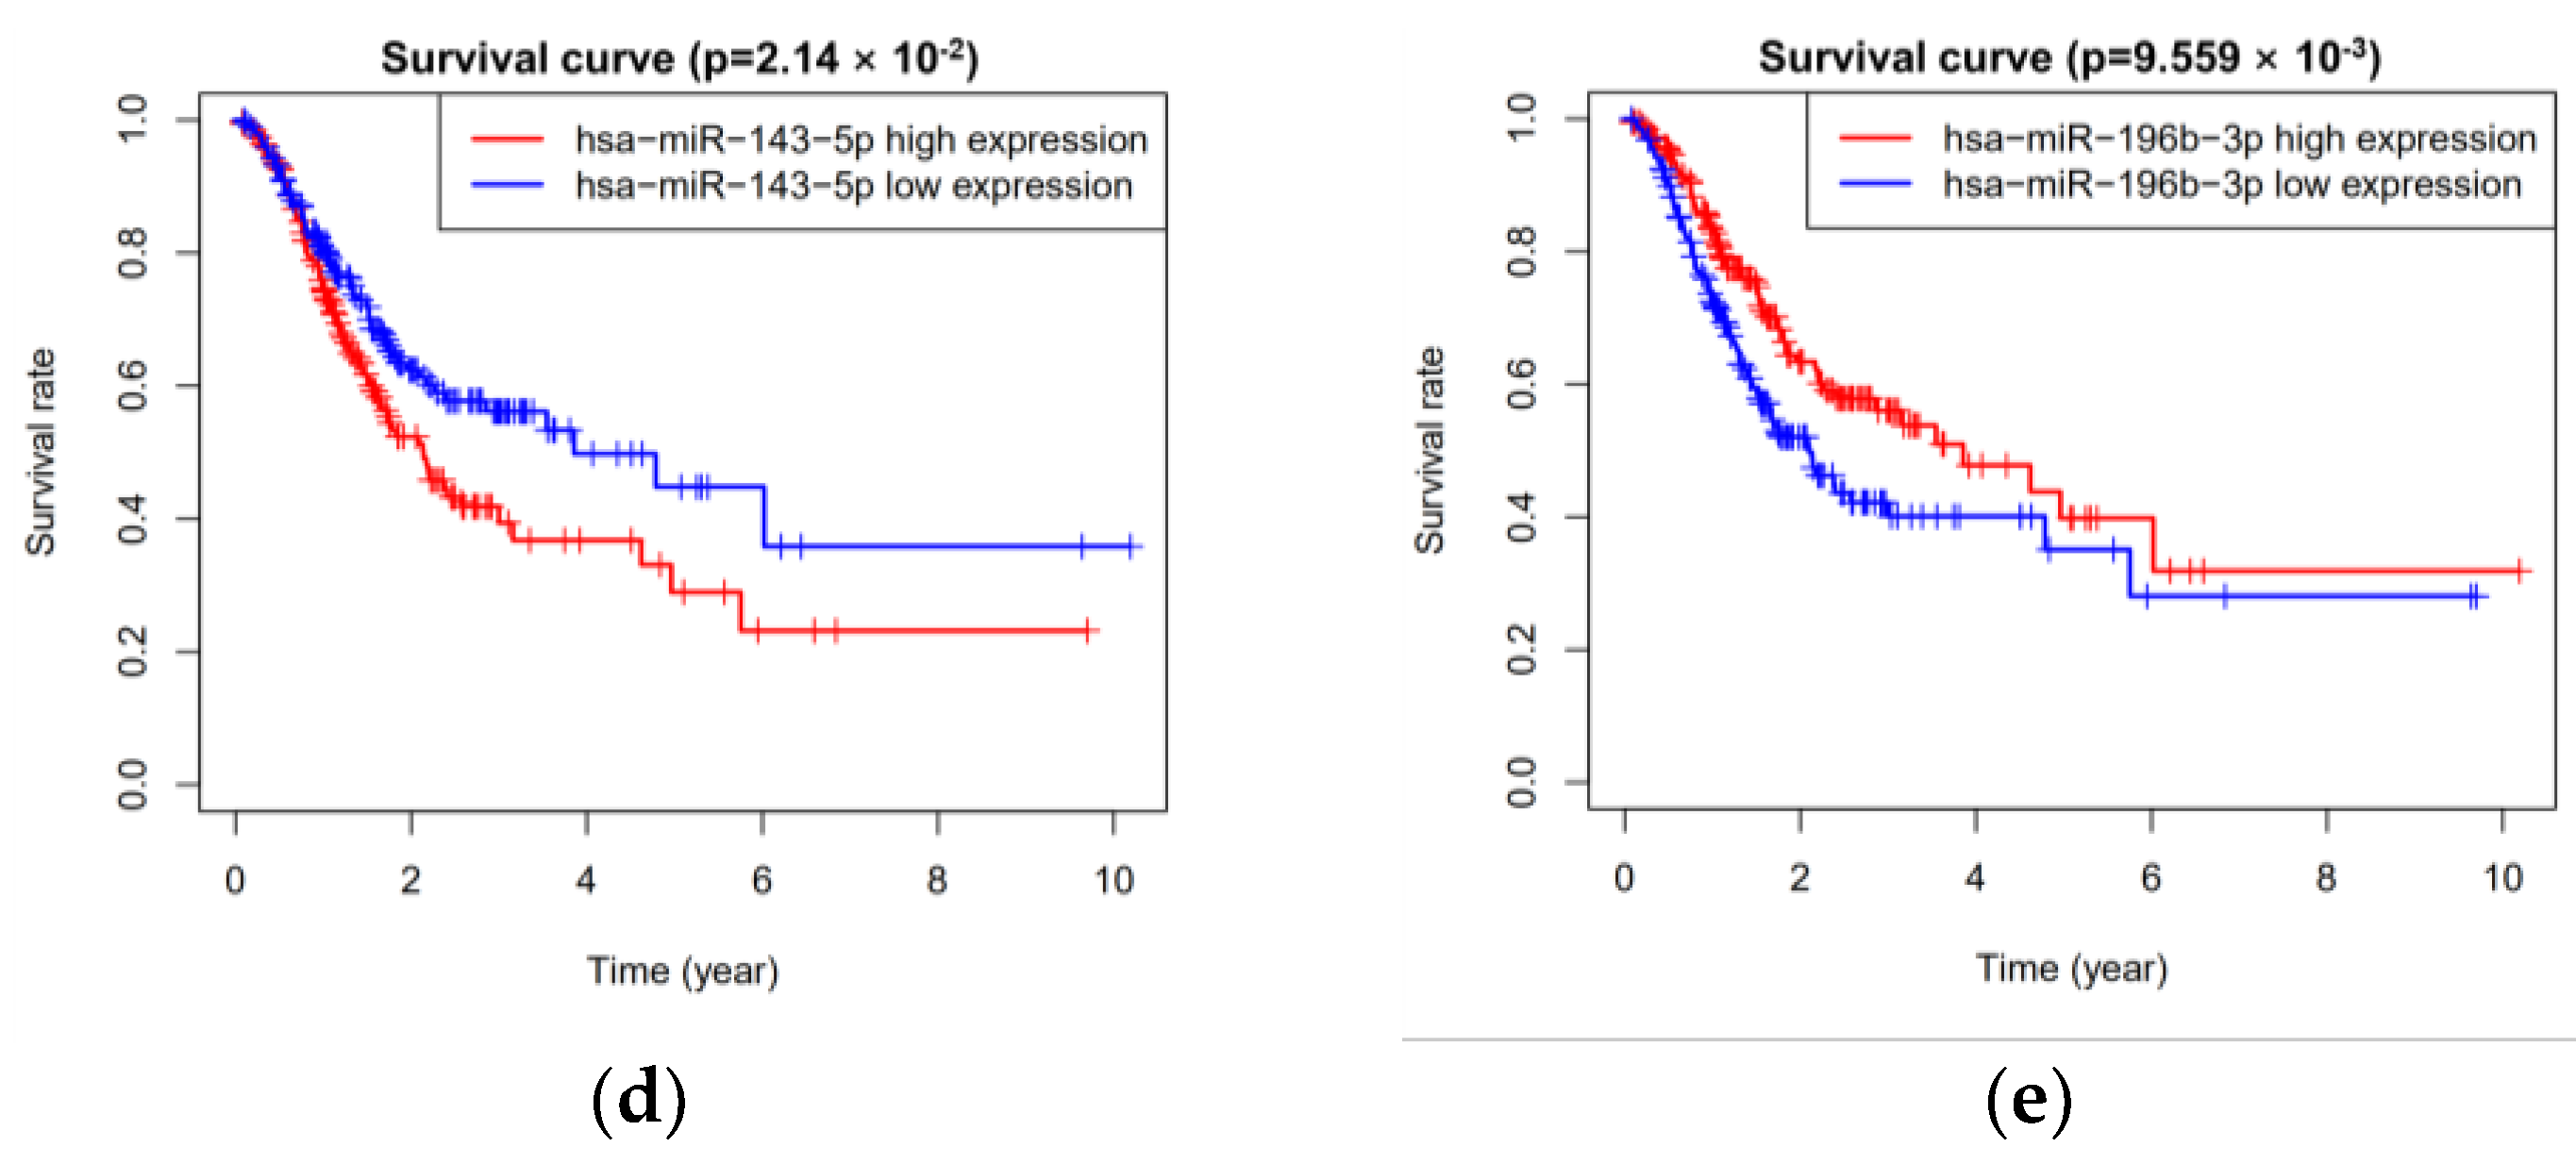
3.2. Five miRNAs Associated with Overall Survival

All 389 groups (miRNA expression profiles) were divided into training group (196) and testing group (193) randomly. Univariate Cox regression analysis revealed that fifteen miRNAs were related to overall survival in the training group. Multivariate Cox regression analysis selected five miRNAs (hsa-miR-9-3p, hsa-miR-135b-3p, hsa-miR-143-5p, hsa-miR-942-3p, and hsa-miR-196b-3p) from the fifteen miRNAs finally (Table 3). Besides, the Kaplan–Meier curve also showed that the five miRNAs were related to overall survival (Figure 3).

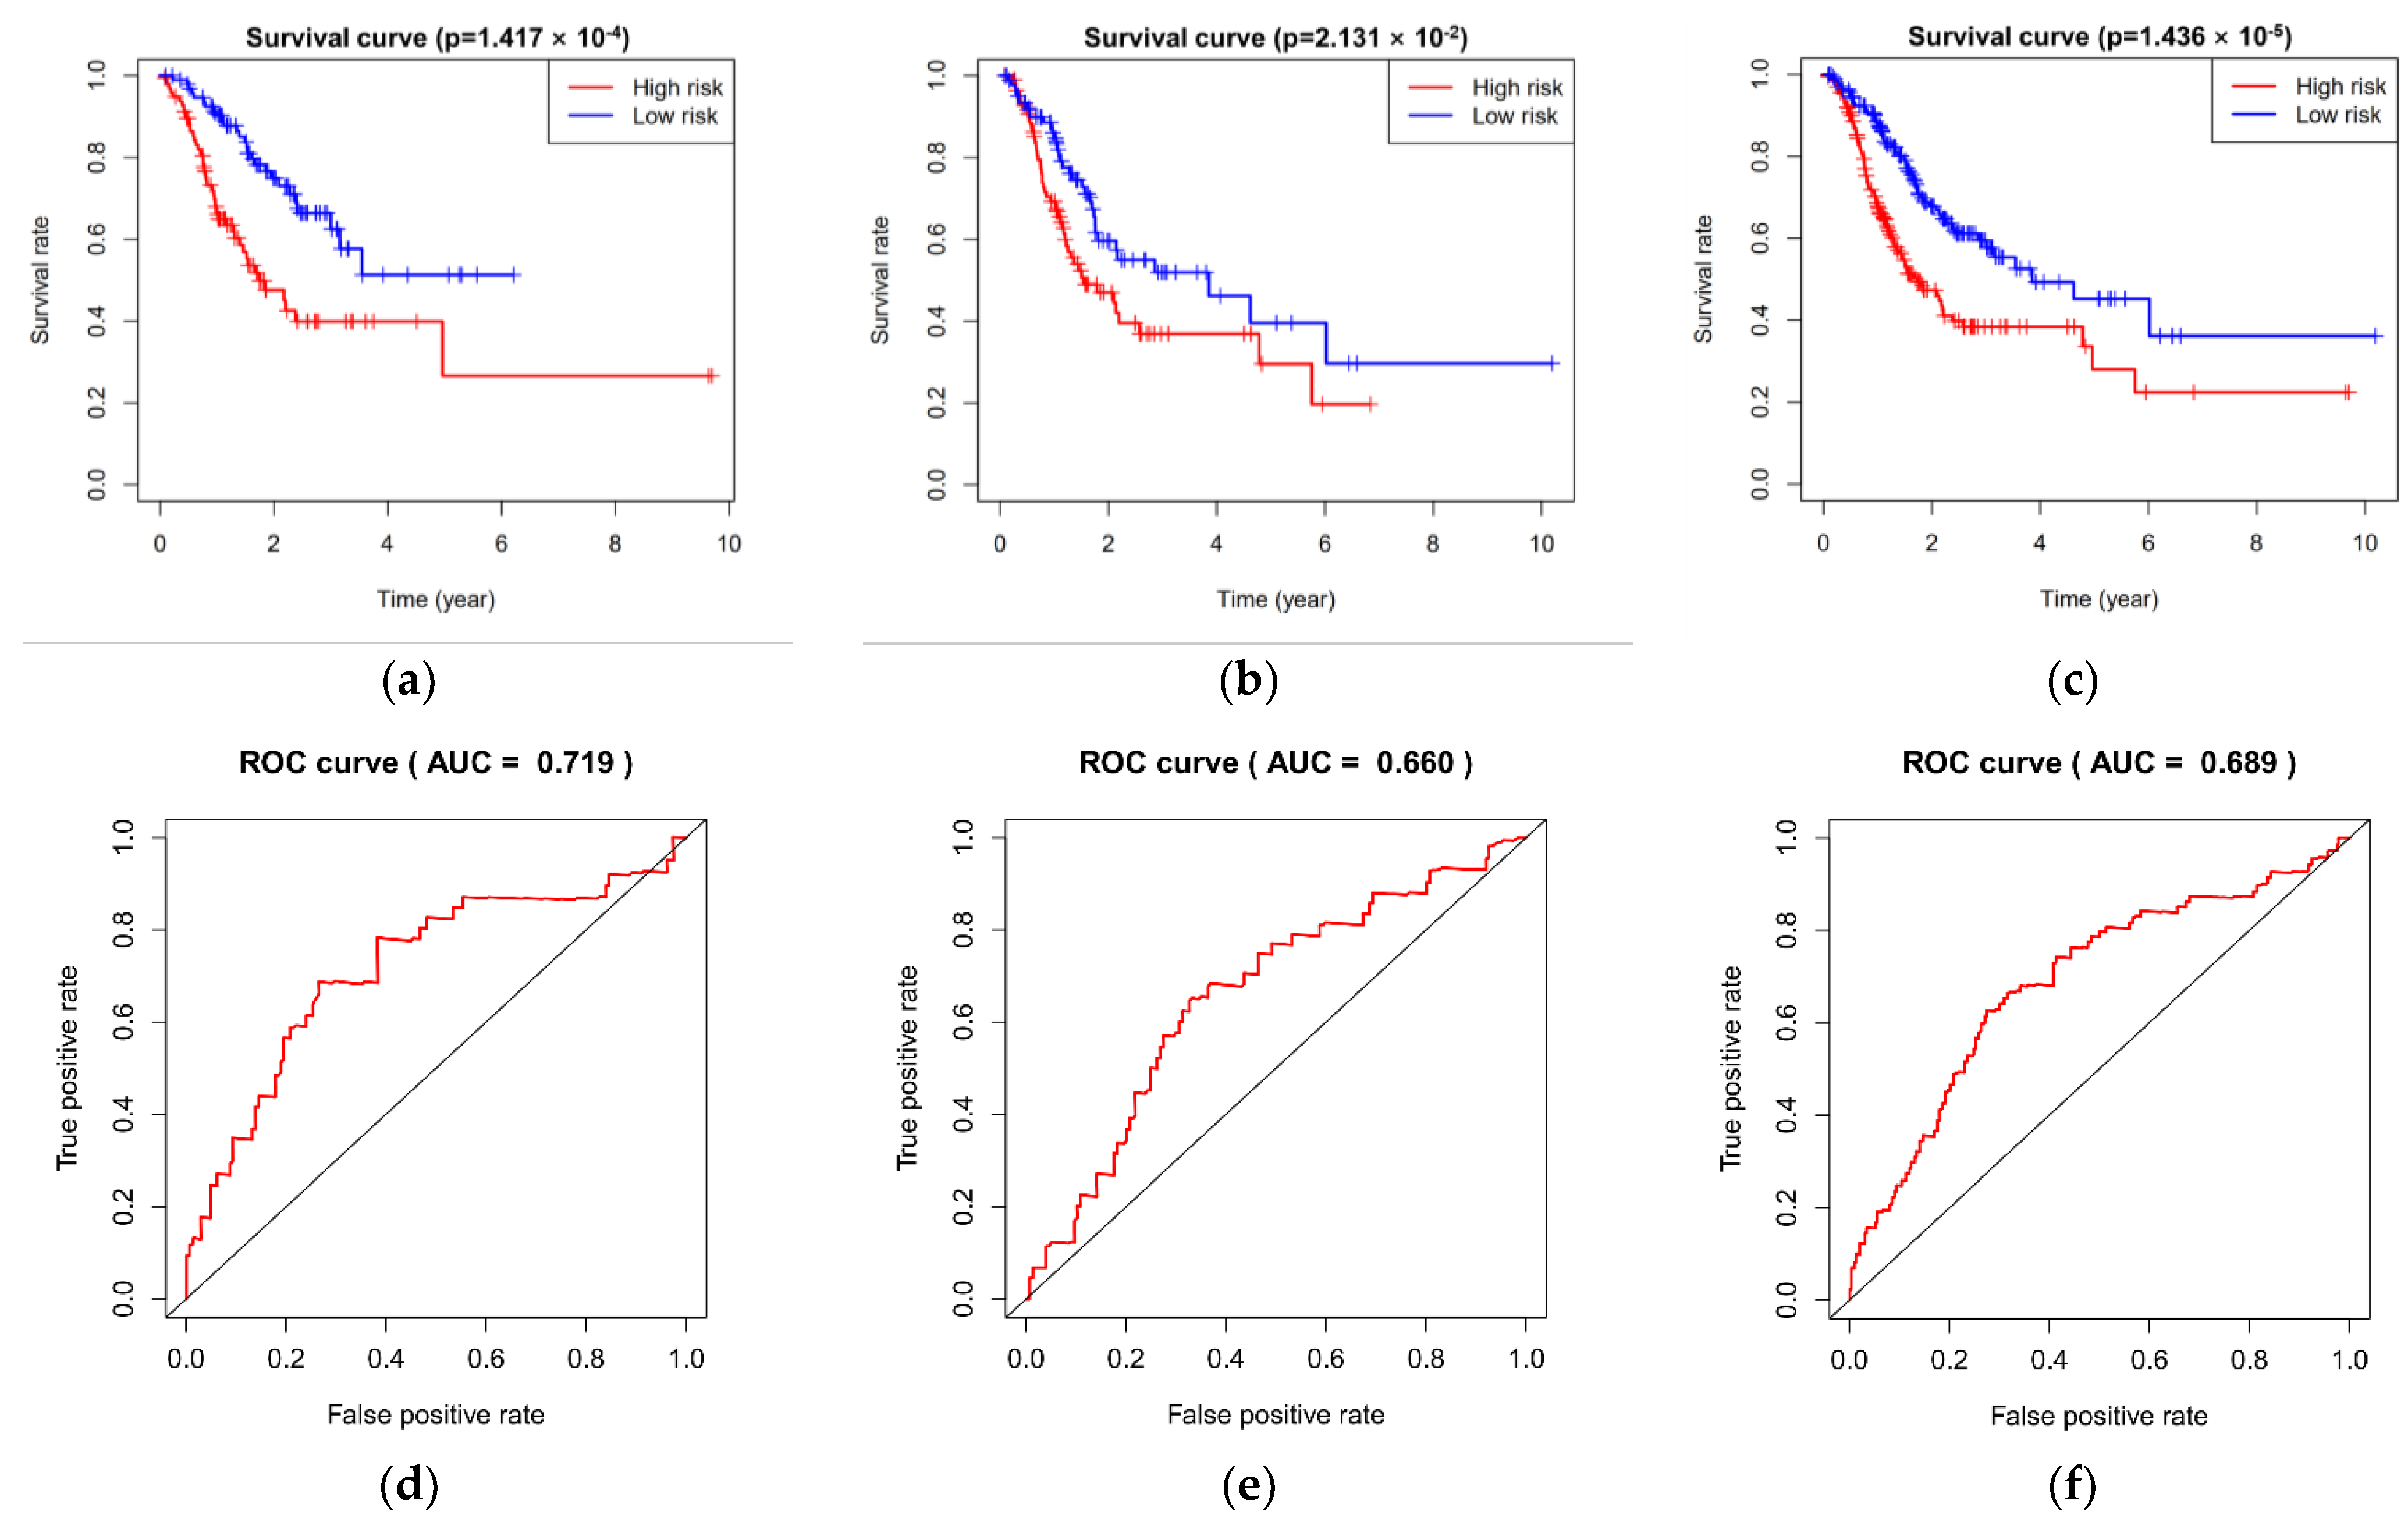
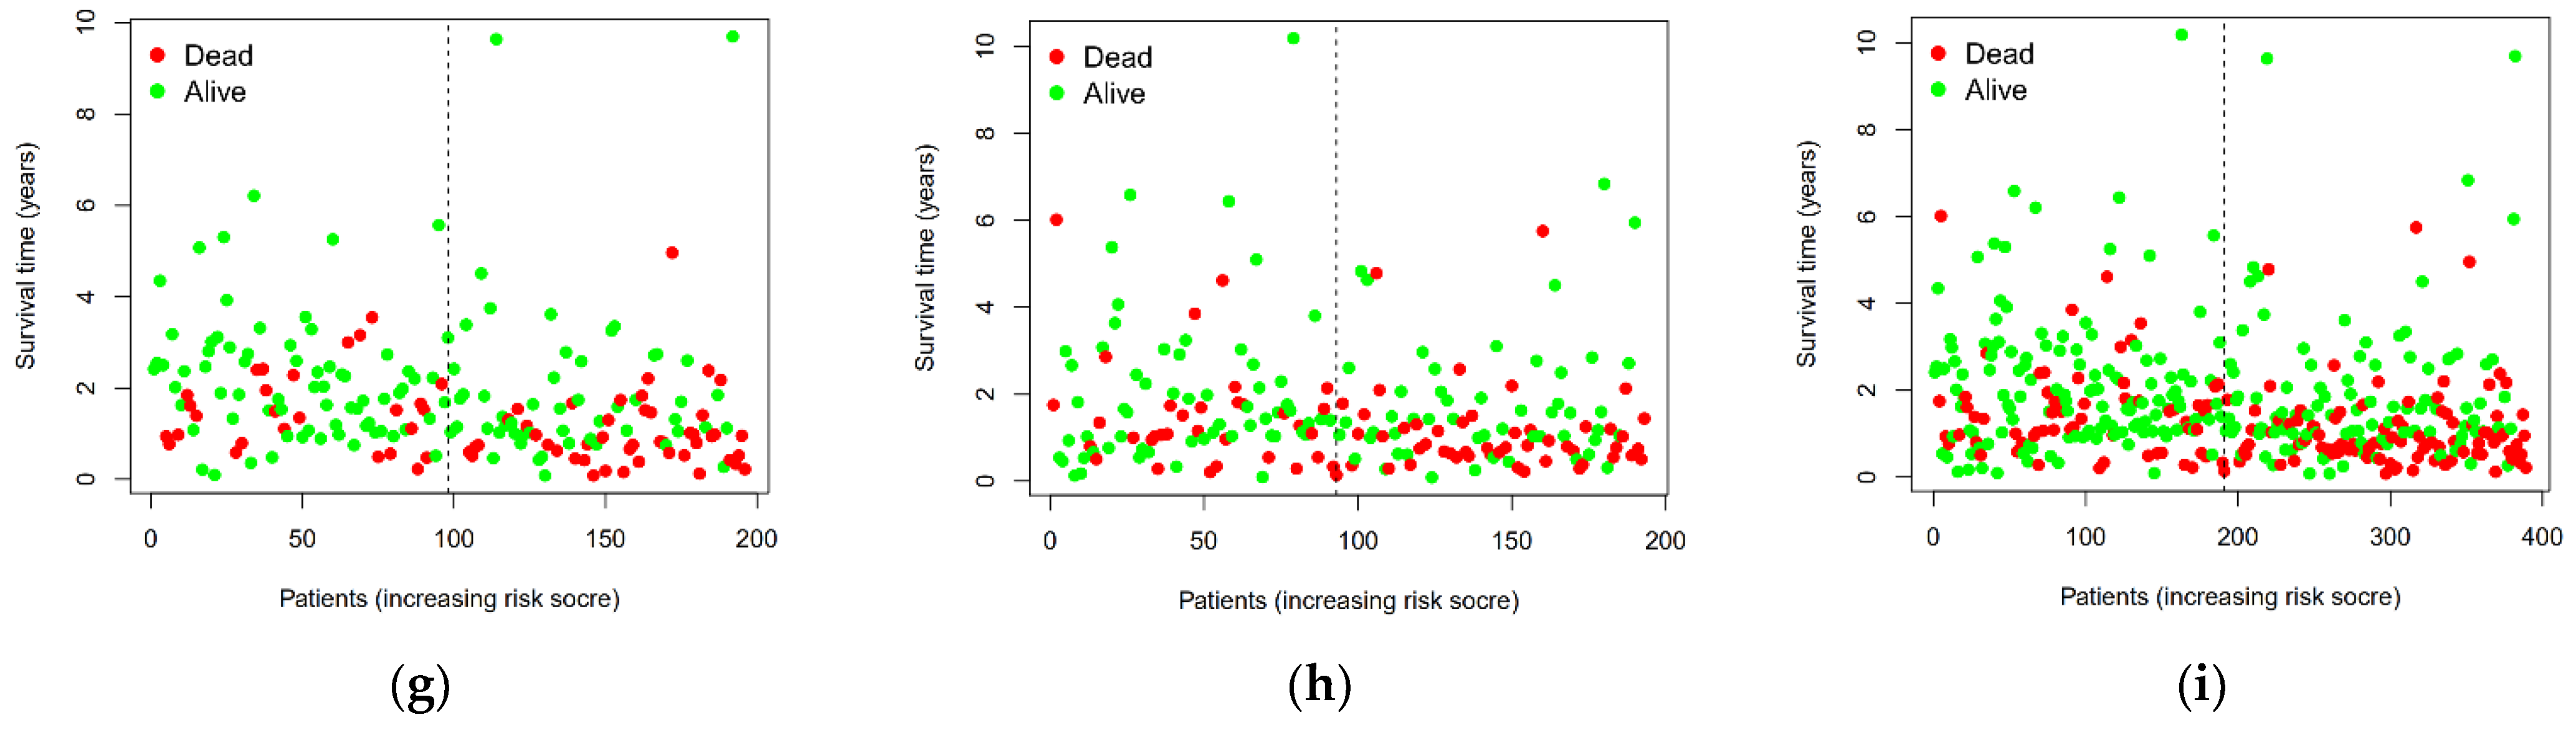
3.3. Prediction and Assessment of Five miRNAs for Overall Survival in Three Groups

According to the median value grouping of risk score, the Kaplan–-Meier curve displayed that the high-risk group had worse survival than the low-risk group in the training group (p = 1.417 × 10⁻⁴), the testing group (p = 2.131 × 10⁻²), and the whole group (p = 1.436 × 10⁻⁵; Figure 4a–c). The area under curve (AUC) of ROC for the five miRNAs severally attained 0.719, 0.660, and 0.689 in the training group, the testing group, and the whole group (Figure 4d–f), which indicated that the five miRNAs perform well in predicting the overall survival of gastric cancer patients. Furthermore, patients with high-risk scores had a higher death rate than those with low-risk scores in the three groups (Figure 4g–i).

3.4. Independence of the Five miRNAs

Based on the univariate and multivariate Cox regression analysis, the five miRNAs were related to the overall survival of patients (HR = 1.726, 95% CI = 1.396–2.136, p < 0.001). They were also independent in overall survival considering other clinical elements (HR = 1.971, 95% CI = 1.557–2.494, p < 0.001). Other clinical features include age, gender, stage, T stage, metastasis, and lymph node stage (Table 4).

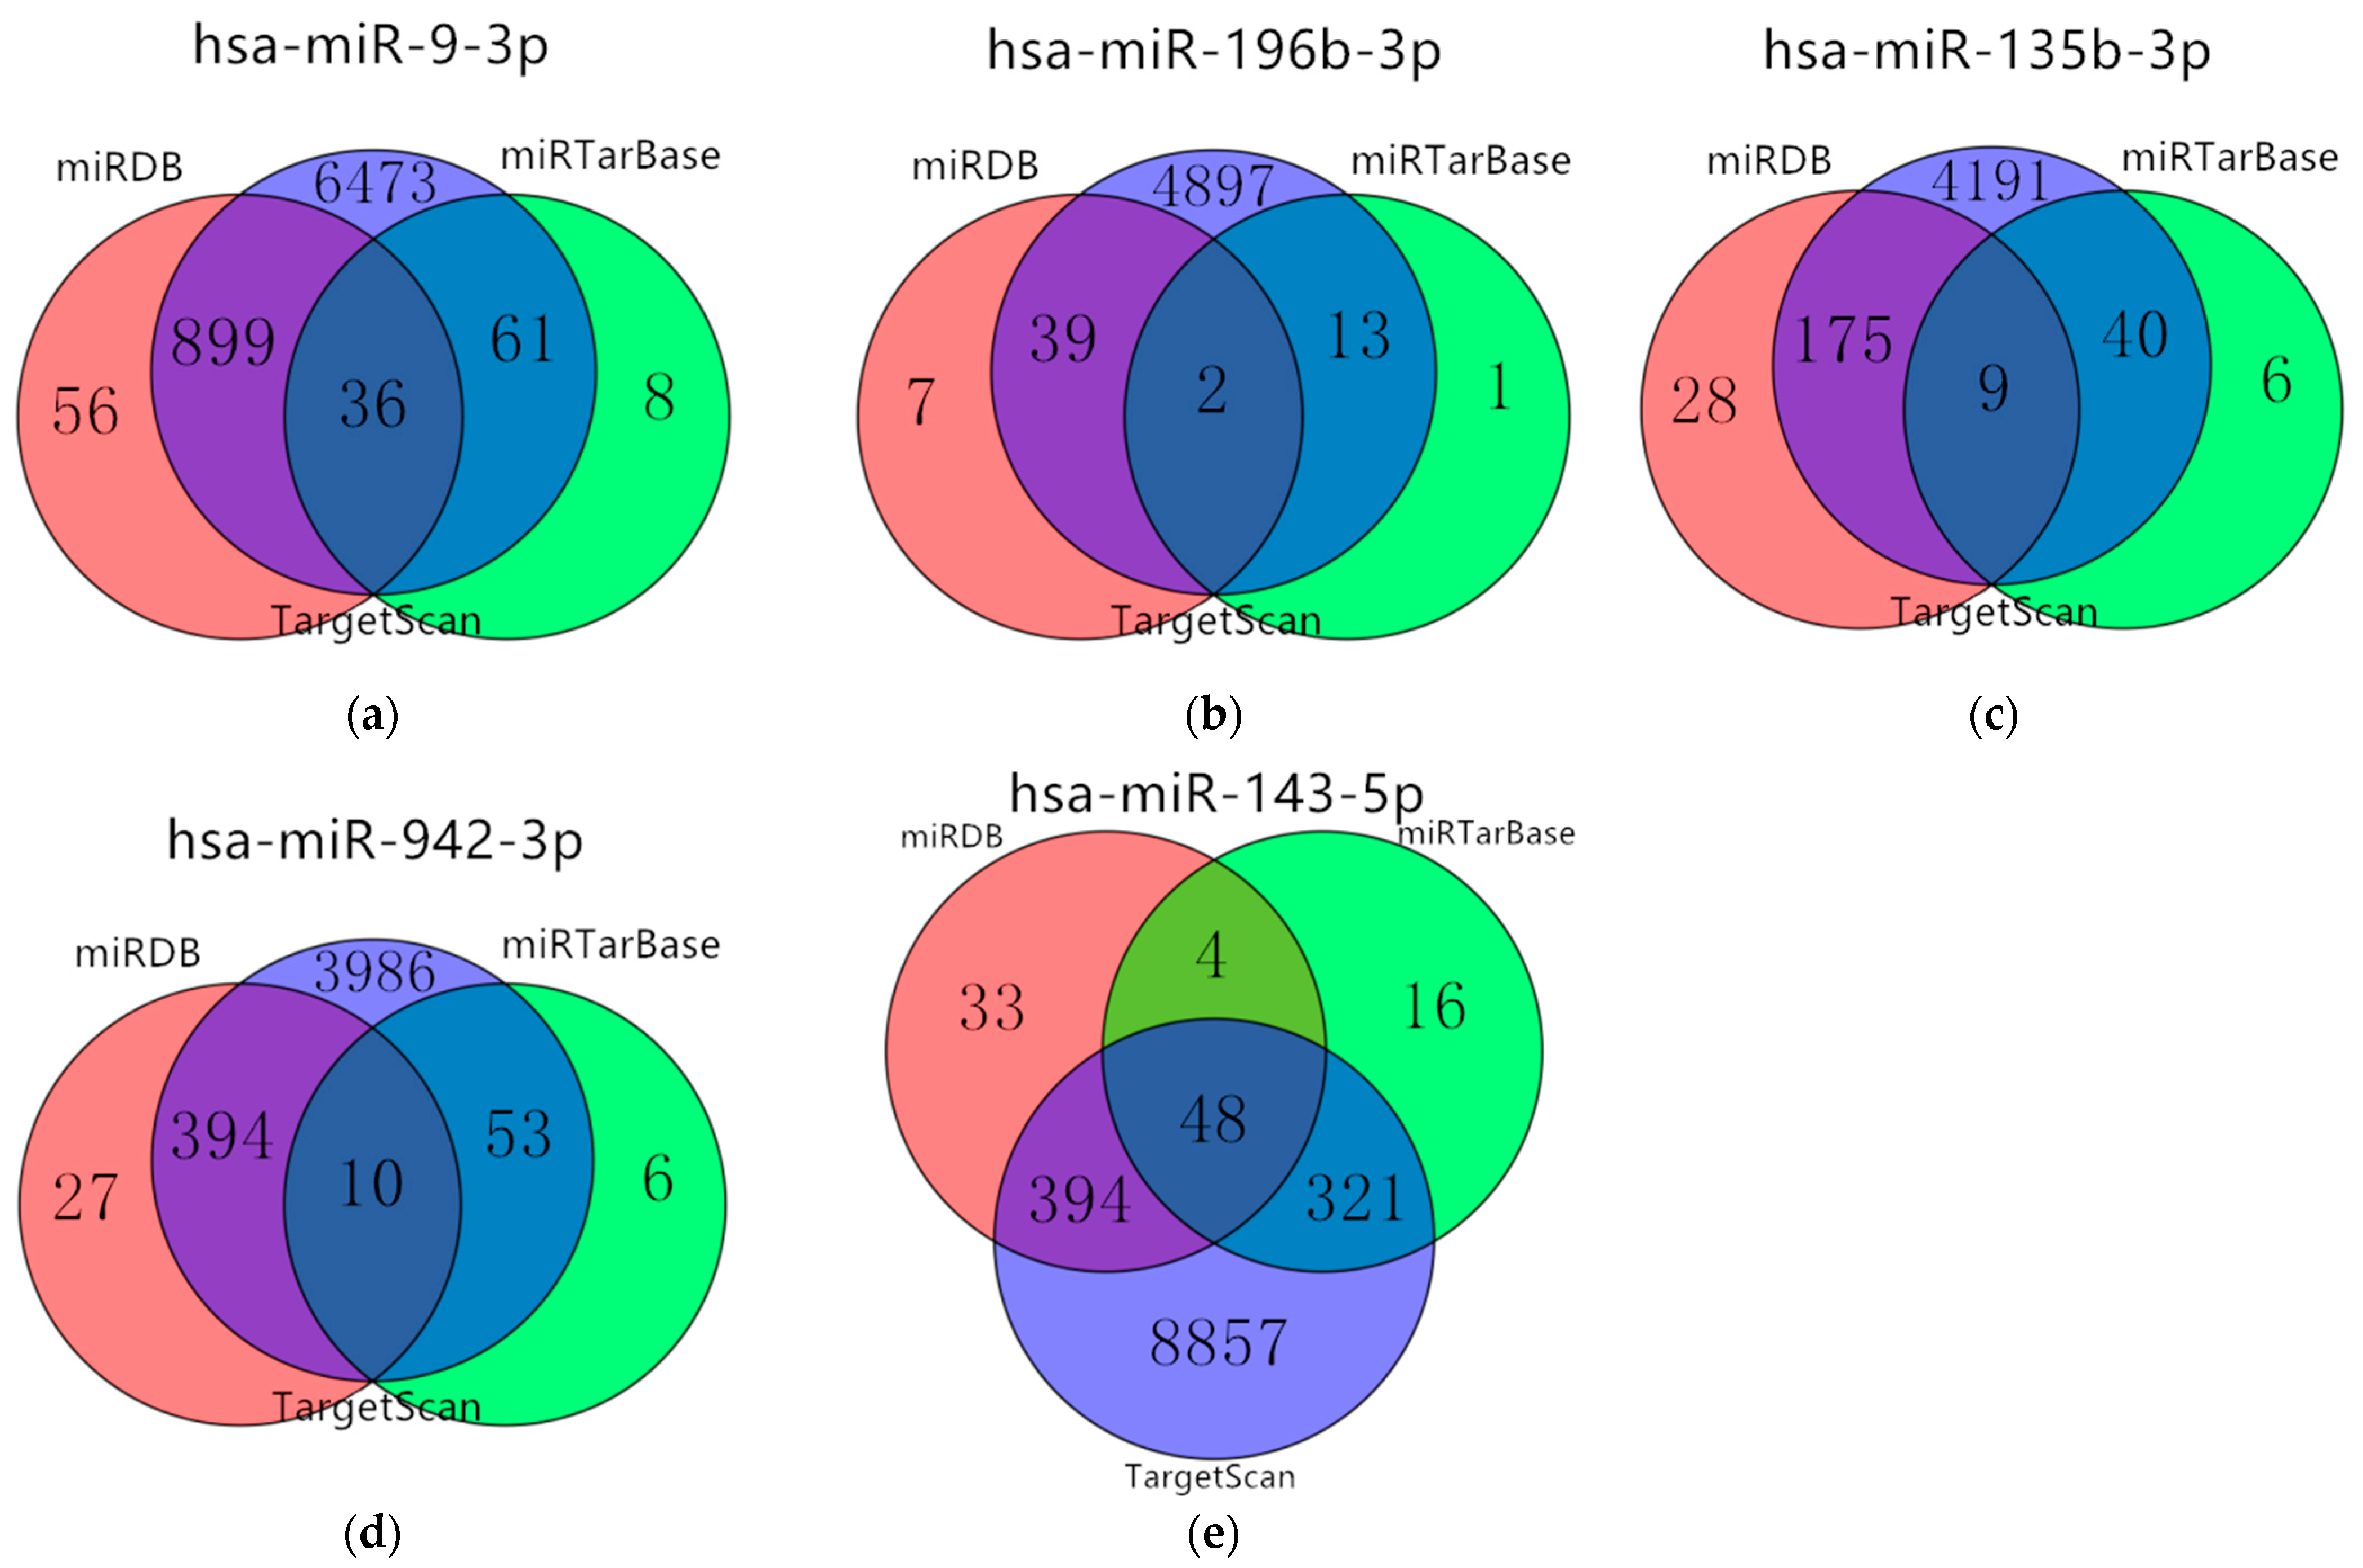
3.5. Target Genes Prediction of Five miRNAs

The target genes were obtained and crosschecked in at least two databases. The predicted results showed that the five miRNAs (has-miR-9-3hashsa-miR-196hasp, hsa-miR-135b-3p, hsa-miR-942-3p, and hsa-miR-143-5p) overlapping target genes were 996, 54, 224, 457, and 767, respectively. The results were shown in Figure 5. Then, the above detected 7531 DEmRNAs (4395 up-regulated and 3136 down-regulated) were used to determine whether these target genes were involved in the development of gastric cancer.
Figure 6a displayed the regulatory network between five miRNAs and 196 target genes. There are 121 overlapping genes between the target genes of down-regulated miRNAs (hsa-miR-143-5p, hsa-miR-9-3p) (1661) and up-regulated mRNAs (4395). There were 75 overlapping genes between the target genes of up-regulated miRNAs (hsa-miR-135-3p, hsa-miR-196b-3p, hsa-miR-942-3p) (713) and down-regulated mRNAs (3136), as shown in Figure 6b,c.

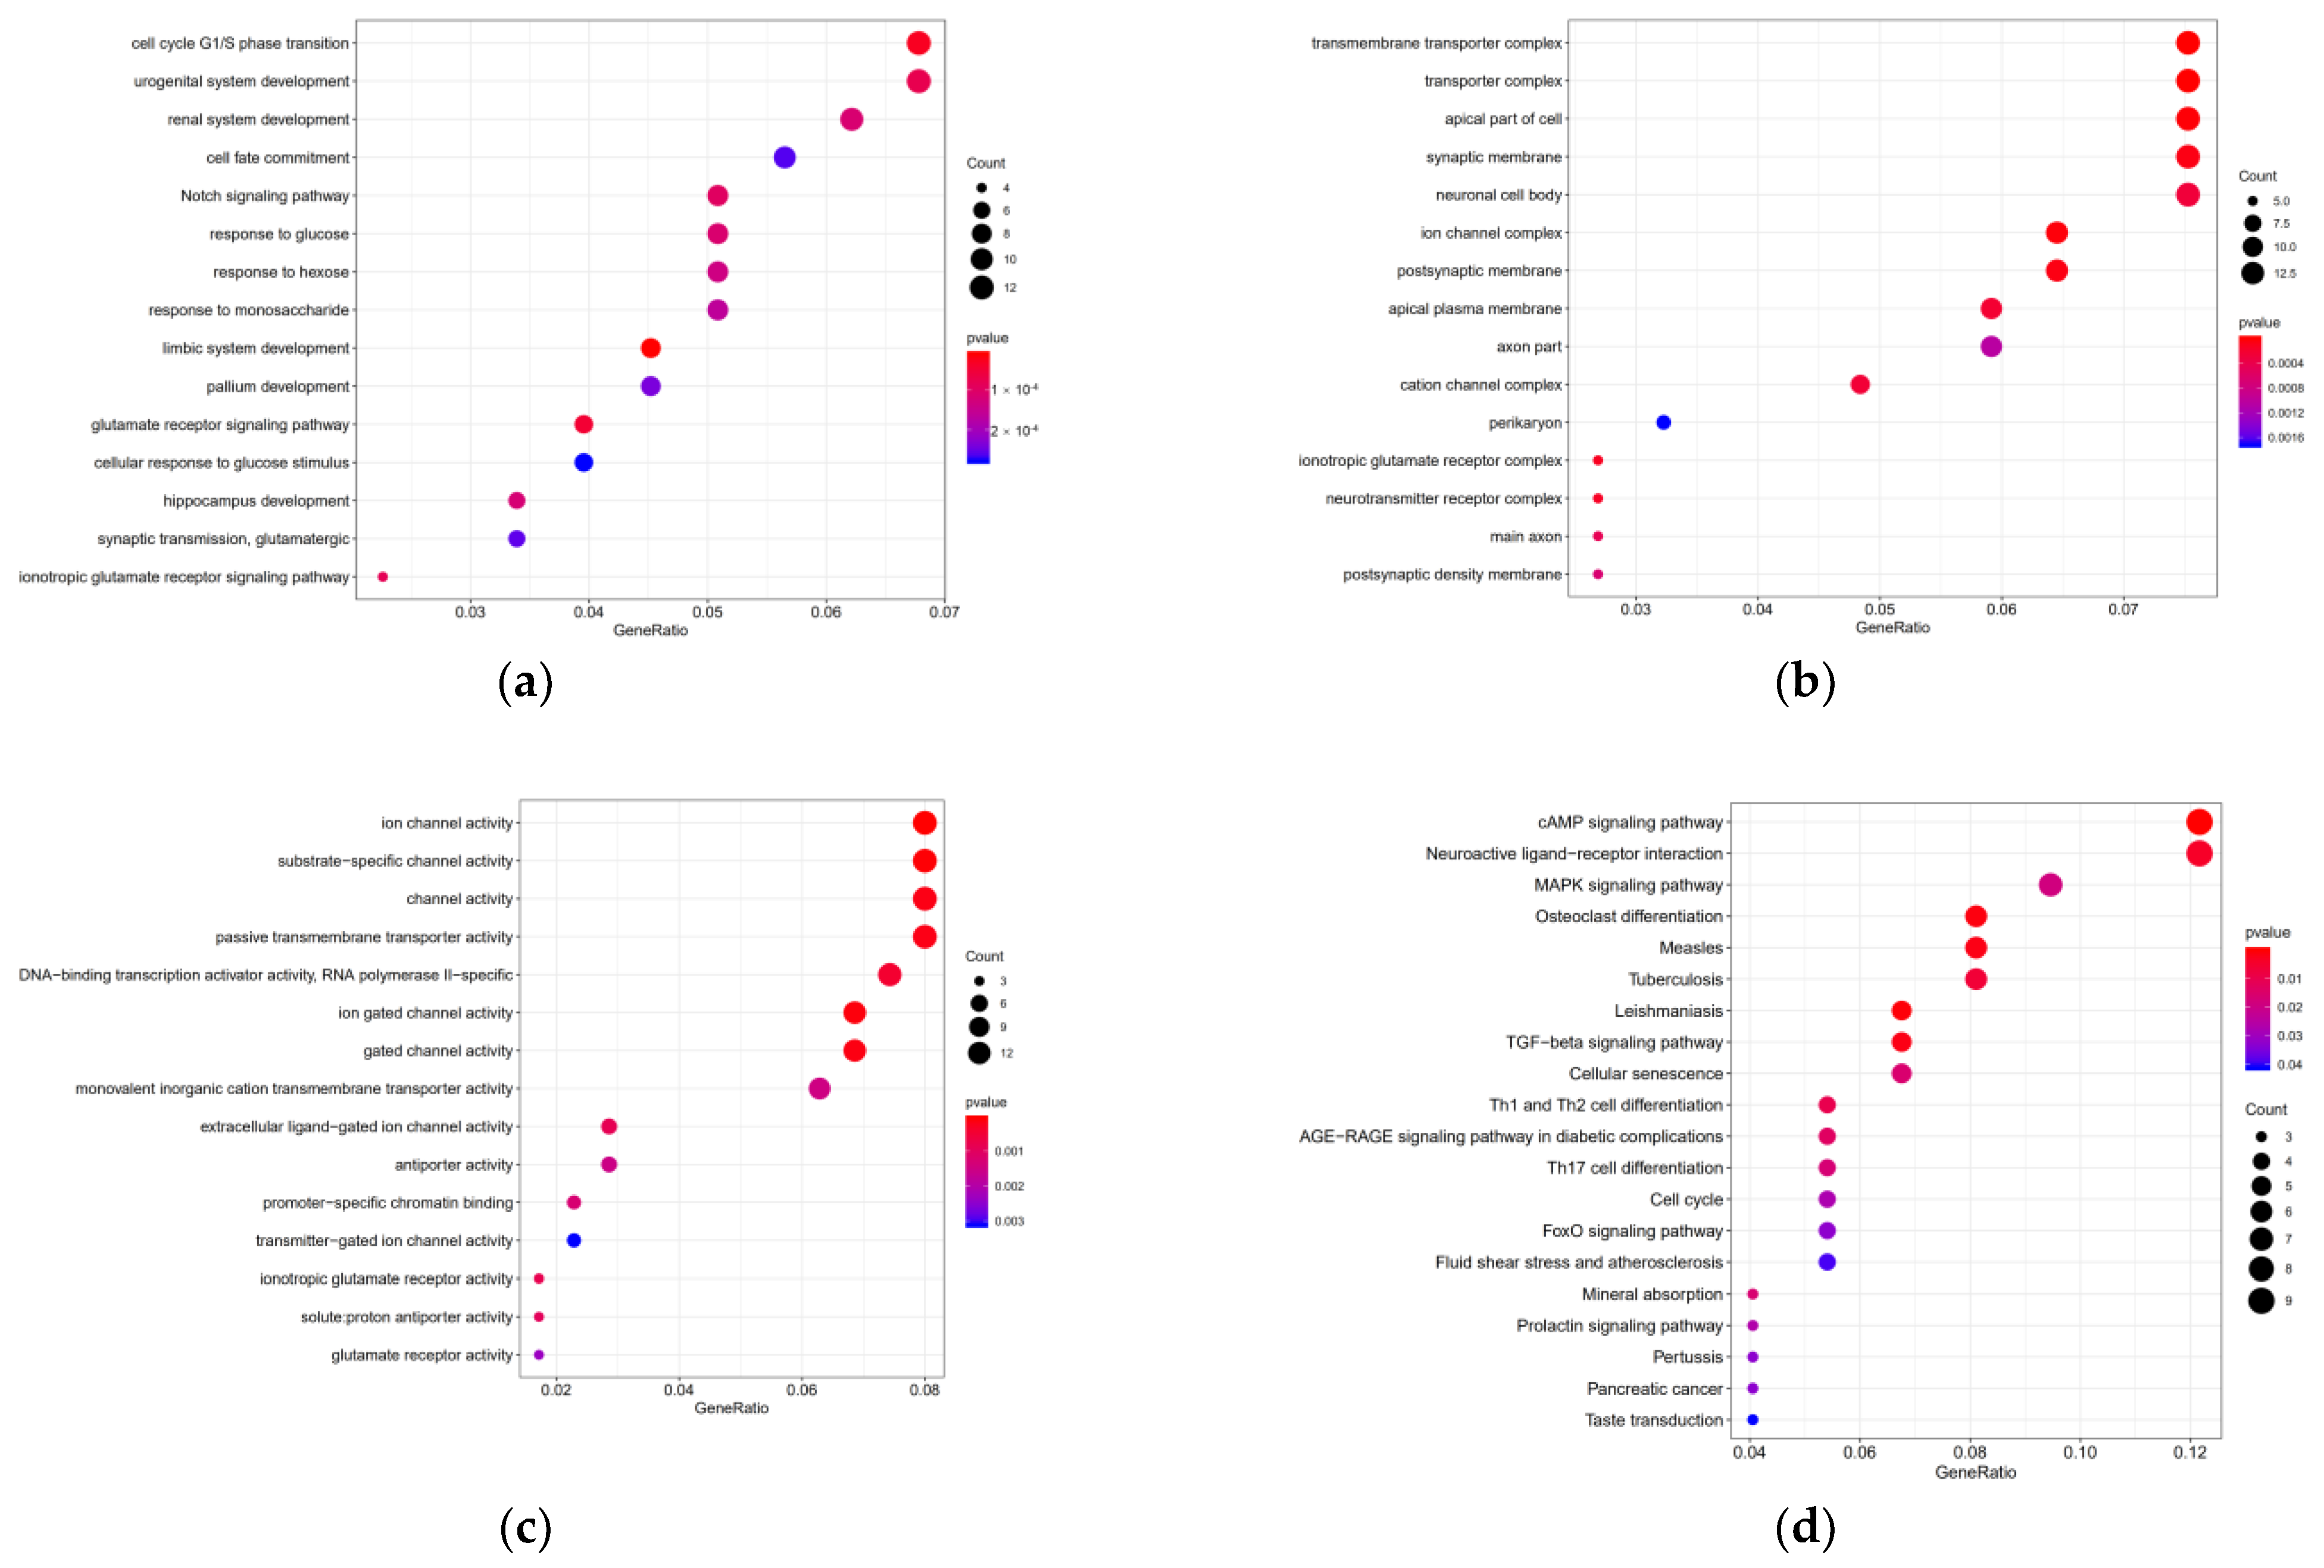
3.6. Target Genes Functional Enrichment Analysis

The GO results in the top fifteen terms, including biological process (BP), cellular component (CC), and molecular function (MF) were displayed in dot plot (Figure 7a–c). BP mainly contained cell cycle G1/S phase transition, urogenital and renal system development; CC mainly contained transmembrane transporter complex, transporter complex, and apical part of cell; MF mainly contained ion channel and substrate-specific channel activity. KEGG pathways analysis results were mainly enriched in the neuroactive ligand–receptor interaction, cAMP signaling pathway, and the MAPK signaling pathway (Figure 7d and Table 5).

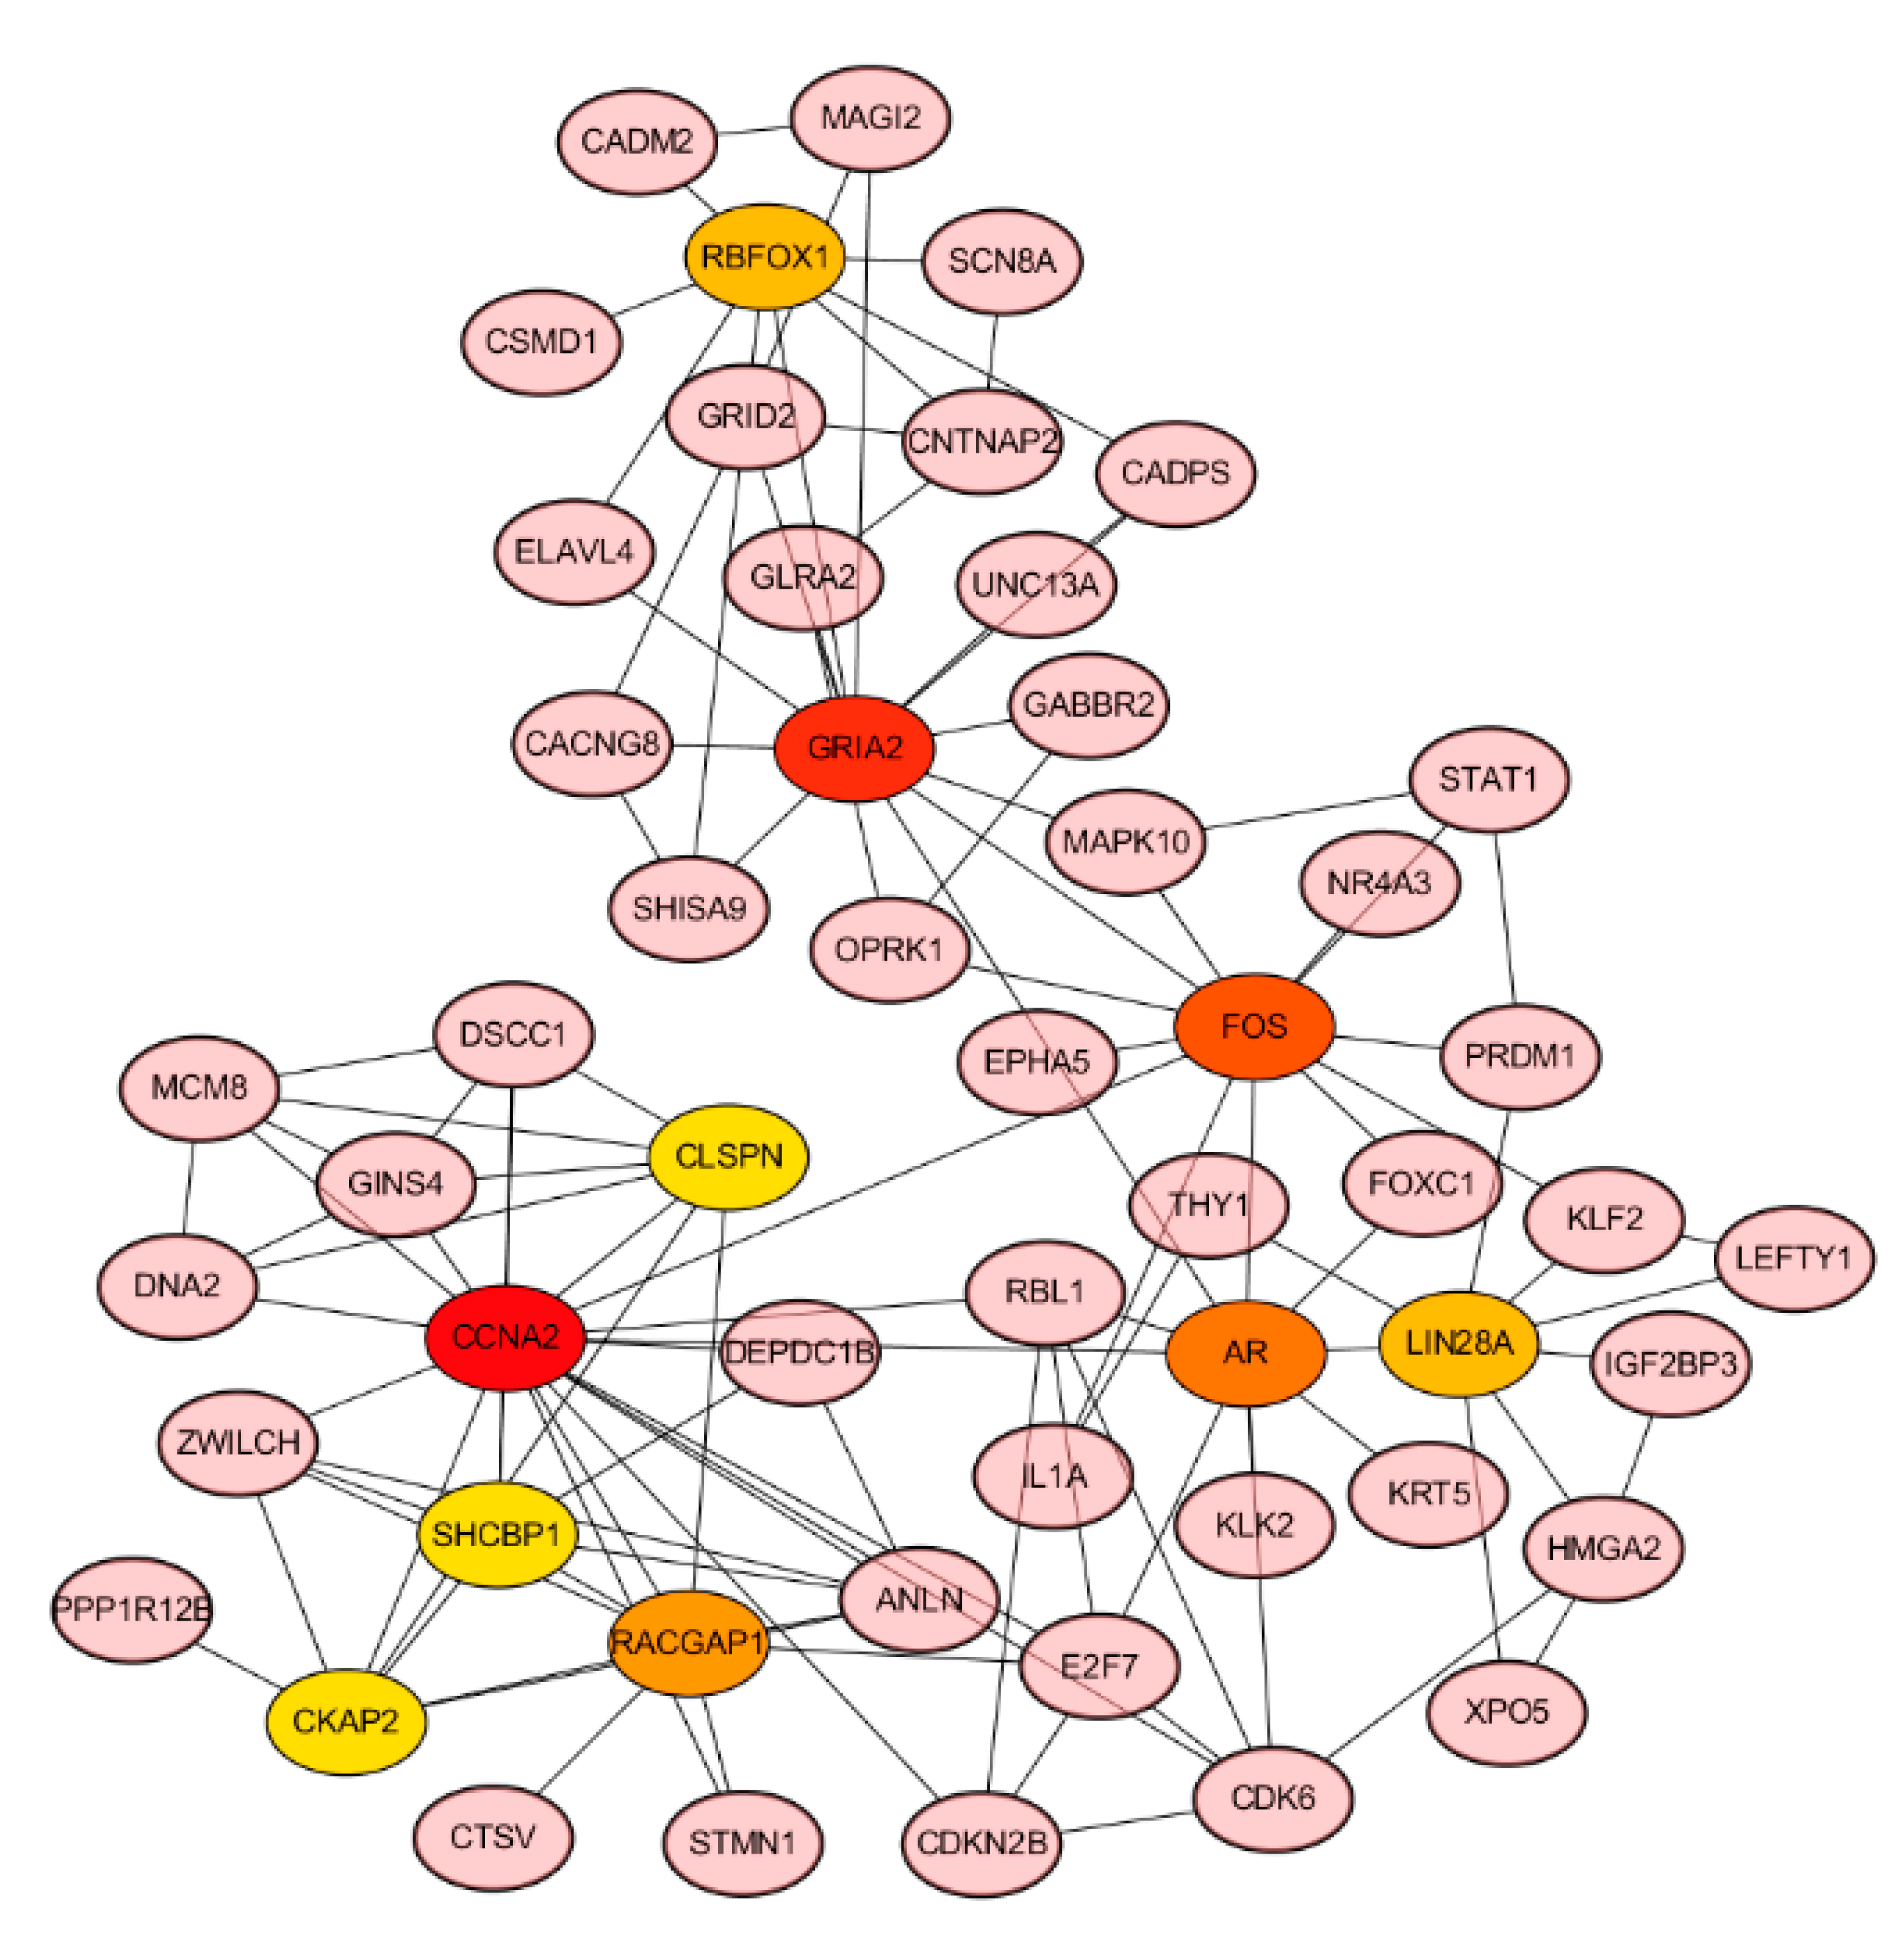
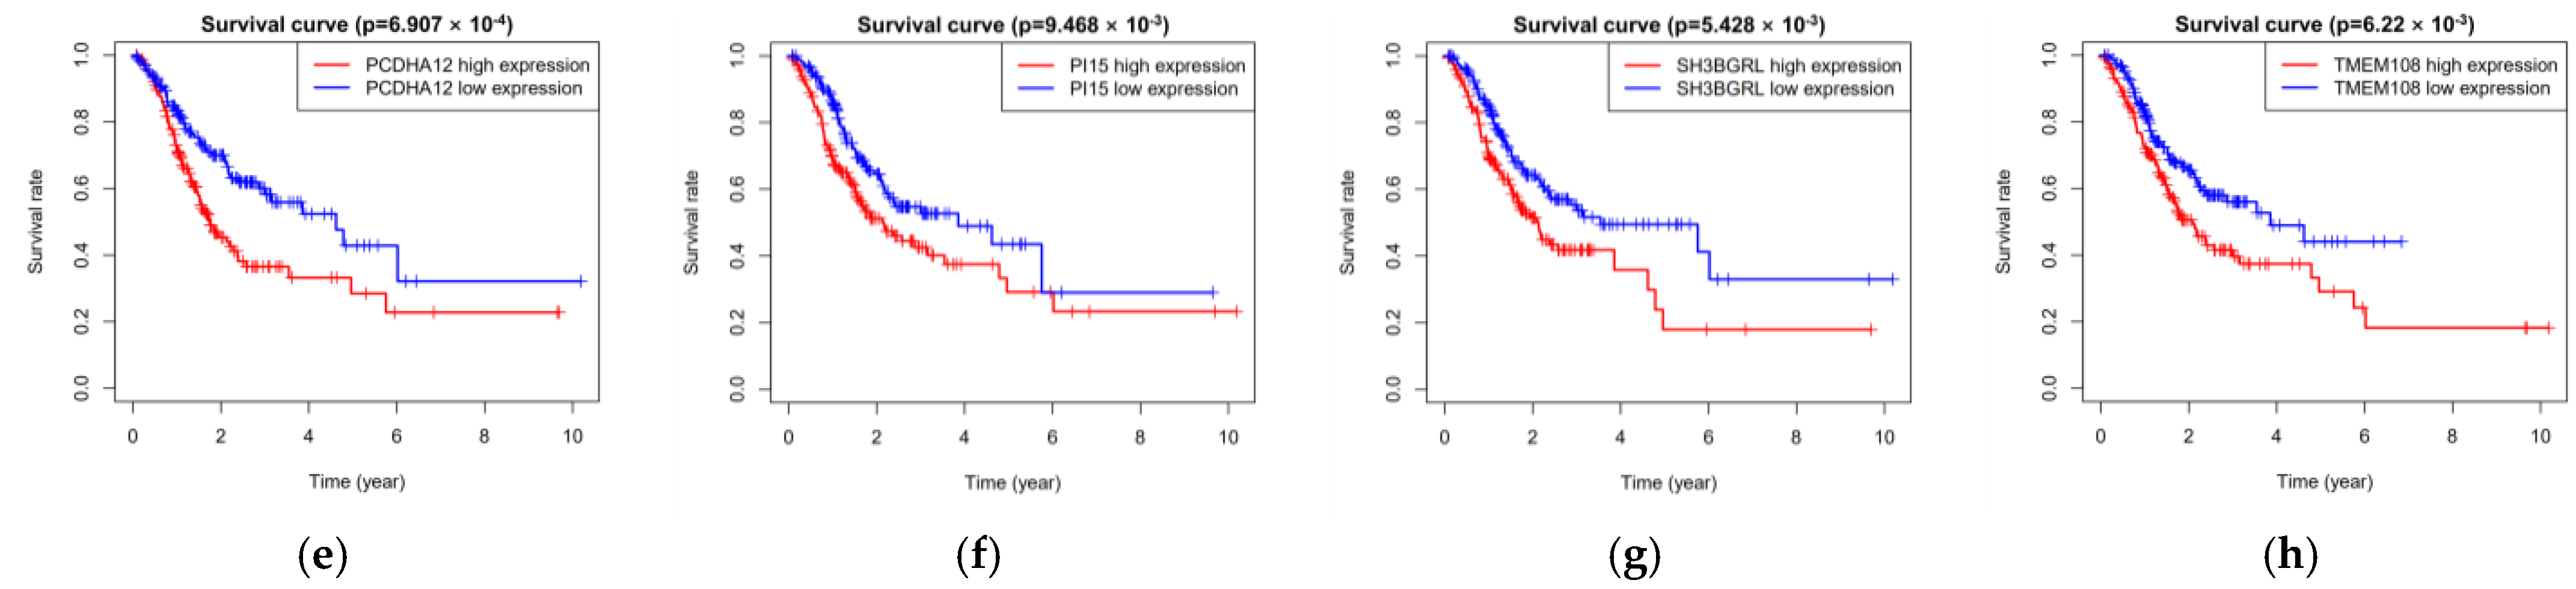
3.7. Hub Genes of PPI Network and Survival Analysis of Target Genes

The PPI network included a total of 196 target genes. The ten hub genes (CCNA2, GRIA2, FOS, AR, RACGAP1, RBFOX1, LIN28A, DSCC1, GRID2, OPRK1) from PPI network were screened by Cytoscape plug-in CytoHubba (Figure 8 and Table 6). Besides, the Kaplan–Meier curve indicated that the expression of eight genes (AKAP12, AR, DEIP1, PCDHA11, PCDHA12, P115, SH3BGRL, TMEM108) was correlated with survival prognosis (Figure 9).

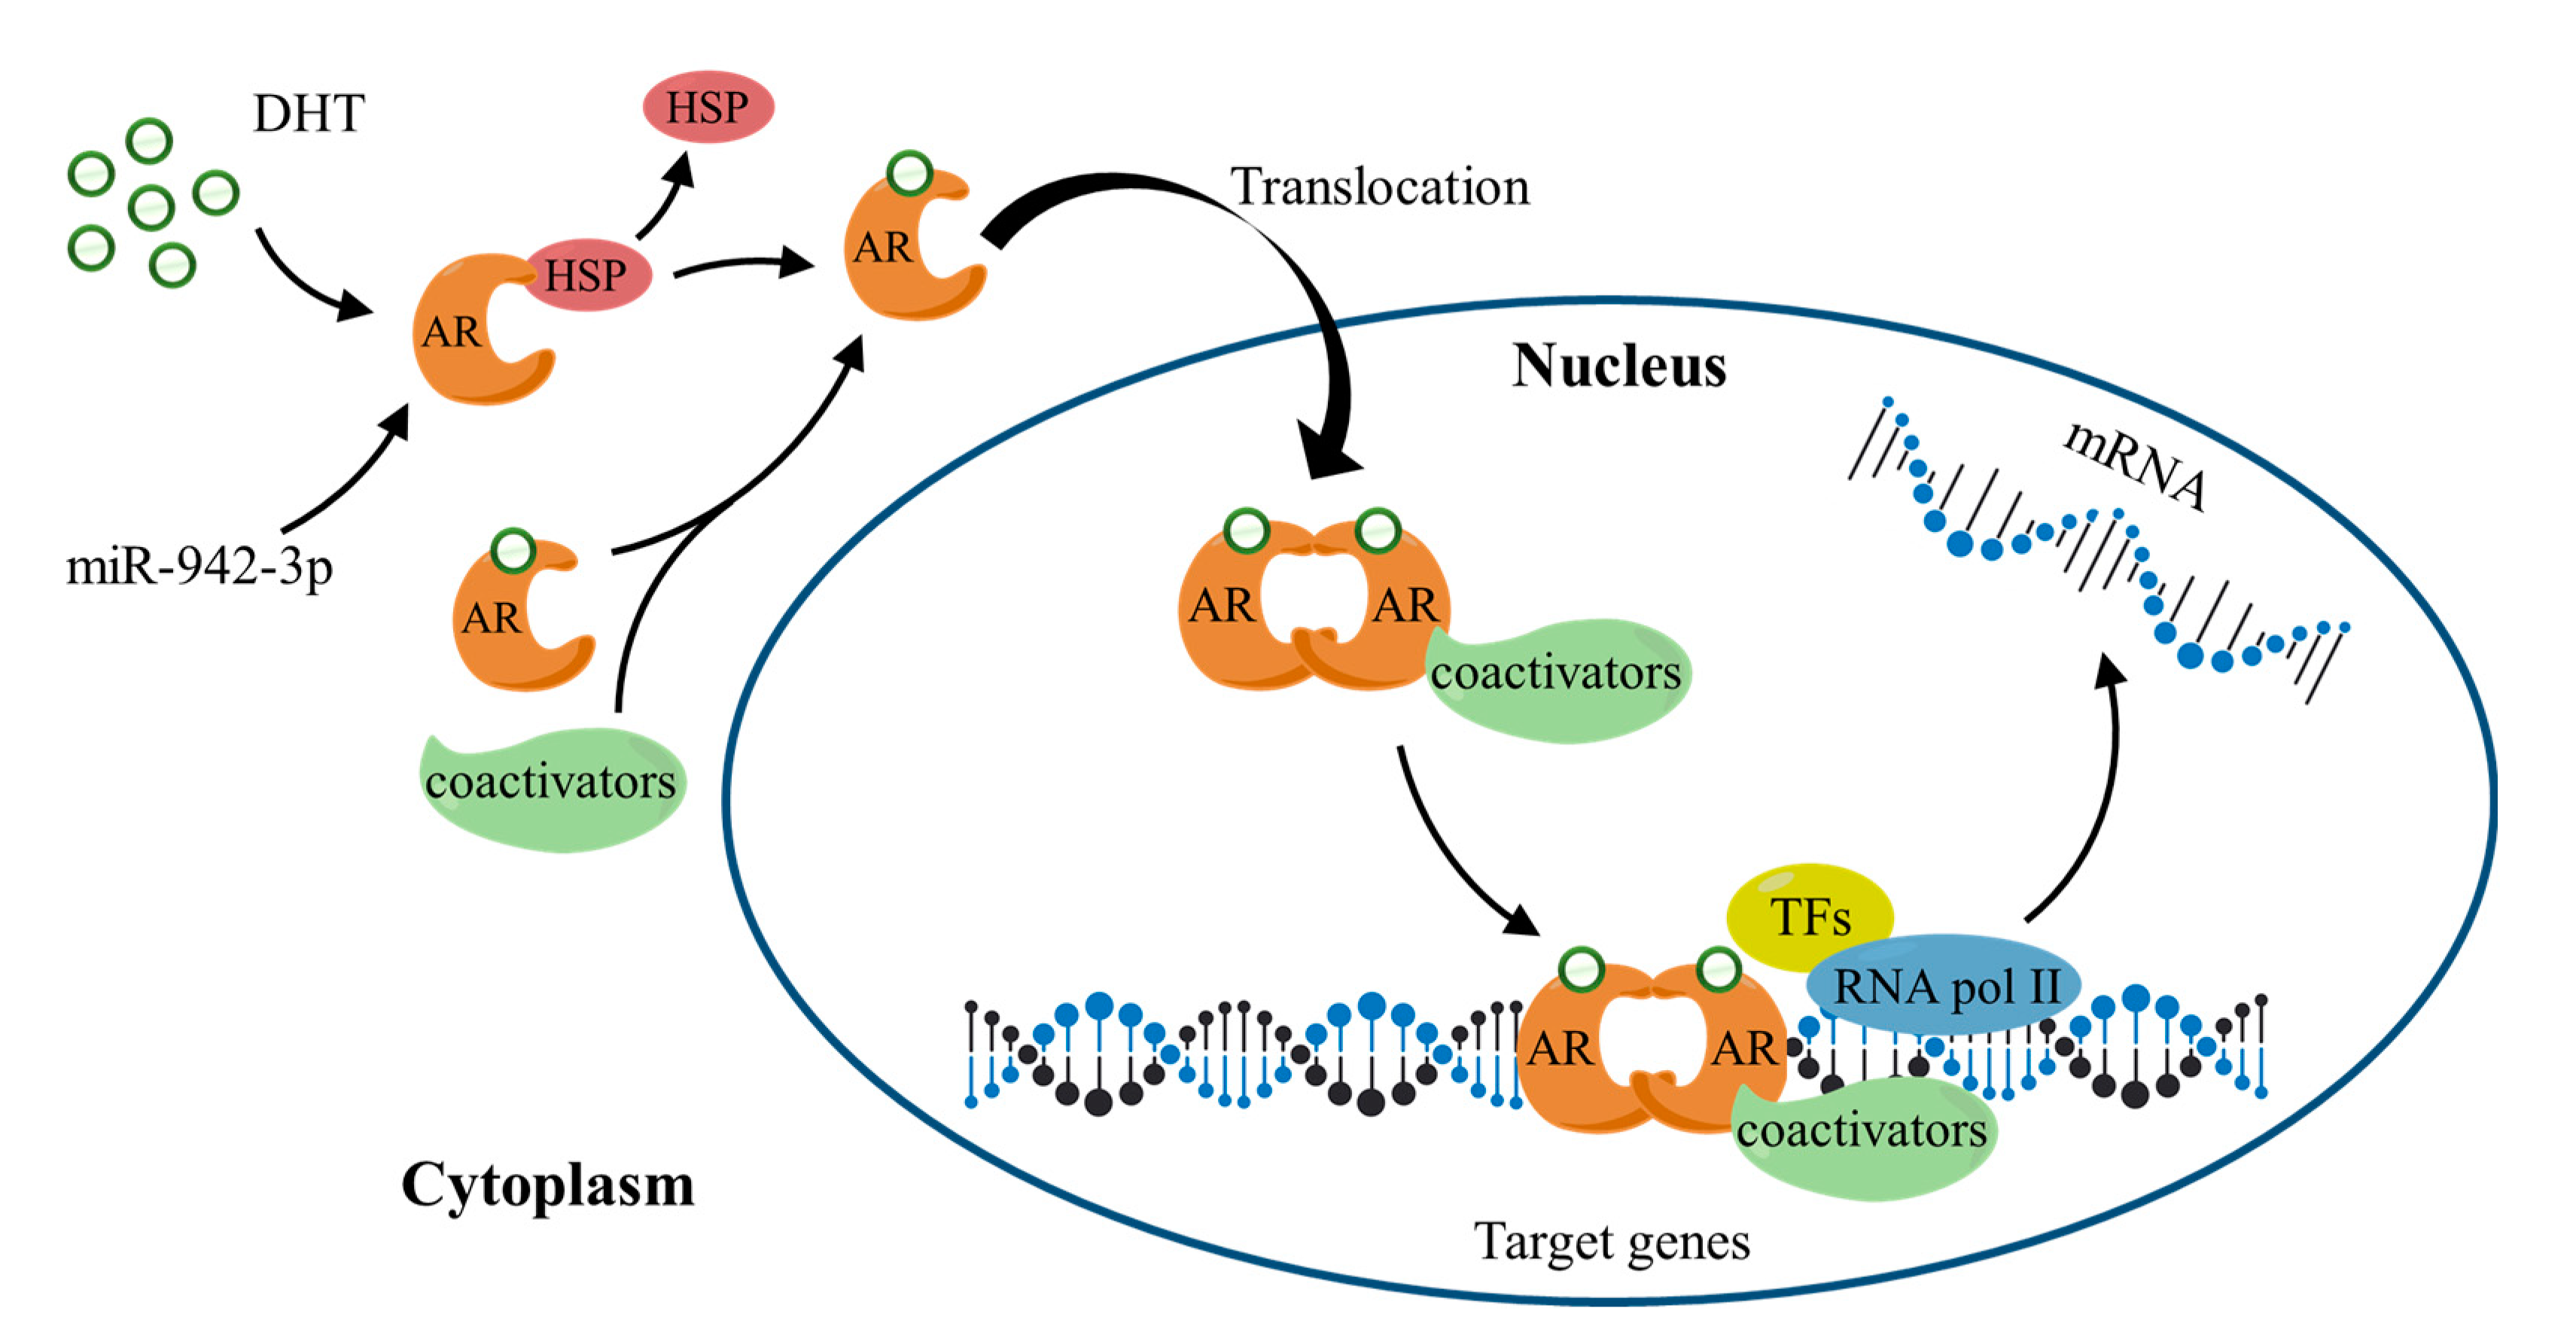
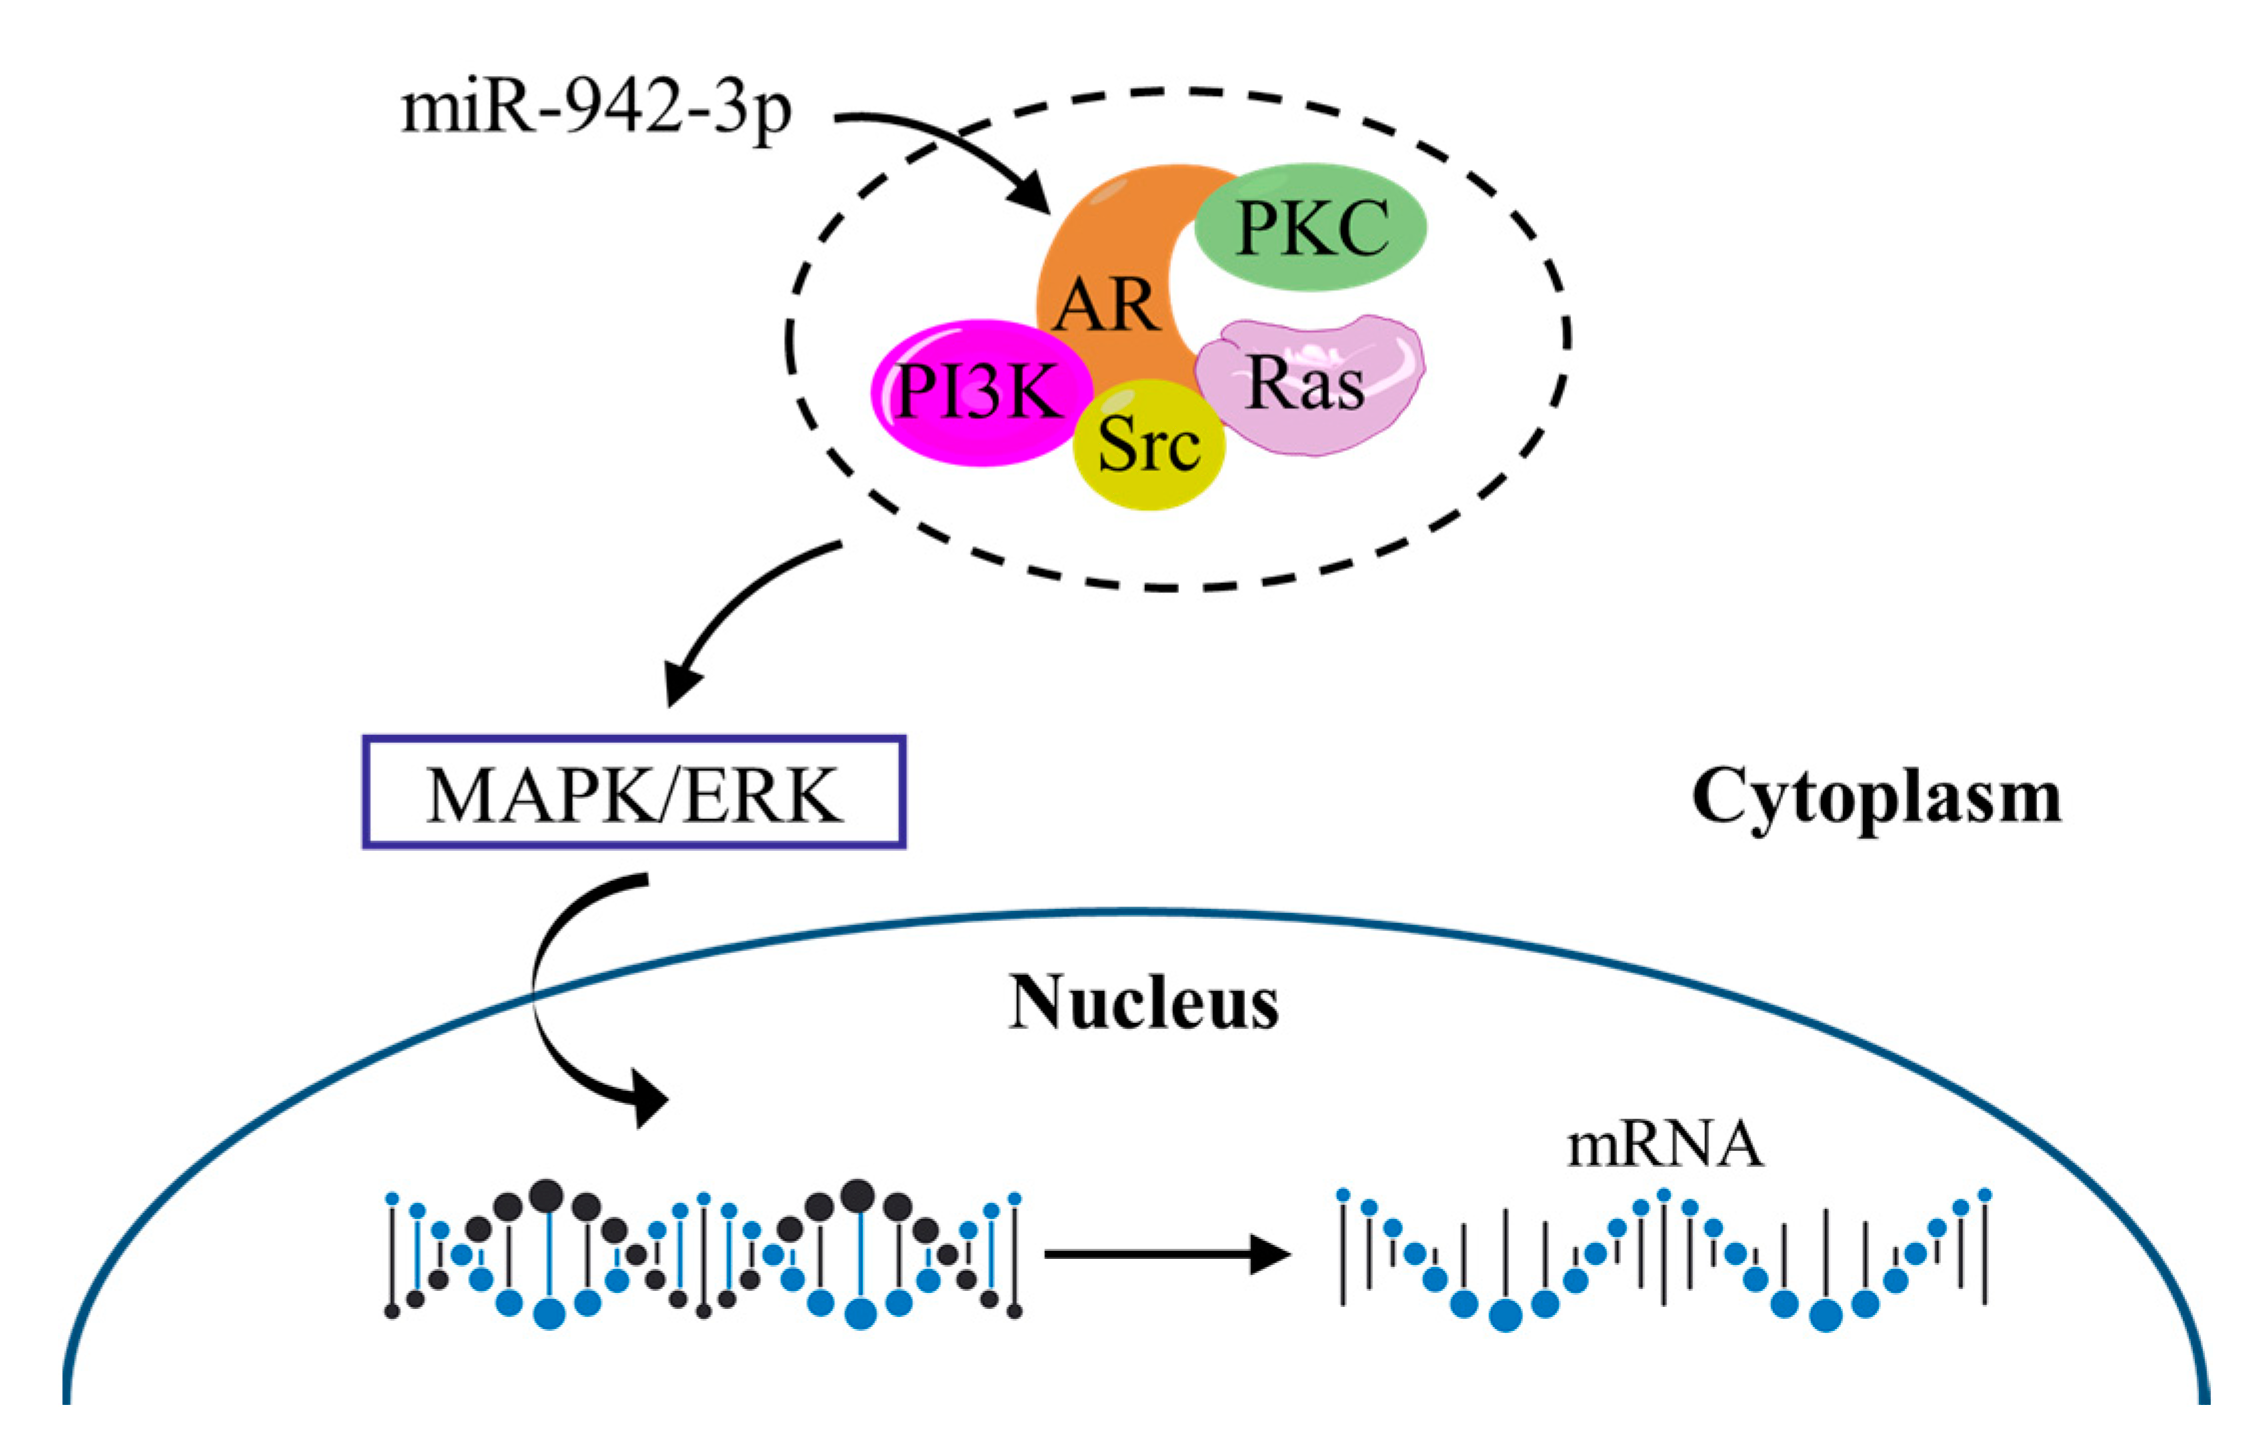
3.8. The Working Mechanism of AR and Its Potential Relationship with the MAPK/ERK Signaling Pathway

From the above, we can conclude that the Androgen Receptor (AR) was not only a hub gene in the PPI network but also associated with excessive survival of patients. AR can regulate the transcription of genes and express new proteins, ultimately changing the function of cells. Figure 10 shows a typical AR working mechanism. AR usually forms a complex with heat shock proteins (HSPs) in the cytoplasm. The binding of AR to androgen (such as 5α-dihydrotestosterone, DHT) alters its conformation, and HSPs are subsequently released. Under the action of coactivators, androgen–AR complexes are transferred to the nucleus and recognize androgen response elements in the form of homodimer to regulate downstream target gene expression.
In the absence of androgen, AR may depend on the MAPK/ERK signaling pathway to play its role. Figure 11 shows the potential relationship between the AR and MAPK/ERK signaling pathways. In the cytoplasm, AR can interact with several signaling molecules, including phosphoinositide 3-kinase (PI3K), Src family kinase (Src), Ras GTPase (Ras), and protein kinase C (PKC), which in turn converge on the MAPK/ERK pathway. Then, the MAPK/ERK enters the nucleus, where it translocates and interacts with transcription factors that regulate the expression of genes associated with cell proliferation.

4. Discussion

Gastric cancer is one of the most common tumors with high morbidity and mortality. Therefore, the detection of sensitive specific biomarkers for gastric cancer is urgent. Many studies indicated miRNAs could regulate expression in vivo, and it plays an essential role in the biological process of human malignancy [16]. Currently, some miRNAs have been used as potential prognostic indicators for tumors, such as miR-191 [17], miR-1908 [18], miR-217 [19], and miR-200c [20]. Previously, a variety of miRNAs were discovered in many prognostic markers for tumors [21,22], especially for gastric cancer [23].
In this study, we obtained 267 DEmiRNAs. All samples were divided into training group and testing group randomly. Then, the five miRNAs were constructed in the training group. At the same time, based on the median grouping of risk score, these five miRNAs were proved in the testing group and the whole group, respectively. Kaplan–Meier curves showed that overall survival was significantly lower in the high-risk group than in the low-risk group among the three groups. By ROC curve, the overall survival of the five miRNAs among the three groups showed better predictive ability. Subsequently, the Cox regression analysis indicated that the five miRNAs were independent of overall survival.
The target genes of five miRNAs were predicted in order to in-depth understand the regulatory mechanisms of these five miRNAs. GO analysis showed that the target genes were correlated with cell cycle G1/S phase transition, urogenital and renal system development, transmembrane transporter complex, transporter complex and apical part of the cell, ion channel, substrate-specific channel, and channel activity. The signaling pathways were enriched in the cAMP and MAPK signaling pathways and the Neuroactive ligand–receptor interaction. Park et al. pointed out that the cAMP signaling pathway inhibited the degradation of the HDAC8 and the expression of TIPRL in lung cancer cells, and also increased cisplatin-induced apoptosis [24]. Jagriti Pal et al. showed that the neuroactive ligand–receptor interaction pathway had a poor prognosis in patients with glioma [25]. The MAPK/ERK signaling pathway was essential in regulating cellular processes, such as cell differentiation, division, proliferation, and apoptosis.
The top ten hub genes (CCNA2, GRIA2, FOS, AR, RACGAP1, RBFOX1, LIN28A, DSCC1, GRID2, OPRK1) of target genes were detected by Cytoscape. Moreover, the Kaplan–Meier curve showed that eight target genes (AKAP12, AR, DEIP1, PCDHA11, PCDHA12, P115, SH3BGRL, TMEM108) were related to survival prognosis. Unexpectedly, AR was a hub gene in the PPI network, and it had a relationship with the excessive survival of patients. AR is a nuclear transcription factor, it can recognize and combine specific DNA sequences on target factors, thereby regulating the transcription of the gene and expressing new proteins, which ultimately changes the function of cells and promotes cell differentiation and the development of tissues and organs [26,27,28]. Salma S et al. showed that the p14ARF tumor suppressor could restrain AR activity and prevent apoptosis in prostate cancer cells [29]. Peng L et al. verified that AR could be directly combined with LAMA4, and it was related to enhanced cisplatin resistance in gastric cancer, providing a new mechanism for the treatment of drug-resistant gastric cancer [30]. In addition, AR may depend on the MAPK/ERK signaling pathway to function. Specifically, AR can interact with a variety of signaling molecules (PI3K, Src, Ras, and PKC) in the cytoplasm, which in turn converge on the MAPK/ERK pathway [31,32]. MAPK/ERK then enters the nucleus, where it translocates and interacts with transcription factors to regulate the expression of genes involved in cell proliferation [33].
In a word, this study found that the MAPK/ERK signaling pathway may help AR signal transduction and promote the interaction between AR and transcription factors, leading to cell proliferation. At the same time, AR is a target gene of the has-miR-942-3p, which well verifies the important role of the has-miR-942-3p in the occurrence and prognosis of gastric cancer.

5. Conclusions

This study built the five miRNAs (has-miR-9-3p, has-miR-135b-3p, has-miR-143-5p, has-miR-942-3p, has-miR-196-3p) prognostic modules, also verified and evaluated the prediction ability of the five miRNAs by grouping. They can be used as an independent factor in the prognosis of gastric cancer. By predicting the target genes to explore the potential biological functions, our results could provide a deeper understanding of the occurrence and development. This study identified the AR gene regulated by has-miR-942-3p which may depend on the MAPK/ERK signaling pathway to promote the proliferation of cancer cells. In future experiments, we will further explore the regulatory mechanisms of other miRNAs (has-miR-9-3p, has-miR-135b-3p, has-miR-143-5p, has-miR-196-3p) to provide effective prediction and treatment targets for gastric cancer patients.

Author Contributions

Conceptualization and supervision, W.L. and X.C.; methodology, W.L., N.Y., X.R. and X.C.; software, W.L. and N.Y.; validation, W.L., N.Y. and X.R.; writing—original draft, W.L., N.Y. and X.R.; visualization, W.L. and X.C.; Writing—review and editing, W.L. and N.Y. All authors have read and agreed to the published version of the manuscript.

Funding

This research received no external funding.

Institutional Review Board Statement

Not applicable.

Informed Consent Statement

Not applicable.

Data Availability Statement

The miRNA expression profiles, mRNA expression profiles data, and clinical information of all gastric cancer samples were gained from The Cancer Genome Atlas (TCGA) database (https://www.cancer.gov (accessed on 20 August 2022)).

Acknowledgments

We thank TCGA for providing access to miRNA and mRNA profiles, and their clinical patient information. We appreciate the professors at Hangzhou Dianzi University for providing valuable insights that helped us significantly improve the quality of the manuscript.

Conflicts of Interest

The authors declare no conflict of interest.

References

  1. Orditura, M.; Galizia, G.; Sforza, V.; Gambardella, V.; Fabozzi, A.; Laterza, M.M.; Andreozzi, F.; Ventriglia, J.; Savastano, B.; Mabilia, A.; et al. Treatment of gastric cancer. World J. Gastroenterol. 2014, 20, 1635–1649. [Google Scholar] [CrossRef] [PubMed]
  2. Gires, O. Lessons from common markers of tumor-initiating cells in solid cancers. Cell. Mol. Life Sci. 2011, 68, 4009–4022. [Google Scholar] [CrossRef] [PubMed]
  3. Yang, L.; Mu, Y.; Cui, H.; Liang, Y.; Su, X. MiR-9-3p augments apoptosis induced by H2O2 through down regulation of Herpud1 in glioma. PLoS ONE 2017, 12, e0174839. [Google Scholar]
  4. Chen, Z.; Gu, D.; Zhou, M.; Yan, S.; Shi, H.; Cai, Y. Regulation of miR-143-5p on cadmium-induced renal cell apoptosis and its mechanism. J. Nanjing Med. Univ. Nat. Sci. Ed. 2015, 35, 490–495. [Google Scholar]
  5. Ma, R.; Yan, W.; Zhang, G.; Lv, H.; Liu, Z.; Fang, F.; Zhang, W.; Zhang, J.; Tao, T.; You, Y.; et al. Upregulation of miR-196b confers a poor prognosis in glioblastoma patients via inducing a proliferative phenotype. PLoS ONE 2012, 7, e38096. [Google Scholar]
  6. Chen, M.; Ma, L.; Teng, Y. Research Progress of miRNA-135b in Tumor Development. Med. Recapitul. 2018, 24, 4836–4841. [Google Scholar]
  7. Verma, H.K.; Bhaskar, L. MicroRNA a small magic bullet for gastric cancer. Gene 2020, 753, 144801. [Google Scholar] [CrossRef]
  8. Lin, A.; Wang, G.; Duan, R.; Li, T. Expression of miRNA-449b in gastric cancer and lymph node metastasis. Acta Acad. Med. Wannan 2015, 34, 113–116. [Google Scholar]
  9. Ma, X.; Lu, K.; Lei, J.; Ji, L.; Shi, L. Relationship between the methylation and expression of microRNA-375 and its clinicopathological characteristics in gastric cancer. Prog. Mod. Biomed. 2018, 18, 1931–1935. [Google Scholar]
  10. Han, W.; Su, X. The mechanism of miRNA-30c in gastric cancer. In Proceedings of the National Symposium on Tumor Epidemiology and Etiology, Chengdu, China, 19 August 2015. [Google Scholar]
  11. Robinson, M.D.; McCarthy, D.J.; Smyth, G.K. edgeR: A bioconductor package for differential expression analysis of digital gene expression data. Bioinformatics 2010, 26, 139–140. [Google Scholar] [CrossRef]
  12. Yao, T.; Liu, Y.; Li, C.; Hu, L. Regression model analysis of survival data-Cox proportional hazard regression model analysis of survival data. Sichuan Ment. Health 2020, 33, 27–32. [Google Scholar]
  13. Zhe, W.; Ryan, M. TModel-free posterior inference on the area under the receiver operating characteristic curve. J. Stat. Plan. Inference 2020, 209, 174–186. [Google Scholar]
  14. Yu, G.; Wang, L.G.; Han, Y.; He, Q. clusterProfiler: An R package for comparing biological themes among gene clusters. OMICS J. Integr. Biol. 2012, 16, 284–287. [Google Scholar] [CrossRef] [PubMed]
  15. Szklarczyk, D.; Morris, J.H.; Cook, H. The STRING database in 2017: Quality-controlled protein-protein association networks, made broadly accessible. Nucleic Acids Res. 2017, 45, D362–D368. [Google Scholar] [CrossRef] [PubMed]
  16. Bertoli, G.; Cava, C.; Castiglioni, I. MicroRNAs: New Biomarkers for Diagnosis, prognosis, Therapy prediction and Therapeutic Tools for Breast Cancer. Theranostics 2015, 5, 1122–1143. [Google Scholar] [CrossRef] [PubMed]
  17. Gao, X.; Xie, Z.; Wang, Z.; Cheng, K.; Liang, K.; Song, Z. Overexpression of miR-191 predicts poor prognosis and promotes proliferation and invasion in esophageal squamous cell carcinoma. Yonsei Med. J. 2017, 58, 1101–1110. [Google Scholar] [CrossRef] [PubMed]
  18. Teng, C.; Zheng, H. Low expression of microRNA-1908 predicts a poor prognosis for patients with ovarian cancer. Oncol. Lett. 2017, 14, 4277–4281. [Google Scholar] [CrossRef]
  19. Yang, J.; Zhang, H.F.; Qin, C.F. MicroRNA-217 functions as a prognosis predictor and inhibits pancreatic cancer cell proliferation and invasion via targeting E2F3. Eur. Rev. Med. Pharmacol. 2017, 21, 4050–4057. [Google Scholar]
  20. Si, L.; Tian, H.; Yue, W.; Li, L.; Li, S.; Gao, C.; Qi, L. Potential use of microRNA-200c as a prognostic marker in non-small cell lung cancer. Oncol. Lett. 2017, 14, 4325–4330. [Google Scholar] [CrossRef] [Green Version]
  21. Liang, B.; Zhao, J.; Wang, X. A three-microRNA signature as a diagnostic and prognostic marker in clear cell renal cancer: An in silico analysis. PLoS ONE 2017, 12, e0180660. [Google Scholar] [CrossRef]
  22. Shi, X.H.; Li, X.; Zhang, H.; He, R.Z.; Zhao, Y.; Zhou, M.; Pan, S.T.; Zhao, C.L.; Feng, Y.C.; Wang, M.; et al. A five-microRNA signature for survival prognosis in pancreatic adenocarcinoma based on TCGA data. Sci. Rep. 2018, 8, 7638. [Google Scholar] [CrossRef] [PubMed]
  23. Zhang, C.; Zhang, C.D.; Ma, M.H. Three-microRNA signature identified by bioinformatics analysis predicts prognosis of gastric cancer patients. World J. Gastroenterol. 2018, 24, 1206–1215. [Google Scholar] [CrossRef] [PubMed]
  24. Park, J.Y.; Juhnn, Y.S. cAMP signaling increases histone deacetylase 8 expression via the Epac2-Rap1A-Akt pathway in H1299 lung cancer cells. Exp. Mol. Med. 2017, 49, e297. [Google Scholar] [CrossRef] [PubMed]
  25. Jagriti, P.; Vikas, P.; Anupam, K.; Kavneet, K.; Chitra, S.; Kumaravel, S. Genetic landscape of glioma reveals defective neuroactive ligand receptor interaction pathway as a poor prognosticator in glioblastoma patients. Cancer Res. 2017, 77, 2454. [Google Scholar] [CrossRef]
  26. Higa, G.M.; Fell, R.G. Sex hormone receptor repertoire in breast cancer. Int. J. Breast Cancer 2013, 2013, 284036. [Google Scholar] [CrossRef]
  27. Li, D.; Zhou, W.; Pang, J.; Tang, Q.; Zhong, B.; Shen, C.; Xiao, L.; Hou, T. A magic drug target: Androgen receptor. Med. Res. Rev. 2019, 39, 1485–1514. [Google Scholar] [CrossRef]
  28. Li, J.; Al-Azzawi, F. Mechanism of androgen receptor action. Maturitas 2009, 63, 142–148. [Google Scholar] [CrossRef]
  29. Salma, S.; Stephen, J.L.; Christopher, A.L.; Alan, P.L.; Maria, M. The p14ARF tumor suppressor restrains androgen receptor activity and prevents apoptosis in prostate cancer cells. Cancer Lett. 2020, 483, 12–21. [Google Scholar]
  30. Peng, L.; Li, Y.; Wei, S.; Li, X.; Zhang, G. LAMA4 activated by Androgen receptor induces the cisplatin resistance in gastric cancer. Biomed. Pharmacother. 2020, 124, 109667. [Google Scholar] [CrossRef]
  31. McCubrey, J.A.; Steelman, L.S.; Chappell, W.H.; Abrams, S.L.; Wong, E.W.; Chang, F.; Lehmann, B.; Terrian, D.M.; Milella, M.; Tafuri, A.; et al. Roles of the Raf/MEK/ERK pathway in cell growth, malignant transformation and drug resistance. Biochim. Biophys. Acta 2007, 1773, 1263–1284. [Google Scholar] [CrossRef] [Green Version]
  32. Roberts, P.J.; Der, C.J. Targeting the Raf-MEK-ERK mitogen-activated protein kinase cascade for the treatment of cancer. Oncogene 2007, 26, 3291–3310. [Google Scholar] [CrossRef] [PubMed]
  33. Liao, R.S.; Ma, S.; Miao, L.; Li, R.; Yin, Y.; Raj, G.V. Androgen receptor-mediated non-genomic regulation of prostate cancer cell proliferation. Transl. Androl. Urol. 2013, 2, 187–196. [Google Scholar] [PubMed]
Figure 1. Clustering heatmap of differentially expressed miRNA.
Cimb 44 00263 g001
Figure 2. Volcanic maps of differentially expressed miRNAs.
Cimb 44 00263 g002
Figure 3. Five miRNAs associated with overall survival. (a) has-miR-135b-3p; (b) has-miR-942-3p; (c) has-miR-9-3p; (d) has-miR-143-5p; and (e) has-miR-196b-3p.
Cimb 44 00263 g003aCimb 44 00263 g003b
Figure 4. Verification and assessment of the five miRNAs. Kaplan–Meier curves in the (a) training group, (b) testing group, (c) whole group; The AUC curves in the (d) training group, (e) testing group, (f) whole group; Survival status of patients in high-risk and low-risk in the (g) training group, (h) testing group, (i) whole group.
Cimb 44 00263 g004aCimb 44 00263 g004b
Figure 5. Venn diagram of target genes. (a) hsa-miR-9-3p; (b) hsa-miR-196-3p; (c) hsa-miR-135b-3p; (d) hsa-miR-942-3p; (e) hsa-miR-143-5.
Cimb 44 00263 g005
Figure 6. Network diagram of miRNAs regulating mRNAs. (a) Regulatory network between five miRNAs and 196 target genes. Red triangles mean 3 up-regulated miRNAs, blue arrows mean 2 down-regulated miRNAs, (b) green rhomboids mean 121 up-regulated mRNAs, and (c) yellow circles mean 75 down-regulated mRNAs.
Cimb 44 00263 g006aCimb 44 00263 g006b
Figure 7. Functional enrichment analysis of target genes. (a) BP; (b) CC; (c) MF; (d) KEGG signaling pathways.
Cimb 44 00263 g007
Figure 8. Core genes of PPI network.
Cimb 44 00263 g008
Figure 9. Eight target genes associated with overall survival. (a) AKAP12; (b) AR; (c) DEIP1/DZIP1; (d) PCDHA11; (e) PCDHA12; (f) P115; (g) SH3BGRL; (h) TMEM108.
Cimb 44 00263 g009aCimb 44 00263 g009b
Figure 10. AR working mechanism. DHT: 5α-dihydrotestosterone; HSPs: heat shock proteins; TFs: transcription factors; RNA pol II: RNA polymerase II.
Cimb 44 00263 g010
Figure 11. Potential relationship between the AR and MAPK/ERK signaling pathways. PI3K: phosphoinositide 3-kinase; Src: Src family kinase; RAS: Ras GTPase; PKC: protein kinase C.
Cimb 44 00263 g011
Table 1. The miRNA and mRNA expression profiles information.
VariablesmiRNA Expression ProfilesmRNA Expression Profiles
CaseCount436380
Primary SiteStomachstomach
ProgramTCGATCGA
ProjectTCGA-STADTCGA-STAD
FilesCount491407
Data CategoryTranscriptome ProfilingTranscriptome Profiling
Data TypeIsoform Expression QuantificationGene Expression Quantification
Workflow TypeBCGSC miRNA ProfilingHTSeq-Counts
Table 2. All patient information.
Variables CasePercentage (%)
GenderMale28564.3
Female15835.7
Age (years)Range30–90
Median683.1
Futime (day)Range0–3720
Median422
Fustat117138.6
027261.3
Clinical stageI5913.2
II13029.2
III18341.1
IV449.9
Unknown276
T stageT1235
T29320.8
T319844.6
T411926.7
TX102.2
Lymph node stageN013229.7
N111926.8
N28519.1
N38819.7
NX173.8
Unknown20.4
MetastaticM039188.2
M1306.7
MX224.9
Table 3. Univariate Cox regression and multivariate Cox regression of differentially expressed miRNAs.
IDUnivariate Cox RegressionMultivariate Cox Regression
HRHR.95LHR.95Hp-ValueCoefHRHR.95LHR.95Hp-Value
hsa-miR-96-5p0.7610.6420.9030.002
hsa-miR-7-5p0.8010.6950.9230.002
hsa-let-7e-3p1.3791.1121.710.003
hsa-miR-143-5p1.2651.0771.4870.0040.1341.1440.9611.3610.129
hsa-miR-942-3p0.7270.5860.9020.004−0.1780.8370.6631.0560.132
hsa-miR-183-5p0.8060.690.9420.007
hsa-miR-196b-3p0.6480.4680.8970.009−0.3070.7360.5271.0270.072
hsa-miR-125a-5p1.4011.0671.8390.015
hsa-miR-135b-3p0.7990.6650.960.017−0.1480.8620.7061.0520.144
hsa-miR-30a-3p1.211.0241.4280.025
hsa-miR-652-5p0.7840.6230.9860.037
hsa-miR-9-3p1.171.0081.3590.0390.1471.1590.9891.3580.069
hsa-miR-99a-3p1.1751.0071.3720.040
hsa-miR-139-5p1.2211.0071.480.042
hsa-miR-137-3p1.161.0001.3460.049
Table 4. Univariate and multivariate Cox regression of clinical features.
Clinical FeaturesUnivariate Cox RegressionMultivariate Cox Regression
HRHR.95LHR.95Hp-ValueHRHR.95LHE.95Hp-Value
Age1.0150.9991.0320.0621.0271.0101.0450.002
Gender1.2250.8531.7600.2711.5101.0272.2180.036
Grade1.2780.9081.8000.1601.1150.7811.5910.550
Stage1.6071.2941.996<0.0011.2100.8071.8150.357
T1.2881.0381.5990.0221.2150.9111.6210.186
M1.8801.0133.4890.0451.8180.8443.9170.127
N1.3611.1701.584<0.0011.2330.9871.5400.065
riskScore1.7261.3952.136<0.0011.9711.5572.494<0.001
Table 5. KEGG signaling pathways of the target genes.
IDDescriptionp-ValueQ-ValueCountGene
hsa04024cAMP signaling pathway0.00020.02729TIAM1/FOS/GRIA2/MAPK10/PLN/MC2R/ATP2B4/GABBR2/RAP1A
hsa05140Leishmaniasis0.00070.06035FCGR3A/FOS/STAT1/IL1A/FCGR2A
hsa04380Osteoclast differentiation0.00110.06036FCGR3A/FOS/MAPK10/STAT1/IL1A/FCGR2A
hsa05162Measles0.00170.06036CDK6/FOS/MAPK10/STAT1/IL1A/IL2RA
hsa04350TGF-beta signaling pathway0.00170.06035CDKN2B/RGMB/LEFTY1/BAMBI/RBL1
hsa04080Neuroactive ligand-receptor interaction0.00390.11489GRIA2/GRID2/MC2R/F2/GLRA2/GABRP/GRIK3/GABBR2/OPRK1
hsa05152Tuberculosis0.00620.15706FCGR3A/MAPK10/RIPK2/STAT1/IL1A/FCGR2A
hsa04658Th1 and Th2 cell differentiation0.01010.22564FOS/MAPK10/STAT1/IL2RA
hsa04933AGE-RAGE signaling pathway0.01350.25064MAPK10/STAT1/IL1A/COL4A1
hsa04218Cellular senescence0.01590.25065CDK6/CDKN2B/IL1A/CCNA2/RBL1
hsa04978Mineral absorption0.01620.25063SLC6A19/CYBRD1/ATP2B4
hsa04659Th17 cell differentiation0.01690.25064FOS/MAPK10/STAT1/IL2RA
hsa04010MAPK/ERK signaling pathway0.01870.25547CACNG8/FOS/MAPK10/IL1A/STMN1/FGF5/RAP1A
hsa04917Prolactin signaling pathway0.02660.32443FOS/MAPK10/STAT1
hsa04110Cell cycle0.02740.32444CDK6/CDKN2B/CCNA2/RBL1
hsa04068FoxO signaling pathway0.03260.32474CDKN2B/MAPK10/KLF2/RAG2
hsa05133Pertussis0.03290.32473FOS/MAPK10/IL1A
hsa05212Pancreatic cancer0.03290.32473CDK6/MAPK10/STAT1
hsa05418Fluid shear stress and atherosclerosis0.03920.34714FOS/MAPK10/KLF2/IL1A
hsa04742Taste transduction0.04100.34713PDE1C/TAS2R5/GABBR2
Table 6. Identification of the top ten core genes.
Node_NameMCCDMNCMNCDegreeEPCBottle
Neck
Ec
Centricity
ClosenessRadialityBetweennessStressClustering
Coefficient
CCNA22360.264181835.308190.09743.9617.7992843.32453740.235
GRIA2220.23381333.492710.12944.3838.0653792.23284940.128
FOS170.22071234.894840.11146.0768.1593863.37579880.091
AR330.32971035.226180.11143.3697.9872490.43754780.200
RACGAP11310.4088933.68320.08633.0737.110210.8334840.389
RBFOX1120.2386828.26740.11135.5867.525953.05823320.179
LIN28A90.3093828.65230.09736.0957.517790.40920300.107
DSCC1280.4545730.65330.08632.0737.094392.5007040.333
GRID2130.2856728.27720.11134.9197.525366.7909180.286
OPRK1100.4633725.901130.09737.2517.7211633.94930340.143
Publisher’s Note: MDPI stays neutral with regard to jurisdictional claims in published maps and institutional affiliations.

