Abstract
Sand production is one of the main problems restricting the safe, efficient and sustainable exploitation of marine natural gas hydrate. To explore the sand-control effects of gravel packing, experiments that simulate hydrate extraction in the water-rich environment were conducted with designed hydrate synthesis and exploitation devices. Three sand control completion methods, including 120 mesh sand screen, 400 mesh sand screen, 120 mesh sand screen combined with gravel packing, are adopted. Sand and gas production rates were compared under different well types and sand control completion methods. Results show that the gas production modes of radial wells and vertical wells are almost the same at the same time due to the small experimental scale and high permeability. The sand production of the vertical well with gravel packing combined with a sand-control screen is 50% lower than that of the vertical well with sand-control screens only. Radial well with gravel packing combined with sand-control screens produced 87% less sand than screen mesh alone. The cumulative gas production and recovery rates of a radial well with the composite sand control method are better than those without gravel packing in the same development time.
1. Introduction
Gas hydrates are ice-like solids formed by water and natural gas under high pressure and low temperature. Rich hydrate resources are found in high latitude terrestrial frozen soil areas as well as in submarine strata [1]. It is estimated that the total amount of natural gas stored in them is 2 × 10¹⁶ m3, equivalent to 2 × 10⁴ billion tons of oil equivalent, which is twice the carbon content of the global conventional fossil energy [2,3,4]. Natural gas hydrate has attracted widespread attention from governments, enterprises, and scholars for its wide distribution, ample storage, and clean and low-carbon characteristics. It is regarded as a potential alternative energy source in the future [5,6]. The South China Sea is rich in gas hydrates [7,8]. In November 2017, the Chinese government listed hydrate as the 173rd mineral species to promote the industrialization of hydrate [9,10].
The hydrate burial in the sea area is shallow, and the sediment framework is mainly weakly consolidated and unconsolidated sandy and silty sediments with high mud content [11,12,13,14,15]. The decomposition of hydrates during the development leads to changes in the mechanical properties of the reservoir [16] and redistribution of in-situ formation stress, inducing a series of geological risk problems such as wellbore instability, wellbore sand production, formation subsidence and submarine landslides [16,17,18]. Among them, sand production is one of the key issues that restricts the safe and efficient development of hydrates [19]. Sand production can increase the amount of sunken sand in the borehole, causing damage to downhole equipment such as electric submersible pumps, increasing production cycles, and even shutting down production. Serious sand production problems occurred in the 2007 Mallik hydrate test well in Canada, the 2012 US Alaska CO2 replacement development test well, and the South China Sea Trough hydrate test well in 2013 and 2017 [20,21], which greatly affected the gas production efficiency, and the trial had to be terminated early. At present, the problem of sand production in the process of hydrate mining has not been effectively solved.
Li et al. [14,22] summarized the factors affecting sand production in hydrate reservoirs based on the dynamic phase change conditions during natural gas production, and discussed the sand production prediction and sand control of conventional oil and their enlightenment in natural gas production. Lu et al. [23] analyzed the research difficulties of sand production and the challenges faced by natural gas production in China in the light of the sand production that has been carried out at home and abroad. Huang et al. [24] compared the characteristics of sand production from hydrate reservoirs and conventional oil and gas reservoirs, summarized the research method of sand production from weakly consolidated sparse sandstone reservoirs. Sand production is unfavorable for hydrate extraction, but extreme sand control would also deteriorate productivity. The studies mentioned above rarely compared the effects of different sand control measures during the natural gas production from hydrate reservoirs.
In 2020, China carried out the second round of gas hydrate trial production in the Shenhu sea of the South China Sea. The test benefits from horizontal well depressurization and composite sand-control devices, and it created two world records for total gas production of 861,400 m3 and average daily gas production of 28,700 m3 [25]. However, this production is far from the minimum requirement for commercial exploitation of oceanic hydrate resources. Low development efficiency remains a bottleneck in the development and utilization of hydrate resources [26].
To improve the development efficiency and deal with the problem of serious sand production during the development, we proposed a new method to extract hydrate by drilling radial wellbores using a cavitation jet, with gravel packing in the liner, and the main wellbore was screened underneath. As shown in Figure 1 and Figure 2, this method firstly connects a whipstock with a guide hole to the bottom of the tubing down into the well. It then adjusts the depth and orientation of the guide hole by electromagnetic gamma and gyroscope and uses the steering action of the whipstock to window the casing at the given depth and orientation. Next, it drills a radial borehole in different directions in the hydrate reservoir by coiled tubing with a liner while drilling radial wells by abrasive jet. The abrasive is left around the radial wells as a material for gravel packing. Finally, the main wellbore is suspended with sand-control screens to achieve coiled tubing jet drilling and liner completion in one trip [27]. By gravel packing sand control, the fine components of sand production can flow out without hindrance, but the coarse components of sand production would be blocked, which improves the conductivity of the near-well regions and prevents the formation collapse caused by over sand production [22]. Based on this, this paper simulates hydrate extraction by depressurization through experiments. It compares the sand production and development effect of vertical and radial wells using sand-control screens and gravel packing combined with sand-control screens.
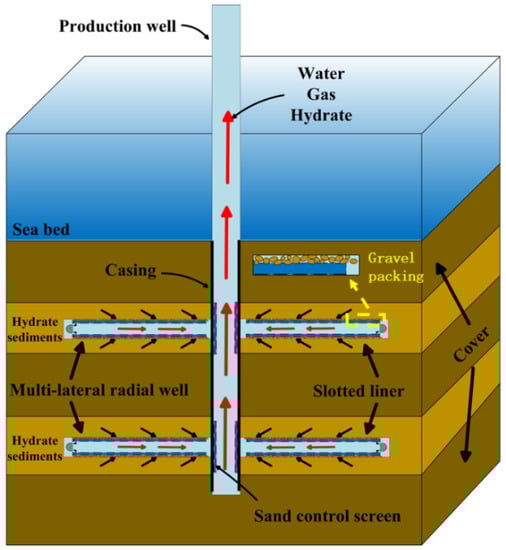
Figure 1.
Schematic diagram of the integrated development of natural gas hydrate reservoirs by abrasive waterjet drilling radial well + liner completion.
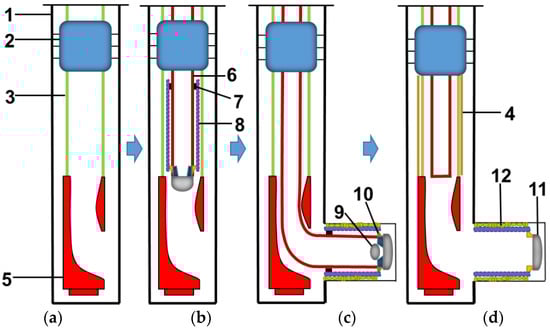
Figure 2.
Integrated design of abrasive waterjet drilling radial well + liner completion. 1—Casing 2—Tubing anchor 3—Tubing 4—Sand-control screen 5—Steerer 6—Coiled tubing 7—Rubber band 8—Slotted liner 9—Steel ball 10—Separator 11—Jet drill bit 12—Gravel packing sand-control devices (a) Run the diverter and anchor the tubing; (b) Run the coiled tubing with liner; (c) Abrasive waterjet jet sidetracking radial wellbore, throw a ball to hold down the pressure to shear the pin; (d) Separate Coiled tubing and liner, suspend screen in the main wellbore.
2. Test Device and Method
2.1. Test Device
The natural gas hydrate synthesis and development equipment is shown in Figure 3a and Figure 4, which mainly consists of a high-pressure reactor, a gas booster system, a water bath circulation system, a liquid injection system, a development metering system, and a data acquisition and processing system.
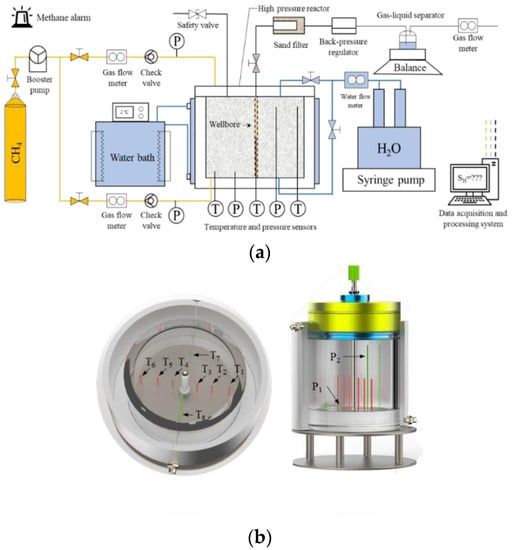
Figure 3.
(a) Schematic diagram of the hydrate synthesis and development equipment; (b) Top view and side view of the distribution of sensors.
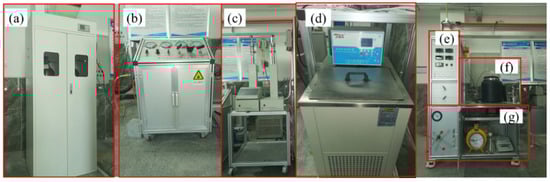
Figure 4.
Physical diagram of hydrate synthesis and development system: (a) Gas cylinder; (b) Booster pump; (c) Syringe pump; (d) Water bath system; (e) Control panel; (f) High pressure reactor; (g) Metering system.
The inner diameter and height of the reactor are both 20 cm, the volume is 6.28 L, and the pressure resistance is 20 MPa. To monitor the temperature and pressure changes in the process of hydrate synthesis and decomposition, two pressure sensors (P1, P2) and eight temperature sensors (T1~T8) are dispersedly arranged inside the reactor, and the sensor distribution is shown in Figure 3b. The horizontal distance between the sensors and the center of the production wellbore is noted as r in cm; the sensor height is noted as h in cm. (r, h) is used to indicate the relative positions of the sensors: P1 (4, 2), P2 (4, 18), T1 (9, 9), T2 (5.5, 9), T3 (2.5, 9), T4 (2.5, 9), T5 (5.5, 9), T6 (9, 9), and T7 (7.75, 2), T8 (7.75, 18).
The gas booster system is mainly used to inject methane gas into the reactor to increase the pressure in the reactor and induce hydrate formation. The amount of methane injected can be obtained by a methane dry flow meter. The water bath circulation system is used to regulate the temperature inside the reactor, using ethylene glycol as the circulation fluid, with a temperature adjustment range of −10~100 °C. The liquid injection system consists of a double-cylinder liquid injection pump and a liquid flow meter with a maximum injection pressure of 70 MPa and a flow meter with an accurate reading of ±0.01 mL, which is used to inject water into the reactor. The development metering system consists of a sand filter, a back-pressure valve, a gas-liquid separation device and a methane wet flow meter. Adjusting the back-pressure valve can reduce the pressure in the production wellbore to below the hydrate phase equilibrium pressure, simulating hydrate depressurization production. Sand, water, and methane are produced through the production wellbore during depressurization. The sand filter is filled with water to collect the produced sand. The produced water and methane are separated by a gas-liquid separation device and then measured by a balance and a methane wet flow meter. The data acquisition and processing system is mainly used to collect and process the data such as temperature, pressure and flow rate generated in the experiment.
2.2. Appliance Preparation
In the preparation stage of the experiment, we processed radial wells, vertical wells and pre-gravel-packing devices. The total length of the radial well and the vertical well is 400 mm. As shown in Figure 5, the total length of the gravel-packed barrel of the vertical well is 100 mm, and the total length of the gravel-packed barrel of the radial well is 220 mm. The actual use of radial wells and vertical wells is simulated by changing the number of holes on the test pieces. The length of the gravel packing device is also related to the distribution of holes.
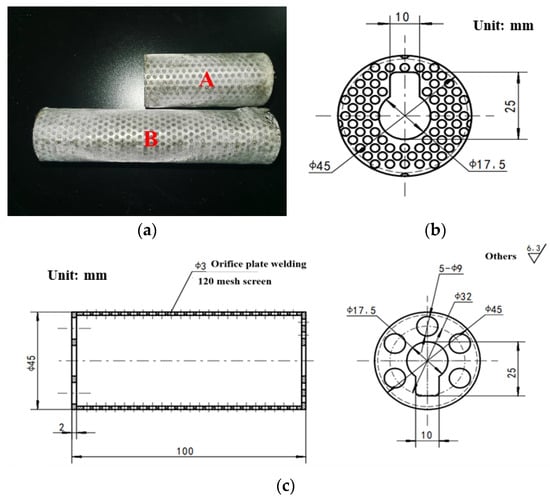
Figure 5.
(a) Real shot of gravel packing device, A: Gravel-packed barrels for vertical wells; B: Gravel packing barrel for radial well; (b) right side view of mechanical drawing of gravel packing device (c) front and left side view of mechanical drawing of gravel packing device.
2.3. Experimental Design
To compare the sand production of vertical and radial wells under different sand control measures, the synthetic hydrate specimens need to have similar physical properties. This experiment is based on the data of cores extracted from hydrate reservoirs in the Shenhu area, South China Sea [28]. According to the results of the second gas hydrate trial production in the South China Sea, the lithology of the shenhu area is mainly argillaceous silt, and the minerals are mainly argillaceous, sandy and calcalous, with an average of 47.2%, 36.4% and 10.2%, respectively. The thickness of the hydrate layer is 45.6 m, and there is solid hydrate and liquid water in the pores. The average effective porosity is 37.3%, the average hydrate saturation is 31.0%, and the average permeability is 2.38 mD [25]. A 16–500 mesh quartz sand was selected for sample preparation. The weight percentage of the quartz sand used in the experiment is as follows: 16–26 mesh (615–1000 μm) is 14.8%, 26–40 mesh (380–615 μm) is 14.55%, 40–70 mesh (212–380 μm) is 14.55%, 70–120 mesh (120–212 μm) is 16.1%, 120–240 mesh (61–120 μm) is 16.1%, 240–500 mesh (30–61 μm) 23.9% (Figure 6). The sand grain diameter ranges from 30 to 1000 μm.
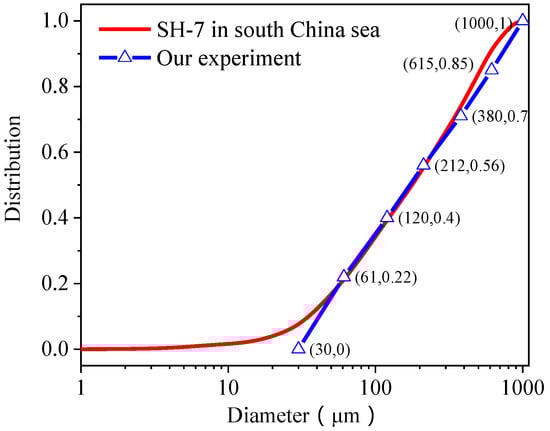
Figure 6.
Grain size composition used to synthesize hydrate samples.
We used three different sand control methods to analyze sand production in vertical and radial wells: 120 mesh (125 μm) sand screen, 400 (38 μm) mesh sand screen and gravel packing combining screen. A 26–70 mesh quartz sand was selected for gravel packing according to previous research [29]. The choice of a 400 mesh sand control method is just to serve as a control group to observe the sand control effect of improving sand control accuracy in the case of incomplete sand control and compare it with the compound sand control method. Natural gas hydrates have different occurrence states, and this paper focuses on sand production during the depressurization of hydrate samples in water rich environments. Five sets of experiments were carried out, and the key parameters of the experiments are shown in Table 1. Figure 7 is a schematic diagram of natural gas production by depressurization in vertical and radial wells. Figure 7 can be seen as a sectional view. The entire radial well was divided into six perforation layers, with four perforations in each layer, and for a total of 24. The porosity and initial water saturation of the sample were determined by quartz sand and distilled water dosage. The water bath cycle was started to adjust the temperature in the reactor to 20 °C. Methane was injected into the reactor through the booster pump, and the pressure in the reactor was increased to 11 MPa. Hydrates cannot be synthesized under the temperature and pressure combination. The amount of methane injected into the reactor can be obtained by the gas equation of state. The gas equation of state is BWRS. Set the circulating temperature of the water bath to 3 °C and lower the temperature in the reactor. When the hydrate is formed, the pressure in the reactor will drop significantly, and the temperature changes accordingly. With the monitored temperature and pressure data, the real-time saturation of the gas phase, liquid phase, and hydrate phase can be obtained by mass conservation equations. In the experimental preparation stage, the quartz sand needs to be well mixed with water. Pre-place the processed wellbore in the reactor, and then the mixed sand is put into the reaction kettle and compacted, as shown in Figure 8a. In the experiment using only sand-control screens, the sand-control screens should also be wrapped on the wellbore in advance. In the composite sand control experiment combining sand-control screens and gravel packing, the gravel packing cylinder should also be preset around the wellbore, as shown in Figure 8b).

Table 1.
Key parameters for natural gas production experiments.
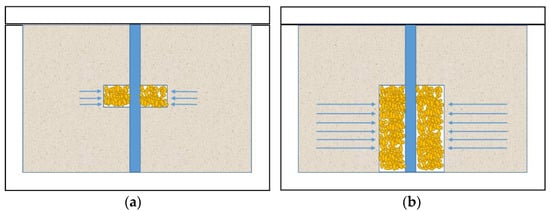
Figure 7.
Schematic diagram of depressurization of hydrate specimens: (a) vertical well; (b) radial wells.
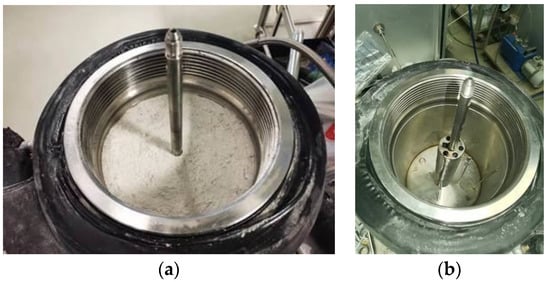
Figure 8.
(a) Compacted sand in the kettle; (b) Gravel packing device pre-positioned in the reactor.
2.4. Synthesis of Hydrate Specimens
After the preparation of the experiment, methane was injected into the kettle for pressure testing. After confirming that the reaction kettle was well sealed and there was no gas leakage, the pressure was continuously injected to 11 MPa. Then, the water bath circulating cooling device was turned on to start the hydrate synthesis. When the hydrate synthesis was completed, the pressure in the kettle was 4 MPa. At this time, the liquid injection pump was turned on to inject pure water into the reaction kettle for secondary generation of hydrates, which also creates a water-rich environment (secondary formation is to continue to generate hydrate through gas injection or water injection according to different experimental requirements in order to further improve hydrate saturation after the first hydrate synthesis). In the vertical well experiment, 500 mL pure water was injected into the kettle, and in the radial well experiment, 950 mL pure water was injected into the kettle. The difference in water injection volume was due to the fact that 500 mL of water was not sufficient to increase saturation to 40% for the vertical well experiments, so it was decided to increase water use for the radial well experiments. Figure 9 shows the change of the average temperature and pressure in the reactor during the hydrate formation process and the hydrate saturation obtained after 30 h of synthesis.
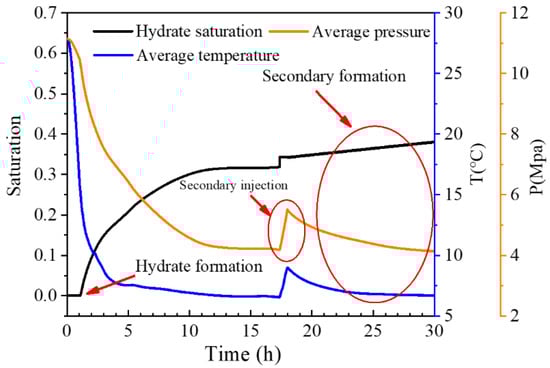
Figure 9.
Variation in average temperature and pressure in the reactor and hydrate saturation derived at 30 h into the synthesis.
3. Results and Analysis
3.1. Temperature and Pressure Change in Vertical Well Depressurization of Hydrate Sediments
The pressure changes during the process of vertical well depressurization of water-rich hydrates are shown in Figure 10a,b. Due to the limitation of the experimental apparatus, the control of outlet pressure was mainly achieved by manually adjusting the back-pressure valve. Therefore, the outlet pressure fluctuated in the range of 2.0 to 2.5 MPa during the experiment. Figure 10a shows that the vertical well was developed with a 120 mesh sand-control screen. The outlet valve was opened at the initial moment, and the outlet pressure dropped rapidly. The pressure at the pressure measurement point 1 and point 2 in the reactor also dropped rapidly with the outlet pressure. After the back-pressure was slowly regulated to 2.5 MPa, the pressure in the reactor dropped simultaneously with the outlet pressure, and the pressure propagation almost ended when the development proceeded to 0.5 h. Since the back-pressure valve was affected by temperature, a slight decrease occurred after 0.57 h. The decrease in back pressure led to a decrease of pressure in the kettle and, finally, the back pressure and pressure in the kettle stabilized at 2.1 MPa. Figure 10b corresponds to the composite sand control method of 120 mesh sand-control screen and gravel packing adopted in the vertical well. Due to the significant seepage resistance in the early stage of development, the free water generated by hydrate decomposition and the primary formation water are difficult to discharge, which greatly restricts the expansion of pressure drop to the deep formation. In addition, free gas generated by hydrate decomposition can also inhibit pressure drop to a certain extent. Therefore, pressure drop at the pressure measurement point 2 appears a short lag in the early stage of exploitation, but the duration is relatively short. There is no significant difference in pressure drop propagation between the two sand control methods in vertical wells over the entire production cycle.
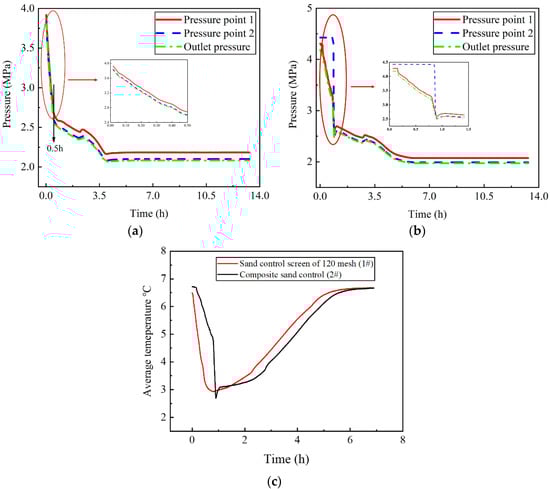
Figure 10.
(a) Pressure change diagram of 120 mesh sand-control screen in vertical well depressurization; (b) Pressure change diagram of 120 mesh sand-control screen + gravel packing in vertical well depressurization; (c) The average temperature change diagram of two different sand control method in vertical well depressurization.
It can be seen from Figure 10c that the average temperature (the average temperature is the arithmetic mean of eight temperature measuring points in the kettle) in the reactor drops sharply in the initial stage of depressurization, which is mainly caused by the Joule–Thomson effect. When the temperature drops from about 6.6 °C to 2 °C, the temperature inside the reactor remains relatively stable for a while, and the heat inflow from outside (mainly through the water bath cycle) and the heat absorption by hydrate decomposition reach a relative balance at this stage. After that, as the rate of hydrate decomposition slows down, the temperature in the reactor gradually rises.
3.2. Temperature and Pressure Change in Radial Well Depressurization of Hydrate Sediments in Water-Rich Environment
The third set of experiments was developed with a 120 mesh sand-control screen in radial well (Figure 11a). The outlet valve opens at the initial moment, and the outlet pressure drops slowly, while there is a noticeable pressure drop lag between pressure measurement point 1 and pressure measurement point 2. Two sharp pressure drops occur at the early stage of development at the pressure measurement point 2. Compared with the 120 mesh sand-control screen experiment with the vertical well, more water is injected in the secondary hydrate synthesis process of the 120 mesh sand-control screen experiment with the radial well. After the secondary synthesis of hydrate, more free water in the hydrate sample increases the seepage resistance. The effective flow channel has not been formed between the upper part of the hydrate sample and the wellbore. In addition, hydrate may be formed on the screen surface during the secondary hydrate generation process [30], which reduces the permeability of the sand-control screen.
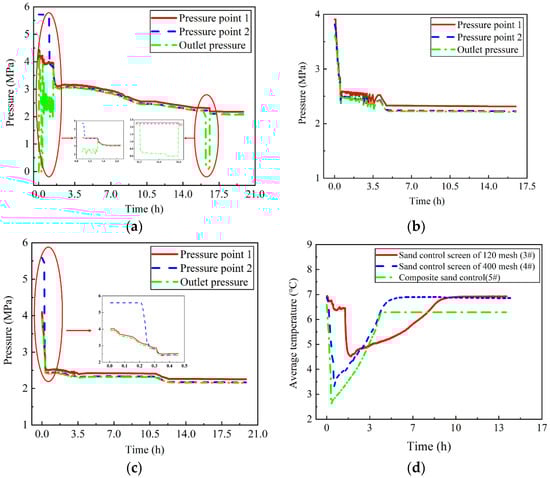
Figure 11.
(a) Pressure change diagram of 120 mesh sand-control screen in radial well depressurization; (b) Pressure change diagram of 400 mesh sand-control screen in radial well depressurization; (c) Pressure change diagram of 120 mesh sand-control screen + gravel packing in radial well depressurization; (d) Change diagram of average temperature in radial well depressurization with different sand control methods.
As the depressurization progresses, the hydrate in the near-well zone decomposes, and high-conductivity channels form. It is the reason for the first sharp pressure drop. There was a significant pressure difference between the kettle and the outlet pressure after one-hour depressurization. It was considered that there was a blockage in the sand control tank. After cleaning the sand, the change of pressure in the kettle is consistent with the back-pressure change. That is the reason for the second pressure drop. At this time, the back-pressure was set at 3 MPa. Pressure measurement point 1 and point 2 decreased to 3 MPa in the same downward trend. Then the back pressure was adjusted to 2.3 MPa, the pressure measuring points 1 and 2 declined slowly in the same trend. At the end of development, the back-pressure dropped to 2.1 MPa due to the instability of the back-pressure valve, while the pressure in the kettle was still 2.3 MPa. Therefore, the second well shutdown was carried out. After the shutdown, the pressure in the kettle dropped to 2.1 MPa.
In the fourth group of experiments, pressure measuring point 1 and pressure measuring point 2 kept consistent with the downward trend of outlet pressure. There was no apparent blockage during the development process. Compared with the 120 mesh sand-control screen, the sand control precision of the 400 mesh screen is improved, sand control capacity is enhanced, and the sand particles forming bridges on the surface and between the screens are increased [31]. In the hydrate extraction process, the pressure curve shows a trend of wavy decline. The unsmooth curve is caused by the sensor itself at the experimental scale (Figure 11b).
In the fifth experiment, causes for the lag of internal pressure changes and outlet pressure changes at the initial stage of the experiment were similar to the depressurization development of the 120-mesh sand-control screen. Since hydrate may be generated in the gravel packing device during the secondary hydrate generation process, pressure propagation is suppressed in the early stage of depressurization (Figure 11c). As the depressurization progressed, pressure measurement point 2 dropped rapidly to the same pressure as measurement 1. Then pressure measurement point 1, pressure measurement point 2 and outlet pressure dropped simultaneously until 2.3 MPa, and no blockage occurred in this development.
Compared with vertical wells, when radial wells are used for hydrate extraction through depressurization, hydrates in the near-well regions decompose more rapidly [31]. Thus, the temperature drops faster in the early stage of hydrate extraction by radial well (Figure 11d). After the hydrate is completely decomposed, the endothermic effect is terminated, and the temperature gradually rises under the influence of the ambient temperature. This phenomenon is also similar to the situation when vertical wells are used for hydrate mining. In addition, in the initial stage of the radial well using 120 mesh sand control, the gas phase saturation of the hydrate sample is relatively low, and the gas throttling expansion effect has little influence on the temperature. Therefore, the average temperature change in the reactor is not obvious in the initial stage of depressurization. After 85 min of development, the pressure dropped to the equilibrium pressure of methane hydrate. The hydrate began to decompose, and the temperature in the reactor dropped rapidly.
3.3. Analysis of Sand Control Effect
At the end of the experiment, the outlet valve was closed. The sand in the sand prevention tank was collected, then dried in an oven and weighed using an electronic balance (with an accuracy of 0.01 g). Figure 12 shows the sand production from vertical wells radial wells for depressurization. In vertical wells, the sand production with 120 mesh sand screen is 0.88 g, and the sand production with the composite sand screen is 0.41 g. In the radial well, the sand production with a 120 mesh sand screen is 2.16 g, the sand production with the composite sand screen is 0.26 g, and the sand production with a 400 mesh sand screen is 0.98 g.
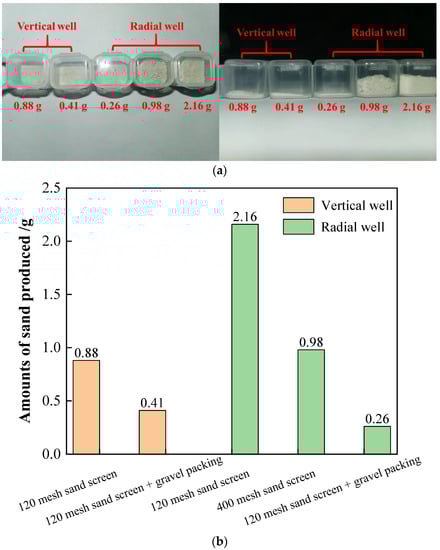
Figure 12.
(a) Real shots of sand production in vertical and radial wells; (b) Schematic diagram of sand production in vertical and radial wells.
Radial wells have more drainage channels than vertical wells, producing more sand when using 120 mesh sand screen. In vertical wells, the sand production with composite sand control is 50% less than that with 120 mesh sand control screens. The sand production of radial wells decreased significantly after the use of the composite sand control method. The sand production of the 120-mesh sand-control screen was 8.3 times that of the composite sand control method and 2.2 times that of the 400-mesh sand-control screen. Overall, the use of gravel packing for sand control is effective for both vertical and radial wells, and the effect of sand control during the development of radial wells is particularly significant.
In this paper, the amount of sand output is quantified after development, instead of being counted at different stages of development. According to Ding et al. [32], the sand production process can be divided into three stages: initial sand production, large-scale sand production and stable sand production. The flow velocity has a significant effect on sand production capacity. According to Li et al. [33], natural gas production can be divided into four stages: the initial stage of rapid decomposition, the stage of competition between decomposition and stable transformation, the stage of stable decomposition, and the stage of formation sand production. During the sand production stage, the gas-water mixture forms a high-speed flow through the formation and the formation begins to produce sand. Hydrate slug is formed at the front of the formation due to sand production, which reduces reservoir permeability to a certain extent. With the increase of slug, hydrate decomposition rate and gas production rate decrease to the lowest, and the formation gas production nearly stops. After the hydrate slug is broken through, the gas production rate increases rapidly, and the sand production increases with the increase of gas production.
3.4. Analysis of Production Capacity
Figure 13a shows the cumulative gas production during the natural gas production process of vertical wells using sand-control screens and the composite sand control method. In the initial stage of depressurization, the effect of using only sand-control screens is better than using the composite sand control method. As the development progresses to 65 min, the effect of the composite sand control method starts to be better than using only sand-control screens. At the end of the experiment, the composite sand control method had obtained more cumulative gas production.
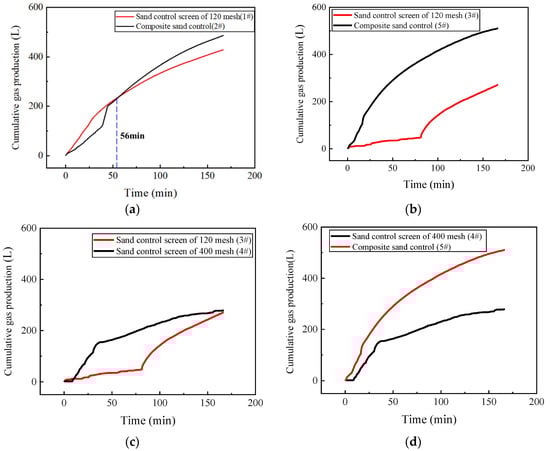
Figure 13.
(a) Comparison of cumulative gas production of different sand control methods in vertical wells; (b–d) Comparison of cumulative gas production of different sand control methods in radial well.
Figure 13b shows the cumulative gas production changes during the natural gas production process of radial wells using only sand-control screens and the composite sand control method. When using the composite sand control method, the gas production increases greatly in the early stage but decreases slightly in the later stage. While only using sand-control screens for development, production capacity growth is slow in the early stage, and there is a significant improvement in the middle and late stages. Overall, the development effect with the composite sand control method is far better than that with sand-control screens, and more gas production can be obtained.
Figure 13c shows the cumulative gas production changes during the natural gas production process of radial wells using a 120 mesh sand-control screen and a 400 mesh sand-control screen. The growth of cumulative gas production with a 400 mesh sand-control screen in the early stage is significant, and the growth rate slows down in the middle and late stages, which is the opposite of using a 120 mesh sand-control screen. However, in the early stage of development, the sand control precision of the 400-mesh sand control screen is higher. The effective flow area of the filter unit decreases and the flow rate decreases more significantly when the sand bridge is established on the screen tube surface [34]. Therefore, the gas production of the 120 mesh sand control screen at this period is slightly higher. In addition, there is little difference in the final gas production between the two methods.
Figure 13d shows the cumulative gas production changes of radial wells using a 400 mesh sand-control screen and the composite sand control method. The gas production rate of the two sand control methods in the early stage is similar. In the middle and late stages, the gas production rate of the 400 mesh sand-control screen is lower than that of the composite sand control method. The final gas production using the composite sand control method is significantly greater than that of the 400 mesh sand-control screen.
Figure 14 shows the changes in the recovery rate in vertical wells using only sand-control screens and the composite sand control method. The recovery rate using only sand-control screens is 65.9%, and the recovery rate using the composite sand control method is 74.0%. The changing trend of the recovery efficiency is basically the same as that of the cumulative gas production.
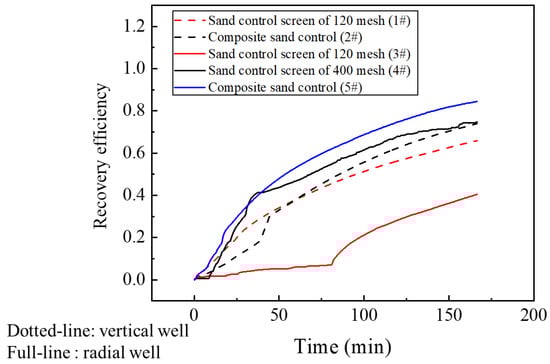
Figure 14.
Comparison of recovery efficiency of different sand control methods in vertical wells and radial wells.
Figure 14 shows the changes in the recovery rate of radial wells using a 120 mesh sand-control screen, a 400 mesh sand-control screen, and the composite sand control method. The changes in the recovery rate of the three different methods are consistent with the trend of cumulative gas production. The composite sand control method has the highest recovery rate (84.4%), followed by the 400-mesh sand-control screen (74.7%) and the 120-mesh sand-control screen (40.5%).
4. Discussion
The sand control mechanism can be categorized into three types: sand bridging inside the screen, sand separation bridging outside the screen, and high-permeability clay and sand skin formed on the screen’s surface [35]. When using high-precision screens for sand control, as the development progresses, the formation sand will invade the sand-control screen medium, causing damage to the permeability of the screen and causing a blockage. When using less sand control precision, the formation permeability can be guaranteed. However, a large amount of sand may be produced due to insufficient sand control ability. In order to make a balance between the fluidity of the sand control medium and the sand retaining performance, a composite sand control method combining gravel packing and sand screens is considered (Figure 15). This composite sand control method relies on the bridging effect of gravel particles to prevent the migration of formation sand and, at the same time, the gravel particles are blocked in the periphery of the screen as a barrier. The bridging effect of gravel packing effectively restricts the migration of coarse particles while allowing fine particles to be discharged, ensuring the permeability, making the development proceed successfully, and prolonging the life cycle of the screen.
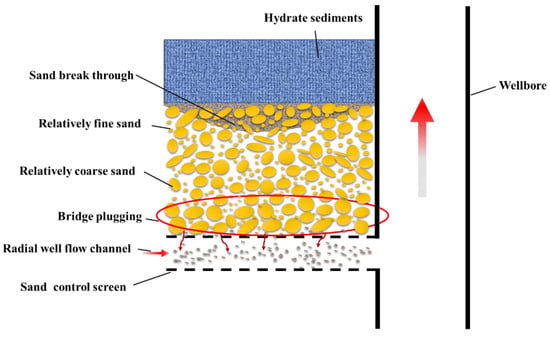
Figure 15.
Mechanism diagram of radial well depressurization development combined with sand-control screen and gravel packing.
The scaling up of experimental results is significant for guiding the trial production of hydrates. Whereas, due to the small scale of the reactor, it is of high engineering difficulty to design experiments according to similar criteria, which will result in the wellbore specimen being too small to be manufactured and gravel packing being inoperable. It is still challenging to quantify the sand production behavior for field tests through experiments, and such a dilemma also exists in previous studies.
5. Conclusions
The exploitation of hydrates in radial wells greatly improves the productivity of hydrates, but it also poses severe challenges to the drilling and completion technologies. Gravel packing sand-control technology can play a good role in restricting sand production during natural gas production, but further research is still needed. This study draws the following conclusions:
1. Gravel packing prevents the migration of formation sand by bridge plugging. Selecting the appropriate gravel size can block coarse sand and allow fine sand to pass through. It causes an increase in the permeability of the near-wellbore area, reduces pressure loss in the near-wellbore area and avoids depressurization failure. The gravel packing layer is enclosed around the sand screen, and this multi-stage filter barrier ensures that the sand is confined to the formation, so that little sand is produced during the mining period.
2. In the process of depressurization, radial wells are more prone to clogging than vertical wells. The sand control effect is noticeable after adopting the composite sand control method combining gravel packing and the sand-control screen, and the sand production problem has been effectively solved.
3. In the vertical well depressurization experiment, the sand production was reduced by 50% with the composite sand control method compared to the 120 mesh sand-control screen. For the radial well, compared with the 120 mesh sand-control screen, sand production of the composite sand control method is reduced by 87%, and the sand production of the 400 mesh sand control method is reduced by 55%. Therefore, gravel packing works for both vertical and radial wells, and its sand control effect for radial wells is particularly significant.
4. When extracting hydrates in a water-rich environment by depressurization, radial wells did not have a considerable productivity advantage over vertical wells because of the small experimental scale. However, the hydrate extraction efficiency for radial wells using gravel packing sand control for development is significantly better than the other two sand control methods.
The problem of sand production seriously affects natural gas production, while there is still a lack of solutions. The method proposed in this paper is a preliminary exploration of the composite sand control method, which verifies the effectiveness of the composite sand control method combined with gravel packing and the sand screen. However, there are still some problems in the study, such as small experimental scale and sand control failure caused by the invasion of the gravel packing layer after the secondary formation of hydrate.
Author Contributions
Conceptualization, Y.Z.; methodology, Y.Z., G.L., S.T., J.L. and B.Z.; software, P.Z.; formal analysis, W.W.; investigation, W.W.; experiments, W.W.; data curation, W.W.; writing—original draft preparation, W.W.; writing—review and editing, Y.Z. and P.Z. All authors have read and agreed to the published version of the manuscript.
Funding
This work was supported by the National Natural Science Foundation of China (Grant Nos. 51991362, 52174009 and 52004261). PetroChina Innovation Foundation (2019D-5007-0216), Science and Technology Planning Project of Guangdong Province (2021A0505030053) and Guangdong Major project of Basic and Applied Basic Research (2020B0301030003).
Institutional Review Board Statement
Not applicable.
Informed Consent Statement
Not applicable.
Data Availability Statement
All data referred to in this paper are labeled as references.
Conflicts of Interest
The authors declare no conflict of interest. Funders have no role in study design, data collection, analysis and interpretation, manuscript writing, and decision to publish results.
References
- Lall, D.; Vishal, V.; Lall, M.V.; Ranjith, P.G. The role of heterogeneity in gas production and the propagation of the dissociation front using thermal stimulation, and huff and puff in gas hydrate reservoirs. J. Pet. Sci. Eng. 2022, 208, 109320. [Google Scholar] [CrossRef]
- Sloan, E.D., Jr.; Koh, C.A. Clathrate Hydrates of Natural Gases, 3rd ed.; CRC Press: Boca Raton, FL, USA, 2007. [Google Scholar]
- China Geological Survey Report. The Trial Production of Natural Gas Hydrate in Sea Area Has Been Successful Achieved [EB/OL]. Available online: https://www.cgs.gov.cn/xwl/cgkx/201707/t20170725_436249.html (accessed on 1 January 2022).
- Zhou, S.W.; Chen, W.; Li, Q.P.; Zhou, J.L.; Shi, H.S. Research on the solid fluidization well testing and production for shallow non-diagenetic natural gas hydrate in deep water area. China Offshore Oil Gas 2017, 29, 1–8. [Google Scholar]
- Collett, T.; Bahk, J.J.; Baker, R.; Boswell, R.; Divins, D.; Frye, M.; Goldberg, D.; Husebø, J.; Koh, C.; Malone, M.; et al. Methane hydrates in nature—current knowledge and challenges. J. Chem. Eng. Data 2015, 60, 319–329. [Google Scholar] [CrossRef]
- Zhang, H.; Lu, H.L.; Liang, J.Q.; Wu, N.Y. The methane hydrate accumulation controlled compellingly by sediment grain at Shenhu, northern South China Sea. Chin. Sci. Bull. 2016, 61, 388–397. [Google Scholar] [CrossRef]
- Wu, N.Y.; Zhang, H.Q.; Yang, S.X.; Zhang, G.X.; Liang, J.Q.; Lu, J.A.; Su, X.; Schultheiess, P.; Holland, M.; Zhu, Y.H. Gas Hydrate System of Shenhu Area, Northern South China Sea: Geochemical Results. J. Geol. Res. 2011, 2011, 370298. [Google Scholar] [CrossRef] [Green Version]
- Zhang, G.X.; Liang, J.Q.; Lu, J.A.; Yang, S.X.; Zhang, M.; Holland, M.; Schultheiess, P.; Su, X.; Sha, Z.B.; Xu, H.N.; et al. Geological features, controlling factors and potential prospects of the gas hydrate occurrence in the east part of the Pearl River Mouth Basin, South China Sea. Mar. Pet. Geol. 2015, 67, 356–367. [Google Scholar] [CrossRef]
- Qiao, S.H.; Su, M.; Yang, R.; Kuang, Z.G.; Liang, J.Q.; Wu, N.Y. The Progress and Revelations of Marine Gas Hydrate Explorations: Reservoir Characteristics. Adv. N. Renew. Energy 2015, 3, 357–366. [Google Scholar]
- Su, M.; Kuang, Z.G.; Qiao, S.H.; Sha, Z.B.; Wei, W.; Zhang, J.H.; Su, P.B.; Yang, R.; Wu, N.Y.; Cong, X.R. The Progresses and Revelations of Marine Gas Hydrate Explorations (I): Purposes and Selection Evidences of the Hydrate Drilling Sites. Adv. N. Renew. Energy 2015, 3, 116–130. [Google Scholar]
- Sun, B.J.; Zhang, Z.N. Challenges and Countermeasures for the Drilling and Completion of Deepwater Wells in the South China Sea. Pet. Drill. Tech. 2015, 43, 1–7. [Google Scholar]
- Grover, T.; Holditch, S.A.; Moridis, G. Analysis of Reservoir Performance of Messoyakha Gas Hydrate Field; ISOPE-I-08-399; International Offshore and Polar Engineering: Vancouver, BC, Canada, 2008. [Google Scholar]
- Grover, T. Natural Gas Hydrates–Issues for Gas Production and Geomechanical Stability; Texas A&M University: College Stattion, TX, USA, 2008. [Google Scholar]
- Li, Y.L.; Liu, L.L.; Liu, C.L.; Sun, J.Y.; Ye, Y.G.; Chen, Q. Sanding prediction and sand-control technology in hydrate exploitation: A review and discussion. Mar. Geol. Front. 2016, 32, 36–43. [Google Scholar]
- Haberer, R.M.; Mangelsdorf, K.; Wilkes, H.; Horsfield, B. Occurrence and palaeoenvironmental significance of aromatic hydrocarbon biomarkers in Oligocene sediments from the Mallik 5L-38 gas hydrate production research well (Canada). Org. Geochem. 2006, 37, 519–538. [Google Scholar] [CrossRef]
- Japan Oil, Gas and Metals National Corporation. Petroleum Development Recent Situation: Sediment Phenomena Mechanism and Countermeasures/ How to Prevent Sediment Disorder [EB/OL]. Available online: http://www.jogmec.go.jp/library/recommend_library_10_000047.html (accessed on 1 January 2020).
- Yamamoto, K.; Dallimore, S.R. Aurora-JOGMEC-NRCan Mallik 2006–2008 Gas Hydrate Research Project Progress; Fire in the Ice, Methane Hydrate Newsletter; National Energy Technology Laboratory: Washington, DC, USA, 2008. [Google Scholar]
- Jung, J.W.; Jang, J.; Santamarina, J.C.; Tsouris, C.; Phelps, T.J.; Rawn, C.J. Gas production from hydrate-bearing sediments: The role of fine particles. Energy Fuels 2012, 26, 480487. [Google Scholar] [CrossRef]
- Yoshihiro, T.; Duncan, M.; Hay, B.; Dang, L. Deepwater Methane Hydrate Gravel Packing Completion Results and Challenges; OTC25330-MS; Offshore Technology Conference: Houston, TX, USA, 2014. [Google Scholar]
- Yan, C.L.; Xu, R.; Cheng, Y.F.; Song, B.J.; Li, Y.; Tian, W.Q. Geomechanical issues in the exploitation of natural gas hydrate. Gondwana Res. 2020, 81, 403–422. [Google Scholar] [CrossRef]
- Vikram, V.; David, L.; Samardeep, S.; Sharma, A.; Ranjith, P.G. Sensitivity analysis of methane hydrate bearing Class 3 reservoirs during thermal injection. J. Pet. Sci. Eng. 2020, 195, 107575. [Google Scholar]
- Li, Y.L.; Wu, N.Y.; Ning, F.L.; Hu, G.W.; Liu, C.L.; Dong, C.Y.; Lu, J.A. A sand-production-system for gas production from clayey silt hydrate reservoirs. China Geol. 2019, 2, 1–13. [Google Scholar] [CrossRef]
- Lu, J.S.; Li, D.L.; He, Y.; Liang, D.Q.; Xiong, Y.M. Research status of sand production during the gas hydrate exploitation process. Adv. N. Renew. Energy 2017, 5, 394–402. [Google Scholar]
- Huang, G.H.; Su, Z.; Xia, M.S.; Wu, D.D. Study on sand production in natural gas hydrate production well. Mar. Geol. Quat. Geol. 2017, 37, 178–187. [Google Scholar]
- Ye, J.L.; Qin, X.W.; Xie, W.W.; Lu, H.L.; Ma, B.J.; Qiu, H.J.; Liang, J.Q.; Lu, J.A.; Kuang, Z.G.; Lu, C.; et al. Main progress of the second gas hydrate trial production in the South China Sea. Geol. China 2020, 47, 557–568. [Google Scholar]
- Zhang, P.P.; Tian, S.C.; Zhang, Y.Q.; Li, G.S.; Ali, K.W.; Ma, L.Y.; Zhang, W.L. Numerical simulation of gas recovery from natural gas hydrate using multi-branch wells: A three-dimensional model. Energy 2021, 220, 119549. [Google Scholar] [CrossRef]
- Li, G.S.; Tian, S.C.; Zhang, Y.Q. Research progress on key technologies of natural gas hydrate exploitation by cavitation jet drilling of radial wells. Pet. Sci. Bull. 2020, 5, 349–365. [Google Scholar]
- Liu, C.L.; Ye, Y.G.; Meng, Q.G.; He, X.L.; Lu, H.L.; Zhang, J.; Liu, J.; Yang, S.X. The characteristics of gas hydrates recovered from Shenhu Area in the South China Sea. Mar. Geol. 2012, 307, 22–27. [Google Scholar] [CrossRef]
- Jin, Y.R.; Li, Y.L.; Wu, N.Y.; Yang, D.Y. Characterization of Sand Production for Clayey-Silt Sediments Conditioned to Openhole Gravel-Packing: Experimental Observations. SPE J. 2021, 26, 3591–3608. [Google Scholar] [CrossRef]
- Li, Y.L.; Wu, N.Y.; Ning, F.L.; Gao, D.L.; Hao, X.L.; Chen, Q.; Liu, C.L.; Sun, J.Y. Hydrate-induced clogging of sand-control screen and its implication on hydrate production operation. Energy 2020, 206, 118030. [Google Scholar] [CrossRef]
- Mao, P.X.; Wu, N.Y.; Ning, F.L.; Hu, G.W.; Sun, J.X.; Chen, Q.; Guo, Y.; Bu, Q.T.; Wan, Y.Z. Behaviors of gas and water production from hydrate induced by depressurization with different types of wells. Nat. Gas Ind. 2020, 40, 168–176. [Google Scholar]
- Ding, J.P.; Cheng, Y.F.; Yan, C.L.; Lu, C.; Li, Y.; Xue, M.Y. Numerical simulation on sand production in the exploitation process of gas hydrates based on skeleton failure of reservoirs. J. Nat. Gas Sci. Eng. 2021, 94, 104052. [Google Scholar] [CrossRef]
- Li, Z.D.; Gan, B.C.; Li, Z.; Zhang, H.X.; Wang, D.J.; Liu, S.F.; Li, J. An experimental study of natural gas hydrates sand production using depressurization. J. China Univ. Min. Technol. 2020, 49, 1128–1136. [Google Scholar]
- Deng, F.C.; Lin, H.; Cao, Y.F.; Pan, H.; Yan, W. Experimental study of plugging mechanisms of metal mesh screens with different particle compositions. Pet. Sci. Bull. 2017, 2, 500–506. [Google Scholar]
- Dong, C.Y.; Zhong, Y.X.; Wu, Y.X.; Zhou, Y.G.; Zeng, S.R.; Yan, Q.H. Experimental study on sand retention mechanisms and feasibilityevaluation of sand control for gas hydrate reservoirs with highly clayey fine sands. J. China Univ. Pet. 2018, 42, 79–87. [Google Scholar]
Publisher’s Note: MDPI stays neutral with regard to jurisdictional claims in published maps and institutional affiliations. |
© 2022 by the authors. Licensee MDPI, Basel, Switzerland. This article is an open access article distributed under the terms and conditions of the Creative Commons Attribution (CC BY) license (https://creativecommons.org/licenses/by/4.0/).