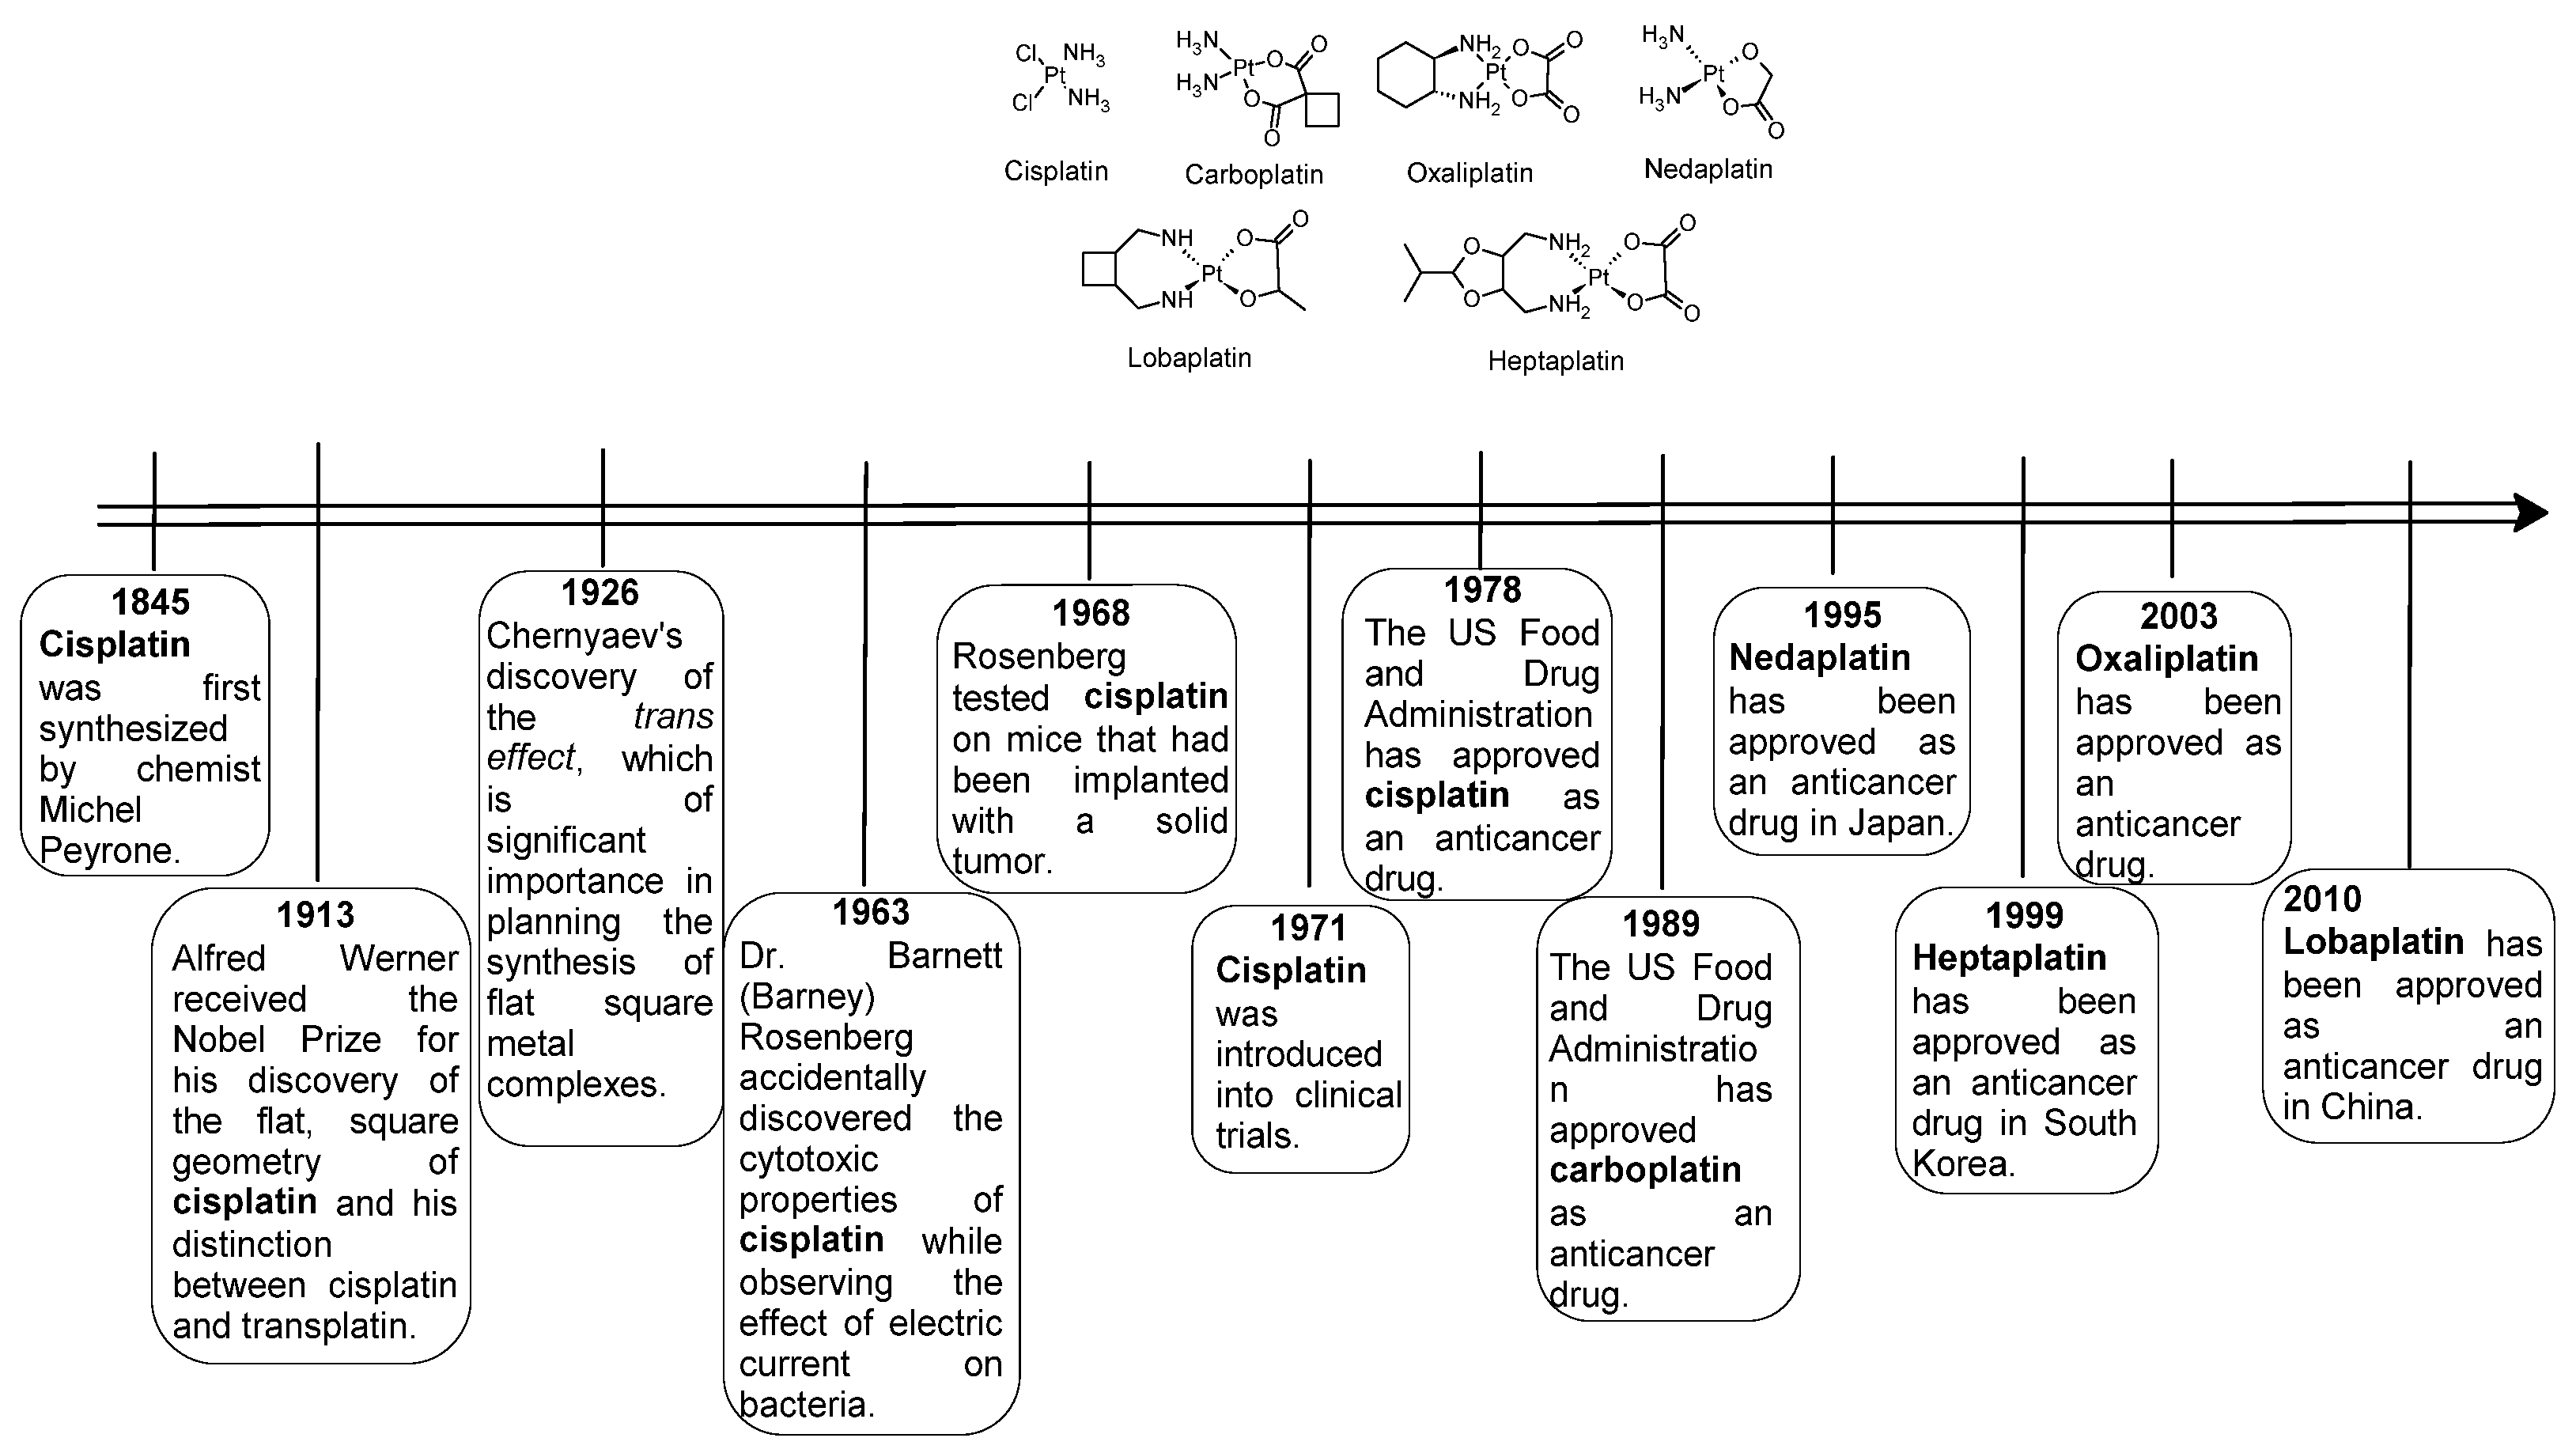
Figure 1.
Structures of platinum complexes commonly used in medicine for cancer therapy.
Figure 1.
Structures of platinum complexes commonly used in medicine for cancer therapy.
Figure 2.
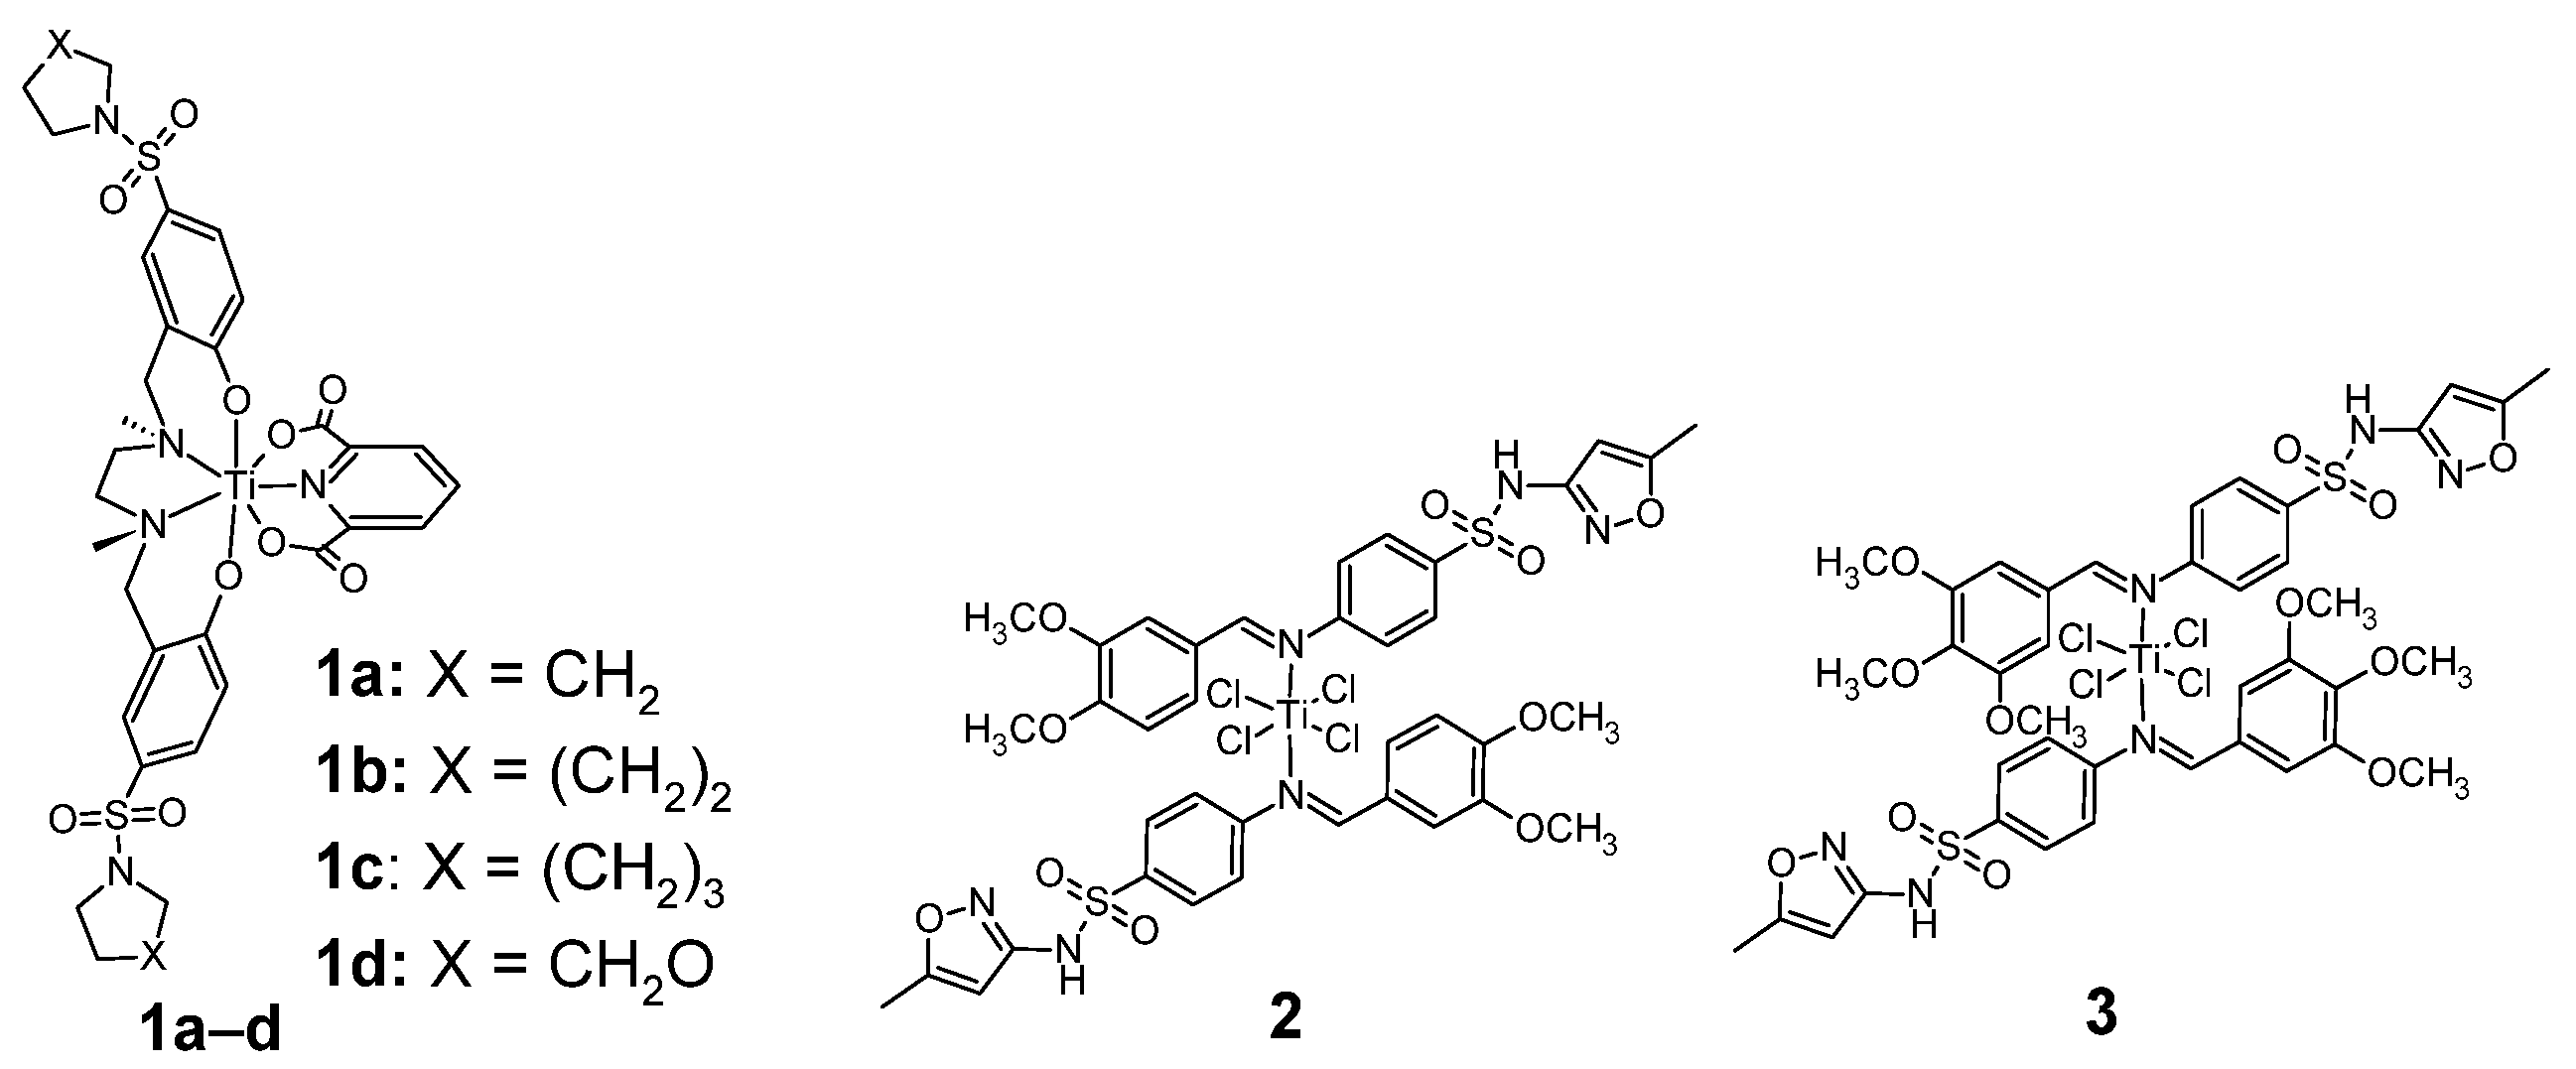
Sulfonamide complexes of titanium with antitumor activities 1–3.
Figure 2.
Sulfonamide complexes of titanium with antitumor activities 1–3.
Figure 3.
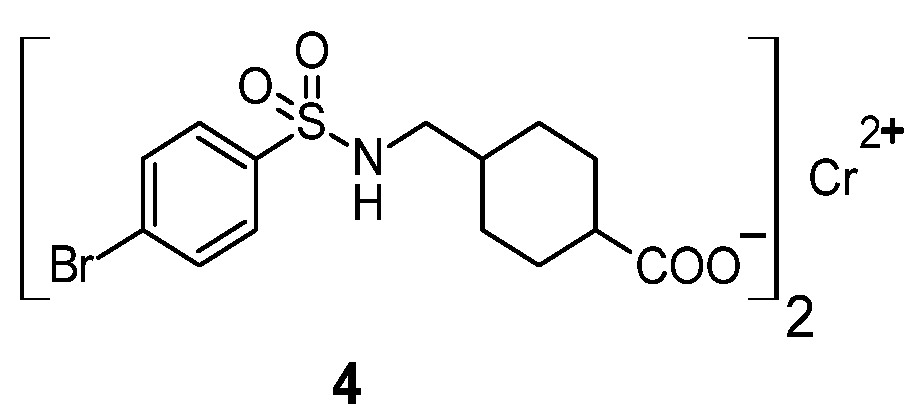
Sulfonamide complex of chromium(II) 4.
Figure 3.
Sulfonamide complex of chromium(II) 4.
Figure 4.
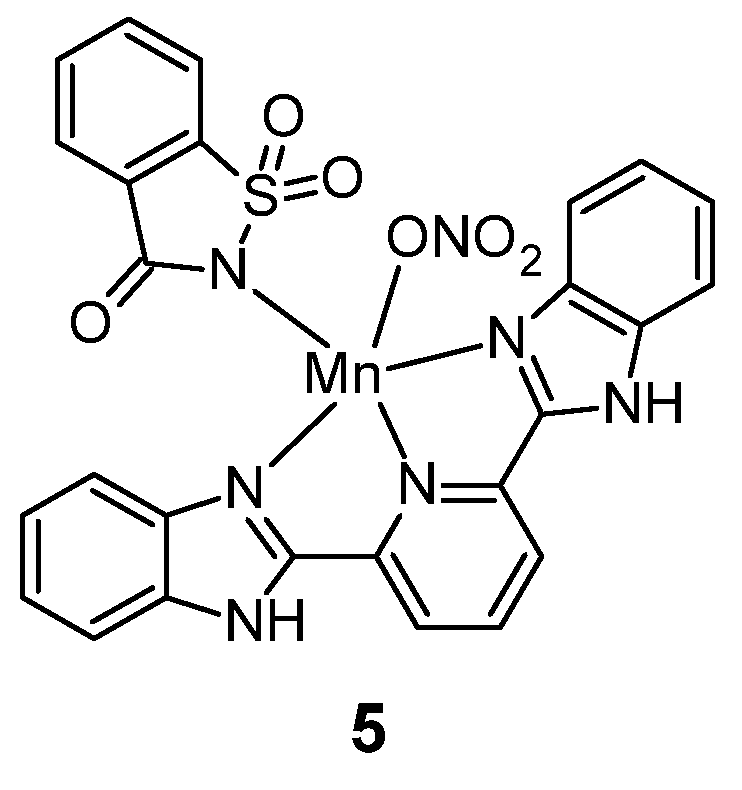
Manganese(II) complex with saccharin 5.
Figure 4.
Manganese(II) complex with saccharin 5.
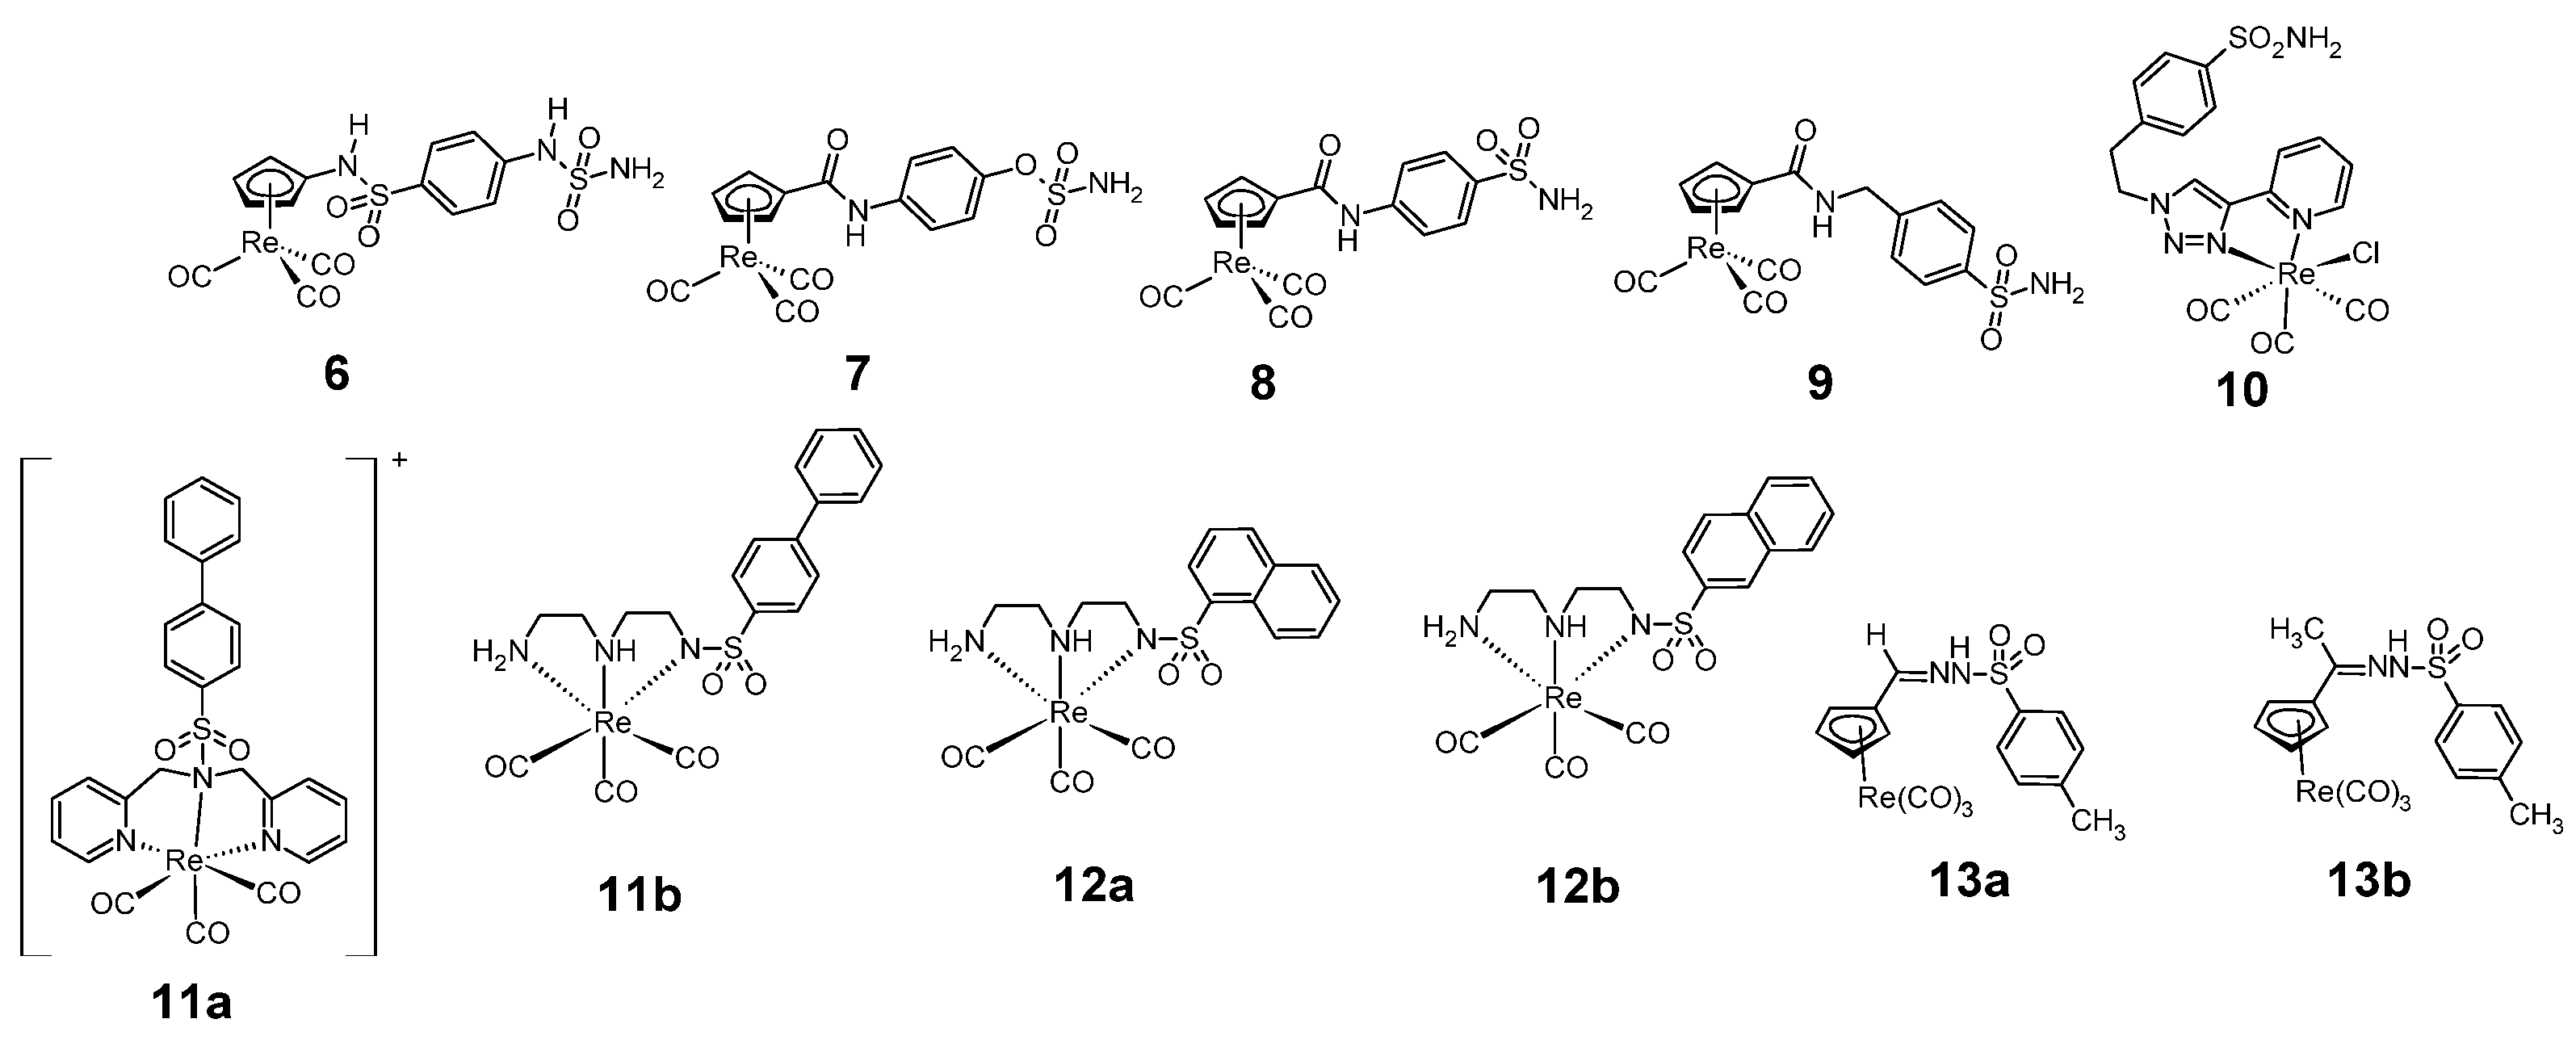
Figure 5.
Structure of anticancer sulfonamides complexes with rhenium 6–13.
Figure 5.
Structure of anticancer sulfonamides complexes with rhenium 6–13.
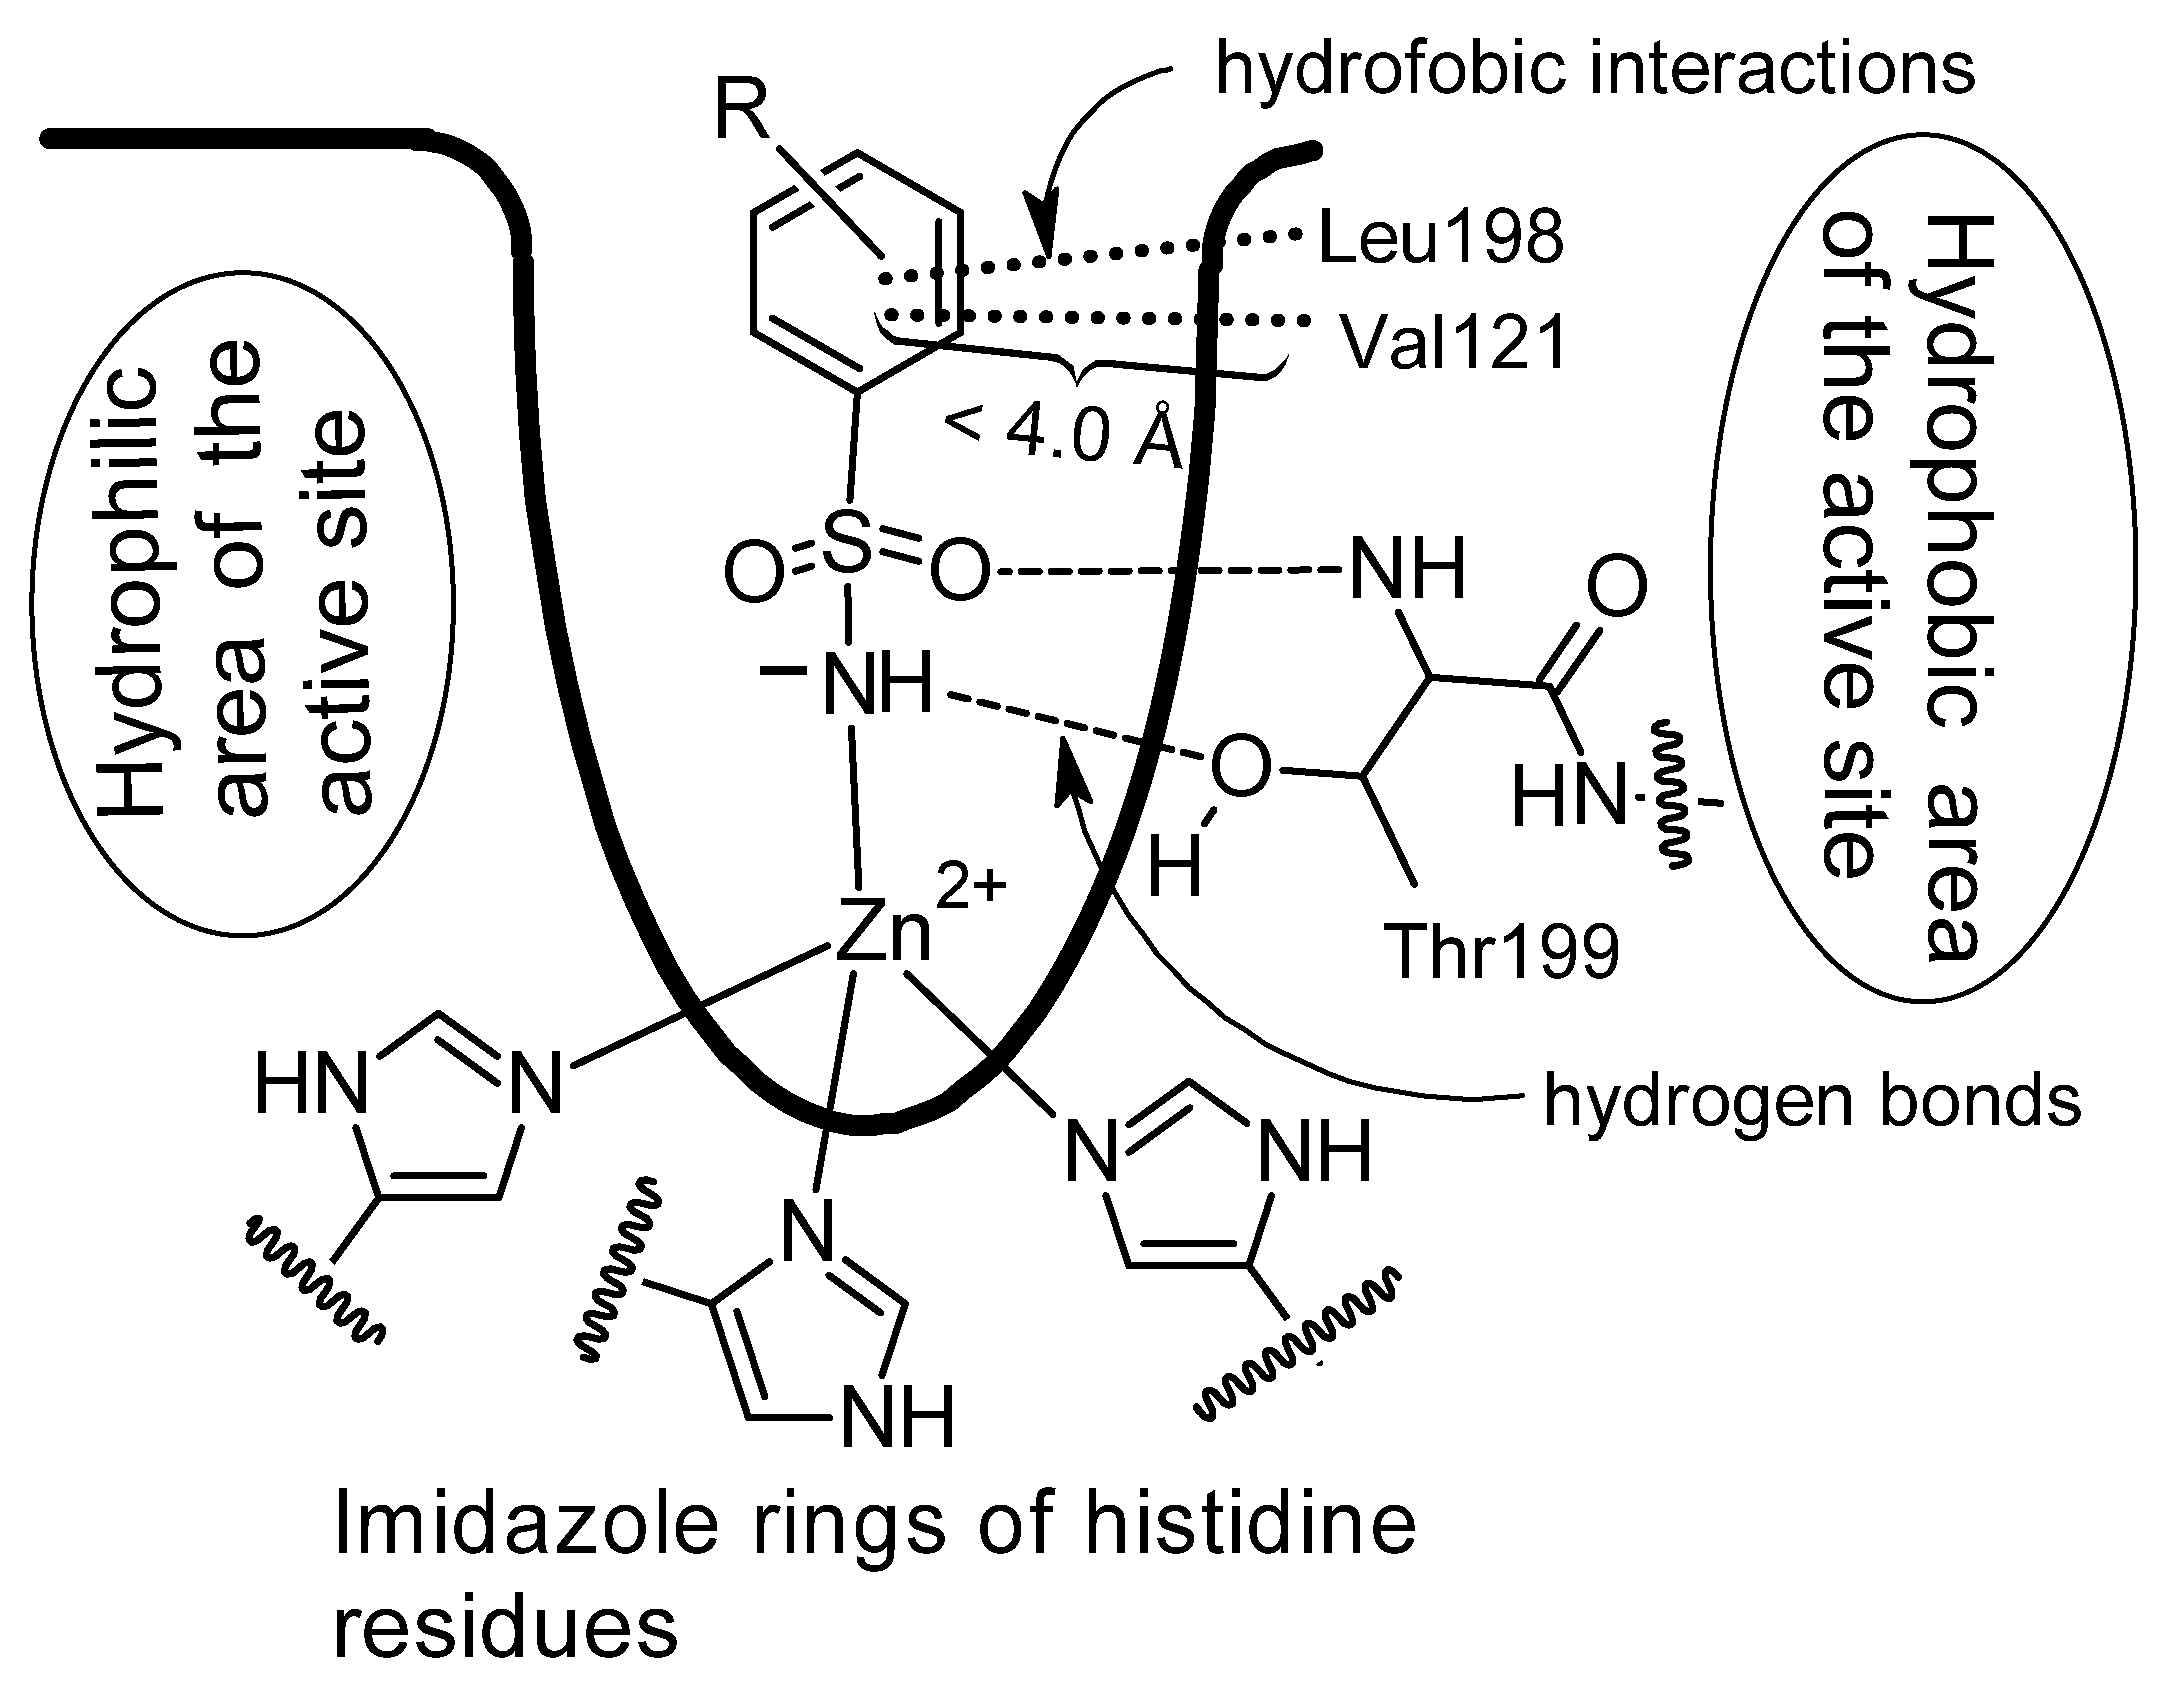
Figure 6.
Binding of benzenesulfonamide derivatives to the carbonic anhydrase active site (Drawing made independently based on publication [
24] with permission from the authors and the American Chemical Society, license number 6111840111235).
Figure 6.
Binding of benzenesulfonamide derivatives to the carbonic anhydrase active site (Drawing made independently based on publication [
24] with permission from the authors and the American Chemical Society, license number 6111840111235).
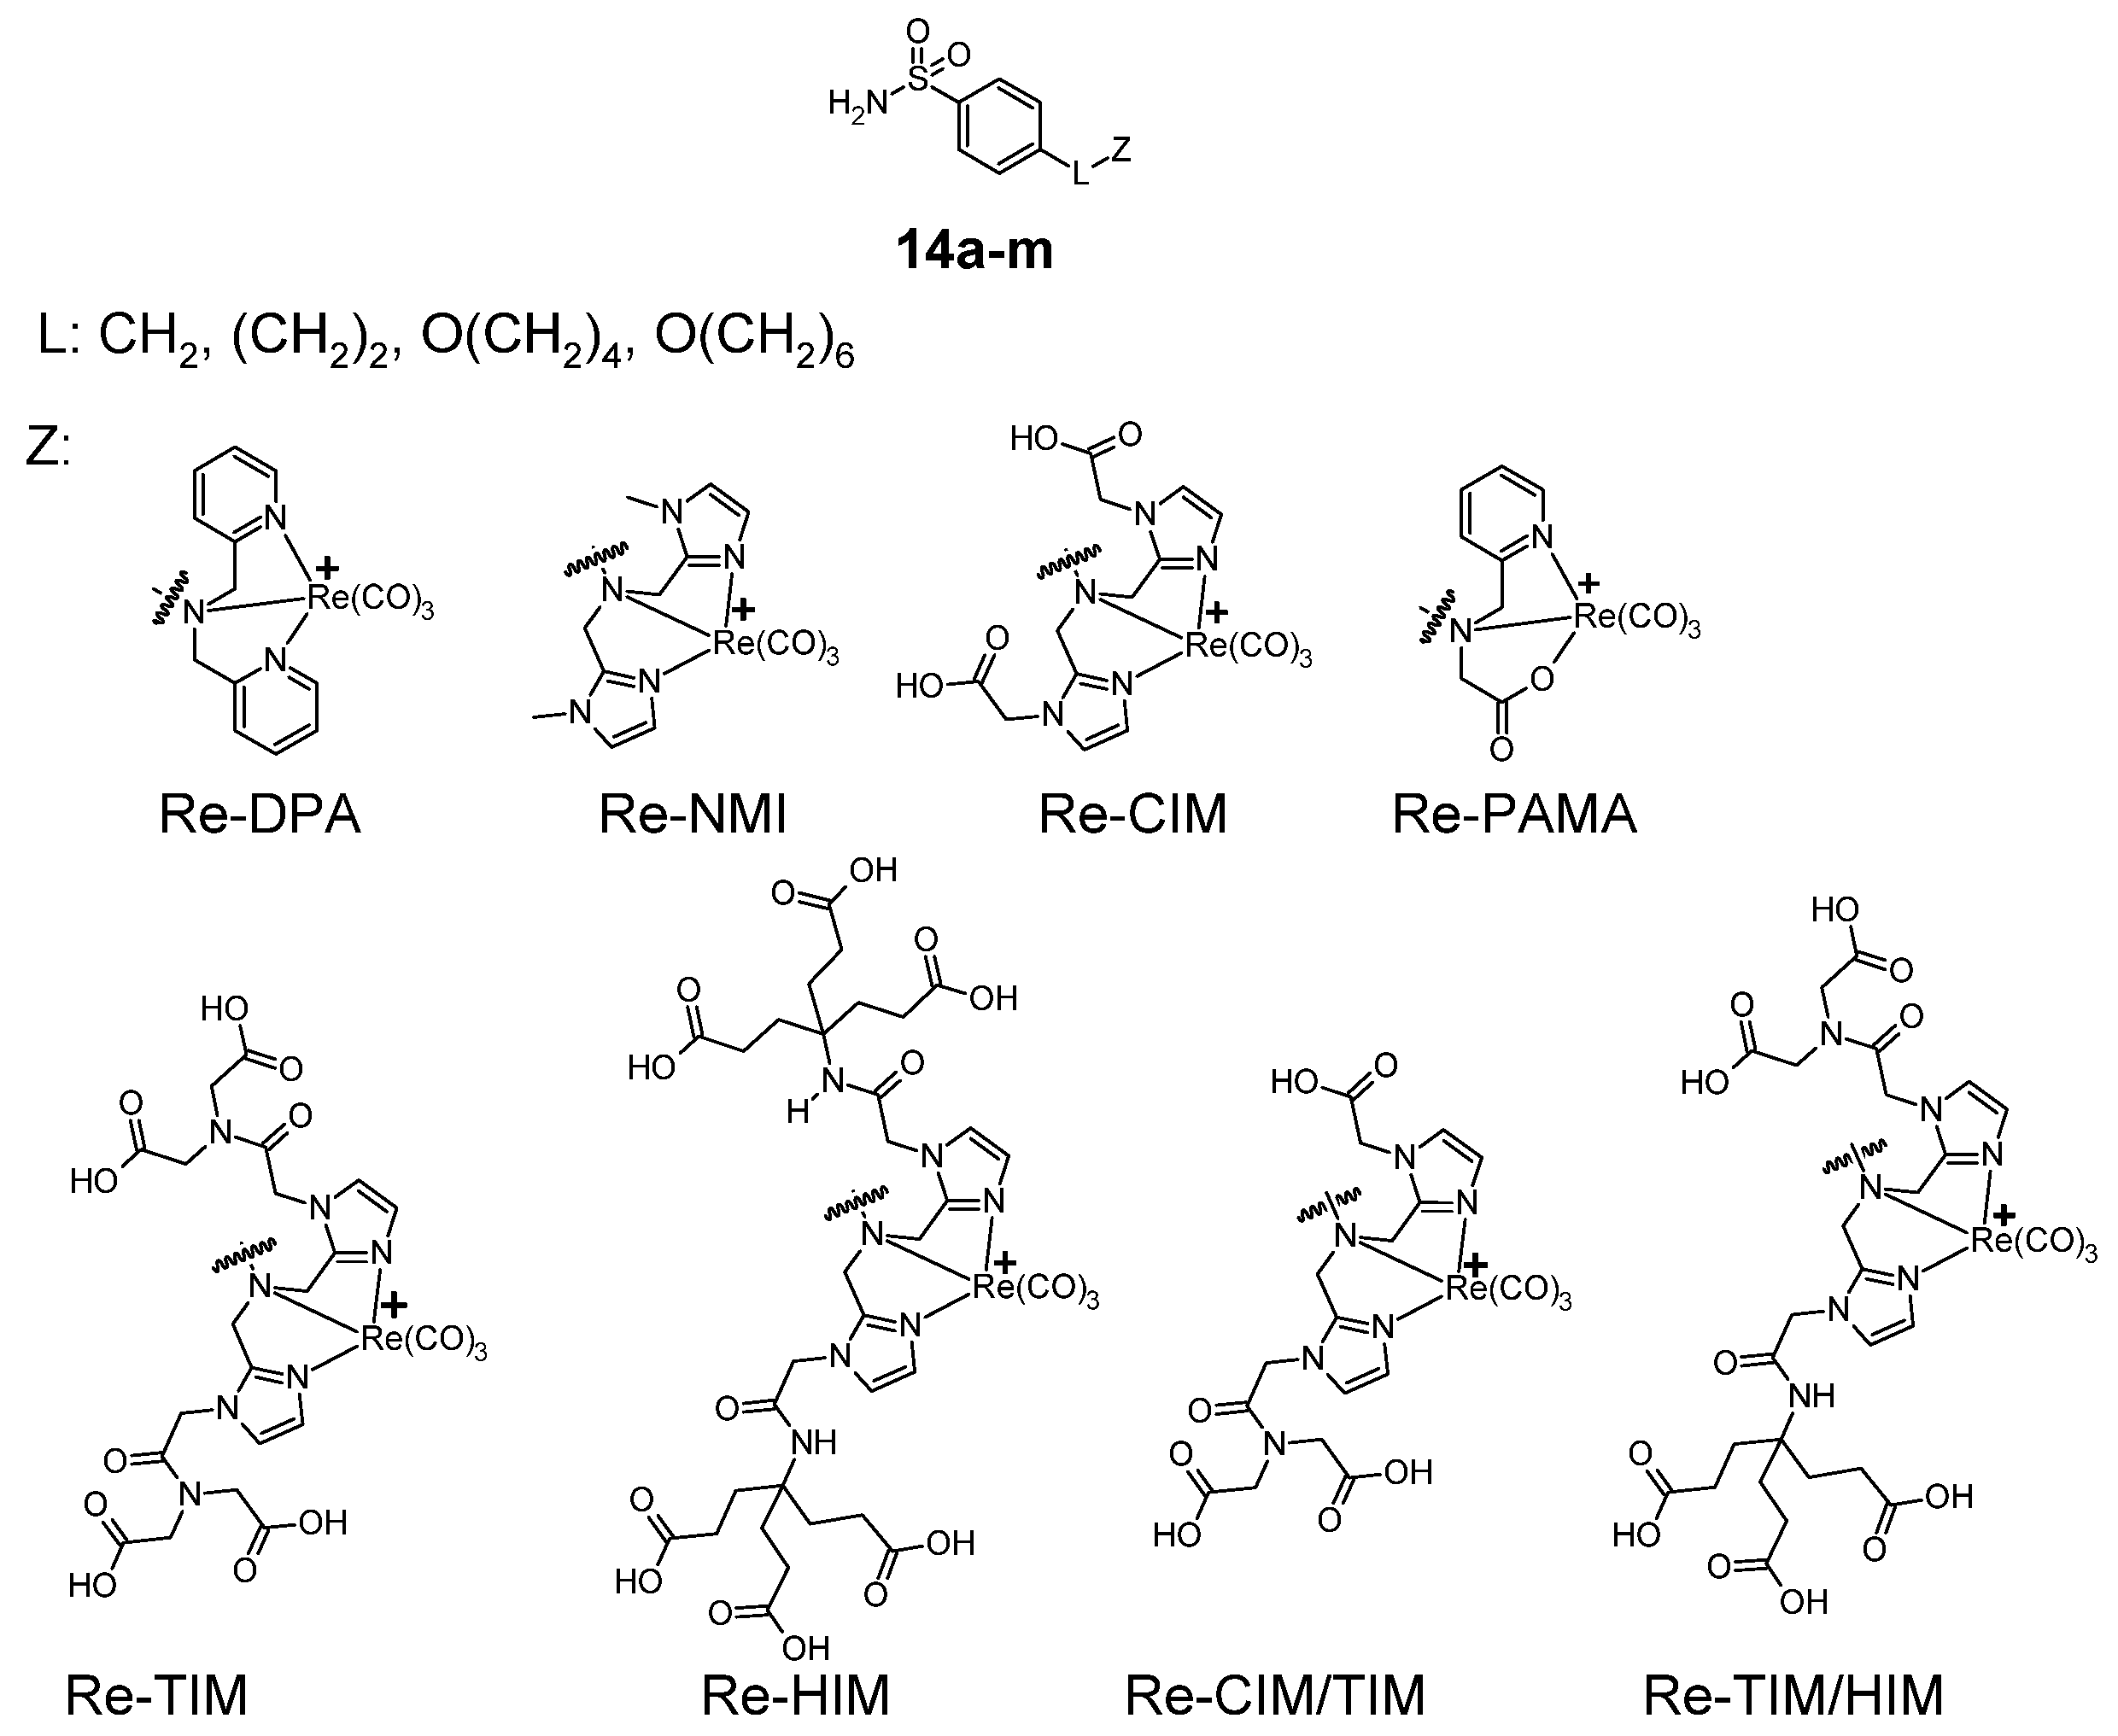
Figure 7.
General formula of benzenesulfonamide carbonyl rhenium complexes 14a–m.
Figure 7.
General formula of benzenesulfonamide carbonyl rhenium complexes 14a–m.
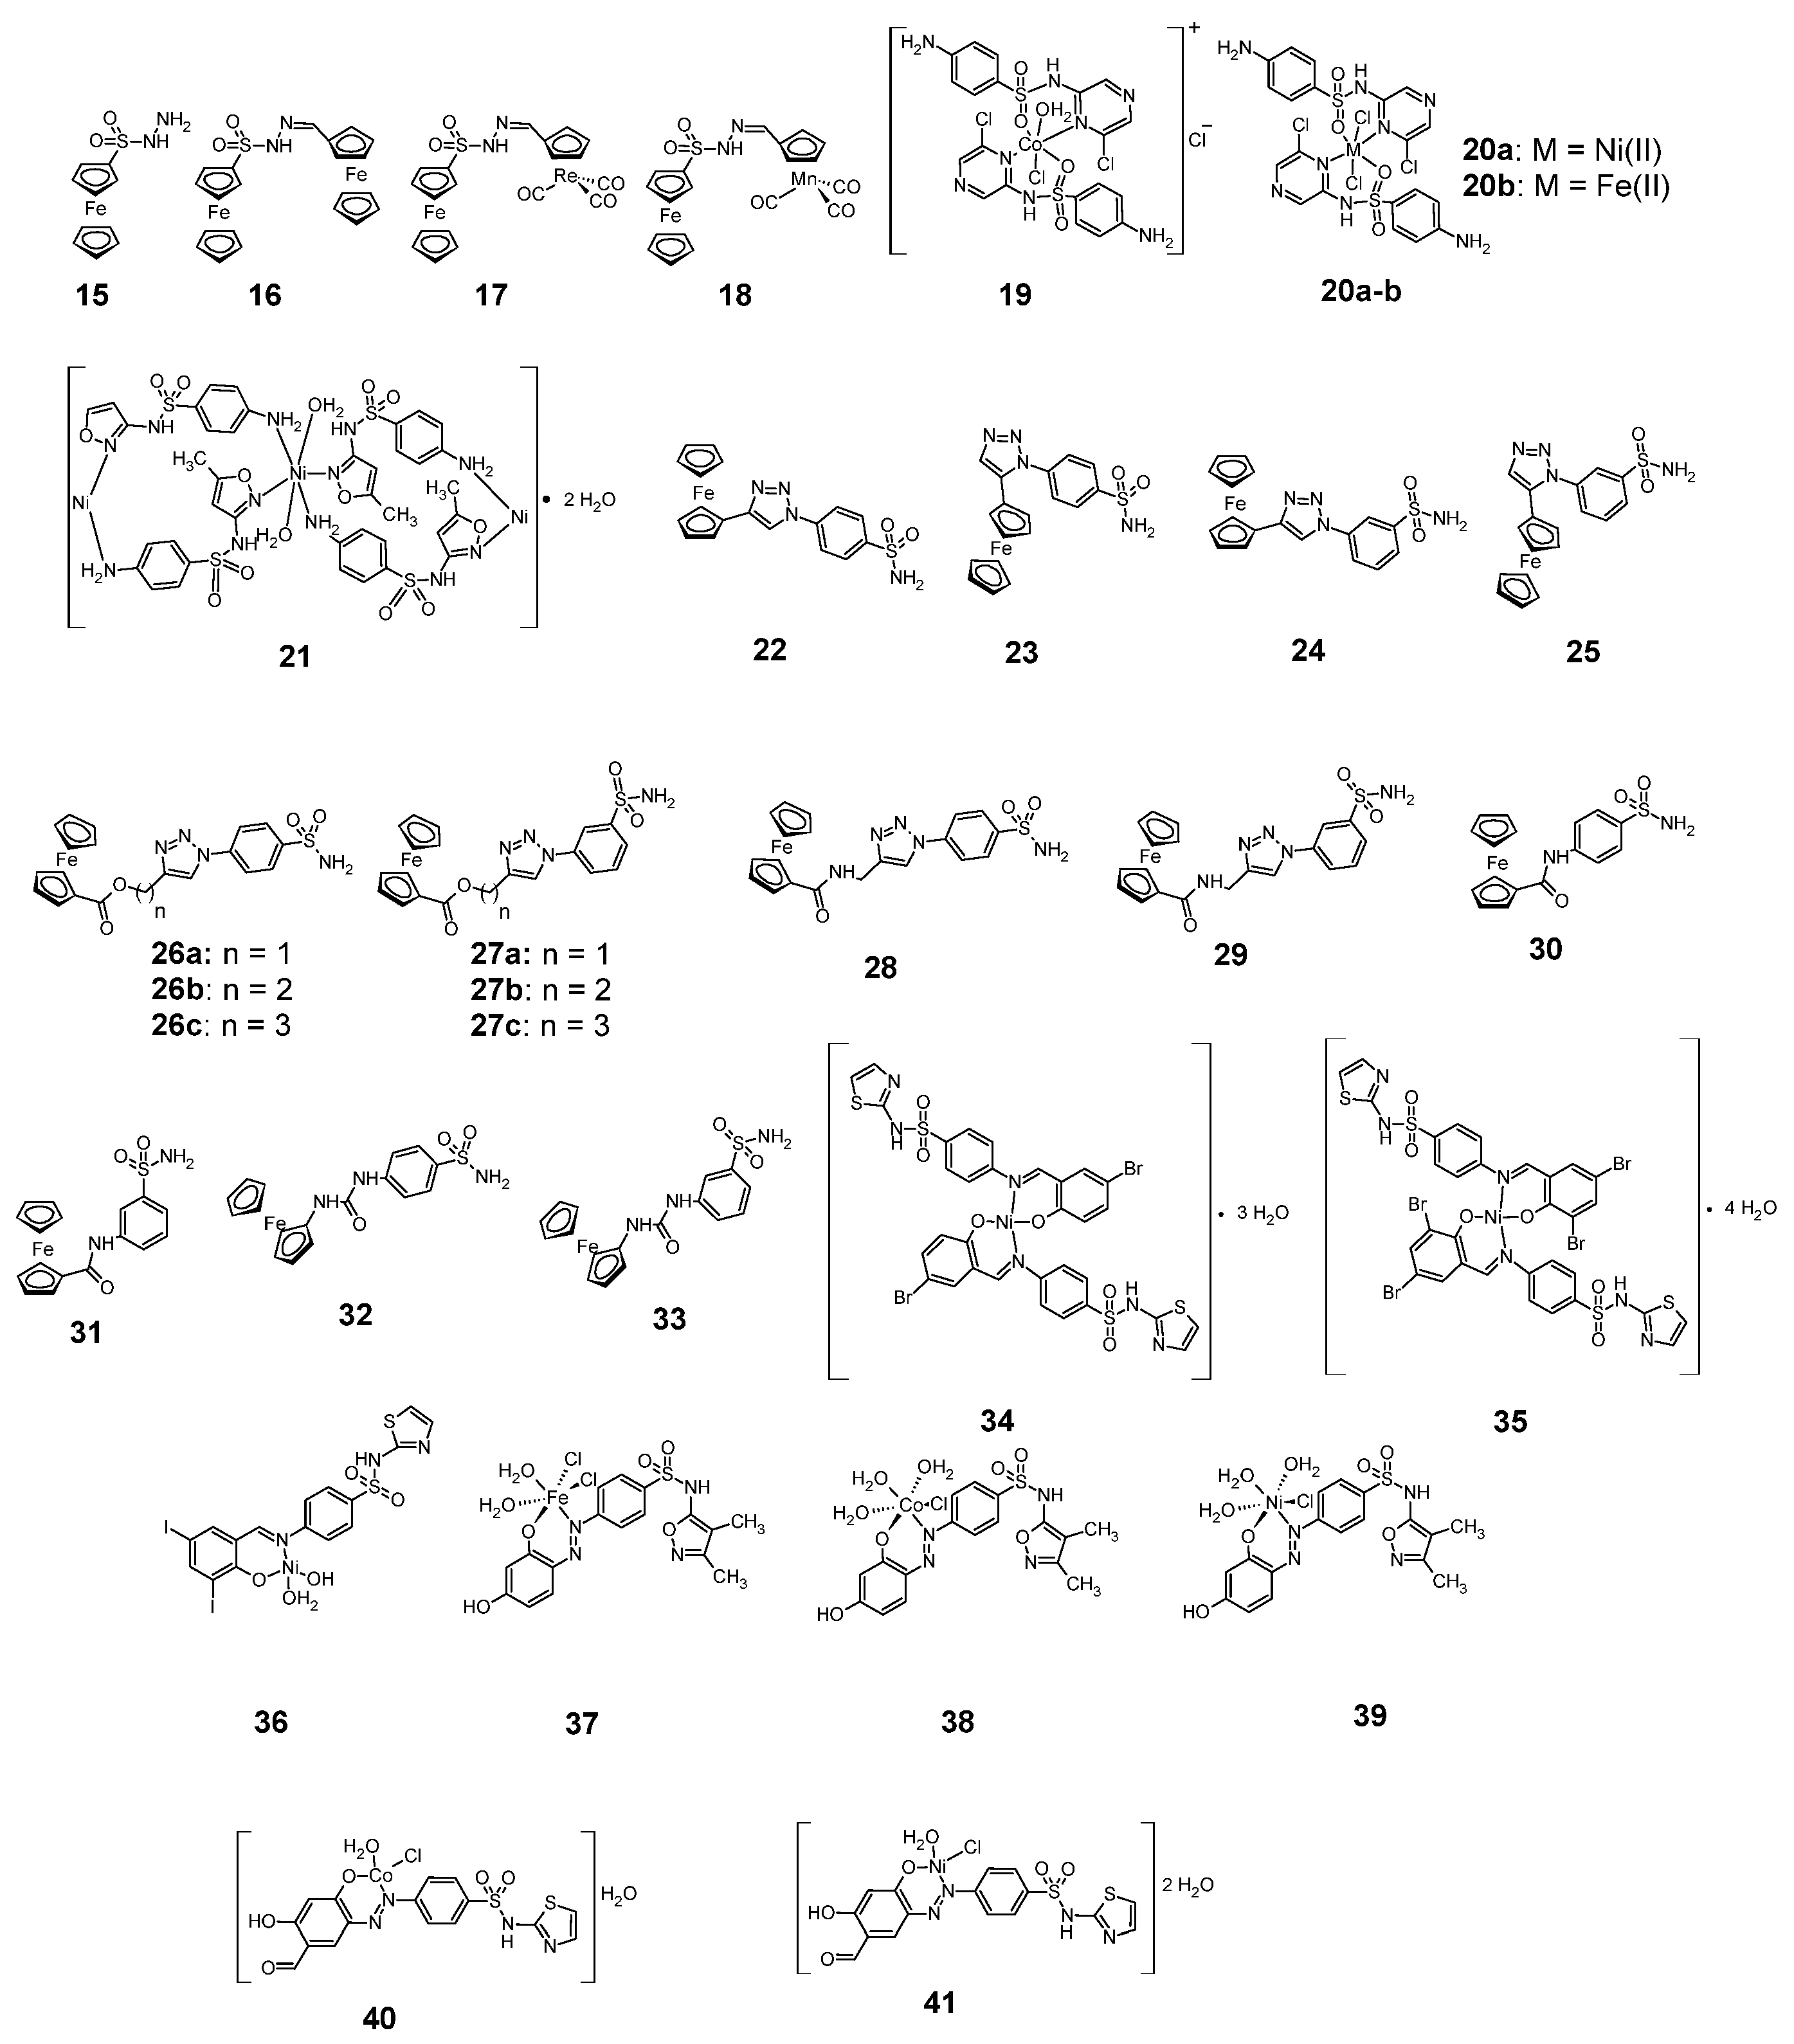
Figure 8.
Anticancer sulfonamide complexes with iron, cobalt and nickel 15–41.
Figure 8.
Anticancer sulfonamide complexes with iron, cobalt and nickel 15–41.
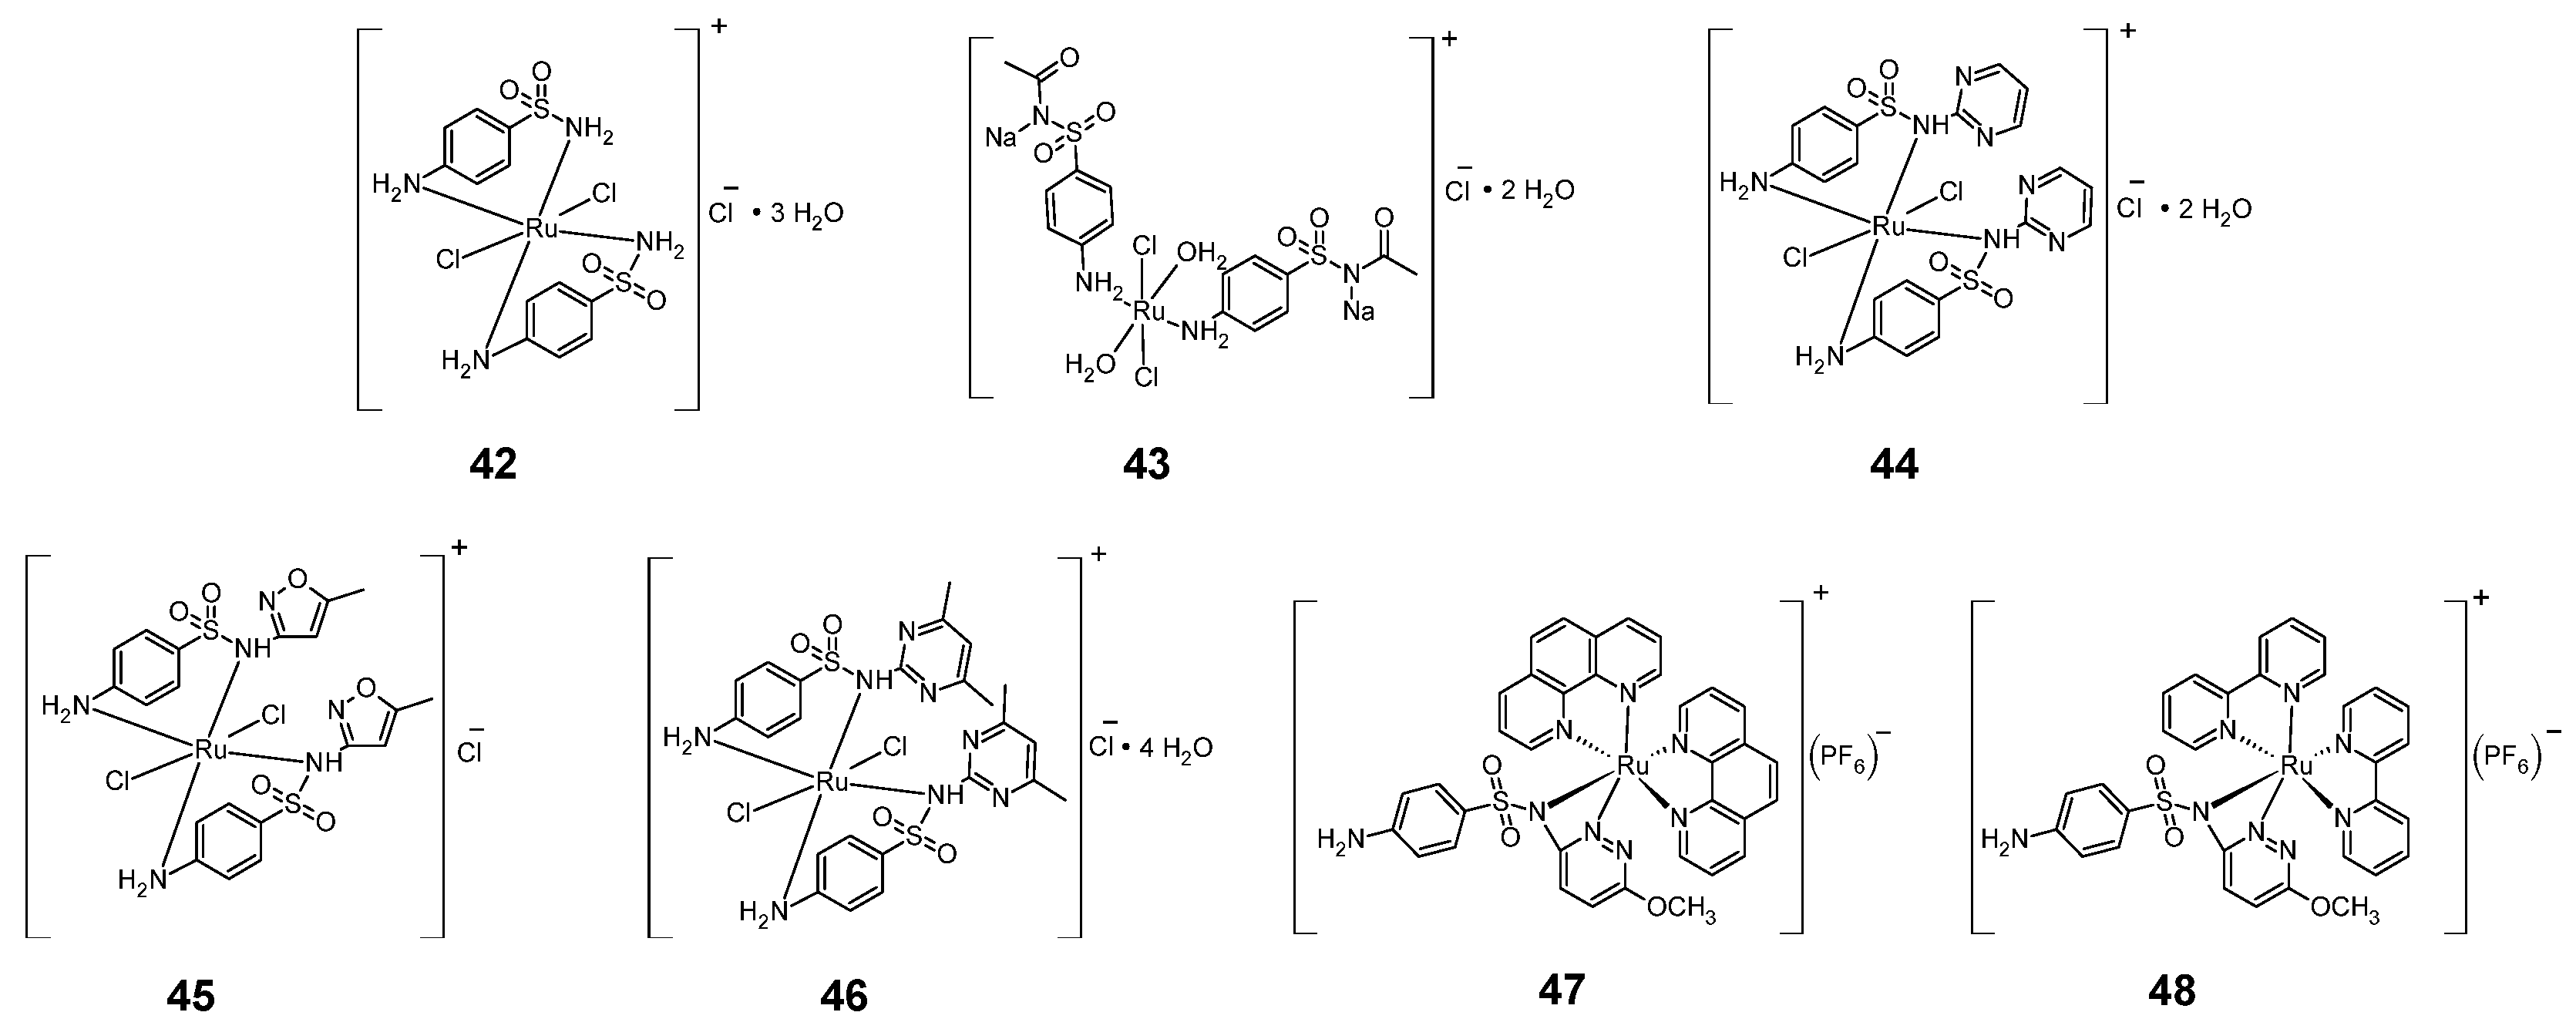
Figure 9.
Structures of ruthenium complexes 42–48.
Figure 9.
Structures of ruthenium complexes 42–48.
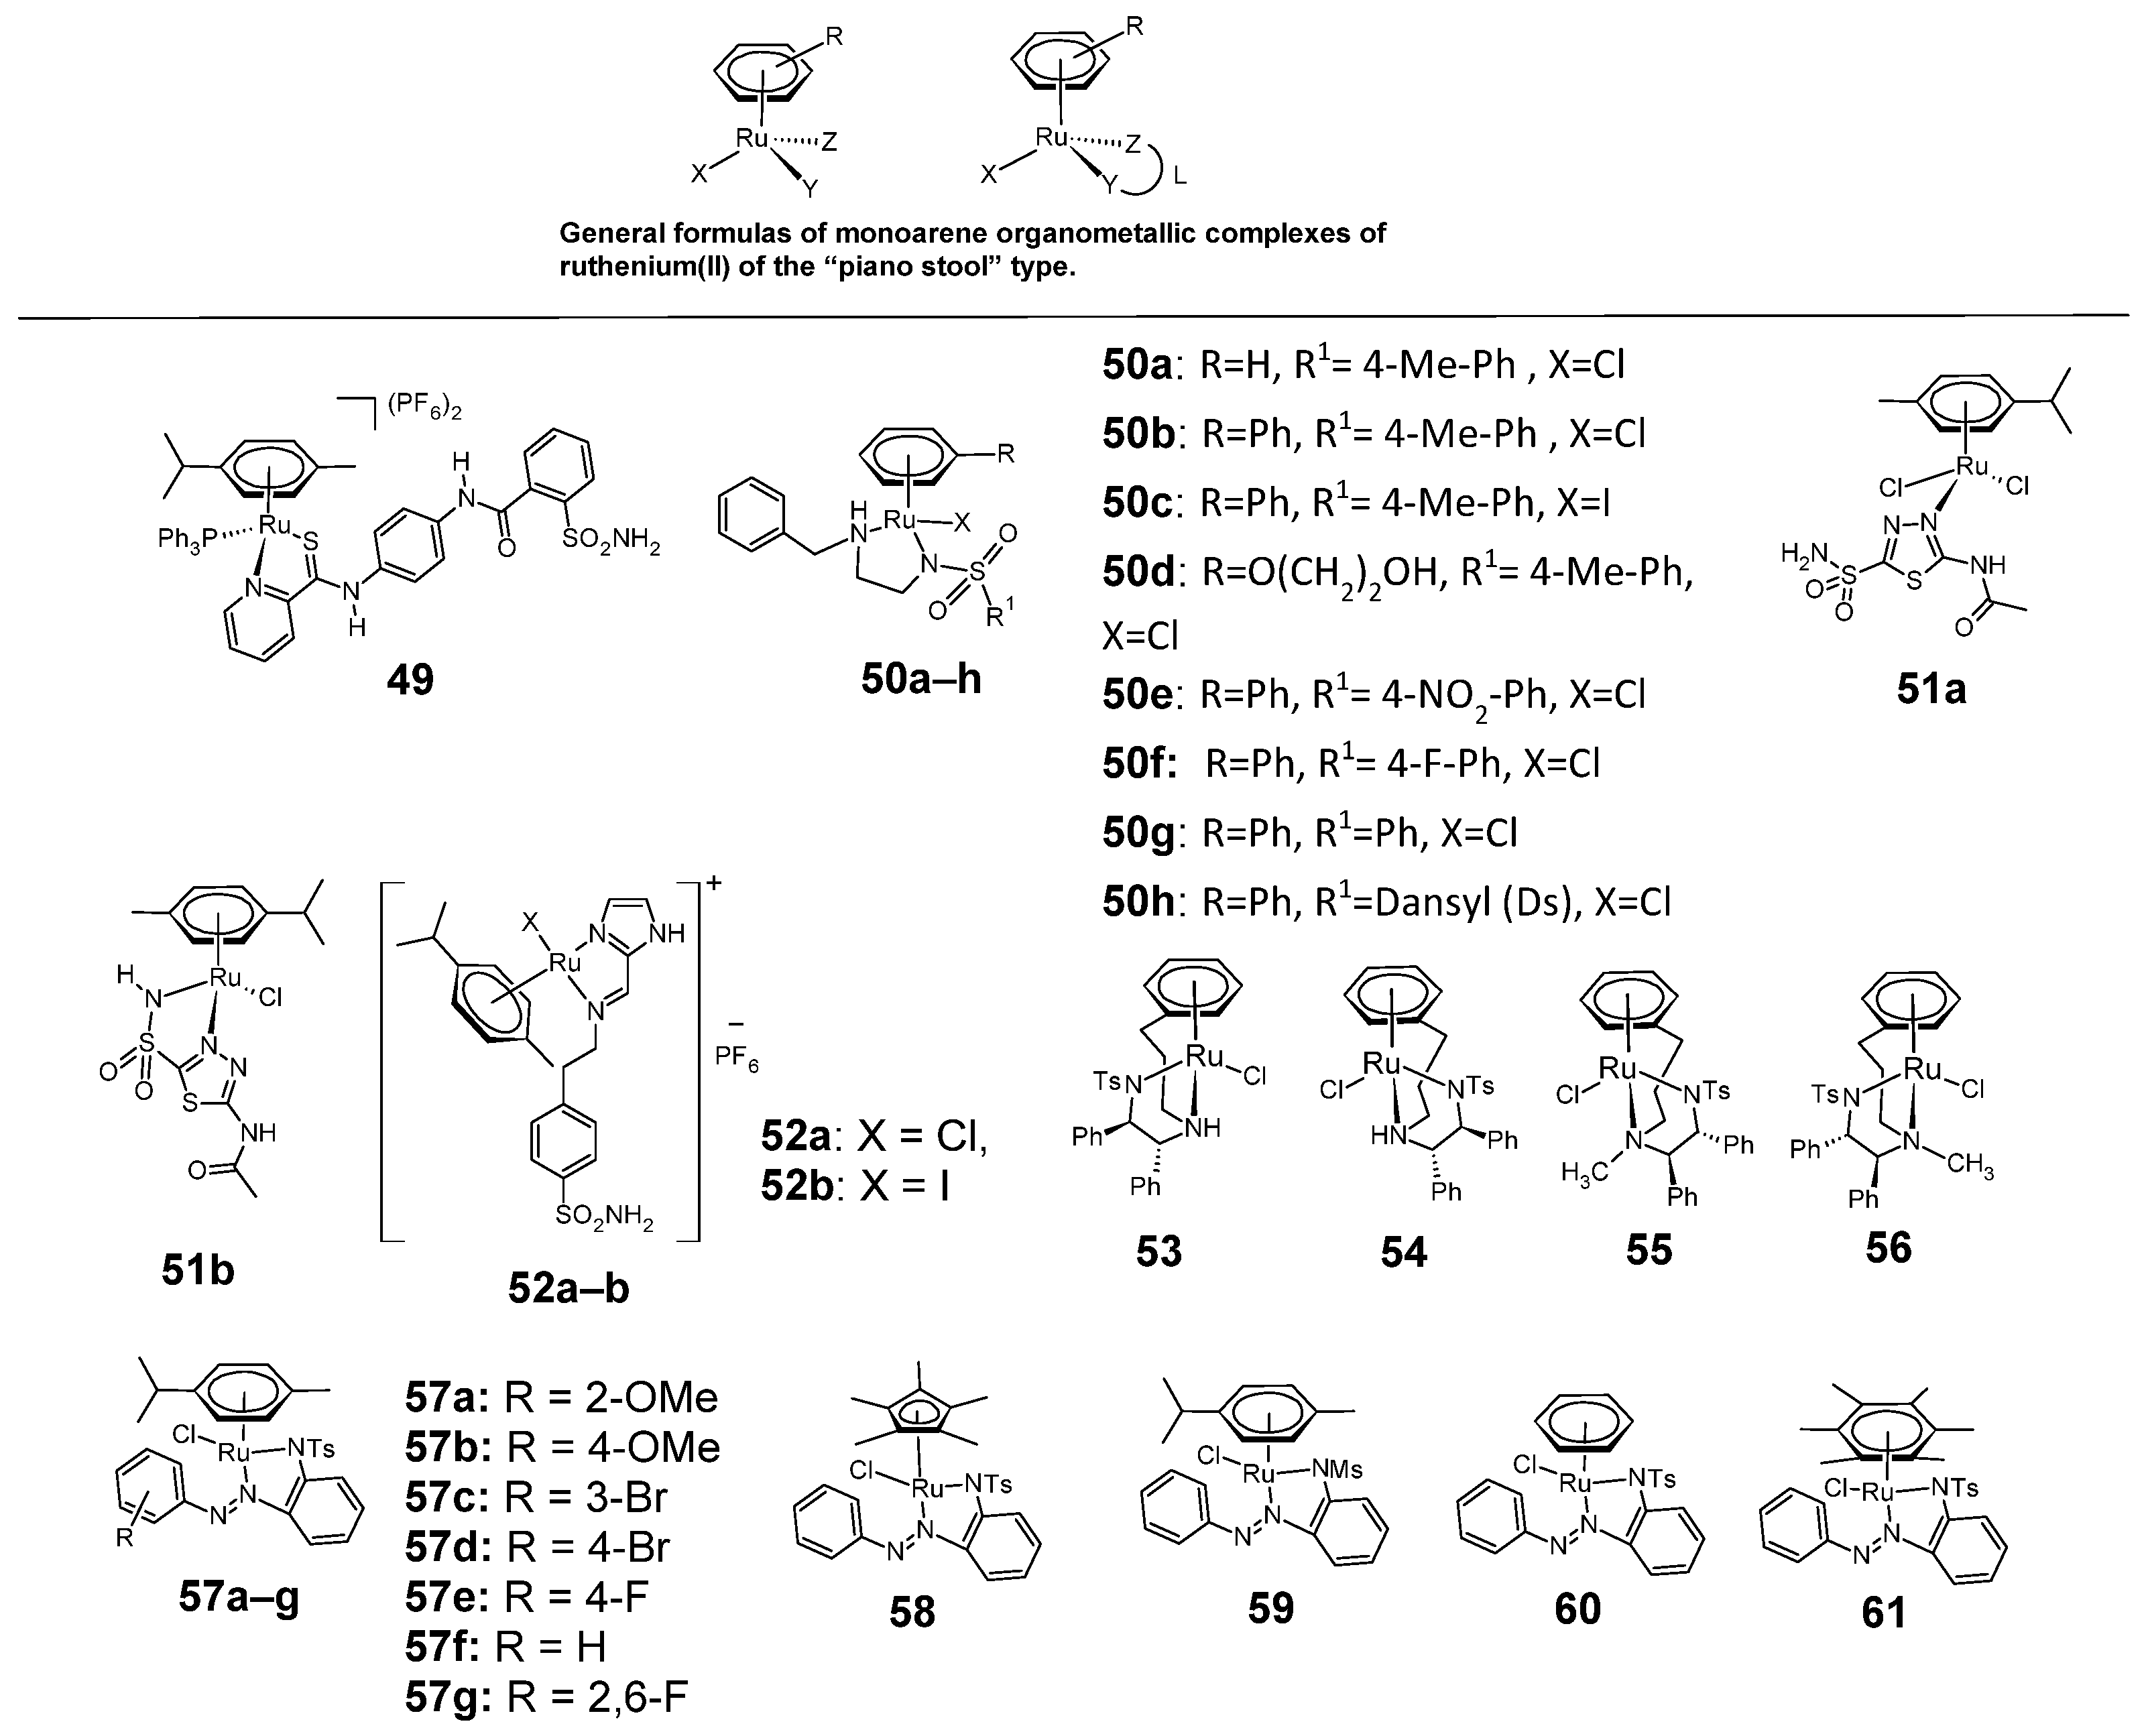
Figure 10.
Monoarene organometallic sulfonamide complexes of ruthenium(II) of the “piano stool” type 49–61.
Figure 10.
Monoarene organometallic sulfonamide complexes of ruthenium(II) of the “piano stool” type 49–61.
Figure 11.
Anticancer sulfonamide complexes with osmium 62–65.
Figure 11.
Anticancer sulfonamide complexes with osmium 62–65.
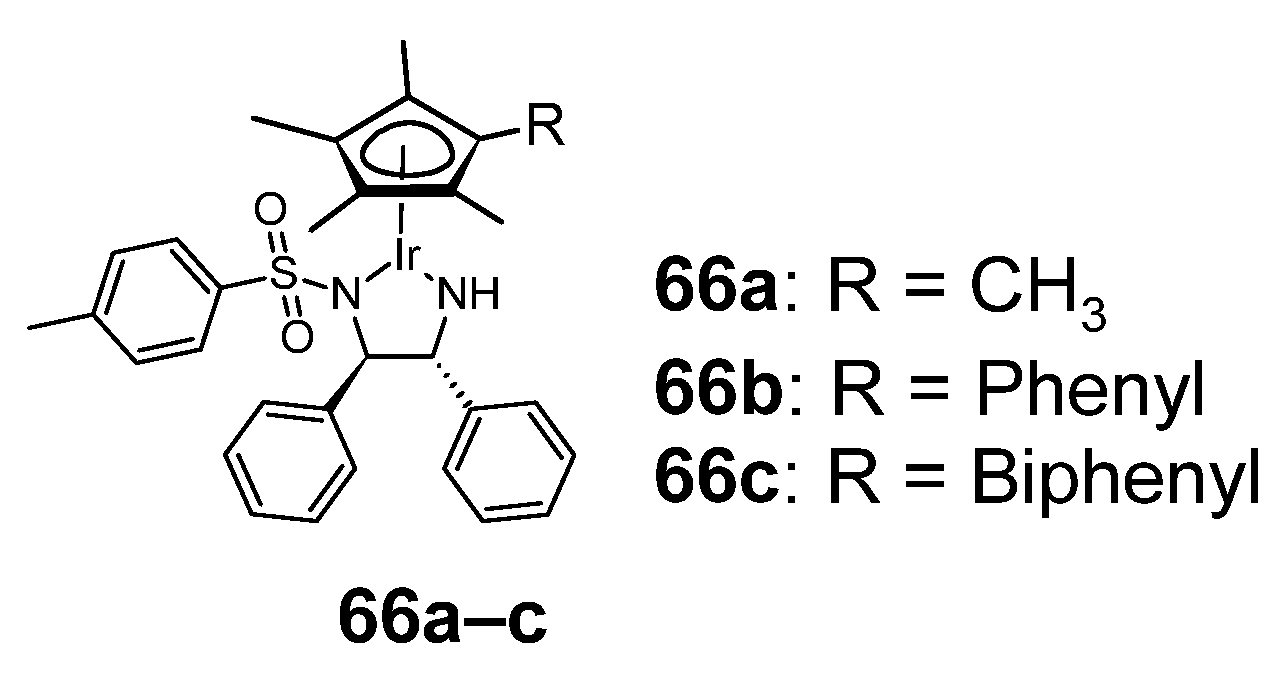
Figure 12.
Anticancer sulfonamide complexes with iridium(III) 66a–c.
Figure 12.
Anticancer sulfonamide complexes with iridium(III) 66a–c.
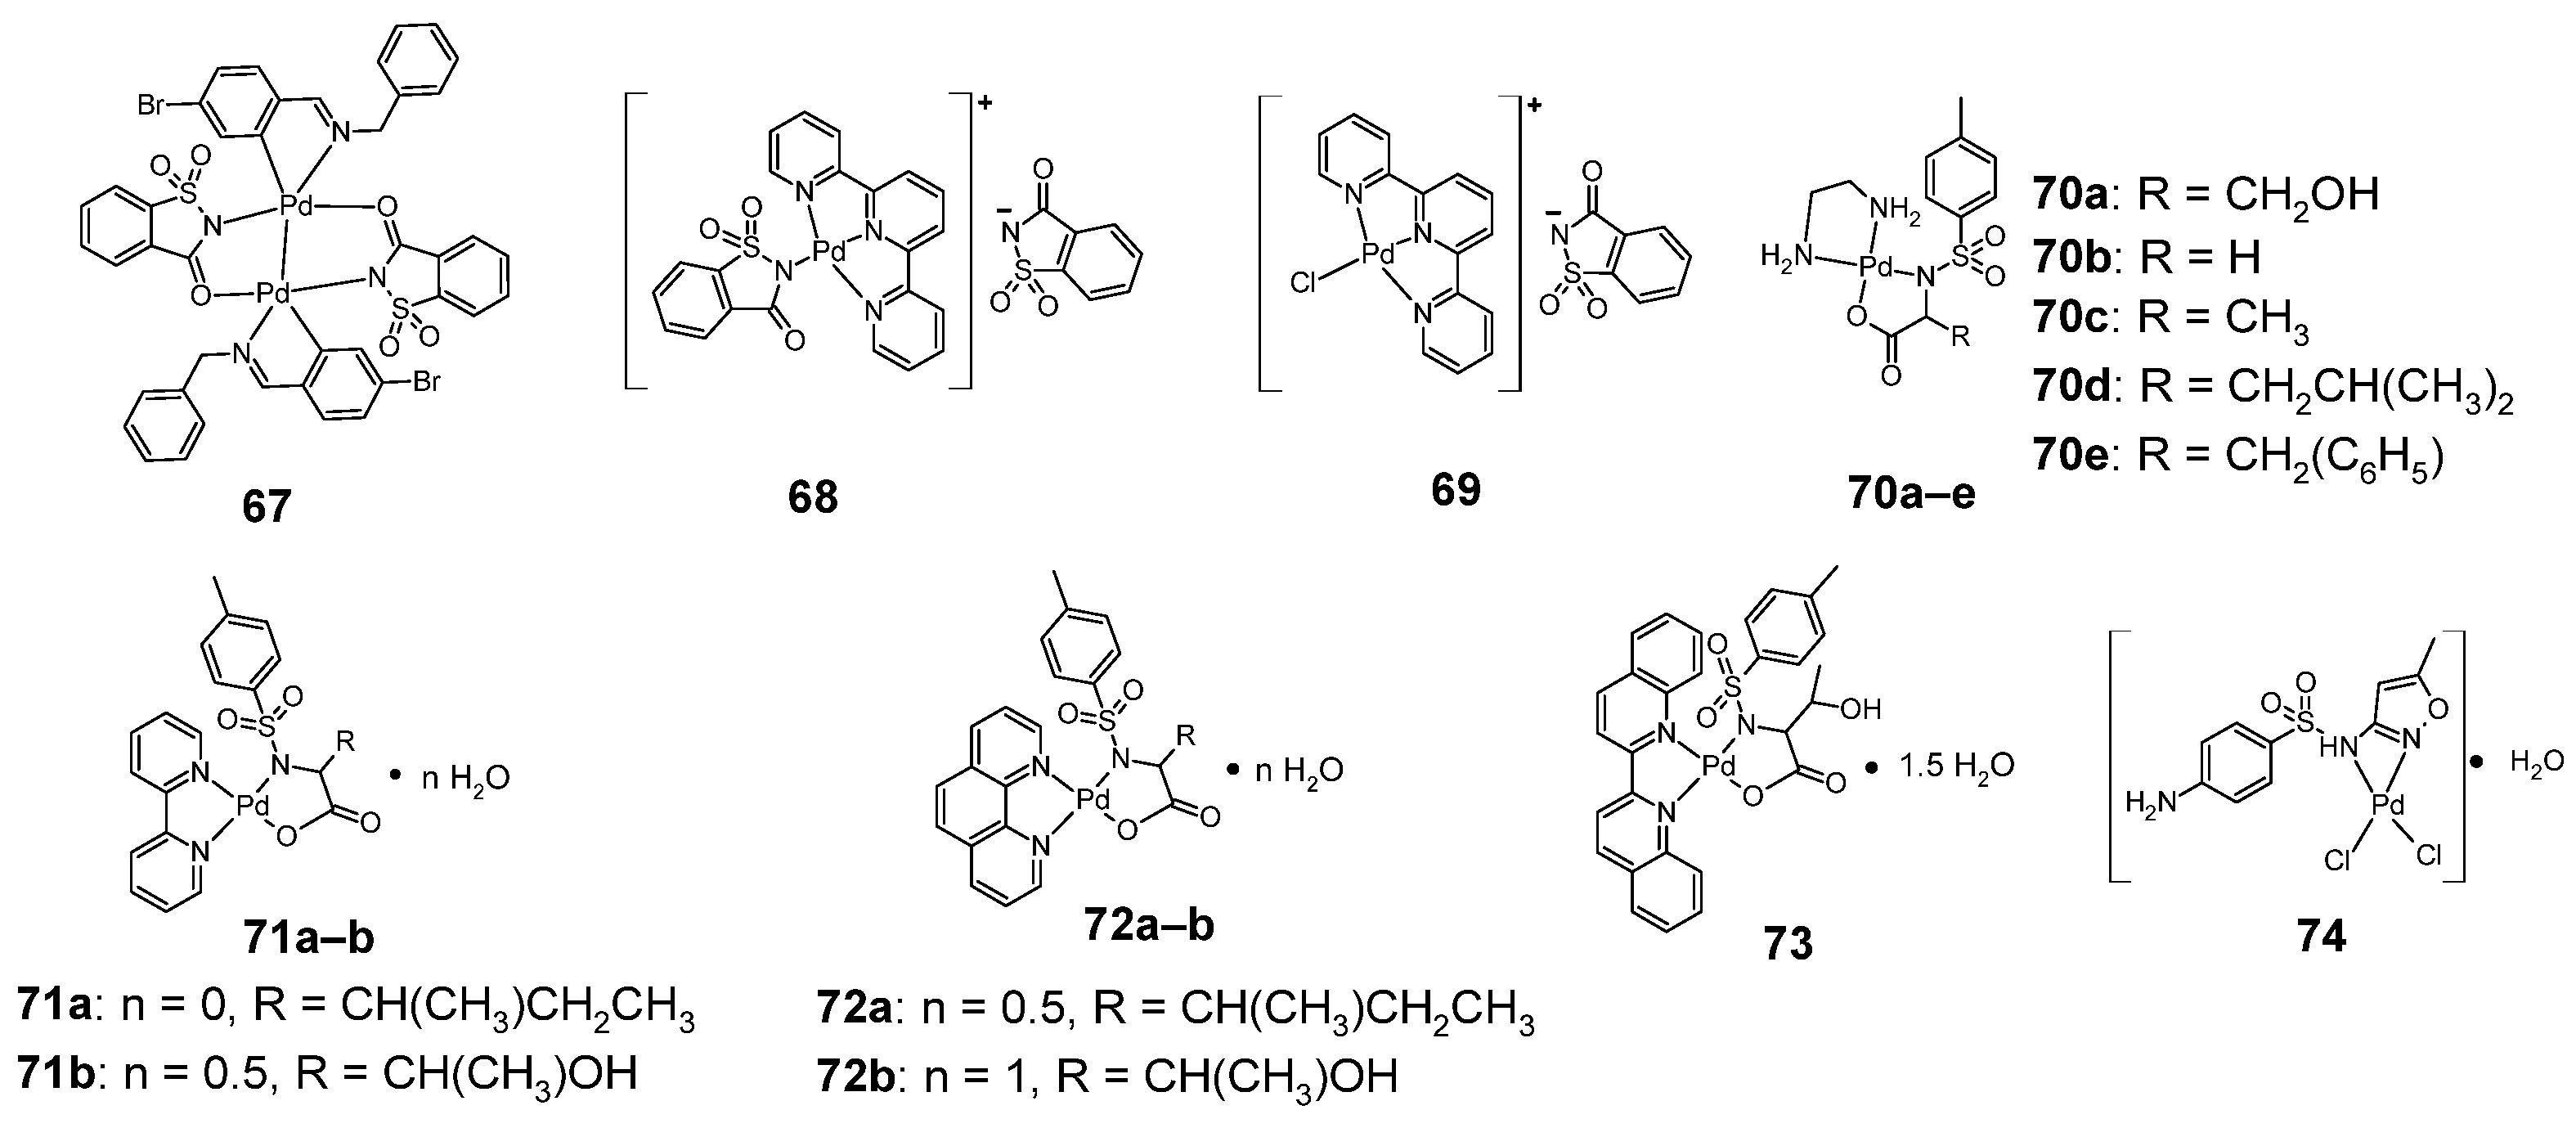
Figure 13.
Structures of palladium-sulfonamide complexes (67–74).
Figure 13.
Structures of palladium-sulfonamide complexes (67–74).
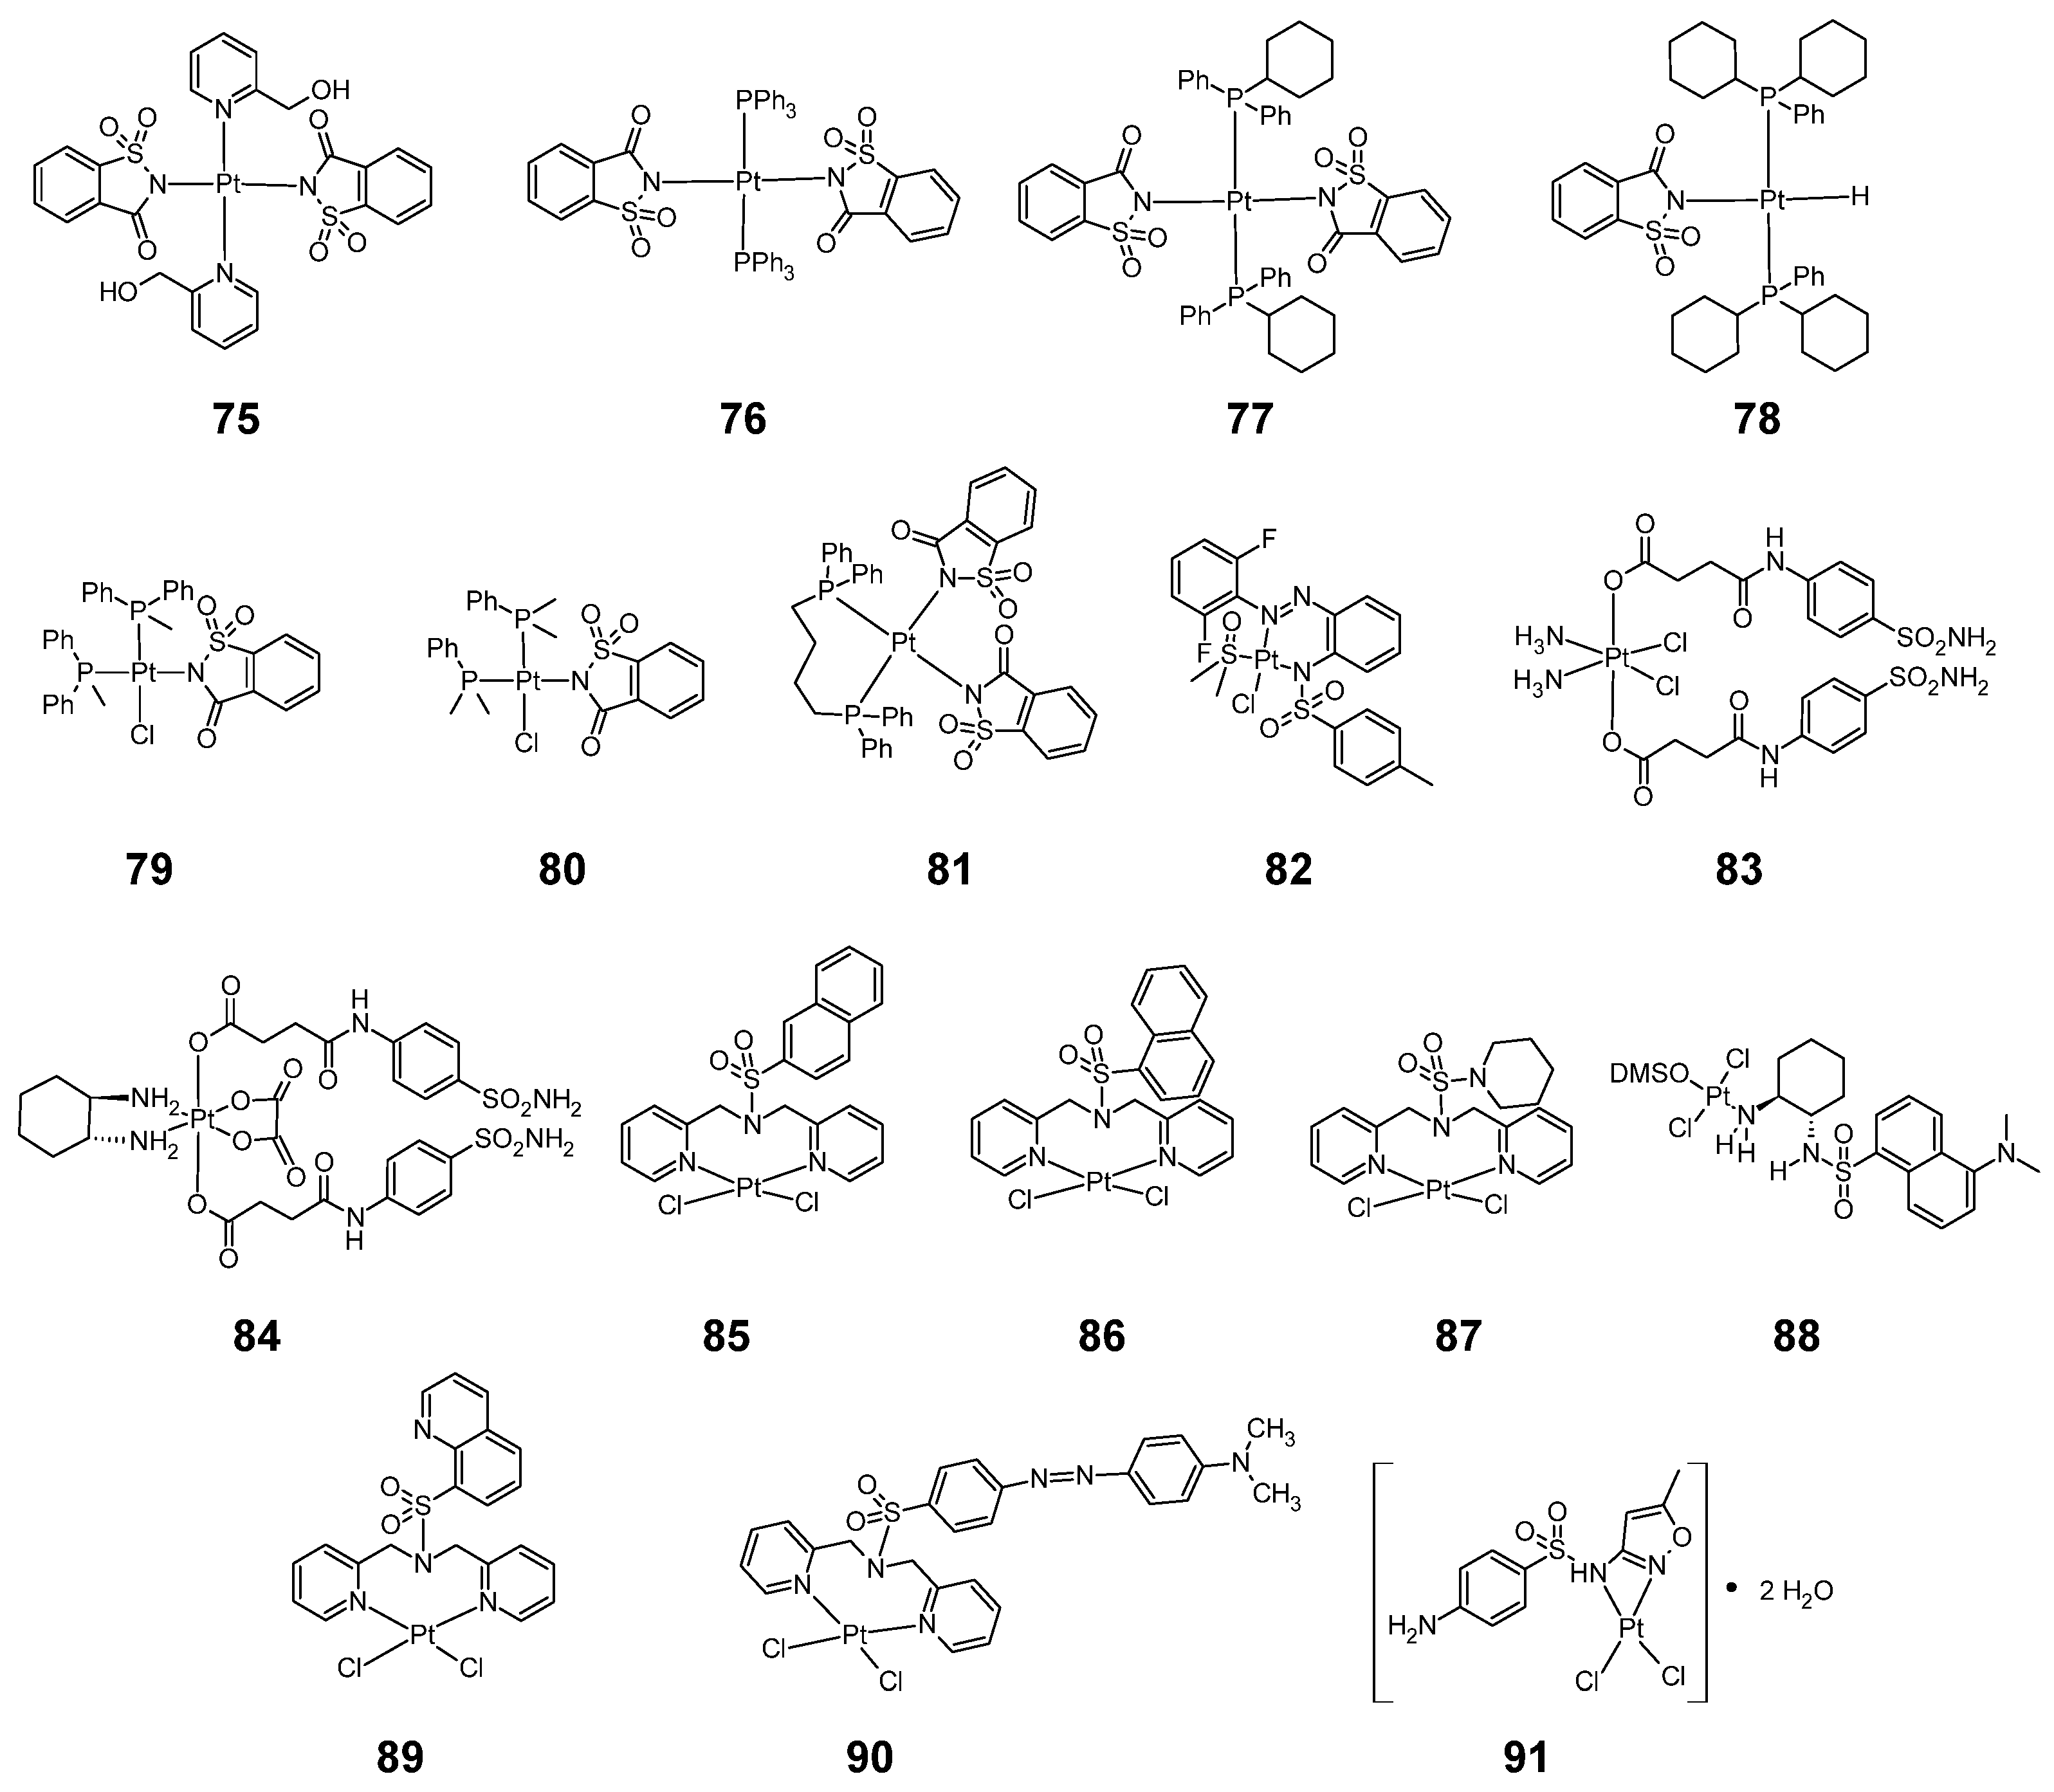
Figure 14.
Structure of platinum complexes with sulfonamides 75–91.
Figure 14.
Structure of platinum complexes with sulfonamides 75–91.
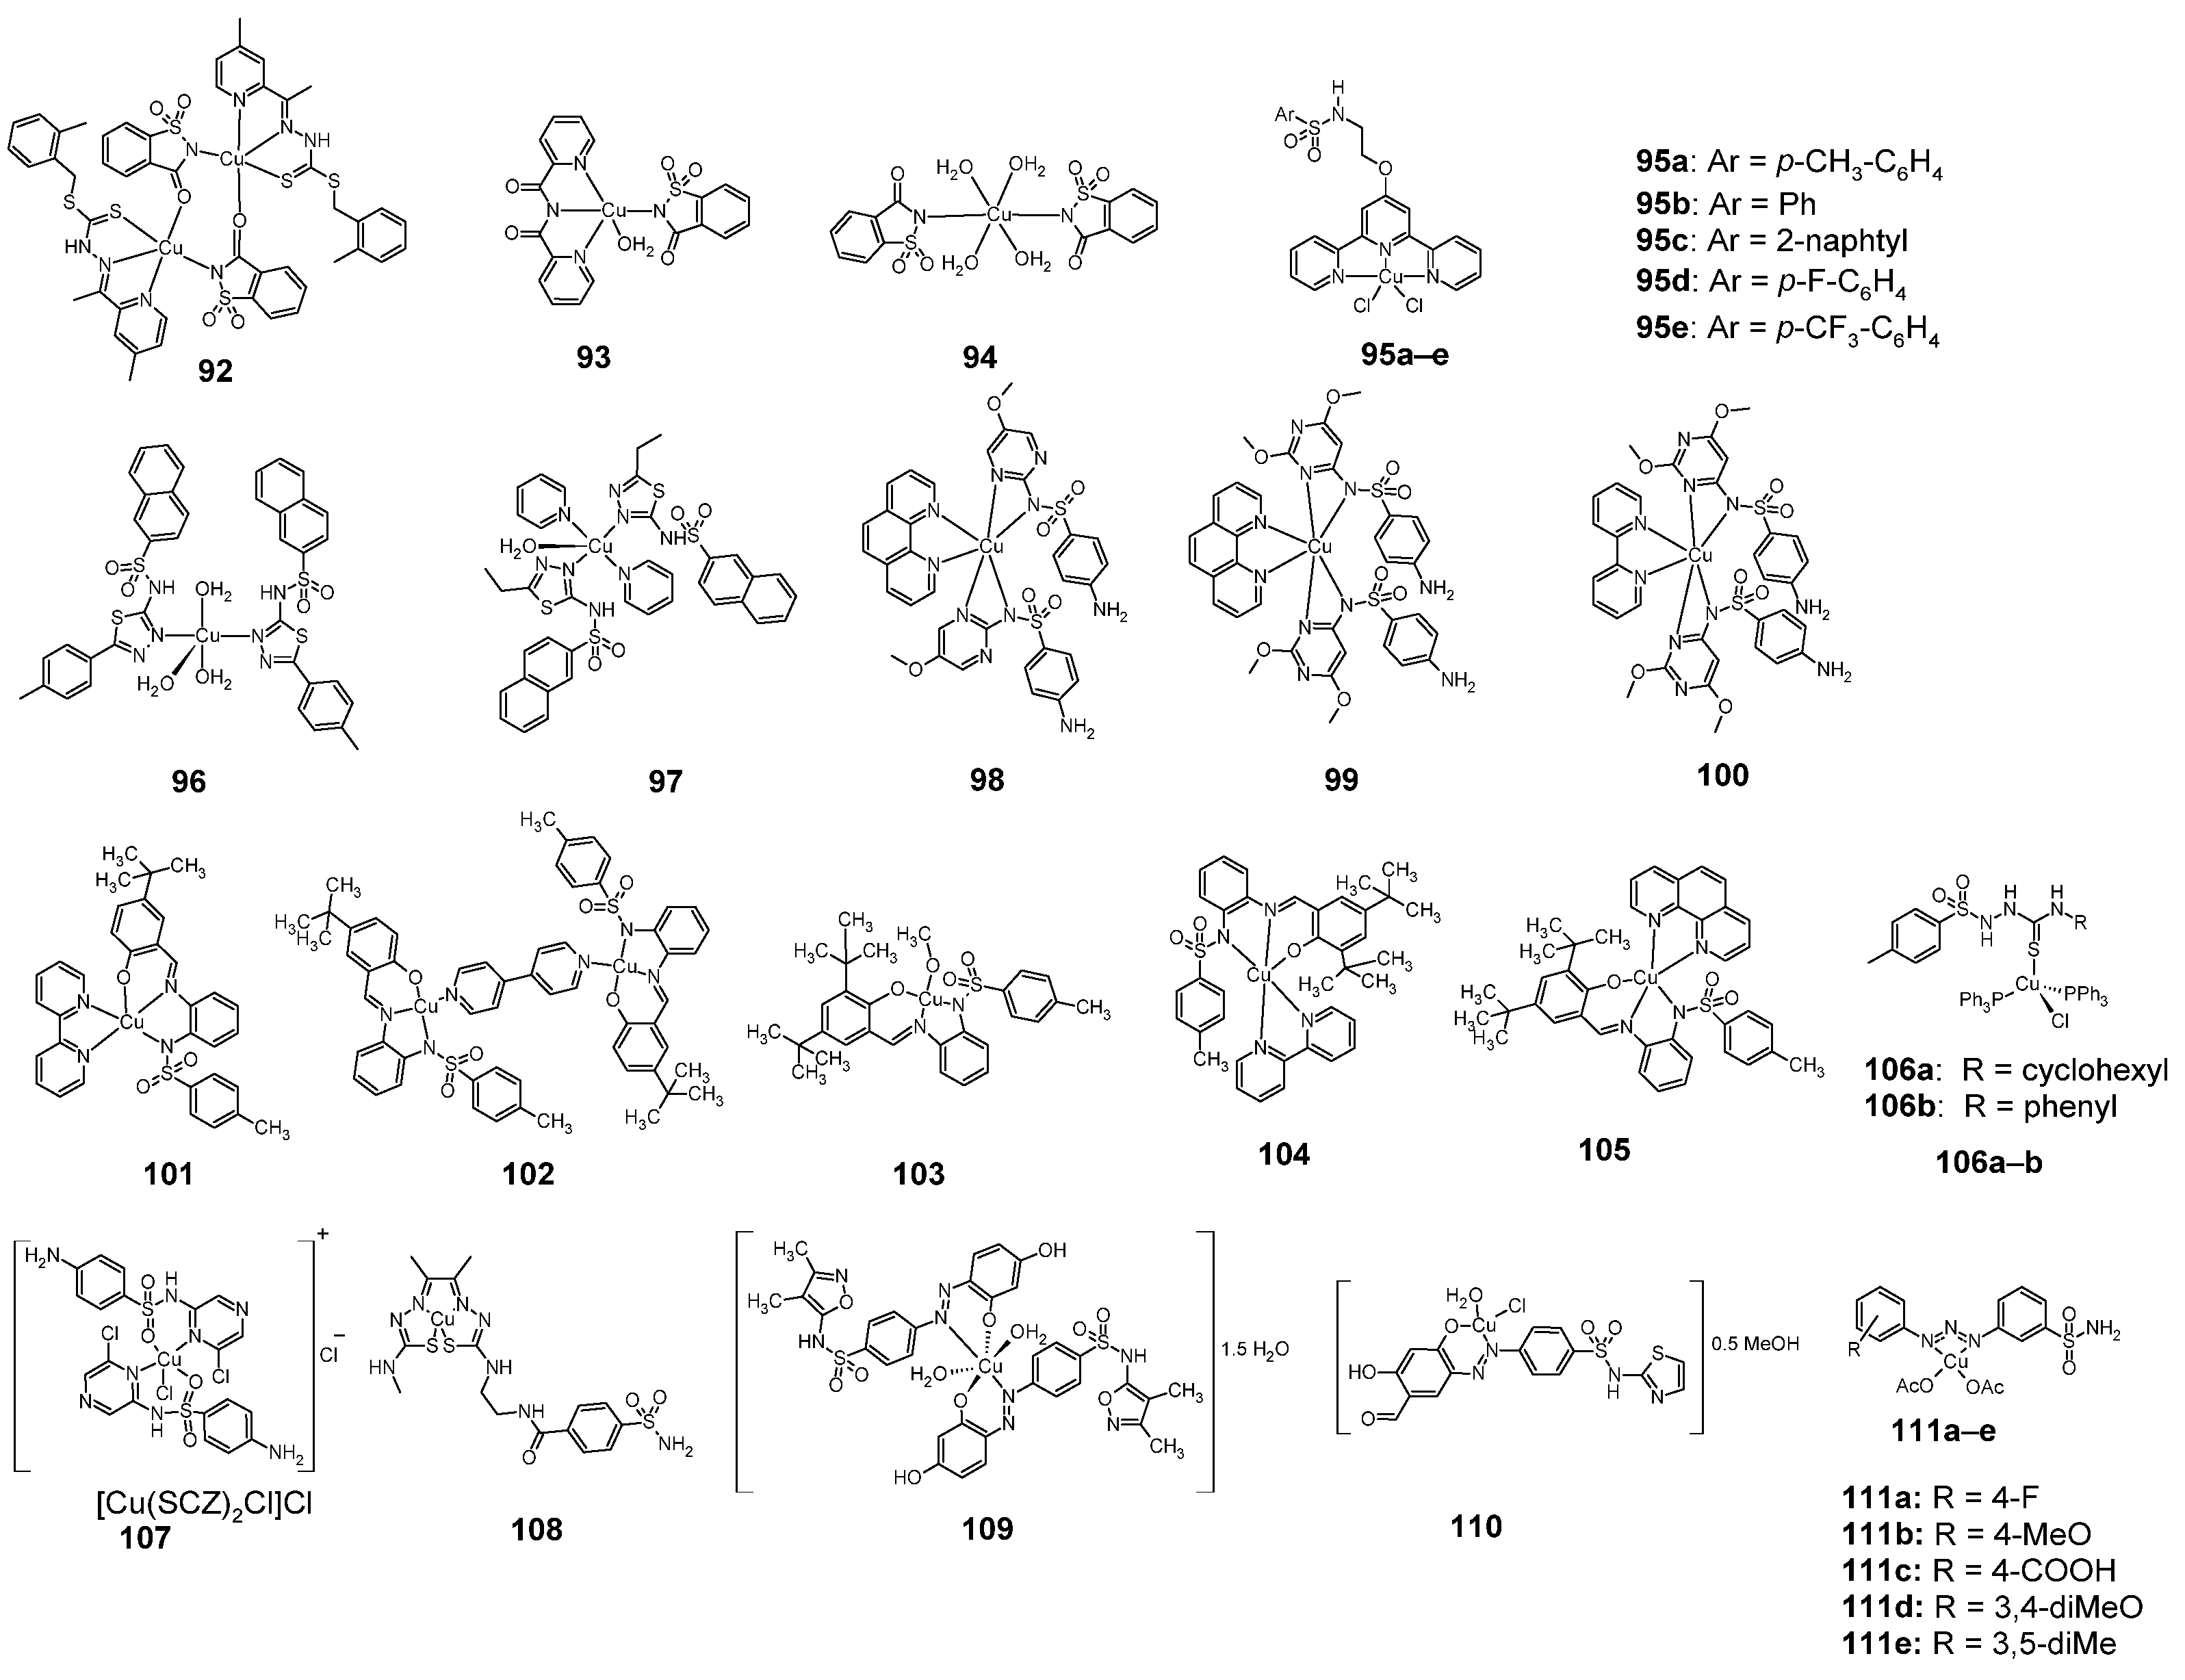
Figure 15.
Structures of copper complexes with sulfonamides 92–111.
Figure 15.
Structures of copper complexes with sulfonamides 92–111.
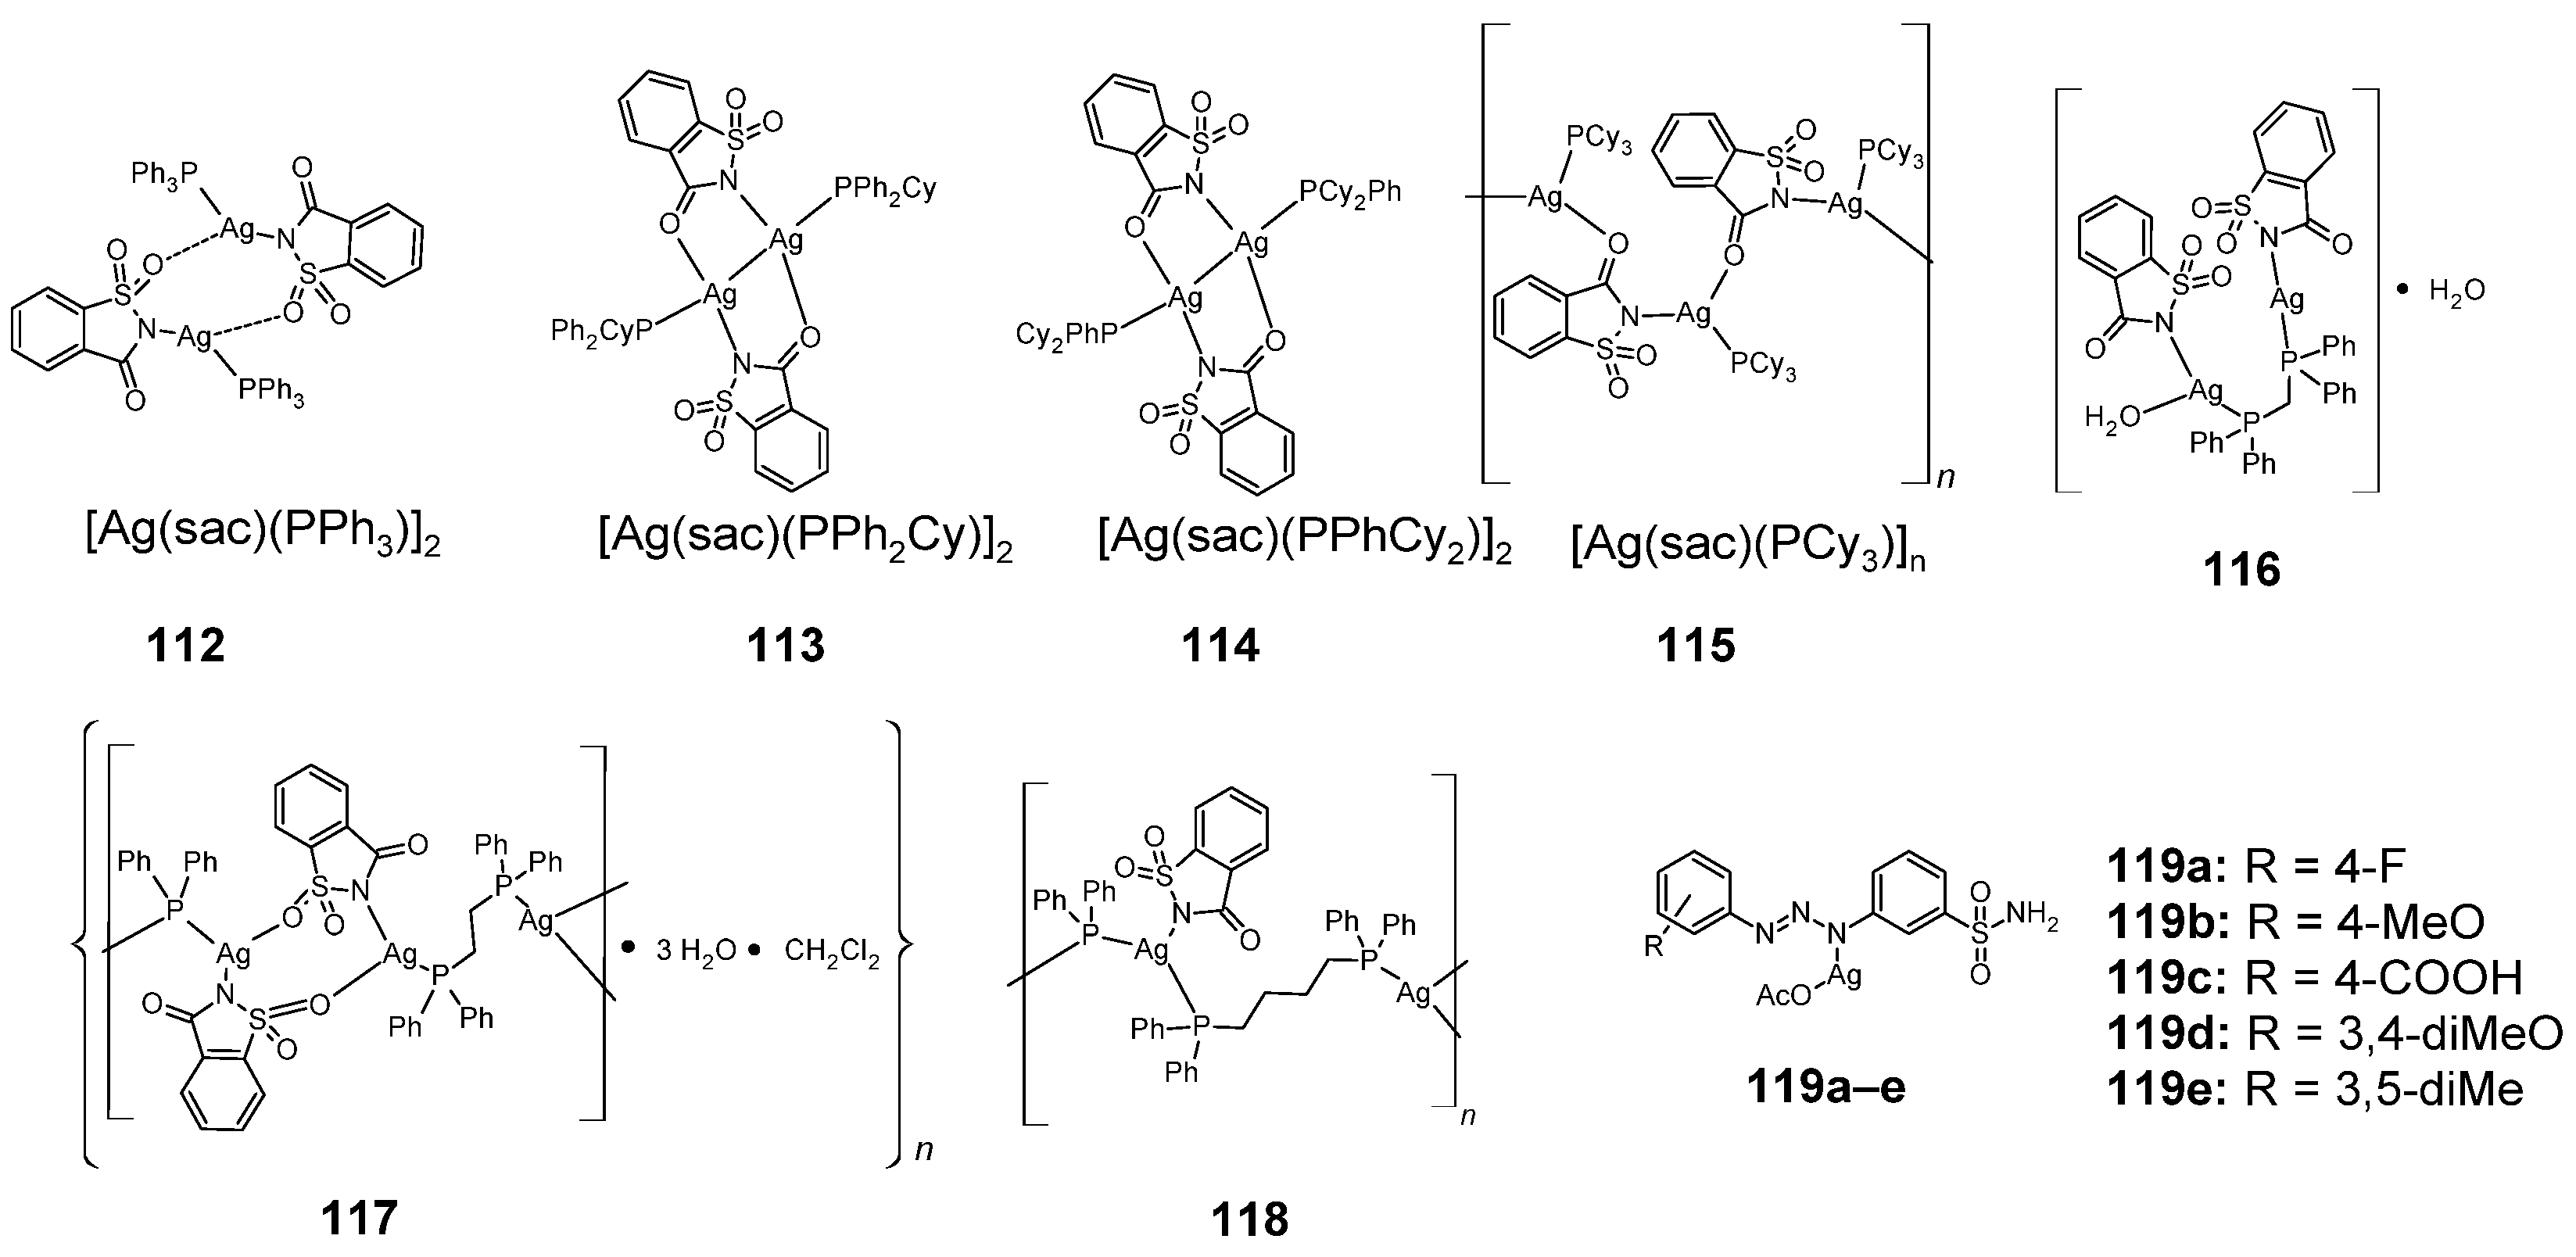
Figure 16.
Structures of silver complexes with sulfonamides 112–119.
Figure 16.
Structures of silver complexes with sulfonamides 112–119.
Figure 17.
Structures of sulfonamide complexes of gold 120–134.
Figure 17.
Structures of sulfonamide complexes of gold 120–134.
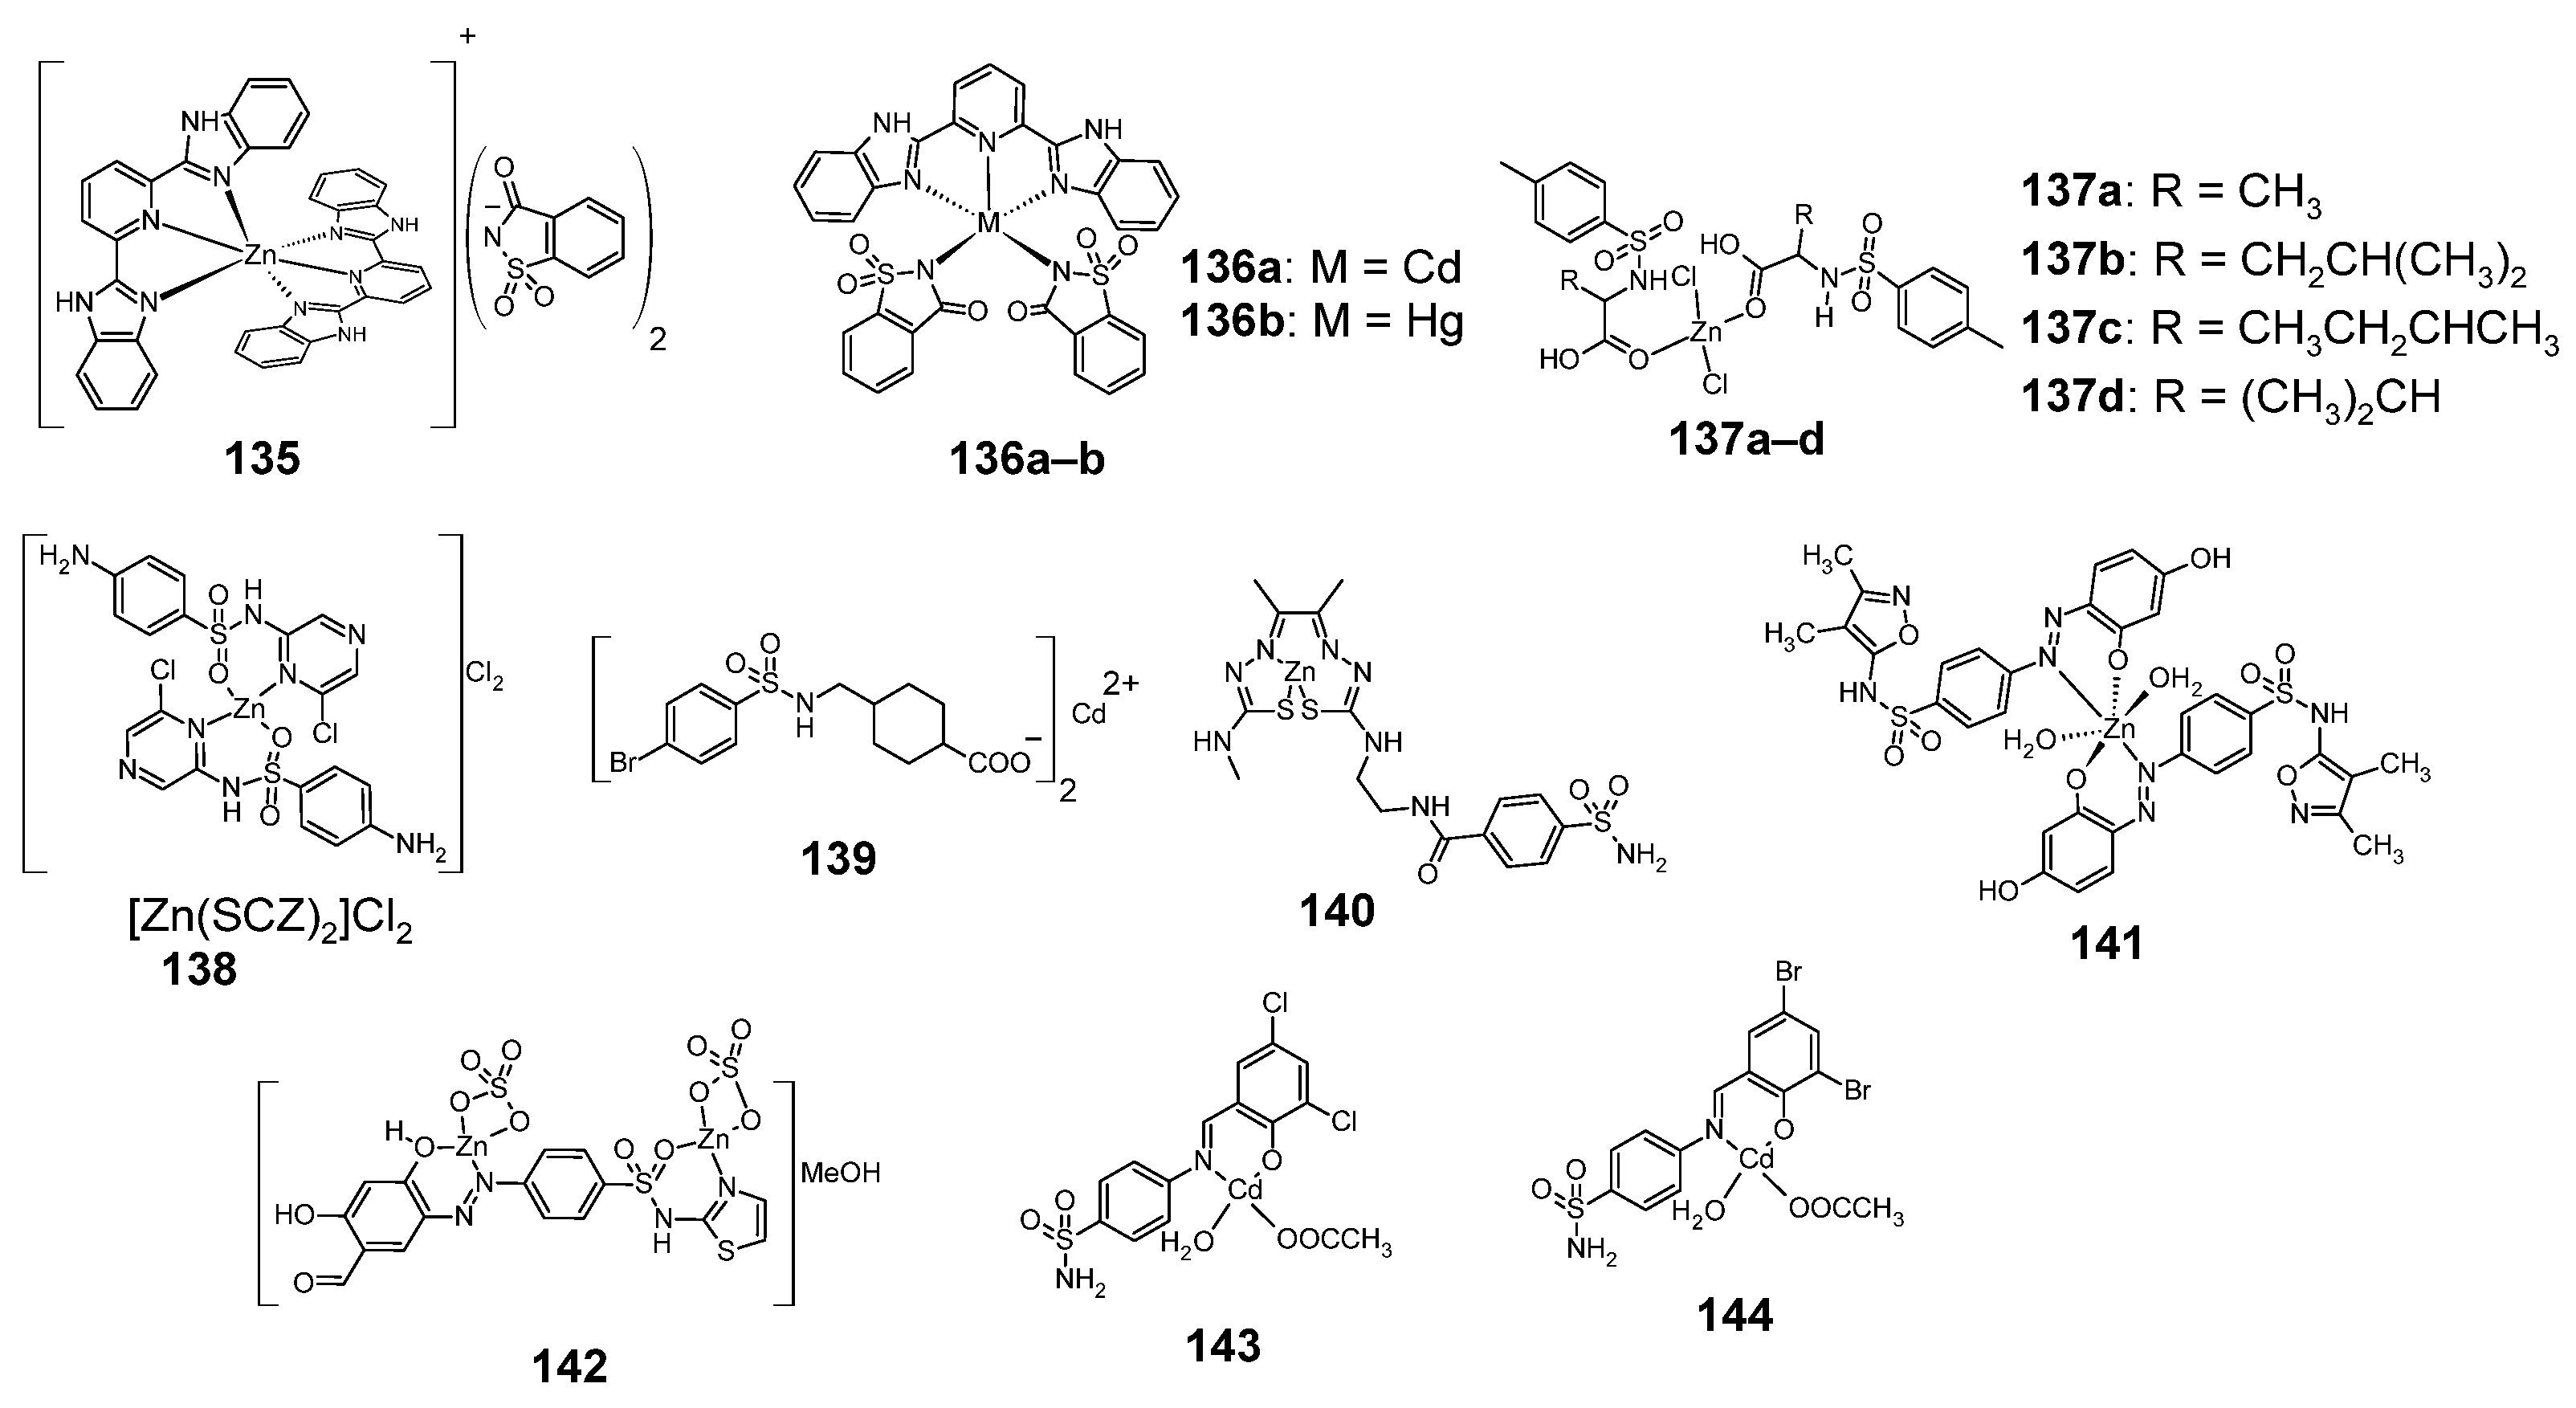
Figure 18.
Structures of complexes of sulfonamides with zinc, cadmium and mercury 135–144.
Figure 18.
Structures of complexes of sulfonamides with zinc, cadmium and mercury 135–144.
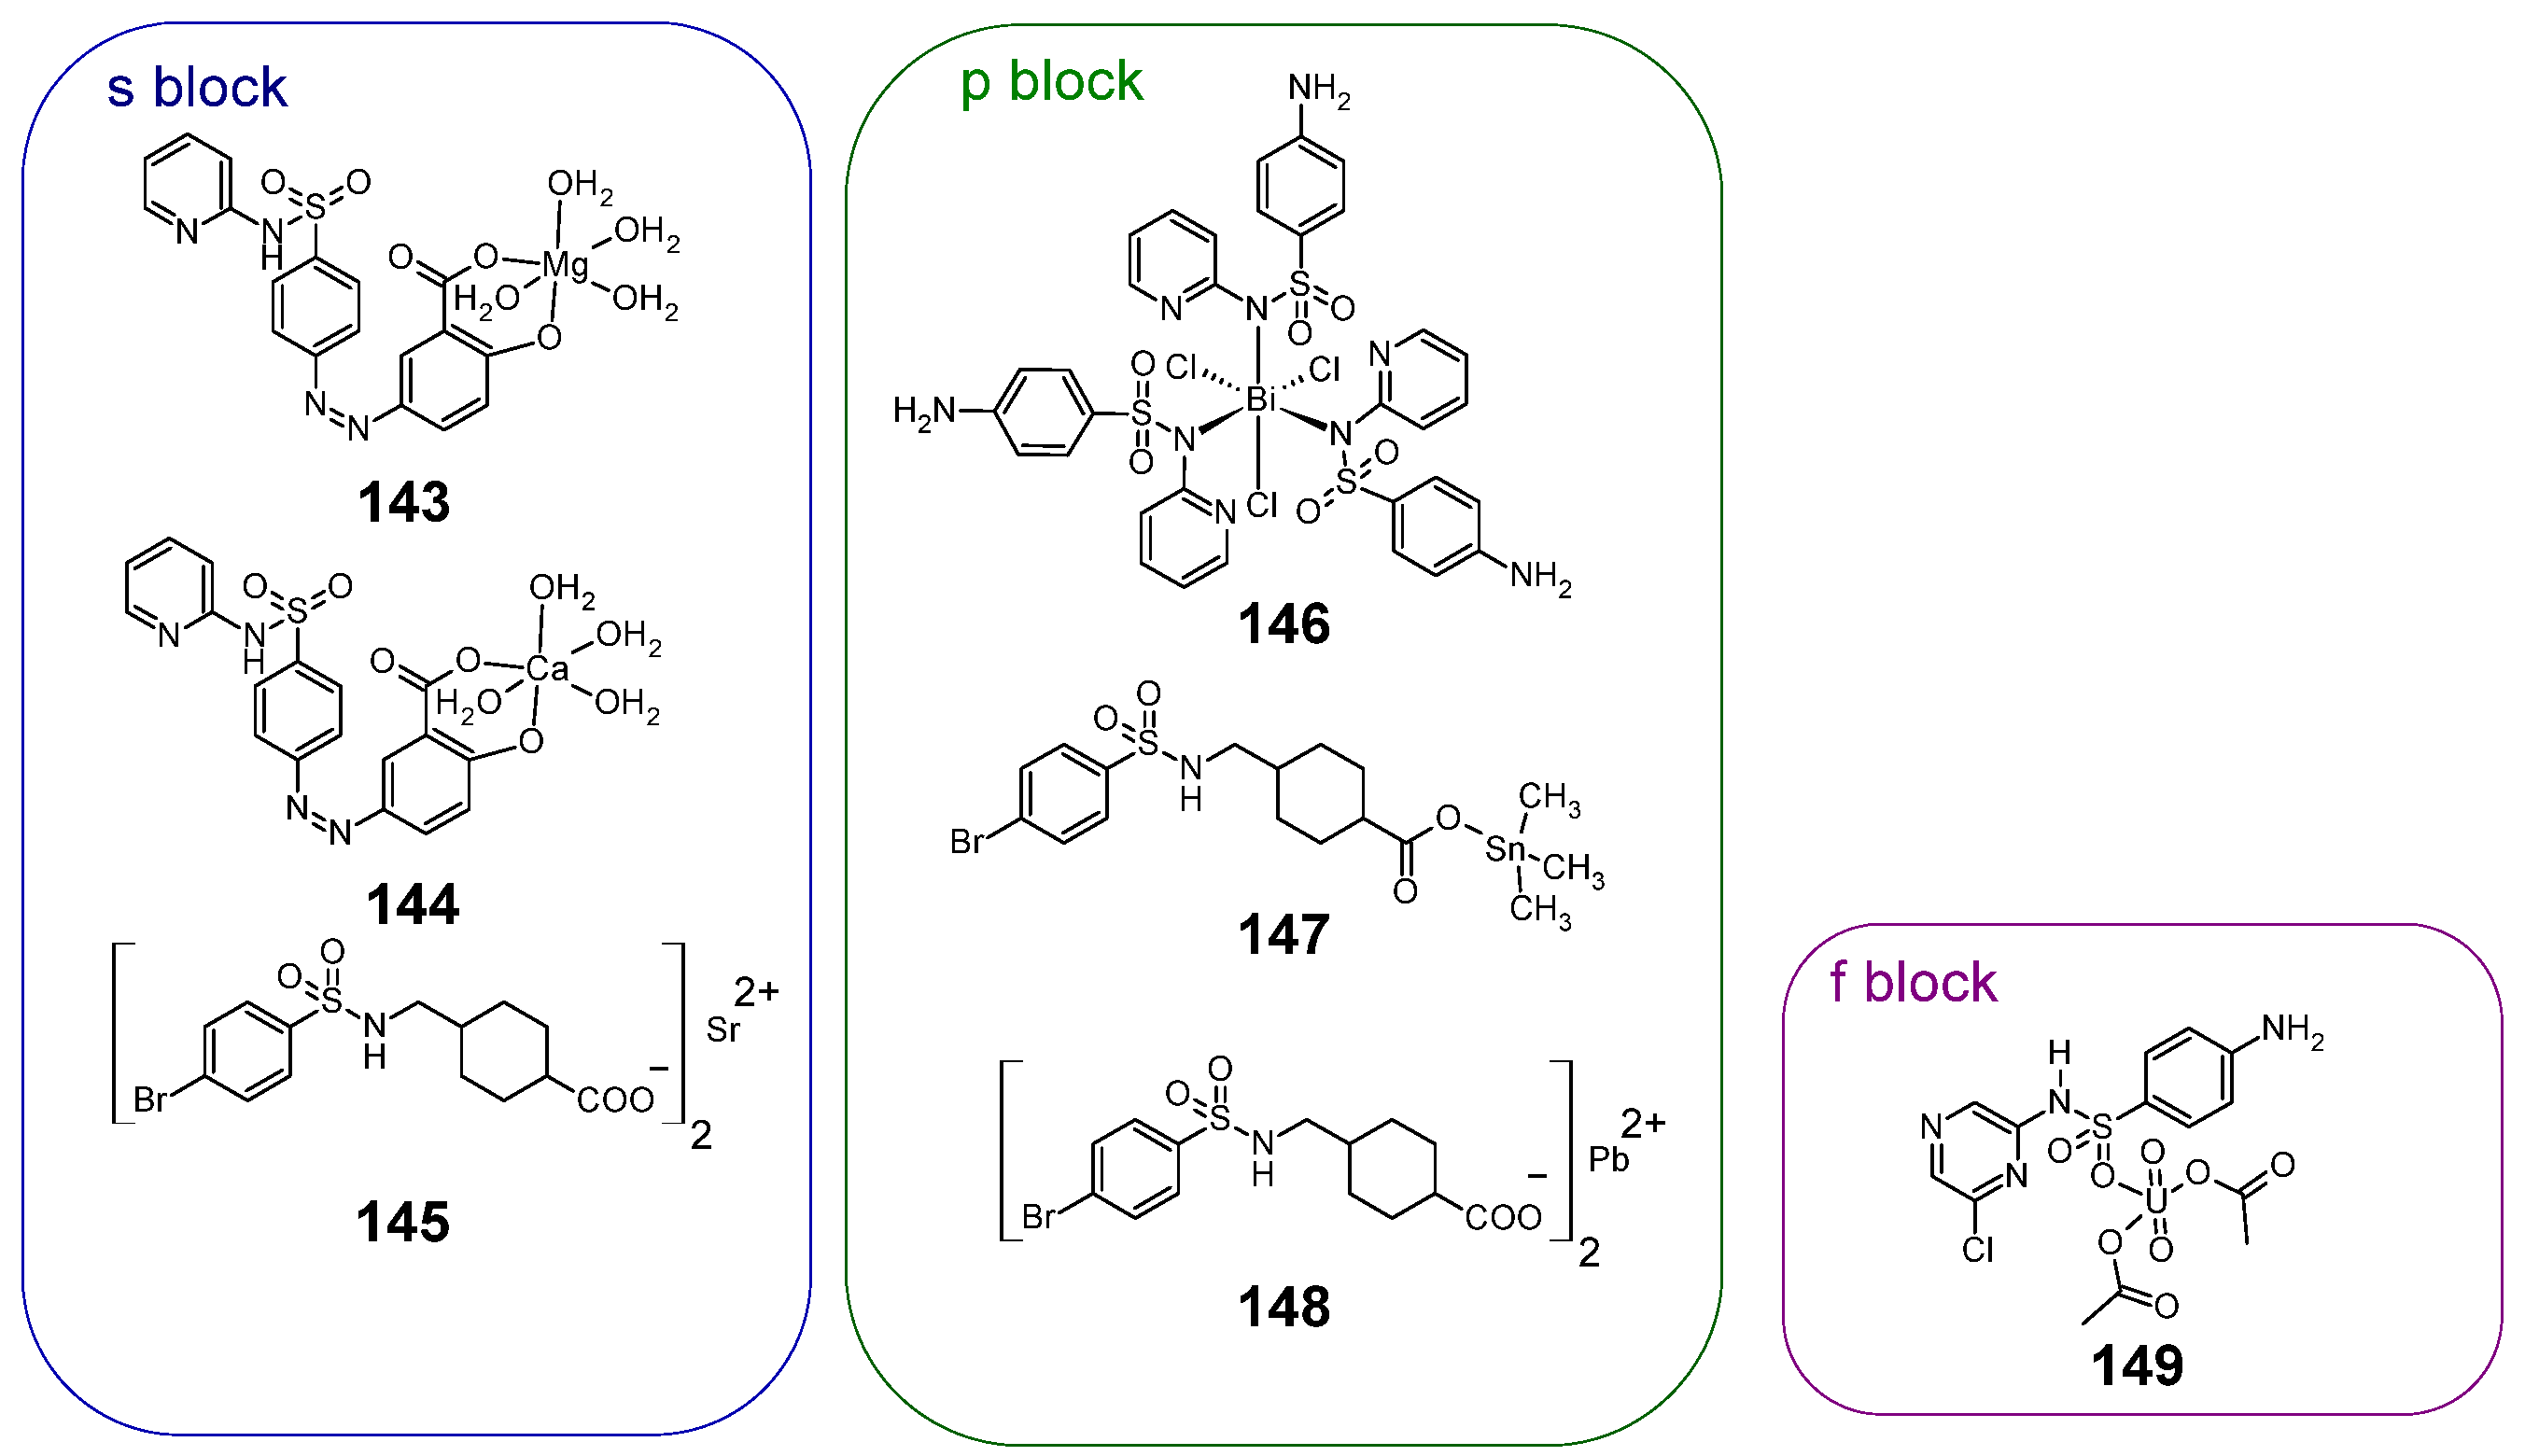
Figure 19.
Structures of sulfonamide complexes with non-d-block metals with anti-cancer activity 145–151.
Figure 19.
Structures of sulfonamide complexes with non-d-block metals with anti-cancer activity 145–151.
Table 1.
Anticancer activity of complexes 1a–d.
Table 1.
Anticancer activity of complexes 1a–d.
| Compound | IC50 (μM) |
|---|
| Hela S3 | Hep G2 |
|---|
| 1a | 3.1 ± 0.2 | 9.3 ± 0.2 |
| 1b | 0.9 ± 0.1 | 1.8 ± 0.2 |
| 1c | 0.5 ± 0.1 | 1 ± 0.1 |
| 1d | 19 ± 4 | Non-toxic |
| Cisplatin | 2.0 ± 0.3 | 4.8 ± 1.2 |
Table 2.
Anticancer activity of complexes 2 and 3.
Table 2.
Anticancer activity of complexes 2 and 3.
| Compound | IC50 (μM) |
|---|
| PC3 (Prostate Cancer) | HeLa (Cervical Cancer) |
|---|
| 2 | 32.6 ± 0.5 | 36.75 ± 1.0 |
| 3 | >100 | >100 |
| Doxorubicin | 0.912 ± 0.120 | 3.10 ± 0.2 |
Table 3.
Anticancer activity of complex 5.
Table 3.
Anticancer activity of complex 5.
| Compound | IC50 (μM) |
|---|
| A549 | HT29 | MCF-7 | MCF-10A |
|---|
| 5 | 1.60 ± 0.03 | 89.50 ± 2.52 | 3.50 ± 0.20 | >100 |
| Bzimpy ligand | 8.42 ± 0.37 | 19.22 ± 2.84 | 25.33 ± 0.84 | >100 |
| Cisplatin | 5.21 ± 0.18 | 11.25 ± 1.35 | 10.57 ± 0.39 | 13.80 ± 2.36 |
Table 4.
Inhibition data of complexes 6–10 (AZA = acetazolamide).
Table 4.
Inhibition data of complexes 6–10 (AZA = acetazolamide).
| CA Isozymes | Ki [nM] |
|---|
| 6 | 7 | 8 | 9 | 10 | AZA |
|---|
| hCA IX | 43 | 3.7 | 5.2 | 7 | 29.7 | 25 |
| hCA XII | 6.7 | 4.5 | 6.9 | 4.4 | 45.5 | 5.7 |
Table 5.
Anticancer activities of 11a–b and 12a–b.
Table 5.
Anticancer activities of 11a–b and 12a–b.
| NCI-H292 Cell Line |
|---|
| Compound | IC50 [µM] |
|---|
| 11a | 97.72 |
| 11b | 39.91 |
| 12a | 17.33 |
| 12b | 82.54 |
| Cisplatin | 88.18 |
Table 6.
Antitumor activity of compounds 13a–b against the H1299 cell line.
Table 6.
Antitumor activity of compounds 13a–b against the H1299 cell line.
| Compound | H1299 Cell Line
IC50 [μM] |
|---|
| 13a | 37.5 ± 6.6 |
| 13b | 24.3 ± 8.3 |
| Cisplatin | 12.8 ± 5.6 |
Table 7.
Competitive Binding of complexes 14a–m to Hypoxic CA-IX Expressing HeLa Cell.
Table 7.
Competitive Binding of complexes 14a–m to Hypoxic CA-IX Expressing HeLa Cell.
| Compound | L | Z | IC50 [nM] |
|---|
| Acetazolamide | 7 |
| 14a | (CH2)2 | Re-DPA | 116 |
| 14b | (CH2)2 | Re-PAMA | 28 |
| 14c | (CH2)2 | Re-NMI | 53 |
| 14d | (CH2)2 | Re-CIM | 4 |
| 14e | (CH2)2 | Re-CIM/TIM | 3 |
| 14f | (CH2)2 | Re-TIM | 9 |
| 14g | (CH2)2 | Re-TIM/HIM | 44 |
| 14h | (CH2)2 | Re-HIM | 109 |
| 14i | CH2 | Re-CIM | 51 |
| 14j | CH2 | Re-TIM | 116 |
| 14k | O(CH2)4 | Re-TIM | 43 |
| 14l | O(CH2)4 | Re-HIM | 35 |
| 14m | O(CH2)6 | Re-HIM | 33 |
Table 8.
Antitumor activity of compounds 15–18.
Table 8.
Antitumor activity of compounds 15–18.
| | IC50 [μM] |
|---|
| Compound | Cancer Cell Lines | Non-Cancer Cell Line |
|---|
| HCT116 | MCF7 | MDA-MB-231 | BJ |
|---|
| 15 | >100 | >100 | >100 | >100 |
| 16 | 55 ± 9 | 42 ± 7 | 68 ± 10 | >100 |
| 17 | 64 ± 11 | 63 ± 7 | 27 ± 2 | 63 ± 6 |
| 18 | 56 ± 16 | 33 ± 4 | 24 ± 2 | 62 ± 3 |
| Cisplatin | 21 ± 3 | 9.5 ± 1.5 | 29 ± 4 | 25 ± 5 |
Table 9.
Antitumor activity of 19–20.
Table 9.
Antitumor activity of 19–20.
| Compound | IC50 (µg/mL) |
|---|
| MCF-7 | CaCo-2 |
|---|
| SCZ ligand | 215.24 ± 0.67 | 97.6 ± 0.45 |
| 19 | 54.23 ± 0.52 | 190.1 ± 0.30 |
| 20a | 45.62 ± 0.28 | 106.87 ± 0.34 |
| 20b | 284.25 ± 0.31 | 362.9 ± 0.41 |
Table 10.
Anticancer activity of 21.
Table 10.
Anticancer activity of 21.
| Compound | IC50(µM) |
|---|
| K562 (Chronic Myelogenous Leukemia) | HT-29 (Colon Adenocarcinoma) | MCF-7 (Breast Cancer) |
|---|
| 21 | 51.06 | 44.21 | 42.34 |
| Cisplatin | 4.10 | 8.00 | 7.61 |
Table 11.
Cytotoxic activity of analogs of complex 4 containing iron, cobalt and nickel atoms.
Table 11.
Cytotoxic activity of analogs of complex 4 containing iron, cobalt and nickel atoms.
| Compound | Cell Viability After Treatment (%) |
|---|
| MCF-7 | HCEC |
|---|
| Iron analogue of complex 4 | 100 | 100 |
| Cobalt analogue of complex 4 | 52.92 | 41.27 |
| Nickel analogue of complex 4 | 47.52 | 58.11 |
Table 12.
CA inhibition data for compounds 22–33 against hCA IX and XII.
Table 12.
CA inhibition data for compounds 22–33 against hCA IX and XII.
| Compound | Ki (nM) |
|---|
| CA IX | CA XII |
|---|
| 22 | 85 | - |
| 23 | 65 | - |
| 24 | 33.1 | 18.8 |
| 25 | 5.9 | 6.8 |
| 26a | 80 | 9.2 |
| 26b | 81 | 8.0 |
| 26c | 7.9 | 6.8 |
| 27a | 9.6 | 7.9 |
| 27b | 9.1 | 7.3 |
| 27c | 8.1 | 7.0 |
| 28 | 75.5 | 8.7 |
| 29 | 136 | 26.2 |
| 30 | 76.2 | 9.1 |
| 31 | 186 | 31.5 |
| 32 | 137 | 21.1 |
| 33 | 82.3 | 21.4 |
Table 13.
Anticancer activity of nickel complexes 34–36.
Table 13.
Anticancer activity of nickel complexes 34–36.
| Compound | IC50 (μg/mL) |
|---|
| MCF-7 | OEC |
|---|
| 34 | 11.3 ± 1.1 | 62.23 ± 3.11 |
| 35 | 5.04 ± 0.6 | 33.59 ± 1.68 |
| 36 | 365 ± 24.6 | >100 |
| Cisplatin | 5.71 ± 0.7 | 32.68 ± 2.74 |
Table 14.
Anticancer activity of 37–39.
Table 14.
Anticancer activity of 37–39.
| Compound | IC50 (µg/mL) |
|---|
| A-549 (Lung Cancer) | PANC-1 (Pancreatic Cancer) |
|---|
| 37 | 154.73 ± 11.48 | 102.03 ± 5.95 |
| 38 | 248.38 ± 14.65 | 185.81 ± 9.73 |
| 39 | 176.48 ± 10.72 | 120.84 ± 6.28 |
| Ligand | 466.25 ± 17.52 | 360.61 ± 14.63 |
| Vinblastine sulfate | 24.6 ± 0.65 | 4.68 ± 0.65 |
Table 15.
Anticancer activity of 40–41.
Table 15.
Anticancer activity of 40–41.
| Compound | IC50 (µM) |
|---|
| Hep-G2 (Hepatocellular Carcinoma) | MCF-7 (Breast Cancer) |
|---|
| Ligand | >1236.30 | >1236.30 |
| 40 | 197.45 | 26.41 |
| 41 | 562.00 | 224.80 |
| Cisplatin | 40.76 | - |
| 5-fluorouracil | - | 215.26 |
Table 16.
Cytotoxic activities against HCT-116 cell line for the Ru(III) complexes 42–46.
Table 16.
Cytotoxic activities against HCT-116 cell line for the Ru(III) complexes 42–46.
| Compound | IC50 [μg] |
|---|
| HCT-116 Cell Line |
|---|
| 42 | >50 |
| 43 | >50 |
| 44 | >50 |
| 45 | 24.5 |
| 46 | 10.3 |
| Doxorubicin | 0.471 |
Table 17.
Cytotoxic activities against K562 cell line for the complexes 47–48.
Table 17.
Cytotoxic activities against K562 cell line for the complexes 47–48.
| Compound | IC50 (μM) |
|---|
| K562 Cell Line |
|---|
| 47 | 3.80 ± 0.19 |
| 48 | 2.00 ± 0.10 |
| cis-[RuCl2(bpy)2] | >100 |
| cis-[RuCl2(phen)2] | >100 |
Table 18.
Cytotoxic activity of complexes 50a–h.
Table 18.
Cytotoxic activity of complexes 50a–h.
| Compound | IC50 [μM] |
|---|
| A2780 Cell Line | A549 Cell Line |
|---|
| 50a | 8.32 ± 0.54 | 28.8 ± 2.6 |
| 50b | 11.25 ± 0.08 | 13.5 ± 1.4 |
| 50c | 18.4 ± 1.2 | 32.2 ± 0.7 |
| 50d | 14.25 ± 0.06 | 16.1 ± 2.4 |
| 50e | 3.57 ± 0.98 | 29.8 ± 1.1 |
| 50f | 5.6 ± 0.5 | 13.7 ± 0.1 |
| 50g | >50 | 4.1 ± 1.3 |
| 50h | 39.4 ± 3.4 | 38.5 ± 1.9 |
| Cisplatin | 1.2 ± 0.02 | 3.1 ± 0.1 |
Table 19.
Inhibition of isoforms hCA IX and hCA XII by acetazolamide and 51a–b.
Table 19.
Inhibition of isoforms hCA IX and hCA XII by acetazolamide and 51a–b.
| Compound | KI [nM] |
|---|
| hCA IX | hCA XII |
|---|
| 51a | 3.8 | 0.52 |
| 51b | 0.63 | 0.04 |
| Acetazolamide | 25.2 | 5.7 |
Table 20.
Anticancer activity of 52a–b.
Table 20.
Anticancer activity of 52a–b.
| Compound | IC50 (μM) |
|---|
| Normoxia (~12% O2) | Hypoxia (~1.5% O2) |
|---|
| CHO | MDCK | MIA PaCa-2 | MDA-MB-231 | MDA-MB231 |
|---|
| 52a | >200 | >200 | 22.5 ± 1.5 | 38.3 ± 1.5 | 27.9 ± 1.0 |
| 52b | >200 | >200 | 17.1 ± 1.0 | 39.6 ± 3.2 | 17.7 ± 1.8 |
Table 21.
Anticancer activity of 53–56 against A2780 cell line.
Table 21.
Anticancer activity of 53–56 against A2780 cell line.
| Compound | GI50 (μM) |
|---|
| A2780 Cell Line |
|---|
| 53 | 5.5 ± 0.5 |
| 54 | 13.7 ± 0.4 |
| 55 | 1.2 ± 0.3 |
| 56 | 1.8 ± 0.2 |
| Cisplatin | 2.0 ± 0.2 |
Table 22.
Anticancer activity of 57–61.
Table 22.
Anticancer activity of 57–61.
| Compound | IC50 (µM) |
|---|
| HeLa | A549 | HCT-116 | MCF-7 |
|---|
| 57a | 10.3 ± 1.3 | n.d. | n.d. | n.d. |
| 57b | 3.3 ± 0.4 | n.d. | n.d. | n.d. |
| 57c | 3.1 ± 0.4 | n.d. | n.d. | n.d. |
| 57d | 7.0 ± 0.5 | n.d. | n.d. | n.d. |
| 57e | 4.1 ± 0.7 | 13.8 ± 2.0 | 11.2 ± 2.8 | 21.9 ± 2.0 |
| 57f | 3.6 ± 0.5 | 12.6 ± 1.4 | 9.8 ± 0.7 | 9.2 ± 0.7 |
| 57g | 1.7 ± 0.4 | 2.5 ± 0.3 | 1.3 ± 0.1 | 8.5 ± 1.8 |
| 58 | >100 | n.d. | n.d. | n.d. |
| 59 | 9.3 ± 1.0 | n.d. | n.d. | n.d. |
| 60 | 13.0 ± 1.4 | n.d. | n.d. | n.d. |
| 61 | >100 | n.d. | n.d. | n.d. |
| Cisplatin | 7.0 ± 1.5 | 11.7 ± 2.0 | 16.0 ± 2.3 | 12.5 ± 0.9 |
Table 23.
Anticancer activities of 62a–b.
Table 23.
Anticancer activities of 62a–b.
| Compound | IC50 [μM] |
|---|
| MRC5 Cell Line | A2780Cis |
|---|
| 62a | 15.1 ± 0.5 | 25.9 ± 0.7 |
| 62b | 9.7 ± 0.2 | 10.4 ± 0.5 |
| Cisplatin | 13.5 ± 0.9 | 11.5 ± 0.2 |
Table 24.
Anticancer activities of 62c–d against seven cell lines (N.D. = not determined).
Table 24.
Anticancer activities of 62c–d against seven cell lines (N.D. = not determined).
| Compound | IC50 [μM] |
|---|
| A2780 | A549 | HCT-116 | MCF7 | MCF7−TAMR-1 | MCF10-A | MDA−MB-231 |
|---|
| 62c | 15.5 ± 0.5 | 21.1 ± 0.3 | 37 ± 1 | 11.0 ± 0.3 | N.D. | N.D | 15 ± 1 |
| 62d | 10.5 ± 0.1 | 14.1 ± 0.3 | 36.4 ± 0.2 | 8.1 ± 0.2 | 9 ± 1 | 30.9 ± 0.4 | 9.1 ± 0.9 |
| Cisplatin | 1.2 ± 0.3 | 3.2 ± 0.1 | 5.2 ± 0.3 | 6.6 ± 0.2 | 6.0 ± 0.7 | 6 ± 1 | 9.6 ± 0.4 |
| Tamoxifen | 12.4 ± 0.1 | 13.5 ± 0.1 | 19 ± 3 | 5.9 ± 0.4 | 14.5 ± 0.1 | 25.0 ± 0.2 | 12.9 ± 0.2 |
Table 25.
Anticancer activity of 63a–h.
Table 25.
Anticancer activity of 63a–h.
| Compound | IC50 (μM) |
|---|
| A2780 (Ovarian Cancer) | A549 (Lung Cancer) |
|---|
| 63a | 15.2 ± 0.5 | 21.1 ± 0.3 |
| 63b | 15.5 ± 0.5 | 31 ± 1 |
| 63c | 31 ± 2 | 29.5 ± 0.5 |
| 63d | 27.4 ± 0.6 | 33 ± 0.4 |
| 63e | 27.5 ± 0.8 | 32 ± 0.4 |
| 63f | 29 ± 3 | - |
| 63g | 17 ± 1 | 32 ± 2 |
| 63h | 27 ± 2 | 21.1 ± 0.3 |
Table 26.
Phototoxic activity of compounds 64 and 65 against A549 and MDA-MB-231 cell lines (in normoxia and hypoxia) at four wavelengths of radiation.
Table 26.
Phototoxic activity of compounds 64 and 65 against A549 and MDA-MB-231 cell lines (in normoxia and hypoxia) at four wavelengths of radiation.
| Compound | IC50 (540 nm) [μM] | IC50 (620 nm) [μM] | IC50 (670 nm) [μM] | IC50 (740 nm) [μM] |
|---|
| A549 cell line (Normoxia 20%) |
| 64 | 8 | >30 | 26.2 5.4 | 22.5 3.8 |
| 65 | 4.40.1 | 10.4 0.7 | 9.9 0.9 | .1 |
| PPIX | 0.3 0.1 | 2.7 0.1 | 3.0 0.1 | >100 |
| A549 cell line (Hipoxia 2%) |
| 64 | 14.63.1 | >30 | >100 | >100 |
| 65 | >30 | >30 | >100 | >100 |
| PPIX | 0.7 0.2 | 2.2 0.9 | 3.5 0.3 | >100 |
| MDA-MB-231 cell line (Normoxia 20%) |
| 64 | 1.2 | 6.2 2.8. | 3.9 0.5 | 3.6 0.4 |
| 65 | 2.2 0.1 | 2.6 0.5 | 3.0 1.2 | 0.7 0.2 |
| PPIX | 0.8 0.4 | 1.0 0.5 | 0.7 0.3 | - |
| MDA-MB-231 cell line (Hipoxia, 2%) |
| 64 | >10 | 9.2 3.0 | 12.0 1.0 | >30 |
| 65 | >30 | >30 | 4.6 0.6 | >30 |
| PPIX | 0.6 0.1 | 1.8 0.4 | 0.4 0.1 | - |
Table 27.
Anticancer activity of sulfonamide complexes with iridium 66a–c (N.D. = not determined).
Table 27.
Anticancer activity of sulfonamide complexes with iridium 66a–c (N.D. = not determined).
| Cell Lines | IC50 (μM) |
|---|
| 66a | 66b | 66c | Cisplatin |
|---|
| A2780 (ovarian cancer) | 20.9 ± 0.7 | 14 ± 2 | 10.2 ± 0.6 | 1.2 ± 0.3 |
| A2780cis (ovarian, cisplatin-resistant) | 17 ± 2 | 18 ± 1 | 6.3 ± 0.8 | 13.4 ± 0.3 |
| A549 (lung cancer) | 38 ± 2 | 25.2 ± 0.3 | 17 ± 3 | 3.2 ± 0.1 |
| HCT116 (colorectal cancer) | 40.3 ± 0.7 | 58.2 ± 0.9 | 15.0 ± 0.1 | 5.2 ± 0.3 |
| HCT116-p21-/- (colorectal cancer, p21 knockout) | 62.4 ± 0.3 | N.D. | N.D. | 9.2 ± 0.5 |
| HCT116-p53-/- (colorectal cancer, p53 knockout) | 63 ± 2 | N.D. | N.D. | 36.7 ± 0.3 |
| MCF10-A (breast, non-tumorigenic) | 42 ± 3 | N.D. | N.D. | 6 ± 1 |
| HOF (ovarian, non-tumorigenic) | 19.0 ± 0.1 | 26.8 ± 0.6 | 15.0 ± 0.7 | 10.2 ± 0.7 |
| MCF7 (breast cancer) | 14.6 ± 0.2 | 8 ± 1 | 3.7 ± 0.7 | 6.6 ± 0.4 |
| MCF7-TAMR1 (breast, tamoxifen-resistant) | 17.8 ± 0.6 | N.D. | N.D. | 6.0 ± 0.7 |
| MRC5 (lung, non-tumorigenic) | 17.3 ± 0.4 | 11.9 ± 0.9 | 5.9 ± 0.2 | 12.8 ± 0.5 |
| OE19 (esophageal cancer) | >50 | 33.2 ± 0.5 | 12.9 ± 0.3 | 9 ± 1 |
| PC3 (prostate cancer) | 35.1 ± 0.6 | 18.8 ± 0.2 | 12 ± 1 | 4.1 ± 0.5 |
Table 28.
Anticancer activities of 67.
Table 28.
Anticancer activities of 67.
| Compound | IC50 [µM] |
|---|
| HeLa | A549 | MCF-7 | NIH |
|---|
| sodium saccharin | >200 | >200 | >200 | - |
| Ligand | >200 | 93.8 ± 4 | >200 | - |
| 67 | 30.4 ± 2 | 23.1 ± 1 | 22.2 ± 1 | 165 ± 1 |
| Cisplatin | 17.6 ± 1 | 24.3 ± 1 | 26.3 ± 1 | 38.67 ± 4 |
Table 29.
Cytotoxic activities of 68 and 69.
Table 29.
Cytotoxic activities of 68 and 69.
| Compound | IC50 [µM] |
|---|
| A549 | H1299 | PC-3 | CHO |
|---|
| 68 | 2.3 | 8.6 | 9.6 | 5.8 |
| 69 | 2.1 | 1.8 | 1.8 | 1.9 |
| Cisplatin | 23.1 | 3.2 | 8.6 | 3.2 |
Table 30.
Cytotoxic activities of palladium complexes 70–73.
Table 30.
Cytotoxic activities of palladium complexes 70–73.
| Compound | IC50 [µM] |
|---|
| HL-60 (Leukemia) | BGC-823 (Gastrocarcinoma) | Bel-7402 (Liver Carcinoma) | KB (Nasopharyngeal Carcinoma) |
|---|
| 70a | 26 1 | 48 2 | 45 1 | 32 2 |
| 70b | 23 1 | 38 2 | .9 | |
| 70c | 15.9 | | 33.9 0.6 | 12 1 |
| 70d | 12.9 0.9 | 35.8 0.8 | 33 2 | 15.6 0.9 |
| 70e | 12 1 | | 28 | 11.8 0.5 |
| 71a | 18.66 ± 1.07 | 23.74 ± 1.23 | 44.52 ± 1.43 | 9.28 ± 1.07 |
| 71b | 16.76 ± 1.08 | 25.78 ± 1.11 | 40.76 ± 1.45 | 6.54 ± 0.97 |
| 72a | 9.20 ± 0.97 | 21.70 ± 2.08 | 18.01 ± 1.32 | 6.08 ± 0.87 |
| 72b | 12.46 ± 1.05 | 23.45 ± 1.32 | 38.98 ± 2.08 | 5.98 ± 0.65 |
| 73 | 16.54 ± 1.21 | 30.89 ± 1.34 | 30.76 ± 2.07 | 22.54 ± 1.23 |
| Cisplatin | 2.89 ± 0.34 | 6.48 ± 0.81 | 8.12 ± 0.97 | 2.65 ± 0.33 |
Table 31.
Anticancer activity of palladium complex with sulfamethoxazole (74).
Table 31.
Anticancer activity of palladium complex with sulfamethoxazole (74).
| Compound | IC50(µM) |
|---|
| K562 | HT-29 | MCF-7 |
|---|
| 74 | 7.20 | 10.42 | 8.64 |
| Cisplatin | 4.10 | 8.00 | 7.61 |
Table 32.
Cytotoxic activities of 75 against four cancer cell lines.
Table 32.
Cytotoxic activities of 75 against four cancer cell lines.
| Cell Lines | IC50 [µM] | IC90 [µM] |
|---|
| A549 (lung cancer) | 75 | 117.5 | 192.4 |
| Carboplatin | 70.5 | >85.1 |
| PC3 (prostate cancer) | 75 | 72.2 | 95.6 |
| Carboplatin | 85.1 | >85.1 |
| Hep3B (liver cancer) | 75 | 35.0 | 82.1 |
| Carboplatin | 6.8 | 28.7 |
| C6 (glioma) | 75 | 38.9 | 90.9 |
| Carboplatin | 7.6 | 42.7 |
Table 33.
Antitumor activities of 76–78.
Table 33.
Antitumor activities of 76–78.
| Compound | IC50 [µM] |
|---|
| MCF-7 | A549 | DU145 | HCT116 | BEAS-2B |
|---|
| 76 | 8.4 ± 0.1 | 10.1 ± 1.7 | 14.5 ± 0.5 | 13.0 ± 0.7 | 8.1 ± 0.3 |
| 77 | 3.8 ± 0.4 | 4.0 ± 0.1 | 4.6 ± 0.1 | 4.8 ± 0.1 | 2.4 ± 0.1 |
| 78 | 17.0 ± 3.7 | 30.1 ± 1.0 | 37.7 ± 0.1 | 36.7 ± 0.2 | 27.7 ± 1.2 |
| Cisplatin | 24.0 ± 4.0 | 2.5 ± 0.9 | 9.8 ± 4.5 | 15.5 ± 2.3 | 4.6 ± 0.2 |
Table 34.
GI50, TGI and LC50 values (after 48 h) for complexes 79 and 80.
Table 34.
GI50, TGI and LC50 values (after 48 h) for complexes 79 and 80.
| Cell Lines | 79 | 80 | Cisplatin |
|---|
| A549 | GI50 [µM] | 16.42 ± 0.85 | 24.56 ± 4.34 | 14.38 ± 0.47 |
| TGI [µM] | 29.13 ± 1.43 | >40 | 22.63 ± 0.38 |
| LC50 [µM] | >40 | >40 | 37.77 ± 0.65 |
| MCF-7 | GI50 [µM] | 7.38 ± 0.64 | 5.38 ± 0.03 | 10.88 ± 0.18 |
| TGI [µM] | 13.40 ± 0.66 | 22.06 ± 0.57 | 15.19 ± 0.10 |
| LC50 [µM] | 18.93 ± 0.64 | 38.64 ± 0.68 | 19.50 ± 0.01 |
| HCT-116 | GI50 [µM] | 12.19 ± 0.26 | 12.72 ± 1.55 | 9.03 ± 1.46 |
| TGI [µM] | 17.12 ± 0.23 | 24.39 ± 2.53 | 21.24 ± 1.71 |
| LC50 [µM] | 28.18 ± 0.49 | >40 | 34.28 ± 1.10 |
| BEAS-2B | GI50 [µM] | 8.52 ± 0.63 | 21.46 ± 0.76 | 3.85 ± 0.03 |
| TGI [µM] | 14.06 ± 0.81 | 31.06 ± 0.59 | 6.18 ± 0.17 |
| LC50 [µM] | 26.95 ± 2.56 | >40 | 10.83 ± 1.24 |
Table 35.
Cytotoxic activity of 81.
Table 35.
Cytotoxic activity of 81.
| Compound | IC50 [µM] |
|---|
| A549 | MCF-7 | HCT-116 | BEAS-2B |
|---|
| 81 | 7.32 | 16.89 | 6.88 | 6.82 |
| Cisplatin | 17.23 | 11.68 | 14.69 | 6.29 |
Table 36.
The cytotoxic activity of 82 depending on the solubilizing solvent used.
Table 36.
The cytotoxic activity of 82 depending on the solubilizing solvent used.
| Compound | Solubilizing Solvent | IC50 [µM] |
|---|
| A2780 | A2870CP70 |
|---|
| 82 | DMSO | 1.0 ± 0.3 | 2.7 ± 0.6 |
| DMF | 0.43 ± 0.05 | 0.8 ± 0.1 |
| Cisplatin | PBS (Phosphate-buffered saline) | 0.18 ± 0.07 | 5 ± 1 |
Table 37.
Anti-cancer activity of compounds 83 and 84 against cell lines under normoxia and hypoxia.
Table 37.
Anti-cancer activity of compounds 83 and 84 against cell lines under normoxia and hypoxia.
| Cell Lines | IC50 [μM] |
|---|
| 83 | 84 | Cisplatin | Oxaliplatin |
|---|
| Normoxia (20% O2) |
| MDA-MB-231 (breast cancer) | 18.0 ± 1.8 | 27.6 ± 2.3 | 14.6 ± 0.8 | 35.4 ± 2.0 |
| HeLa (cervical cancer) | 12.6 ± 1.2 | 41.7 ± 2.3 | 15.9 ± 1.3 | 28.1 ± 2.6 |
| HepG2 (hepatocellular carcinoma) | 28.6 ± 0.6 | 30.4 ± 0.8 | 17.9 ± 1.9 | 8.1 ± 0.8 |
| LO2 (hepatocyte cell line) | 158.5 ± 3.4 | >200 | 12.0 ± 1.5 | 31.0 ± 5.3 |
| HLF (lung fibroblast) | 102.6 ± 8.6 | >200 | 10.7 ± 2.9 | 23.7 ± 1.9 |
| MCF-10A ((mammary epithelial cell line) | 153.7 ± 3.6 | >200 | 17.9 ± 1.9 | 8.9 ± 0.4 |
| Hipoxia (1% O2) |
| MDA-MB-231 | 1.9 ± 0.9 | 5.8 ± 2.1 | 21.9 ± 5.9 | 65.7 ± 5.3 |
| HeLa | 3.6 ± 0.3 | 15.8 ± 2.6 | 28.2 ± 1.7 | >50 |
| HepG2 | 8.3 ± 1.8 | 5.6 ± 1.5 | 20.2 ± 3.8 | 18.1 ± 2.1 |
Table 38.
Antitumor activity of 85–87 complexes against MCF-7 cells.
Table 38.
Antitumor activity of 85–87 complexes against MCF-7 cells.
| Compound | IC50 [μM]
MCF-7 Cell Line |
|---|
| 85 | 529.3 ± 0.22 |
| 86 | 135.7 ± 0.06 |
| 87 | 16.1 ± 0.08 |
| Cisplatin | 97.86 |
Table 39.
Antitumor activity of 88 against melanoma cell lines: SK-MEL-5 and SK-MEL-28.
Table 39.
Antitumor activity of 88 against melanoma cell lines: SK-MEL-5 and SK-MEL-28.
| Compound | IC50 [μM] |
|---|
| SK-MEL-5 | SK-MEL-28 |
|---|
| 88 | 3.24 ± 1.08 | 5.83 ± 1.06 |
| Cisplatin | 2.89 ± 1.12 | 10.17 ± 1.29 |
Table 40.
Antitumor activity of 89–90 and their ligands against NCl–H292 lung cancer cells after 24, 48 and 72 h.
Table 40.
Antitumor activity of 89–90 and their ligands against NCl–H292 lung cancer cells after 24, 48 and 72 h.
| Compound | IC50 [μg/mL] |
|---|
| 24 h | 48 h | 72 h |
|---|
| 89 | 37.83 | 15.94 | 9.01 |
| Ligand of 89 | 225 | 31.82 | 36.49 |
| 90 | 112.8 | 26.21 | 12.13 |
| Ligand of 90 | 612.4 | 17.88 | 13.95 |
Table 41.
Anticancer activity of 91.
Table 41.
Anticancer activity of 91.
| Compound | IC50(µM) |
|---|
| K562 | HT-29 | MCF-7 |
|---|
| 91 | 9.67 | 12.12 | 11.37 |
| Cisplatin | 4.10 | 8.00 | 7.61 |
Table 42.
Antitumor activity of 92.
Table 42.
Antitumor activity of 92.
| Compound | IC50 [μM] |
|---|
| MCF-7 | MDA-MB-231 |
|---|
| 92 | 3.60 | 3.81 |
| Tamoxifen | 4.04 | 13.46 |
Table 43.
Anticancer activity of 93 and 94.
Table 43.
Anticancer activity of 93 and 94.
| Compound | IC50 [μM] |
|---|
| MCF-7 | HEK-293 |
|---|
| 93 | 5.62 ± 2.28 | 93.44 ± 12.17 |
| 94 | 18.86 ± 1.01 | 94.43 ± 10.18 |
| Saccharine | 46.60 ± 7.92 | >100 |
| Cisplatin | 10.37 ± 3.11 | >100 |
Table 44.
IC50 values of the complexes 95a–e against HMLER cells, HMLER-shEcad cells, and HMLER-shEcad mammospheres.
Table 44.
IC50 values of the complexes 95a–e against HMLER cells, HMLER-shEcad cells, and HMLER-shEcad mammospheres.
| Compound | IC50 [μM] |
|---|
| HMLER | HMLER-shEcad | HMLER-shEcad Mammospheres |
|---|
| 95a | 0.85 ± 0.04 | 0.69 ± 0.12 | 3.44 ± 0.03 |
| 95b | 0.85 ± 0.14 | 0.83 ± 0.01 | 2.98 ± 0.01 |
| 95c | 0.83 ± 0.06 | 0.73 ± 0.04 | 2.63 ± 0.08 |
| 95d | 0.83 ± 0.19 | 0.78 ± 0.03 | 2.99 ± 0.53 |
| 95e | 0.81 ± 0.02 | 0.79 ± 0.18 | 3.34 ± 0.36 |
| Cisplatin | 2.57 ± 0.02 | 5.65 ± 0.30 | 13.50 ± 2.34 |
| Salinomycin | 11.43 ± 0.42 | 4.23 ± 0.35 | 18.50 ± 1.50 |
Table 45.
IC50 values of 96, 97 and cisplatin on the HeLa, WM35, and HFL1 cell lines after 24, 48 and 72 h.
Table 45.
IC50 values of 96, 97 and cisplatin on the HeLa, WM35, and HFL1 cell lines after 24, 48 and 72 h.
| Cell Line | Compound | IC50 [μM] |
|---|
| 24 h | 48 h | 72 h |
|---|
| HeLa (cervical carcinoma) | 96 | 33.18 ± 0.19 | 16.36 ± 0.12 | 6.47 ± 0.06 |
| 97 | 8.79 ± 0.21 | 4.06 ± 0.05 | 1.45 ± 0.09 |
| Cisplatin | 21.03 ± 0.14 | 21.03 ± 0.14 | 2.39 ± 0.04 |
| MW35 (radical growth phase melanoma) | 96 | 41.35 ± 0.19 | 23.87 ± 0.17 | 15.42 ± 0.08 |
| 97 | 13.01 ± 0.15 | 8.11 ± 0.13 | 4.66 ± 0.07 |
| Cisplatin | 26.07 ± 0.43 | 11.15 ± 0.09 | 5.98 ± 0.03 |
| HFL1 (normal fibroblastic epithelial cell line) | 96 | 44.67 ± 0.51 | 7.38 ± 0.12 | 3.75 ± 0.15 |
| 97 | 17.99 ± 1.08 | 5.55 ± 0.22 | 2.03 ± 0.04 |
| Cisplatin | 13.22 ± 0.89 | 3.99 ± 0.22 | 1.18 ± 0.13 |
Table 46.
Total Growth Inhibition (TGI) [μM] values of the copper(II) complexes 98–100.
Table 46.
Total Growth Inhibition (TGI) [μM] values of the copper(II) complexes 98–100.
| Cell Line | TGI [μM] |
|---|
| 98 | 99 | 100 | Doxorubicin |
|---|
| U251 (glioma) | 1.4 | <0.3 | 35.3 | 0.1 |
| UACC-62 (melanoma) | 5.1 | 7.8 | 51.2 | 1.4 |
| MCF-7 (breast cancer) | 15.4 | 46.4 | 217.0 | 46.0 |
| NCI-ADR/RES (multidrug resistant ovarian cancer) | 291.9 | 111.0 | 298.2 | 46.0 |
| 786–0 (renal cancer) | 291.9 | 47.9 | 298.2 | 0.4 |
| NCI-H460 (lung, non-small cancer cells) | 7.9 | 7.1 | 64.8 | 46.0 |
| OVCAR-3 (ovarian cancer) | 3.3 | 4.7 | 75.9 | 26.5 |
| HT29 (colon cancer) | 6.3 | 4.9 | 129.3 | 46.0 |
| K562 (leukemia) | 35.4 | 32.5 | 298.2 | 11.6 |
| HaCat (immortal keratinocyte, non-tumor human line) | 14.0 | 46.1 | 298.2 | 46.0 |
Table 47.
Cytotoxicity of copper(II) complexes 101–105 towards the SH-SY5Y, U87-MG, U373-MG and MRC-5 cell lines.
Table 47.
Cytotoxicity of copper(II) complexes 101–105 towards the SH-SY5Y, U87-MG, U373-MG and MRC-5 cell lines.
| Compound | IC50 [μM] |
|---|
SH-SY5Y
(Neuroblastoma) | U87-MG
(Glioblastoma) | U373-MG
(Glioblastoma) | MRC-5
(Mortal Human MRC5 Fibroblasts) |
|---|
| 101 | 2.63 ± 0.40 | 20.09 ± 0.05 | 14.42 ± 0.96 | 16.85 ± 0.57 |
| 102 | 2.85 ± 0.43 | 11.83 ± 1.07 | 12.92 ± 1.05 | 19.94 ± 1.72 |
| 103 | 9.06 ± 1.36 | 26.73 ± 5.26 | 17.61 ± 2.27 | 25.39 ± 1.32 |
| 104 | 23.55 ± 3.53 | 22.25 ± 0.89 | 19.78 ± 2.03 | 24.91 ± 1.26 |
| 105 | 5.57 ± 0.84 | 25.92 ± 1.25 | 22.52 ± 1.35 | 24.92 ± 2.28 |
| Cisplatin | 27.50 ± 4.30 | >100 | ~150 | – |
Table 48.
IC50 values of 106a–b complexes, ligands, cisplatin and doxorubicin against B16-F10 melanoma cell line.
Table 48.
IC50 values of 106a–b complexes, ligands, cisplatin and doxorubicin against B16-F10 melanoma cell line.
| Compound | IC50 [µM]
B16-F10 Cell Line |
|---|
| 12 h | 24 h | 36 h | 48 h |
|---|
| 106a | 14.4 ± 2.4 | 13.0 ± 3.7 | 16.5 ± 2.4 | 11.6 ± 1.9 |
| Ligand of 106a | 256.1 ± 21.3 | 152.9 ± 13.2 | 62.9 ± 5.2 | 41.7 ± 2.0 |
| 106b | 32.6 ± 3.1 | 22.8 ± 2.0 | 19.5 ± 1.9 | 18.4 ± 1.7 |
| Ligand of 106b | 265.0 ± 22.1 | 112.5 ± 9.0 | 58.2 ± 4.1 | 55.9 ± 3.4 |
| Cisplatin | 132.9 ± 10.5 | 58.2 ± 2.3 | 38.4 ± 3.2 | 36.7 ± 2.1 |
| Doxorubicin | 288.0 ± 10.0 | 10.1 ± 2.1 | 3.1 ± 1.3 | 2.2 ± 1.1 |
Table 49.
Anticancer activity of 107.
Table 49.
Anticancer activity of 107.
| Compound | IC50 (µg/mL) |
|---|
| MCF-7 | CaCo-2 |
|---|
| 107 | 86.2 ± 0.64 | 23.84 ± 0.33 |
| Sulfaclozine (SCZ) | 215.24 ± 0.67 | 97.6 ± 0.45 |
Table 50.
Enzyme inhibition for 108 and reference compounds (FTES = (4-sulfamoylphenylethyl-thioureido)-fluorescein, ABS = 4-(2-aminoethyl)-benzenesulfonamide).
Table 50.
Enzyme inhibition for 108 and reference compounds (FTES = (4-sulfamoylphenylethyl-thioureido)-fluorescein, ABS = 4-(2-aminoethyl)-benzenesulfonamide).
| Compound | Ki (nM) |
|---|
| CA IX | CA XII |
|---|
| Ligand | 62 | 73 |
| 108 | 9.0 | 6.1 |
| ABS | 33 | 3.2 |
| Acetazolamide (AZA) | 25 | 5.7 |
| FTES | 24 | - |
Table 51.
Anticancer activity of 109.
Table 51.
Anticancer activity of 109.
| Compound | IC50 (µg/mL) |
|---|
| A-549 (Lung Cancer) | PANC-1 (Pancreatic Cancer) |
|---|
| 109 | 12.26 ± 0.73 | 13.43 ± 0.81 |
| Ligand | 466.25 ± 17.52 | 360.61 ± 14.63 |
| Vinblastine sulfate | 24.6 ± 0.65 | 4.68 ± 0.65 |
Table 52.
Anticancer activity of 110.
Table 52.
Anticancer activity of 110.
| Compound | IC50 (µM) |
|---|
| HepG-2 (Hepatocellular Carcinoma) | MCF-7 (Breast Cancer) |
|---|
| Ligand | >1236.30 | >1236.30 |
| 110 | 357.90 | 179.88 |
| Cisplatin | 40.76 | - |
| 5-fluorouracil | - | 215.26 |
Table 53.
Anticancer activity of 111a–e (5-FU = 5-fluorouracil).
Table 53.
Anticancer activity of 111a–e (5-FU = 5-fluorouracil).
Cell Line
IC50 [µM] | Compound |
|---|
| 111a | 111b | 111c | 111d | 111e | 5-FU |
|---|
| Cancer cells |
| DLD-1 | 47.1 ± 4.7 | 42.7 ± 3.3 | 65.2 ± 2.5 | 58.4 ± 5.8 | 58.8 ± 3.9 | 50.2 ± 21.0 |
| HeLa | 5.0 ± 0.4 | 2.1 ± 0.1 | 63.9 ± 4.3 | 115.8 ± 9.2 | 15.2 ± 1.0 | 19.2 ± 1.2 |
| MDA-MB-231 | 116.8 ± 14.2 | 50.0 ± 2.4 | 48.3 ± 2.5 | 205.5 ± 25.1 | 26.0 ± 2.5 | 22.4 ± 2.5 |
| HT-29 | 198.9 ± 24.3 | 94.9 ± 9.4 | 205.1 ± 20.3 | 198.7 ± 22.5 | 84.4 ± 8.4 | 24.2 ± 2.4 |
| ECC-1 | 26.2 ± 2.6 | 39.5 ± 2.5 | 362.1 ± 38.1 | 307.5 ± 34.2 | 97.6 ± 9.7 | 30.6 ± 3.5 |
| DU-145 | 104.9 ± 13.5 | 116.4 ± 14.6 | 58.3 ± 6.4 | 160.5 ± 18.0 | 32.4 ± 3.2 | 37.3 ± 5.8 |
| PC-3 | 102.0 ± 10.2 | 65.3 ± 8.5 | 196.4 ± 22.6 | 296.8 ± 32.4 | 79.2 ± 8.5 | 45.5 ± 4.5 |
| Normal cells |
| HEK-239 | 68.8 ± 8.7 | 159.2 ± 19.4 | 134.7 ± 15.6 | 196.8 ± 23.5 | 36.3 ± 3.6 | 65.3 ± 8.6 |
| PNT-1A | 76.5 ± 8.5 | 95.1 ± 11.1 | 119.5 ± 13.5 | 125.1 ± 14.8 | 46.4 ± 4.6 | 142.3 ± 18.6 |
| ARPE-19 | 119.0 ± 13.5 | 131.7 ± 15.6 | >300 | 105.2 ± 13.5 | 84.3 ± 8.4 | 75.3 ± 7.5 |
Table 54.
Antitumor activity of silver(I) complexes with saccharin 112–118.
Table 54.
Antitumor activity of silver(I) complexes with saccharin 112–118.
| Compound | IC50 [µM] |
|---|
| A549 (Lung Carcinoma) | MCF-7 (Breast Adenocarcinoma) | WI-38 (Fibroblast) |
|---|
| 112 | 1.18 ± 0.44 | 1.14 ± 0.19 | 1.41 ± 0.37 |
| 113 | 0.84 ± 0.25 | 0.82 ± 0.14 | 0.77 ± 0.25 |
| 114 | 1.01 ± 0.12 | 0.88 ± 0.16 | 0.74 ± 0.28 |
| 115 | 1.79 ± 0.33 | 3.13 ± 1.55 | 1.31 ± 0.39 |
| 116 | 2.58 ± 0.83 | 2.32 ± 1.00 | 9.54 ± 2.40 |
| 117 | 9.11 ± 2.32 | 3.18 ± 1.01 | 2.61 ± 1.16 |
| 118 | 86.4 ± 4.75 | 5.30 ± 1.61 | 10.78 ± 2.22 |
| AgNO3 | 21.51 ± 3.63 | 2.62 ± 1.44 | 8.14 ± 1.88 |
| Cisplatin | 10.92 ± 1.81 | 4.58 ± 1.25 | 2.62 ± 1.04 |
Table 55.
Antitumor activity of silver(I) complexes 119a–e.
Table 55.
Antitumor activity of silver(I) complexes 119a–e.
Cell Line
IC50 [µM] | Compound |
|---|
| 119a | 119b | 119c | 119d | 119e | 5-FU |
|---|
| Cancer cells |
| DLD-1 | 279.3 ± 12.9 | 31.6 ± 3.2 | 3.3 ± 0.3 | 173.3 ± 10.3 | 110.7 ± 9.0 | 50.2 ± 21.0 |
| HeLa | >300 | 2.8 ± 0.1 | 3.4 ± 0.2 | 139.3 ± 28 | 9.6 ± 0.6 | 19.2 ± 1.2 |
| MDA-MB-231 | 96.8 ± 9.6 | 30.3 ± 3.0 | 9.8 ± 0.9 | >300 | 148.4 ± 19.5 | 22.4 ± 2.5 |
| HT-29 | 185.7 ± 16.5 | 24.9 ± 2.5 | 10.1 ± 3.1 | 240.7 ± 28.5 | 161.6 ± 16.1 | 24.2 ± 2.4 |
| ECC-1 | 207.0 ± 25.6 | 29.1 ± 3.0 | 16.2 ± 1.6 | 103.6 ± 10.3 | 135.9 ± 13.5 | 30.6 ± 3.5 |
| DU-145 | 136.7 ± 16.5 | 18.6 ± 1.8 | 4.8 ± 0.4 | 236.7 ± 28.5 | 100.3 ± 10.1 | 37.3 ± 5.8 |
| PC-3 | 612.0 ± 61.2 | 28.2 ± 3.5 | 5.1 ± 0.5 | 136.6 ± 15.8 | 111.7 ± 13.4 | 45.5 ± 4.5 |
| Normal cells |
| HEK-239 | >300 | 17.8 ± 1.7 | 9.9 ± 0.9 | 5.5 ± 0.6 | 30.5 ± 4.5 | 65.3 ± 8.6 |
| PNT-1A | 209.7 ± 20.9 | 17.5 ± 17.5 | 9.2 ± 0.9 | 139.1 ± 16.5 | 110.8 ± 11.0 | 142.3 ± 18.6 |
| ARPE-19 | >300 | 22.0 ± 10.2 | 9.5 ± 0.9 | 284.8 ± 30.5 | 109.4 ± 11.0 | 75.3 ± 7.5 |
Table 56.
Antitumor activity of 120–124.
Table 56.
Antitumor activity of 120–124.
| Compound | IC50 [µM] |
|---|
| A2780/S | A2780/R |
|---|
| 120 | 48.2 ± 0.1 | 54.0 ± 2.4 |
| 121a | 52.7 ± 2.4 | 44.2 ± 3.2 |
| 121b | 52.4 ± 2.2 | 40.3 ± 3.7 |
| 122 | 8.5 ± 2.4 | 15.8 ± 0.2 |
| 123 | 23.6 ± 1.5 | 40.8 ± 1.8 |
| 124 | 14.9 ± 1.4 | 14.3 ± 0.9 |
| Cisplatin | 2.1 ± 0.3 | 16.1 ± 0.5 |
Table 57.
Anticancer activity of 126 against HepG-2 and HCT-116 cell lines.
Table 57.
Anticancer activity of 126 against HepG-2 and HCT-116 cell lines.
| Compound | IC50 [μg] |
|---|
| HepG-2 (Hepatocellular Carcinoma) | HCT-116 (Colon Cancer) |
|---|
| 126 | 2.77 | 3.41 |
| Doxorubicin | 0.467 | 0.471 |
Table 58.
Antitumor activity of 127a–b and cisplatin, used as a reference compound.
Table 58.
Antitumor activity of 127a–b and cisplatin, used as a reference compound.
| Compound | GI50 [µM] |
|---|
| HBL-100 | T-47D | HeLa | SW1573 | A549 | WiDr |
|---|
| 127a | 6.6 ± 1.8 | 24.0 ± 5.7 | 3.8 ± 0.8 | 17.0 ± 2.0 | 32 ± 2.1 | 26.0 ± 1.1 |
| 127b | 3.8 ± 0.3 | 6.5 ± 0.7 | 3.1 ± 0.5 | 5.2 ± 0.15 | 4.7 ± 1.1 | 9.8 ± 1.2 |
| Cisplatin | 1.9 ± 0.16 | 15 ± 2.3 | 2.0 ± 0.32 | 3.0 ± 0.37 | 1.9 ± 0.64 | 26 ± 5.3 |
Table 59.
Antitumor activity of 128–134 against P388 cell line.
Table 59.
Antitumor activity of 128–134 against P388 cell line.
| Compound | IC50 [µM] |
|---|
| P388 Cell Line |
|---|
| 128a | 0.30 |
| 128b | >80.13 |
| 129 | 52.89 |
| 130 | 6.68 |
| 131 | 0.22 |
| 132a | 0.33 |
| 132b | 1.58 |
| 133 | 4.35 |
| 134 | 1.09 |
| Cisplatin | 8.15 |
Table 60.
Antitumor activity of saccharin complexes with zinc, cadmium and mercury (135 and 136a–b) after 48h.
Table 60.
Antitumor activity of saccharin complexes with zinc, cadmium and mercury (135 and 136a–b) after 48h.
| Compound | IC50 [µM] |
|---|
| A549 | MCF-7 | HT29 | MCF10A |
|---|
| 135 | 1.74 ± 0.06 | 3.15 ± 0.10 | 15.40 ± 0.73 | 7.94 ± 0.18 |
| 136a | 36.91 ± 0.47 | 23.01 ± 1.28 | 36.96 ± 0.75 | 26.29 ± 1.25 |
| 136b | 80.06 ± 1.35 | 8.61 ± 0.98 | 24.27 ± 1.36 | 42.76 ± 1.43 |
| Cisplatin | 5.21 ± 0.18 | 10.57 ± 0.39 | 11.25 ± 1.35 | 13.80 ± 2.36 |
Table 61.
IC50 values of complexes 137a–d.
Table 61.
IC50 values of complexes 137a–d.
| Compound | IC50 [µM] |
|---|
| H-157 (Lung Cancer) | BHK-21 (Hamster Kidney Fibroblasts) |
|---|
| 137a | 1.82 ± 0.11 | 2.19 ± 0.15 |
| 137b | 2.48 ± 0.13 | 3.01 ± 1.43 |
| 137c | 3.17 ± 0.28 | 2.93 ± 0.17 |
| 137d | 1.97 ± 0.17 | 2.74 ± 0.12 |
| Vincristine | 1.08 ± 0.09 | 1.08 ± 0.09 |
Table 62.
Anticancer activity of 79 against MCF-7 and CaCo-2 cell lines.
Table 62.
Anticancer activity of 79 against MCF-7 and CaCo-2 cell lines.
| Compound | IC50 (µg/mL) |
|---|
| MCF-7 | CaCo-2 |
|---|
| Sulfaclozine | 215.24 ± 0.67 | 97.6 ± 0.45 |
| 138 | 111.91 ± 0.36 | 198.44 ± 0.25 |
Table 63.
Anticancer activity of 145–146.
Table 63.
Anticancer activity of 145–146.
| Compound | IC50 [μg] |
|---|
| Liver Cancer Cells | Colon Cancer Cells |
|---|
| 145 | 0.54 | 1.54 |
| 146 | 0.94 | 0.67 |
| Doxorubicin | 0.4 | 0.69 |
Table 64.
Anticancer activity of 149–150.
Table 64.
Anticancer activity of 149–150.
| Compound | Cell Viability After Treatment (%) |
|---|
| MCF-7 (Breast Cancer) | HCEC (Human Corneal Epithelial Cells) |
|---|
| 149 | 70.89 | 26.79 |
| 150 | 100 | 25.72 |
| Ligand | 100 | 22.97 |
Table 65.
Antitumor activity of 151, carbimazole, 6-mercaptopurine and sulfaclozine.
Table 65.
Antitumor activity of 151, carbimazole, 6-mercaptopurine and sulfaclozine.
| Compound | IC50 [µg/mL] |
|---|
| Caco-2 (Colorectal Adenocarcinoma) |
|---|
| 151 | 42.15 |
| Carbimazole | 103.477 |
| 6-mercaptopurine | 98.79 |
| Sulfaclozine | 97.6 |
