1. Introduction
Neuroleptics are a chemically diverse group of heterocyclic compounds containing a nitrogen atom. Classical neuroleptics consist of phenothiazine, thioxanthene, dibenzoxepine, dihydroindole or a benzamide structure [
1] of phenothiazine and thioxanthene derivatives. They influence the central nervous system. Some drugs such as fluphenazine, triflupromazine, flupentixol and zuclopenthixol can be distinguished among them. Fluphenazine is a psychotropic drug that belongs to the group of first-generation typical antipsychotic agents [
2]. It is a phenothiazine derivative that has a trifluoromethyl group connected to one of the benzene and piperazine rings with a 2-hydroxyethyl group as a substituent. It is present in pharmaceutical preparations in the form of fluphenazine hexanoate and fluphenazine decanoate. It blocks dopamine receptors, specifically D
1 and D
2 receptors in the brain, and is used in the treatment of psychoses, schizophrenia and bipolar disorder and in long-term neuroleptic therapy [
1]. Fluphenazine, as a drug, can be administered in the form of pills or intramuscular injections. The intramuscular injection can contain short-acting or long-acting forms of fluphenazine [
1,
2,
3,
4,
5]. Triflupromazine is an antipsychotic drug. It is the phenothiazine derivative that has the trifluoromethyl group connected to one of the benzene rings and a tertiary amine as the substituent. It also blocks dopamine receptors in the brain. It binds 5-hydroxytryptamine receptor 2B (5-HT
2B), muscarinic acetylcholine receptor M
1 and muscarinic acetylcholine receptor M
2. It is used to treat psychoses by controlling aggressive behavior that occurs during these episodes [
1,
6]. Additionally, they may also be applied to control vomiting, nausea and severe hiccups. Triflupromazine hydrochloride as a drug can be administered in the form of pills or injections [
1,
6,
7]. The next substance, trifluoperazine dihydrochloride, is a salt of another phenothiazine derivative. It is used to treat schizophrenia and anxiety in the form of tablets or an injectable solution.
Flupentixol is a psychotropic drug that belongs to the group of the first-generation typical antipsychotics [
1,
8]. It is a structural analog of fluphenazine. It is also a thioxanthene derivative that has a trifluoromethyl group connected to one of the benzene and piperazine rings with a 2-hydroxyethyl group as a substituent. Flupentixol occurs as a
trans-isomer and a
cis-isomer, but only the
cis-isomer is used as a component of drugs due to its pharmacological activity. It is mainly produced as flupentixol dihydrochloride and flupentixol decanoate. It blocks various dopamine receptors. It also blocks histamine, adrenaline and serotonin receptors. It is applied to treat schizophrenia, psychoses, apathy and neurosis and also as an antidepressant. Flupentixol as a drug can be administered in the form of pills or a long-acting intramuscular injection [
1,
7,
8]. Zuclopenthixol is a first-generation typical antipsychotic [
1,
9]. It is a thioxanthene derivative that has a chlorine connected to one of the benzene and piperazine rings with a 2-hydroxyethyl group as a substituent. It is the
cis-isomer of clopenthixol. It is present in pharmaceutical formulations such as zuclopenthixol dihydrochloride, zuclopenthixol acetate and zuclopenthixol decanoate [
1,
9]. It blocks dopamine receptors in the brain and also blocks histamine, adrenaline and serotonin receptors. It acts against psychoses and schizophrenia. It has antianxiety activity. Zuclopenthixol as the drug can be administered in the form of pills or a long-acting intramuscular injection [
1,
10,
11,
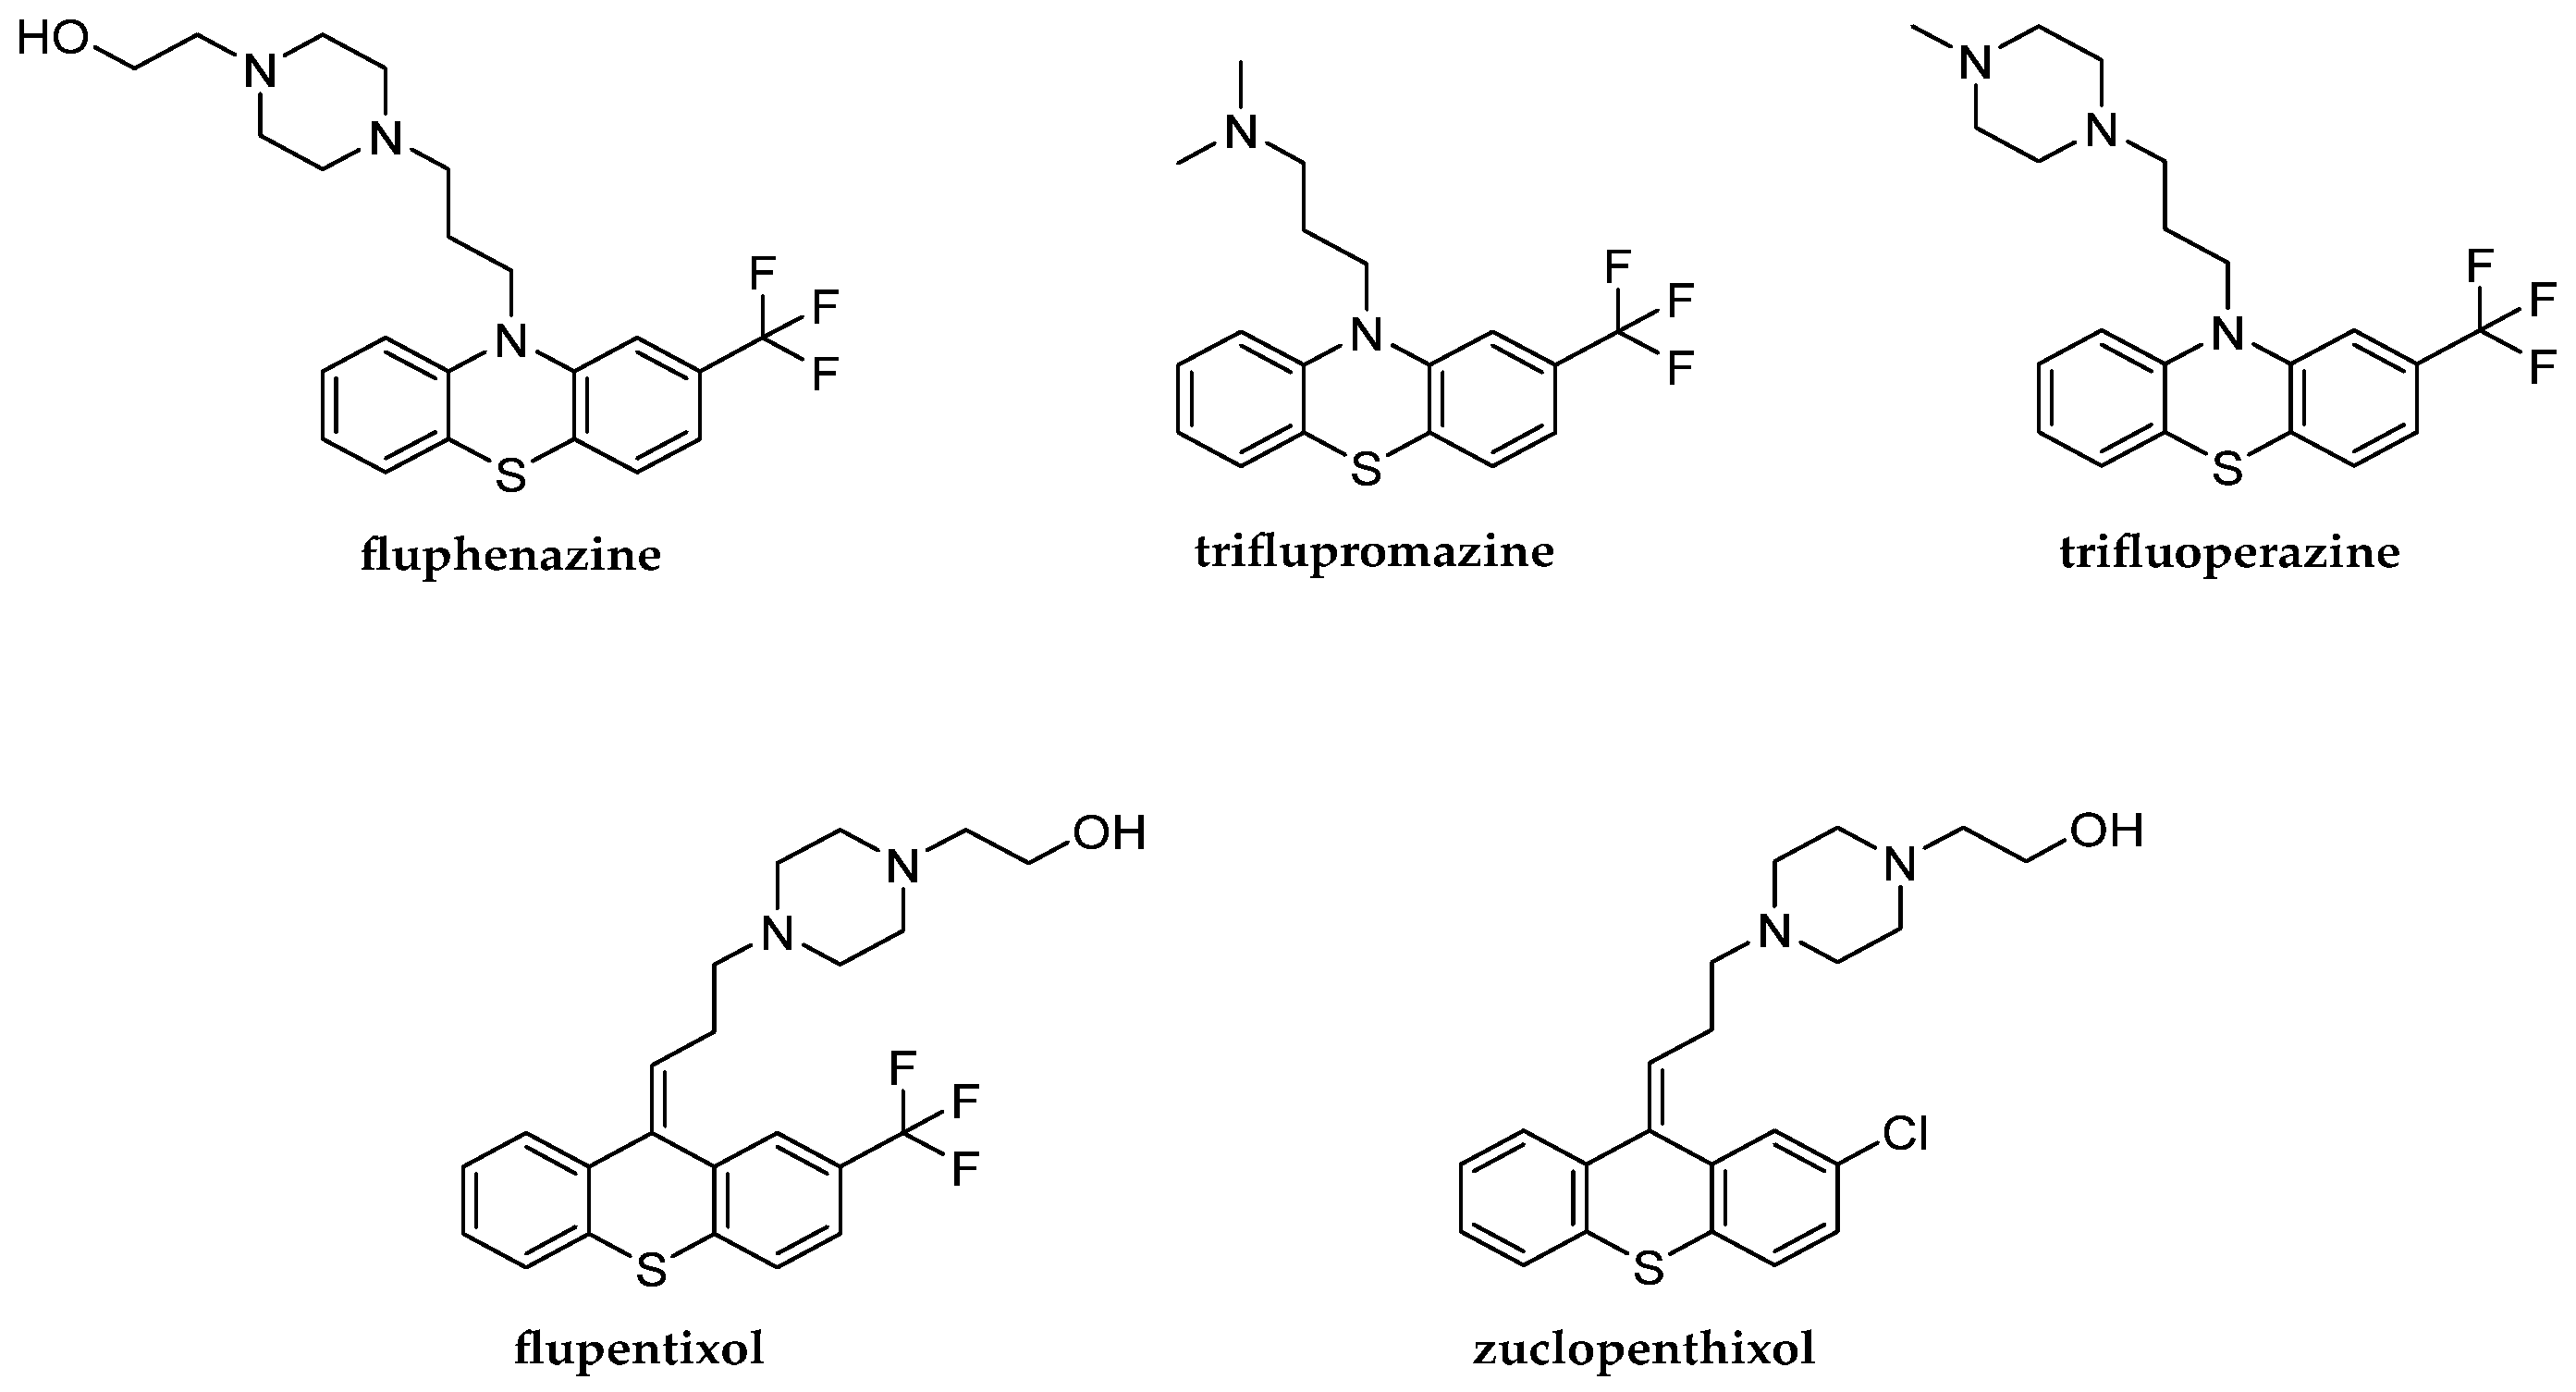
12]. The chemical structures of the tested compounds are shown in
Figure 1.
Currently available neuroleptics have certain limitations. The long-term use of neuroleptics, including those presented above, may cause many adverse effects such as gynecomastia, involuntary movement, metabolic, weight gain and impotence [
1]. Therefore, rapid and efficient methods for analyzing parameters important for determining the ADMET profile (i.e., absorption, distribution, metabolism, elimination and toxicity) of known neuroleptic drugs or new candidates for antipsychotic medications are meaningful. Recent research shows that lipophilicity is a significant factor in determining the bioavailability, pharmacokinetics and toxicological profile of molecules. It is one of the key properties to address in drug design and development [
13,
14].
Some studies have described a strong correlation between lipophilicity parameters and the bioactivity, pharmacokinetics and pharmacodynamic properties of drug substances [
15,
16,
17,
18,
19,
20,
21,
22,
23]. Generally, there are two methods dedicated to estimating the lipophilicity parameter (logP), i.e., calculation “in silico” and experimental methods. Among the experimental procedures, reverse-phase thin-layer chromatography (RP-TLC) is the simplest chromatographic technique possible to use for the determination of the experimental value of the lipophilicity factor of organic molecules, including antipsychotic agents. The chromatographic parameter R
MW can be interpreted as a logP value. A non-polar stationary phase, such as RP-18 or the less hydrophobic RP-8, and various organic modifiers like n-octanol, 1,4-dioxane, acetonitrile, methanol, acetone and tetrahydrofuran as mobile phase components are used for lipophilicity measurements.
The aim of the work was to assess and compare the lipophilicity parameters of five neuroleptics—fluphenazine, triflupromazine, trifluoperazine, flupentixol and zuclopenthixol—obtained by means of both computational and chromatographic methods. The lipophilicity parameter (R
MW) values were determined using various chromatographic systems for RP-TLC and compared with theoretical logP values predicted using computational algorithms (AlogPs, ilogP, XlogP3, WlogP, MlogP, milogP, logPsilicos-it, logPconsensus, logP
chemaxon and logP
ACD/Labs) [
24,
25,
26,
27]. Furthermore, this is the first time that selected topological indices for the studied molecules were calculated without using ready-made programs. The newly calculated topological indices for these compounds based on the distance matrix and the adjacency matrix, respectively, such as Pyka (
A,
0B,
1B), Wiener (
W), Rouvray–Crafford (
R), Gutman (
M,
Mν) and Randić (
0χ,
1χ,
0χν,
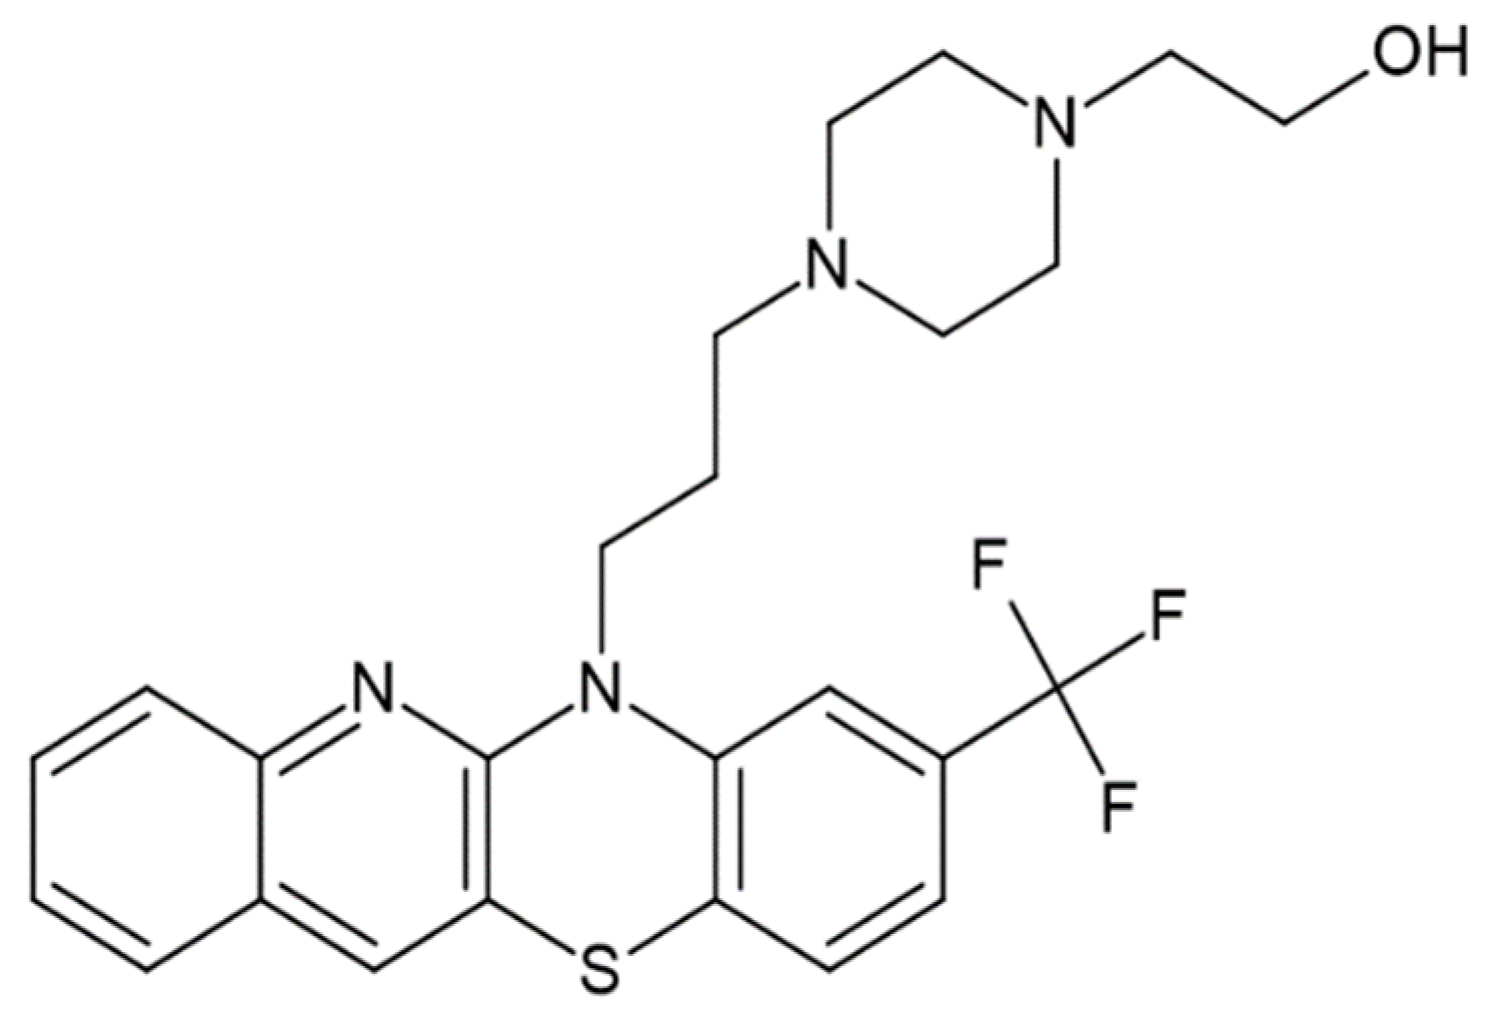
1χν), were discussed in terms of their correlation with lipophilicity factors and other ADMET factors. The usefulness of the hybrid method, i.e., experiments and calculations for predicting key parameters for ADMET, including lipophilicity, was evaluated and discussed for the five tested compounds known as active substances and for designing their new derivatives containing, for example, a quinoline structure, as shown in
Figure 2.
2. Results and Discussion
During the first step of our study, we tried to use in silico methods available in the form of both ChemSketch and Molinspiration Cheminformatics software to predict selected physicochemical parameters of the studied compounds [
26,
27]. As shown in
Figure 1, the studied antipsychotic agents belong to known phenothiazine and thioxanthene derivatives, respectively. The structure of new proposed derivatives of these is shown in
Figure 2. An analysis of the selected physicochemical parameters of these substances, listed in
Table 1, indicates a similarity between the compounds under study except trifluoropromazine, which is characterized by lower values of all these parameters. This is probably due to a different structure, i.e., the presence of aliphatic substituents, compared to the other compounds studied. The results presented in
Table 1 confirm the suitability of applied in silico tools for rapid estimation of the main physicochemical properties of bioactive compounds containing a phenothiazine and thioxanthene structure, as well as the newly designed structure shown in
Figure 2, additionally containing a quinoline ring, as a potential new drug candidate. The highest similarity in the calculated parameters is observed for thioxanthene derivatives, i.e., flupentixol and zuclopenthixol. However, some differences, particularly about not only the molar mass values but also the TPSA parameter from 8.17 to 11.41, are visible for the members of the second group, i.e., phenothiazine derivatives such as fluphenazine, triflupromazine and trifluoperazine. TPSA is a strong factor in the study of drug transport properties such as intestinal absorption. The results, including the Topological Polar Surface Area of the new proposed molecule, show that the new derivative with a TPSA lower than 50 Å
2 is associated with better blood–brain barrier penetration, allowing it to reach the central nervous system (CNS). Furthermore, it is worth noting that the newly proposed molecule has a molecular weight of less than 500 Da, which also preliminarily confirms its potential oral bioavailability as a promising drug candidate. Considering the impact of lipophilicity on the ADMET characteristics of drugs and the lack of accurate data in the literature on the method of determining the experimental value of this parameter for selected of studied compounds and especially zuclopentixol, we used theoretical methods to determine the lipophilicity parameter as a decimal logarithm of the partition coefficient (logP) for zuclopentixol and other studied compounds i.e., fluphenazine, triflupromazine, trifluoperazine and flupentixol. In addition to this, the partition coefficient values were predicted for the new structure. The following in silico tools, such as DrugBank, SwissADME, ChemSketch and Molinspiration Cheminformatics, were successfully applied to determine the partition coefficient in the form of logP as AlogPs, ilogP, XlogP3, WlogP, MlogP, milogP, logPsilicos-it, logP
consensus, logP
chemaxon and logP
ACD/Labs [
24,
25,
26,
27]. All obtained partition coefficients and their average values (logP
avg) are summarized in
Table 2.
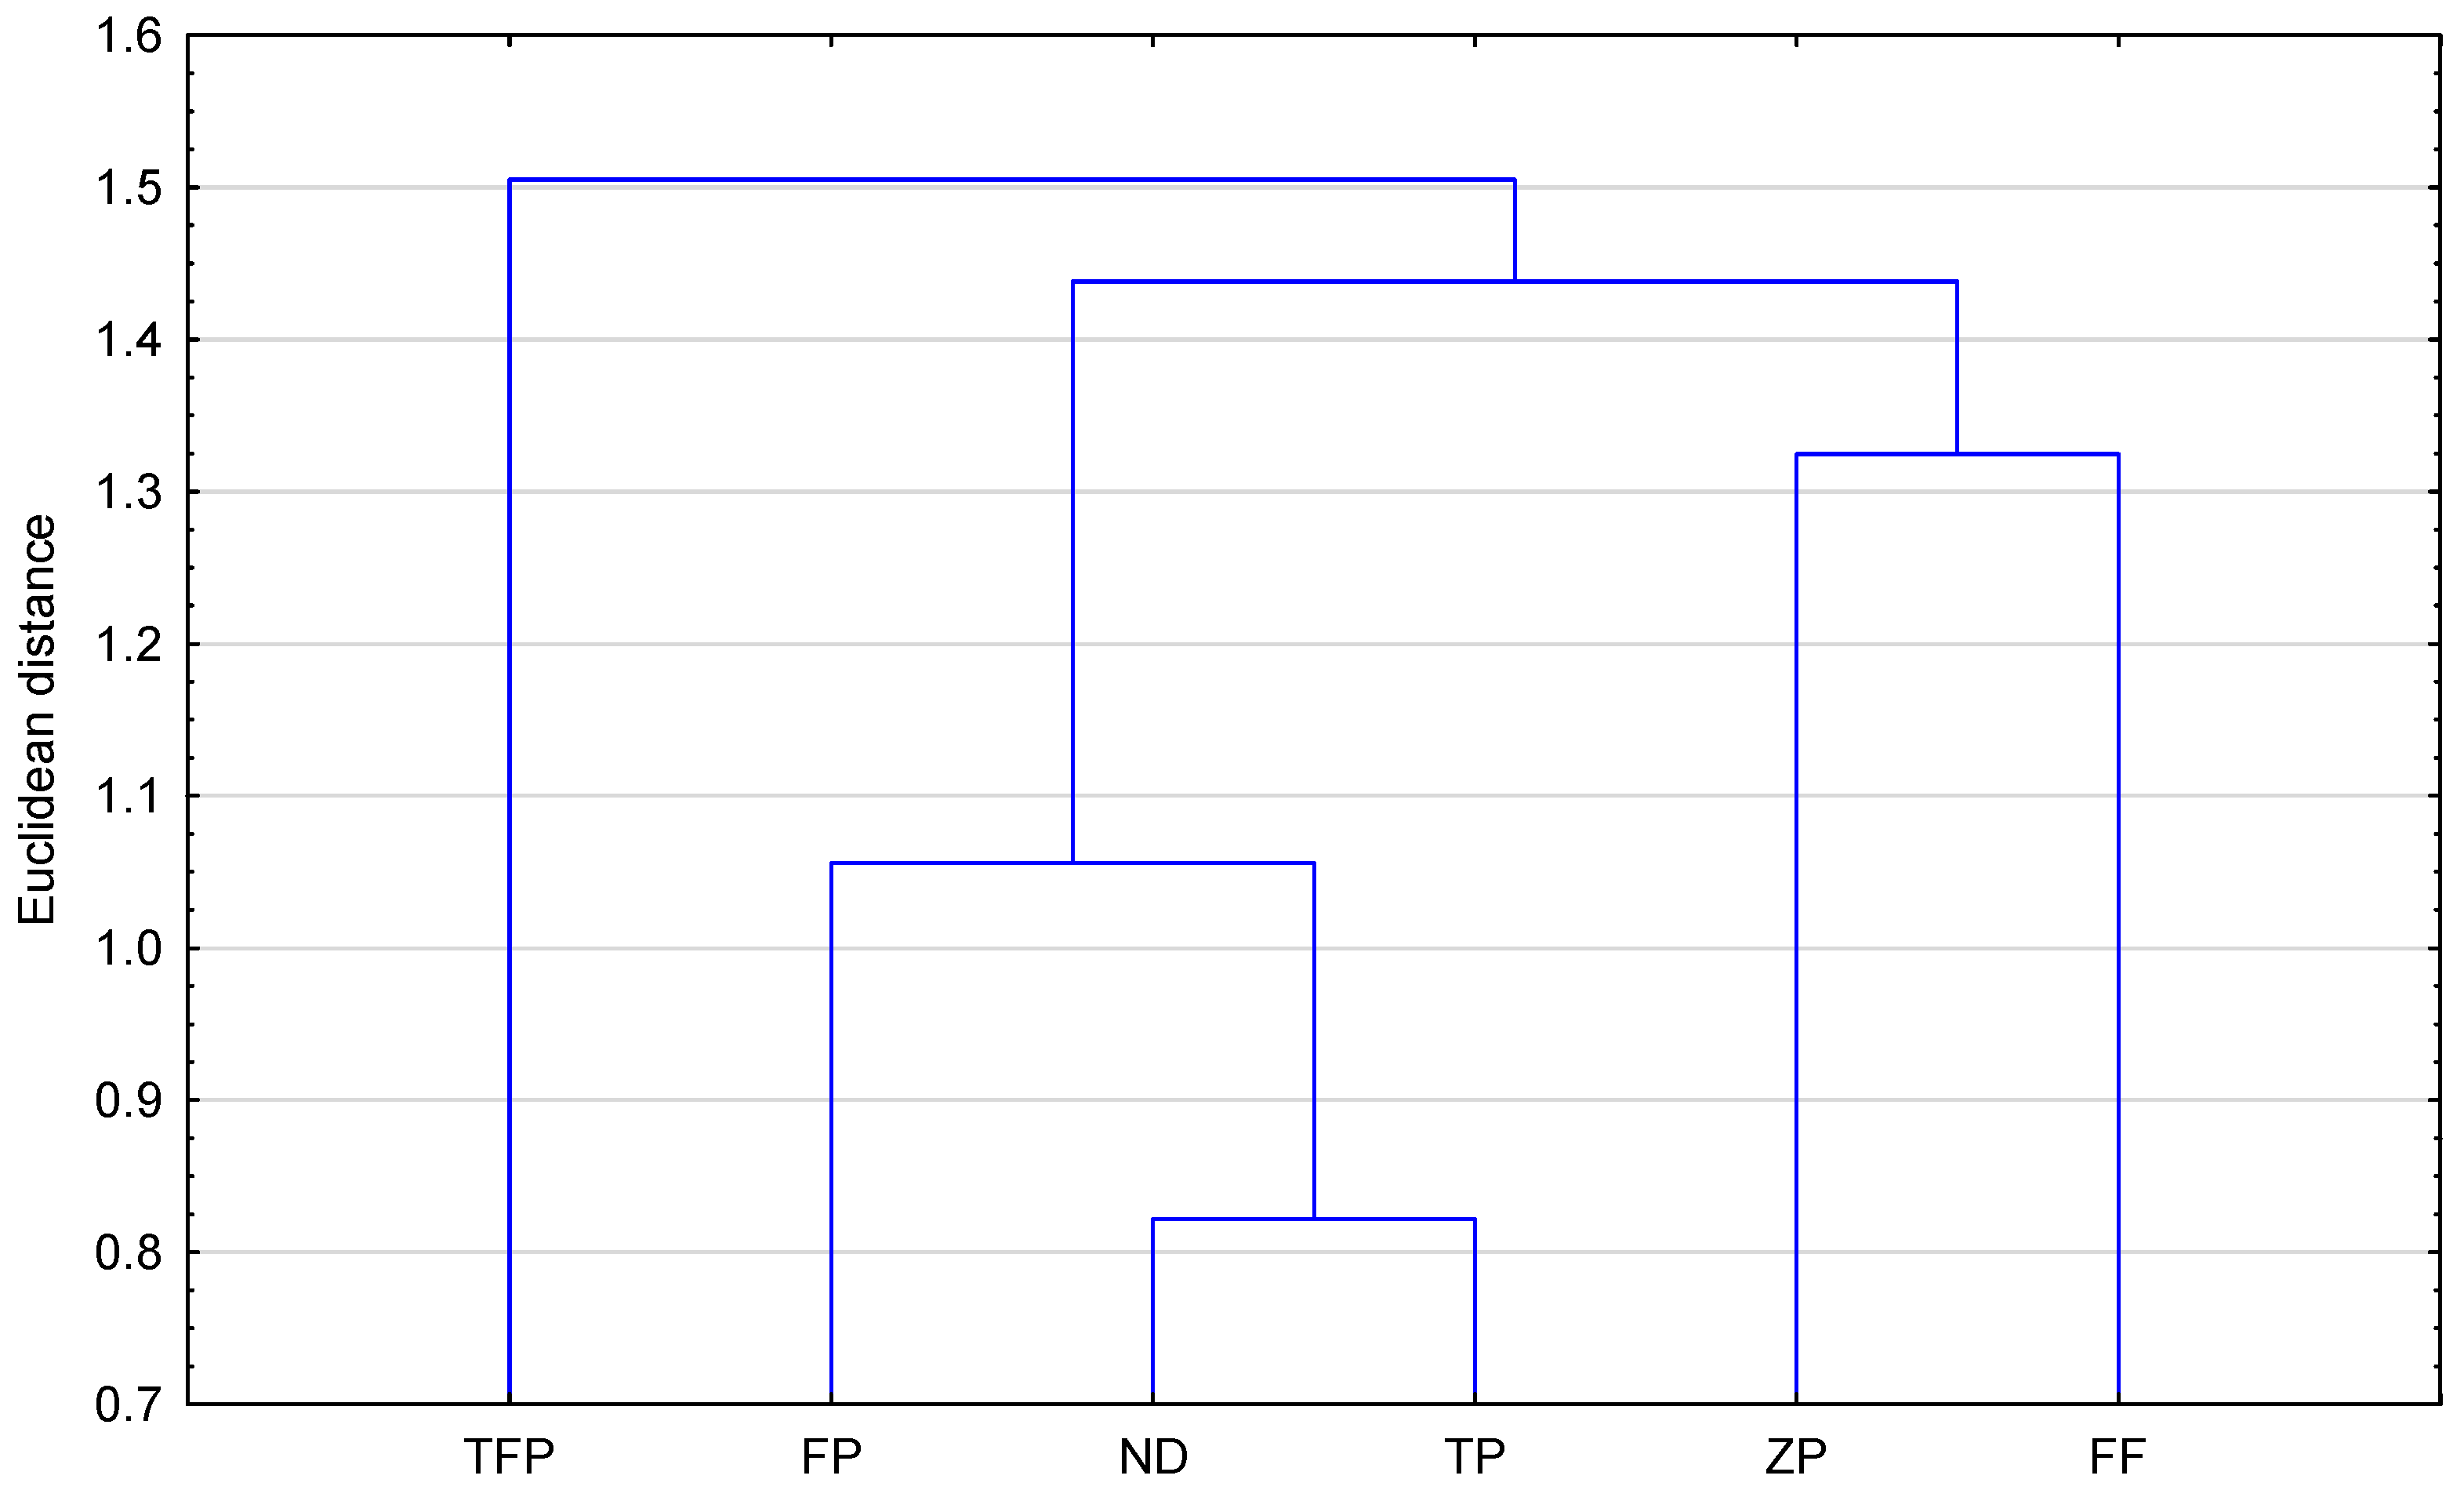
Figure 3 shows that the theoretically obtained partition coefficients (ilogP, XlogP3, WlogP, MlogP, logPsilicos-it, logPconsensus, logP
ACD/labs, milogP and their average values) allow grouping of the examined compounds into two visible clusters. The greatest similarity is between ND and TP, as well as FP. They form the first cluster in
Figure 3. The weakest similarity is observed with TFP. The second cluster is formed by ZP and FF. This confirms the early observations based on comparing of all logP
avg given in
Table 2. Further analysis of the obtained logP values allowed for designing a correlation matrix between all these results.
Table S1 (Supplementary Materials) presents the results of the correlation matrix prepared. As can be observed based on all calculated logP values, the best linear correlation (
p < 0.05) shows the following: MlogP and logP
Chemaxon (R = 0.9651), MlogP and logP
Consensus (R=0.9844), AlogPs and milogP (R = 0.9642), milogP and logP
Chemaxon (R = 0.9931). The average logP value (logP
avg.) shows good correlation with logP
Chemaxon (R = 0.9741), with WlogP (R = 0.9566) and with logP
Consensus (R = 0.9524), as well as with milogP (R=0.9731). Of all calculated logP values, the highest correlation with logP
exp (logP in n-octanol-water) is indicated for AlogPs (R = 0.9552) and XlogP3 (R=0.9984). Therefore, these correlations can be helpful in the future to determine the unknown logP
exp for ND and ZP.
Table 2 shows that among the ten calculation algorithms, the biggest similarity to logP
exp available in DrugBank for fluphenazine, flupentixol, trifluoperazine and flupromazine indicates XLOGP3. This fact confirms the highest predictive power of the proposed method. The lowest values of all are seen for ilogP (3.52 for triflupromazine to 4.10 for zuclopentixol and 4.41 for new derivative). It resulted in the most significant differences compared to logP
exp for these compounds. A difference between the logP values, from 3.52 (ilogP) to 6.03 (WlogP), can be noted in the case of triflupromazine. The highest differences with logP
exp generate the data obtained in the form of ilogP, MlogP and logP
silicos-it. This fact confirms the necessity of comparing the calculated parameters with the parameters obtained from experiments. Analysis of the average values of logP, i.e., logP
avg, calculated on the basis of partition coefficients predicted in silico using various calculation algorithms indicates that the lipophilicity of the studied neuroleptic agents increases in order: fluphenazine < zuclopentixol < flupentixol < trifluoperazine < tiflupromazine. The logP
avg. value obtained for the new derivative indicates the biggest similarity to flupentixol. The results of logP
avg of fluphenazine, flupentixol trifluoperazine and tiflupromazine are similar to those of logP
exp (logP in n-octanol-water) available in DrugBank for these four of the five studied compounds [
24]. This situation confirms that the applied calculation algorithms can be useful in rapid estimation of the lipophilic properties of tested molecules and related compounds. The obtained average value of logP for zuclopentixol shows that this compound possesses relatively lower lipophilicity, similar to fluphenazine. Similarity analysis of all studied compounds based on the selected logP calculated by using available algorithms such as ilogP, XlogP3, WlogP, MlogP, milogP, logPsilicos-it, logP
consensus, logP
ACD/Labs and logP
avg is presented as a dendrogram in
Figure 3.
When considering a substance as a drug or drug candidate, respectively, it is also essential to determine the blood–brain barrier permeability parameter (logBB) as well as logPS factor, which describes the penetration of the drug into the CNS (central nervous system). Therefore, in the next stage of our research, we proposed an in silico approach—the Percepta platform—to predict both parameters for the studied neuroleptic agents and the new derivative presented in
Figure 2. The results listed in
Table 3 show that for all tested molecules, logBB is in the range of 0.106 (new derivative) to 0.847 (trifluoperazine), and logPS > −2 (−1.940 ÷ −1.190). It means that not only the tested drugs but also newly proposed structures will penetrate the nervous system. The other parameters predicted by using the Percepta platform were the human skin permeability coefficient (logKp) and the Caco-2 cell permeability factor (Papp value, human colon adenoma cells). The results of logKp in
Table 3, ranging from −2.557 (for triflupromazine) to −2.755 (for zuclopentixol), confirm the relatively low skin permeability of all studied molecules, including the new one. However, the Papp values ranging from 53 × 10
−6 to 221 × 10
−6 cm/s indicate the good intestine permeability of the five examined drugs and their new derivative.
As is known, some neuroleptics can act as inhibitors of the P450 (CYP) enzyme family, especially CYP3A4 (found in the liver and the intestine) and CYP2D6 (which metabolizes about 25% of medications, including antidepressants and antipsychotics) and can affect their interaction with other drugs; thus, it is essential to develop a cheap, fast and accurate method including in silico models to assess the possible interaction of neuroleptics with cytochromes P450. This study evaluated the usefulness of in silico methods for determining the action of the compounds studied, including the newly proposed structure with the following cytochrome P450, such as CYP1A2, CYP2C9, CYP2C19, CYP2D6 and CYP3A4—as shown in
Table 3. The data listed in
Table 3 confirm that the Percepta platform is a cheap and rapid tool to estimate the interaction of all tested molecules, including the new one, with CYP450. All of the examined substances are CYP3A4 inhibitors. Almost all of them can interact with other enzymes, i.e., CYP1A2, CYP2C9, CYP2C19 and CYP2D6.
In the final stage of in silico research, various topological indices were calculated for the compounds under study (
Table 4). The values of these indices vary depending on the method used. As shown in
Table 4, the index R-Rouvray–Crafford has the highest value, ranging from 1984.308 to 5603.378, and the index
1B has the lowest (0.2492–0.3498). The Randić indices (
0χ,
1χ,
0χν,
1χν) are the closest to each other.
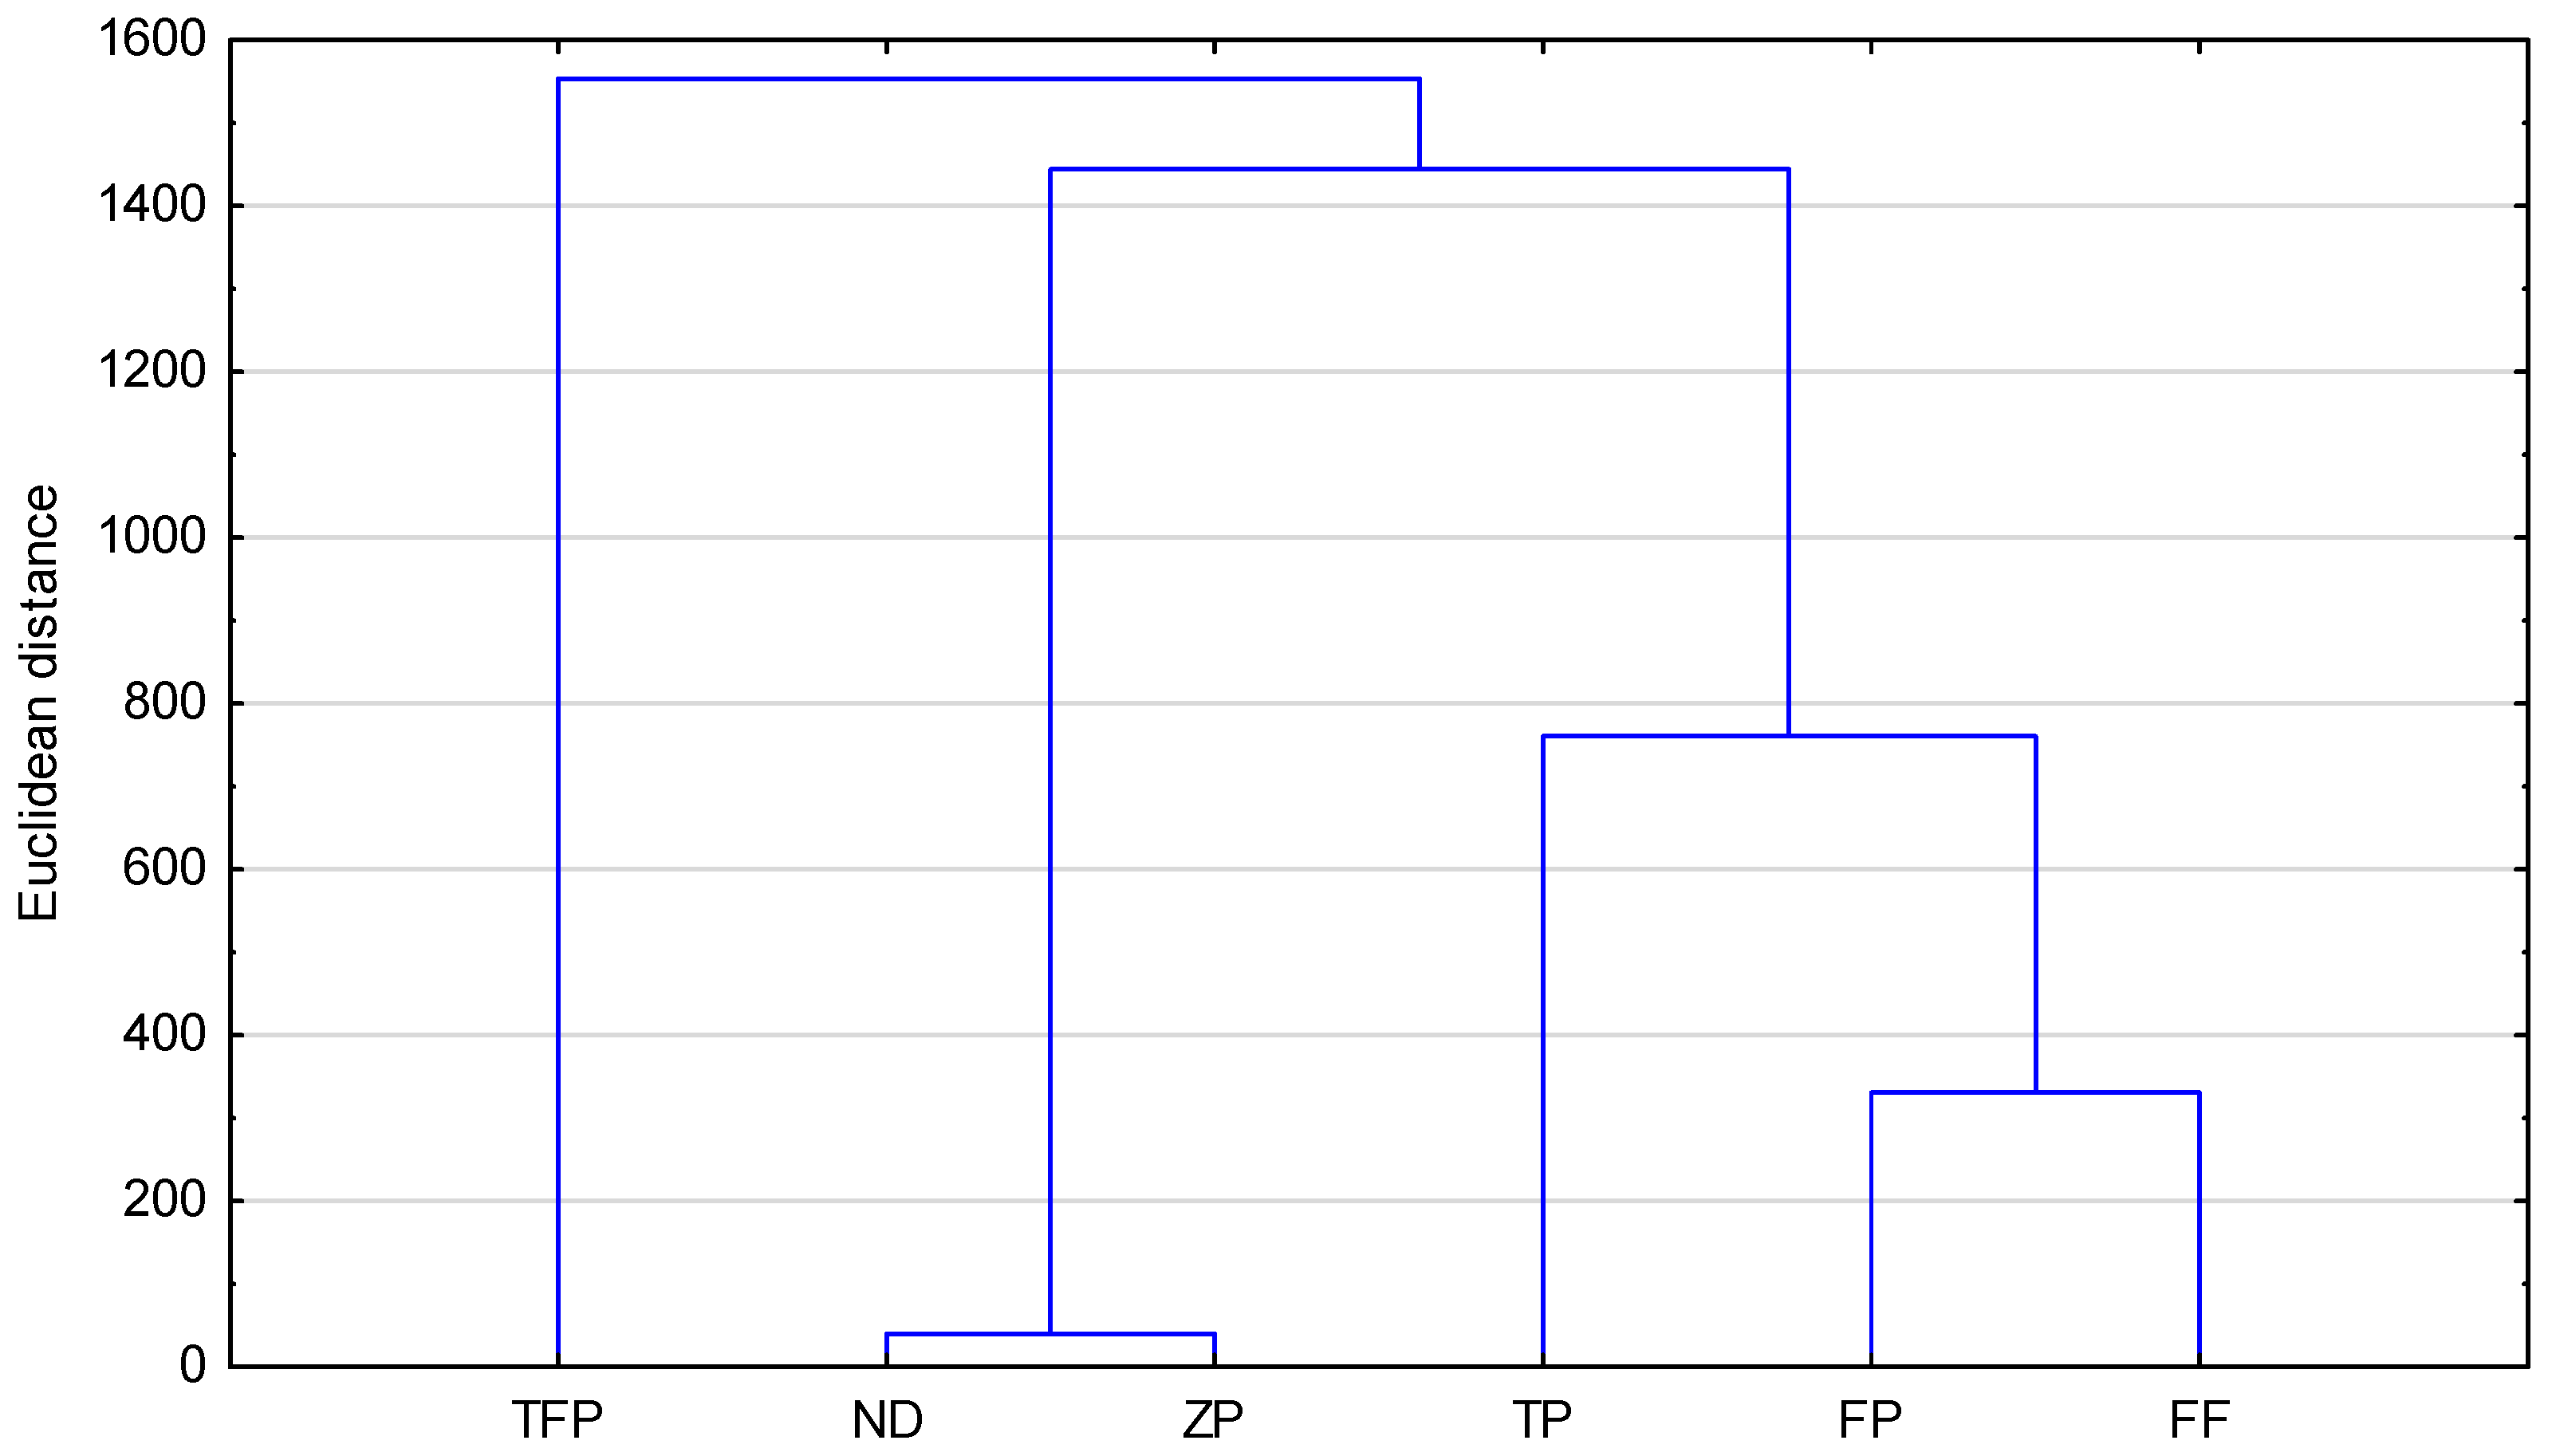
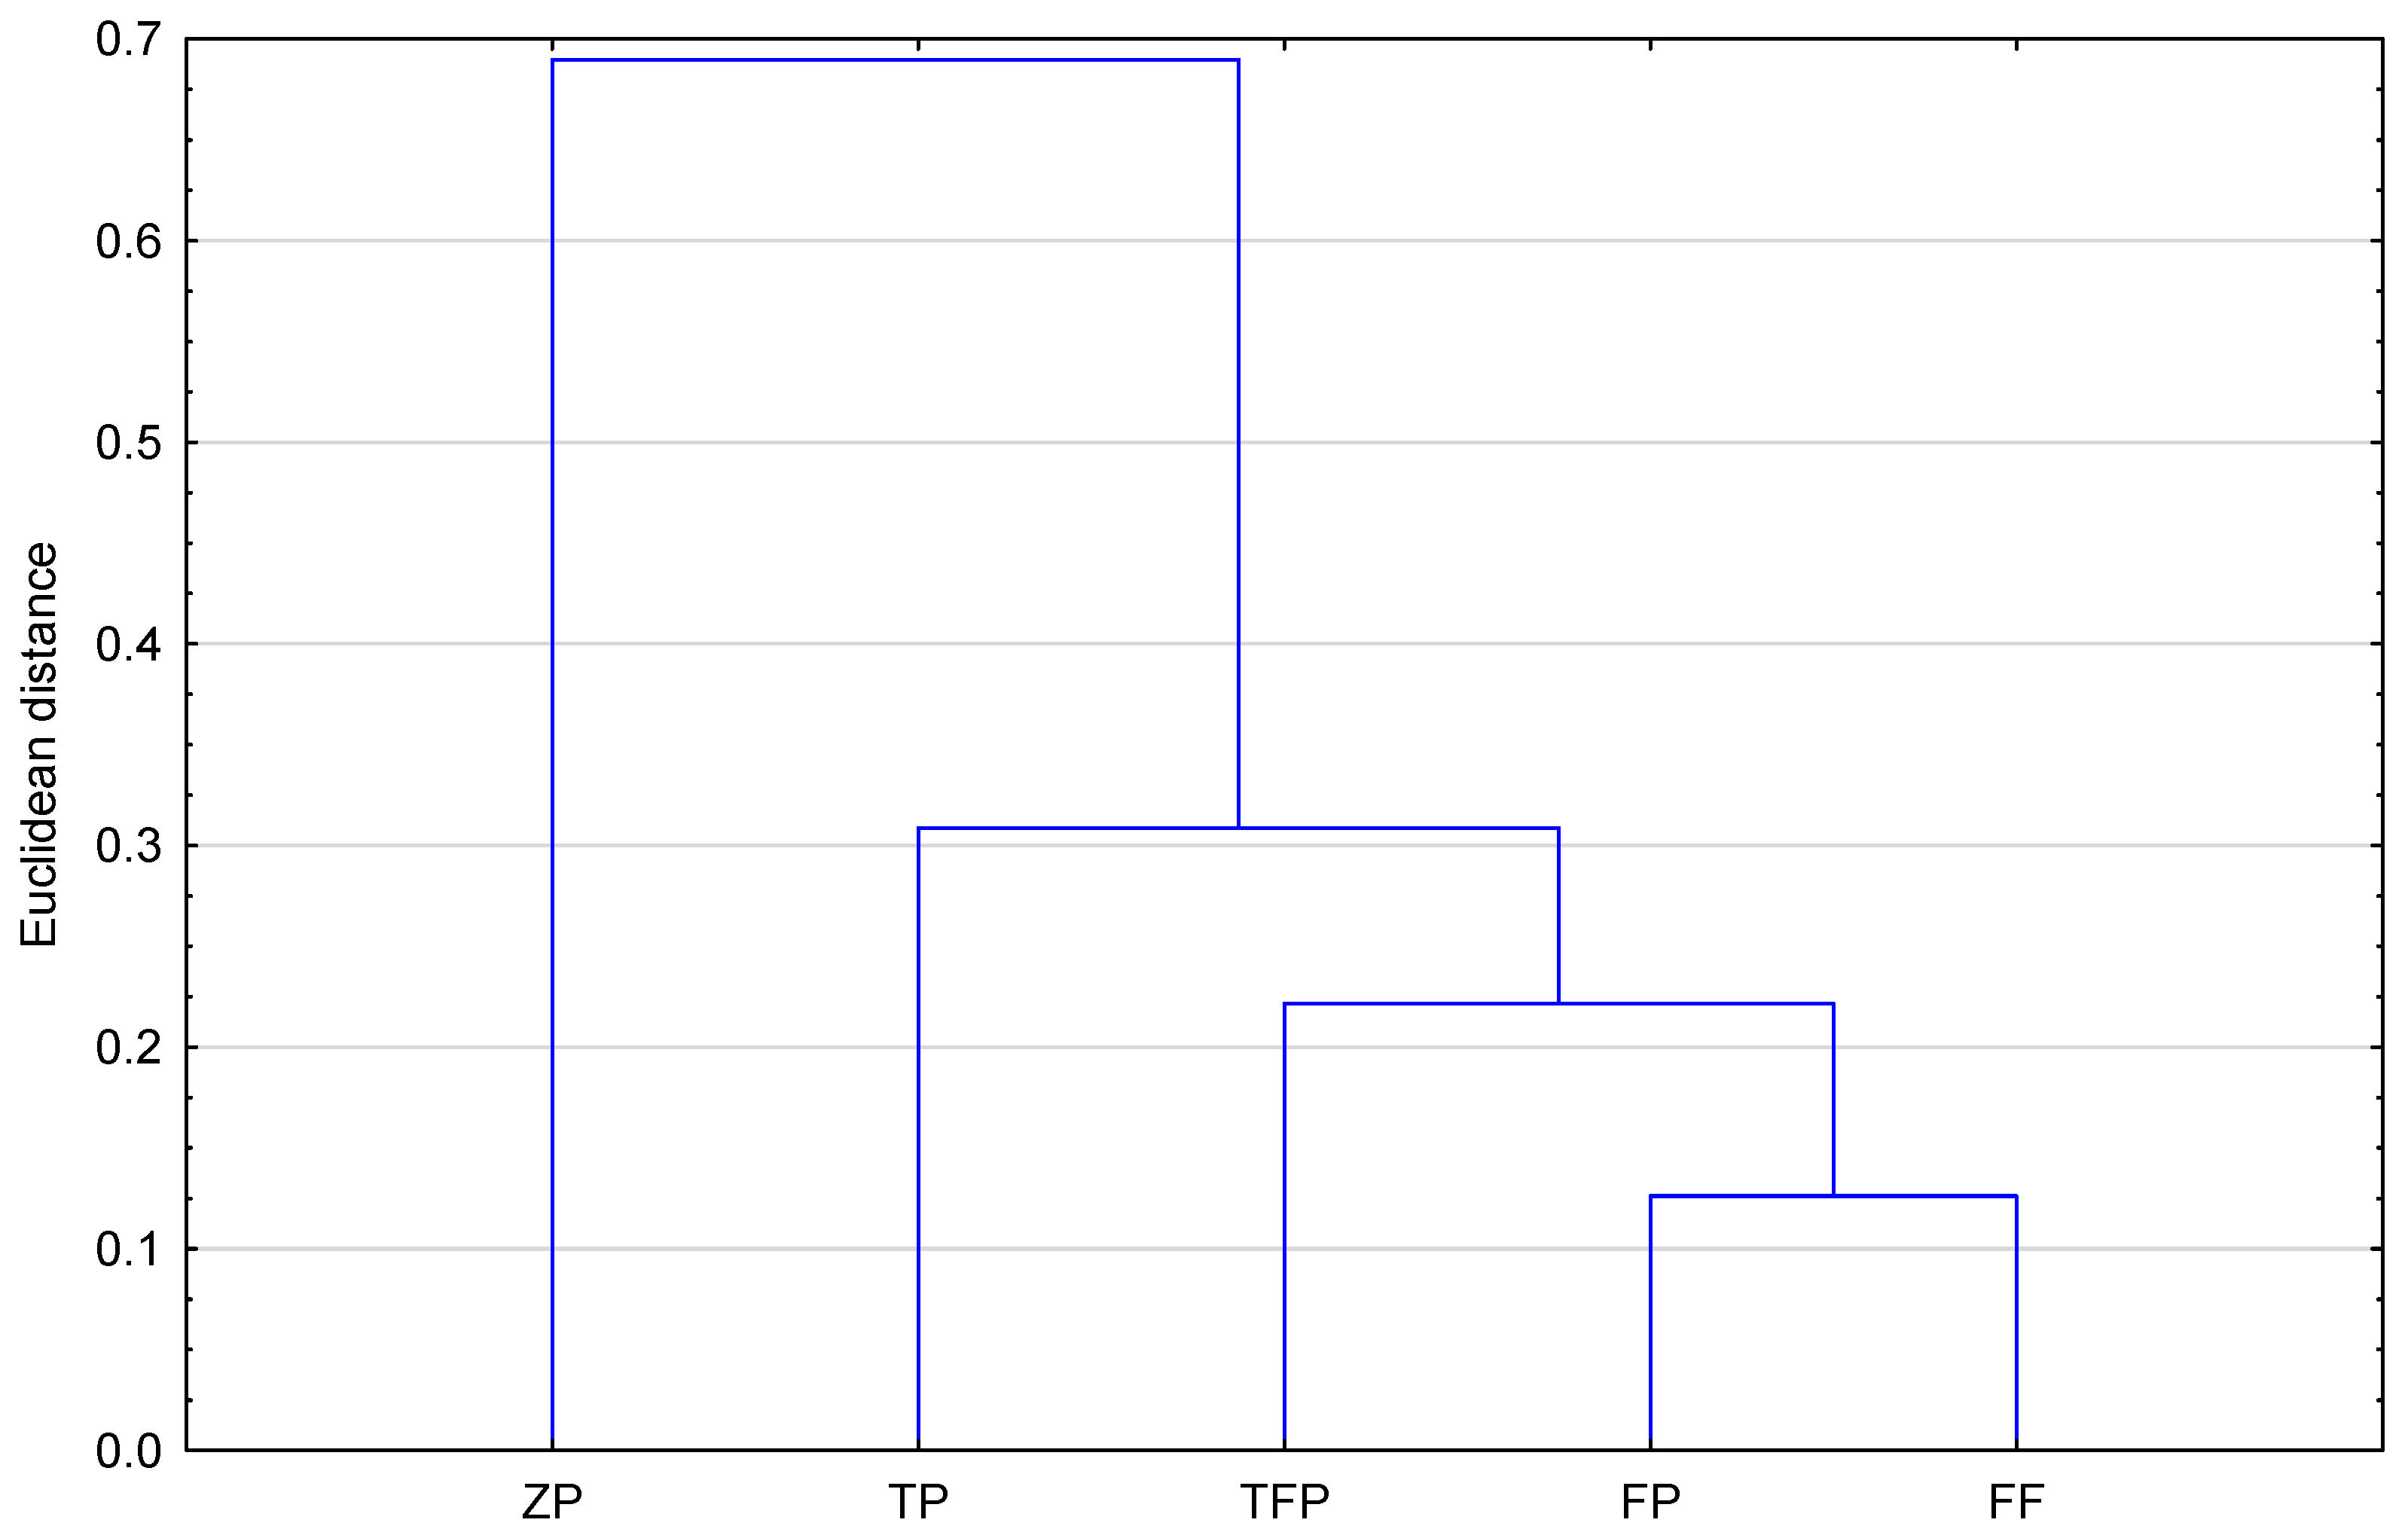
Figure 4 presents the results of the similarity analysis (Euclidean distance) of the studied compounds based on the calculated topological indices. As can be observed, all compounds studied, including the newly proposed structure, form two groups. To the first one belong TFP—triflupromazine; ZP—zuclopenthixol; and ND—new derivative. The second group is formed by TP—trifluoperazine; FP—flupentixol; and FF—fluphenazine. The greatest similarity (the smallest Euclidean distance) is shown by ZP and ND (zuclopenthixol and new derivative). This fact confirms that topological indices can be useful to group the selected neuroleptics.
As part of the continuation of this study, we attempted to use the experimental, i.e., chromatographic method to determine the lipophilicity parameter of five commercially available neuroleptics: fluphenazine, triflupromazine, trifluoperazine, flupentixol and zuclopenthixol. As described in the Materials and Methods Section, we successfully applied thin-layer chromatography in a reverse-phase system (RP-TLC) and various systems containing chromatographic plates: RP-2F
254, RP-8F
254 and RP-18F
254. As mobile phases, mixtures of acetone, acetonitrile or 1,4-dioxane and TRIS buffer (pH=7.4) were used. These chromatographic conditions consisted of silica gel based stationary phases modified with aliphatic hydrocarbons (C2, C8, C18) and mixtures of organic solvents with the buffer TRIS at physiological pH (7.4) which were the most popular and effective in lipophilicity studies conducted by various analysts and have also been successfully used in our previous work [
15,
16,
17,
18,
19,
20,
23]. The chromatographic parameter of lipophilicity R
MW obtained under these conditions, using Soczewiński–Wachtmeister’s equation, is presented in
Table 5. The data for the linear equation between the content of the organic modifier and R
M values obtained by using Soczewiński–Wachtmeister’s equation (R
M = R
MW + S∙φ) are presented in the
Supplementary Materials as
Tables S2–S6. Sufficient linearity of these relationships was confirmed by a high correlation coefficient (r), significant p-values, a low standard error of estimate and a high Fisher F-distribution value.
Interestingly, the chromatographic parameters of lipophilicity listed in
Table 5 were found to be lower compared to those predicted by the use of calculation methods, such as logP values. A cluster analysis was used to compare the similarity between the investigated compounds. An exemplary dendrogram of all compounds tested, prepared based on R
MW values by using acetone–TRIS buffer as mobile phase, is presented in
Figure 5. It confirms the biggest similarity of FF (fluphenazine) and FP (flupentixol). They form a cluster with the smallest Euclidean distance. The most distant (least similar) to them in terms of lipophilicity on the dendrogram is ZP (zuclopenthixol). Comparing exactly the chemical structures of the analyzed compounds and their chromatographic lipophilicity parameter (R
MW), a certain relationship can be observed. Flupentixol and zuclopenthixol differ in the type of substituent in the benzene ring. Flupentixol has trifluoromethyl as the substituent whereas zuclopenthixol has chlorine as the substituent. That difference causes flupentixol’s chromatographic parameters of lipophilicity to be higher than zuclopenthixol’s chromatographic parameters of lipophilicity determined by the use of RP-TLC on the TLC plates RP-2F
254, RP-8F
254 and RP-18F
254 as the stationary phase and acetone–TRIS buffer, acetonitrile–TRIS buffer and 1,4-dioxane–TRIS buffer as the mobile phase. The only exception is zuclopenthixol’s chromatographic parameter of lipophilicity determined by the use of RP-TLC on the TLC plate RP-18F
254 as the stationary phase and acetonitrile–TRIS buffer as the mobile phase which is higher than flupentixol’s chromatographic parameter of lipophilicity obtained in the same conditions. Another dependence can be observed between trifluoperazine and fluphenazine. Fluphenazine has an additional methylene group and hydroxyl group to trifluoperazine which results in lower values of chromatographic parameters of lipophilicity determined by the use of RP-TLC on each TLC plate and mobile phase. Other dependence can be pointed out between flupentixol and fluphenazine. Fluphenazine has nitrogen across from sulfur in its structure and it does not have double bond in that area in comparison to flupentixol. The majority of fluphenazine’s chromatographic parameters of lipophilicity are lower than flupentixol’s chromatographic parameters of lipophilicity. Fluphenazine’s chromatographic parameter of lipophilicity is higher than flupentixol’s chromatographic parameter of lipophilicity in two cases. The first one is fluphenazine’s chromatographic parameter of lipophilicity determined on the TLC plate RP-2F
254 and acetone–TRIS buffer as the mobile phase which is insignificantly higher than flupentixol’s chromatographic parameter of lipophilicity determined in the same conditions. The second one is fluphenazine’s chromatographic parameter of lipophilicity determined on the TLC plate RP-18F
254 and acetonitrile–TRIS buffer as the mobile phase which is higher than flupentixol’s chromatographic parameter of lipophilicity determined in the same conditions. This confirms the influence of chemical structure on the lipophilicity of the studied compounds and may be useful in the preliminary design of new derivatives of the investigated neuroleptics, such as the one presented in
Figure 2.
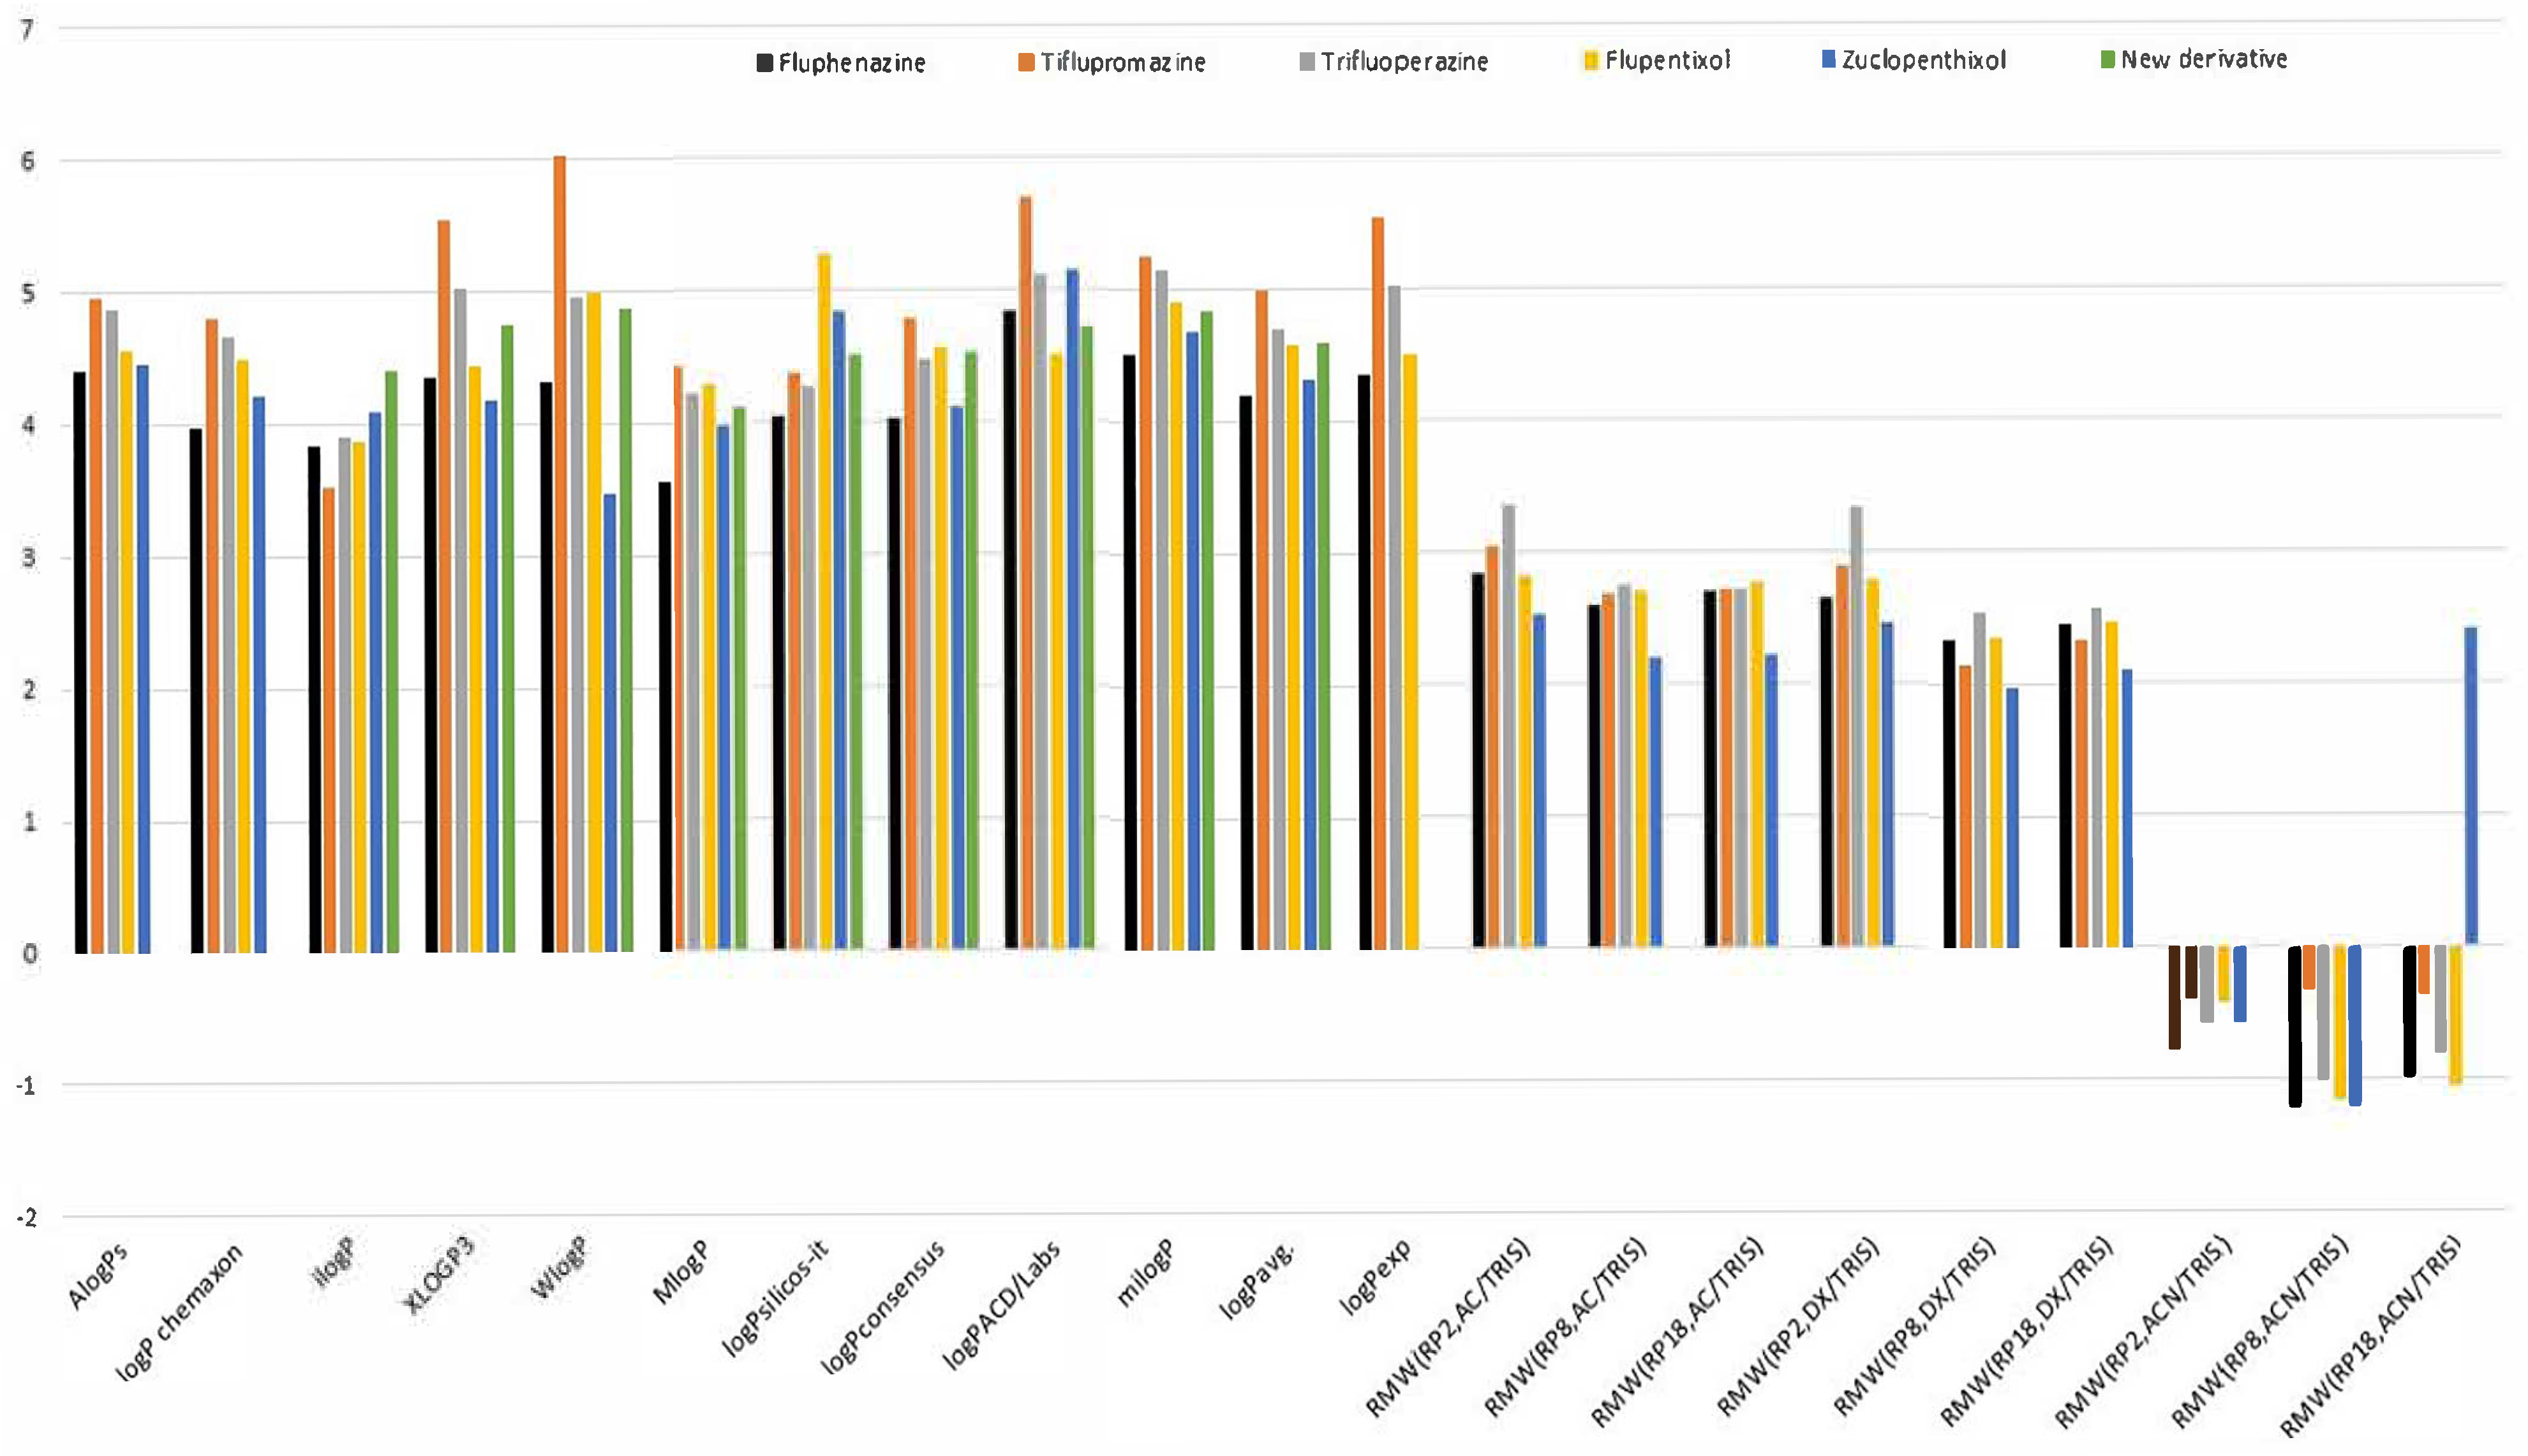
To fully compare the lipophilic properties of the tested compounds and the new derivative, we presented all the obtained lipophilicity parameters (logP and R
MW values) in the form of a graph in
Figure 6.
Further analysis of the chromatographic parameters listed in
Figure 6 indicates that the most optimal phases among those tested are acetone–TRIS buffer and 1,4-dioxane–TRIS buffer, which enable the attainment of reliable values of this parameter on all chromatographic plates tested (RP-2F
254, RP-8F
254, RP-18F
254). These mobile phases were also successfully applied in a previous lipophilicity study of newly synthesized phenothiazine derivatives [
17]. However, the mobile phase composed of acetonitrile and TRIS buffer was less useful for studying lipophilicity. Using this method, as shown in
Figure 6, R
MW values were obtained that differed completely from the other experimental and theoretical logP values. These conclusions will be important for the further planned lipophilicity experiments of a series of newly designed molecules, such as the new one containing quinoline and a phenothiazine system presented in
Figure 2. When considering all stationary phases, the lipophilicity values, notably the R
MW values, for RP-8F
254 plates are comparable to those for the RP-18F
254 plates determined by means of acetone–TRIS buffer and 1,4-dioxane–TRIS buffer, while the values obtained from RP2-F
254 plates are only slightly higher for some neuroleptics, such as trifluoroperazine. This fact confirms in particular the influence of the mobile phase used on the assessment of the lipophilicity of the studied neuroleptics.
Furthermore, to compare the relationships between logP values and chromatographic lipophilicity parameter R
MW values for the tested compounds, a correlation matrix of all chromatographic lipophilicity parameters was performed. The results of the correlation matrix are presented in
Table S7 (Supplementary Materials).
Analysis of the data listed in
Table S7 shows that among all R
MW values, the most significant linear correlations with theoretical values of logP in the form of logP
silicos-it are shown for the chromatographic parameter determined on RP-18F
254 plates developed by using the mobile phase consisting of acetone and TRIS buffer (RMW(RP18,AC/TRIS)—R = 0.9998. The next satisfactory correlation with both, i.e., MlogP and logP
Consensus, is shown for R
MW obtained on RP-2F
254 plates using acetonitrile and TRIS buffer, i.e., RMW (RP2, ACN/TRIS). In this case, R is 0.9636 and 0.9697, respectively. High correlation with XlogP3 (R = 0.9623) and logP
ACD/Labs (R = 0.9769), as well as with logP
exp (R = 0.9564), indicates RMW (RP18, ACN/TRIS).
Good correlations can be also observed between certain RMW values like, for example, RMW (RP2, DX/TRIS) and RMW (RP2, AC/TRIS) with R = 0.9724. Excellent correlations with R = 0.9999 were seen for both RMW (RP18, DX/TRIS) and RMW (RP8, DX/TRIS). However, RMW obtained by means of acetonitrile and TRIS buffer on RP18F254 plates, i.e., RMW (RP18, ACN/TRIS), shows a statistically significant correlation with RMW determined by using the same mobile phase and chromatographic plate RP-8F254 (R = 0.9809).
These results justify the use of various chromatographic plates and mobile phases to find the optimal conditions for the lipophilicity study of examined neuroleptics and their derivatives in the future.
Based on previous work [
29], in the next stage, we attempted to correlate the previously calculated topological indices with the theoretical and chromatographic lipophilicity parameters of the compounds under study. The best linear correlations between partition coefficients (logP) and R
MW values with topological indices for the analyzed compounds are shown in
Table S8.
Analysis of the data listed in
Table S8 confirms that the logP values predicted by logP
ACD/Labs have the highest correlation (
Equation (S4)) with the topological index (M), with R
2 = 98.00 as follows: logP
ACD/Labs = 11.079 − 0.027∙M. A high correlation with R
2 in the range of 84.23 to 93.81% was also found between logP
ACD/Labs and other topological indices calculated for studied compounds such as
0χ,
1χ,
0χν, W, R and A (
Equations (S5)–(S10)).
Equations (S1)–(S3), as well as
Equations (S11) and (S12), show that other theoretically obtained partition coefficients such as XLOGP3, WlogP, logP
consensus and logP
avg correlate well with the Pyka indices
0B and
1B (R
2 = 81.22–96.24). Interestingly, the topological indices newly calculated in this work, especially the Gutman index M
ν, indicate a significant correlation with the chromatographic, i.e., experimental, lipophilicity parameter (R
MW) obtained for RP-18 (AC/TRIS) and RP-18 (DX/TRIS) systems which consisted of RP-18F
254 plates and acetone-AC and 1,4-dioxane-DX as organic modifiers (
Equations (S13) and (S14)). Thanks to these linear models, the experimental values of zuclopentixol and a new derivative may be determined without experiment.
To confirm this fact, we predicted the chromatographic parameters R
MW for both compounds using the obtained linear models, i.e.,
Equations (S13) and (S14), and compared them with the chromatographic values. The R
MW (RP-18 (AC/TRIS)) predicted using
Equation (S13) for zuclopenthixol is 2.229; the experimental value obtained in this work is 2.218 (
Table S8). The predicted R
MW (RP-18 (DX/TRIS)) using
Equations (S14) is 1.978, and the experimental value is 2.110 (
Table S8). In the case of the new derivative, the chromatographic parameters calculated based on
Equations (S13) and (S14) are 2.841 and 2.386. Good agreement can also be observed between the logP values calculated by means of other equations, as shown in
Table S8, for example,
Equation (S1). The XlogP3 calculated using
Equation (S1) for zuclopentixol is 4.45, and the one obtained from SwissADME is 4.18 [
25]. Similarly, for the new derivative XlogP3 calculated according to
Equation (S1), it is 4.34, and from SwissADME, it is 4.76 [
25].
The newly calculated topological indices were also satisfactorily related to their selected physicochemical parameters such as molar mass, molar refractivity, molar volume and polarizability, with R
2 placed in the range of 84.35–99.19%
Equations (S15)–(S32). The best correlation was observed between index W and R with molar mass
Equations (S19) and (S20),
Table S9.
In further steps, we correlated the topological indices with other ADMET parameters from the Percepta platform, such as logKp, logBB, logPS and Caco-2 [
28]. The correlation equations are presented in
Table S10 (Equations (S33)–(S38)). As can be observed, the highest correlation is between the topological index
1B and logKp values (R
2 = 95.15) and Caco-2 (R
2 = 94.57). Other topological indices which correlated well with these parameters are the indices M, A and
1χ
ν. This situation confirms the utility of the obtained linear models for rapid prediction of both ADMET parameters for the members of the studied groups of neuroleptic agents or their new derivatives.
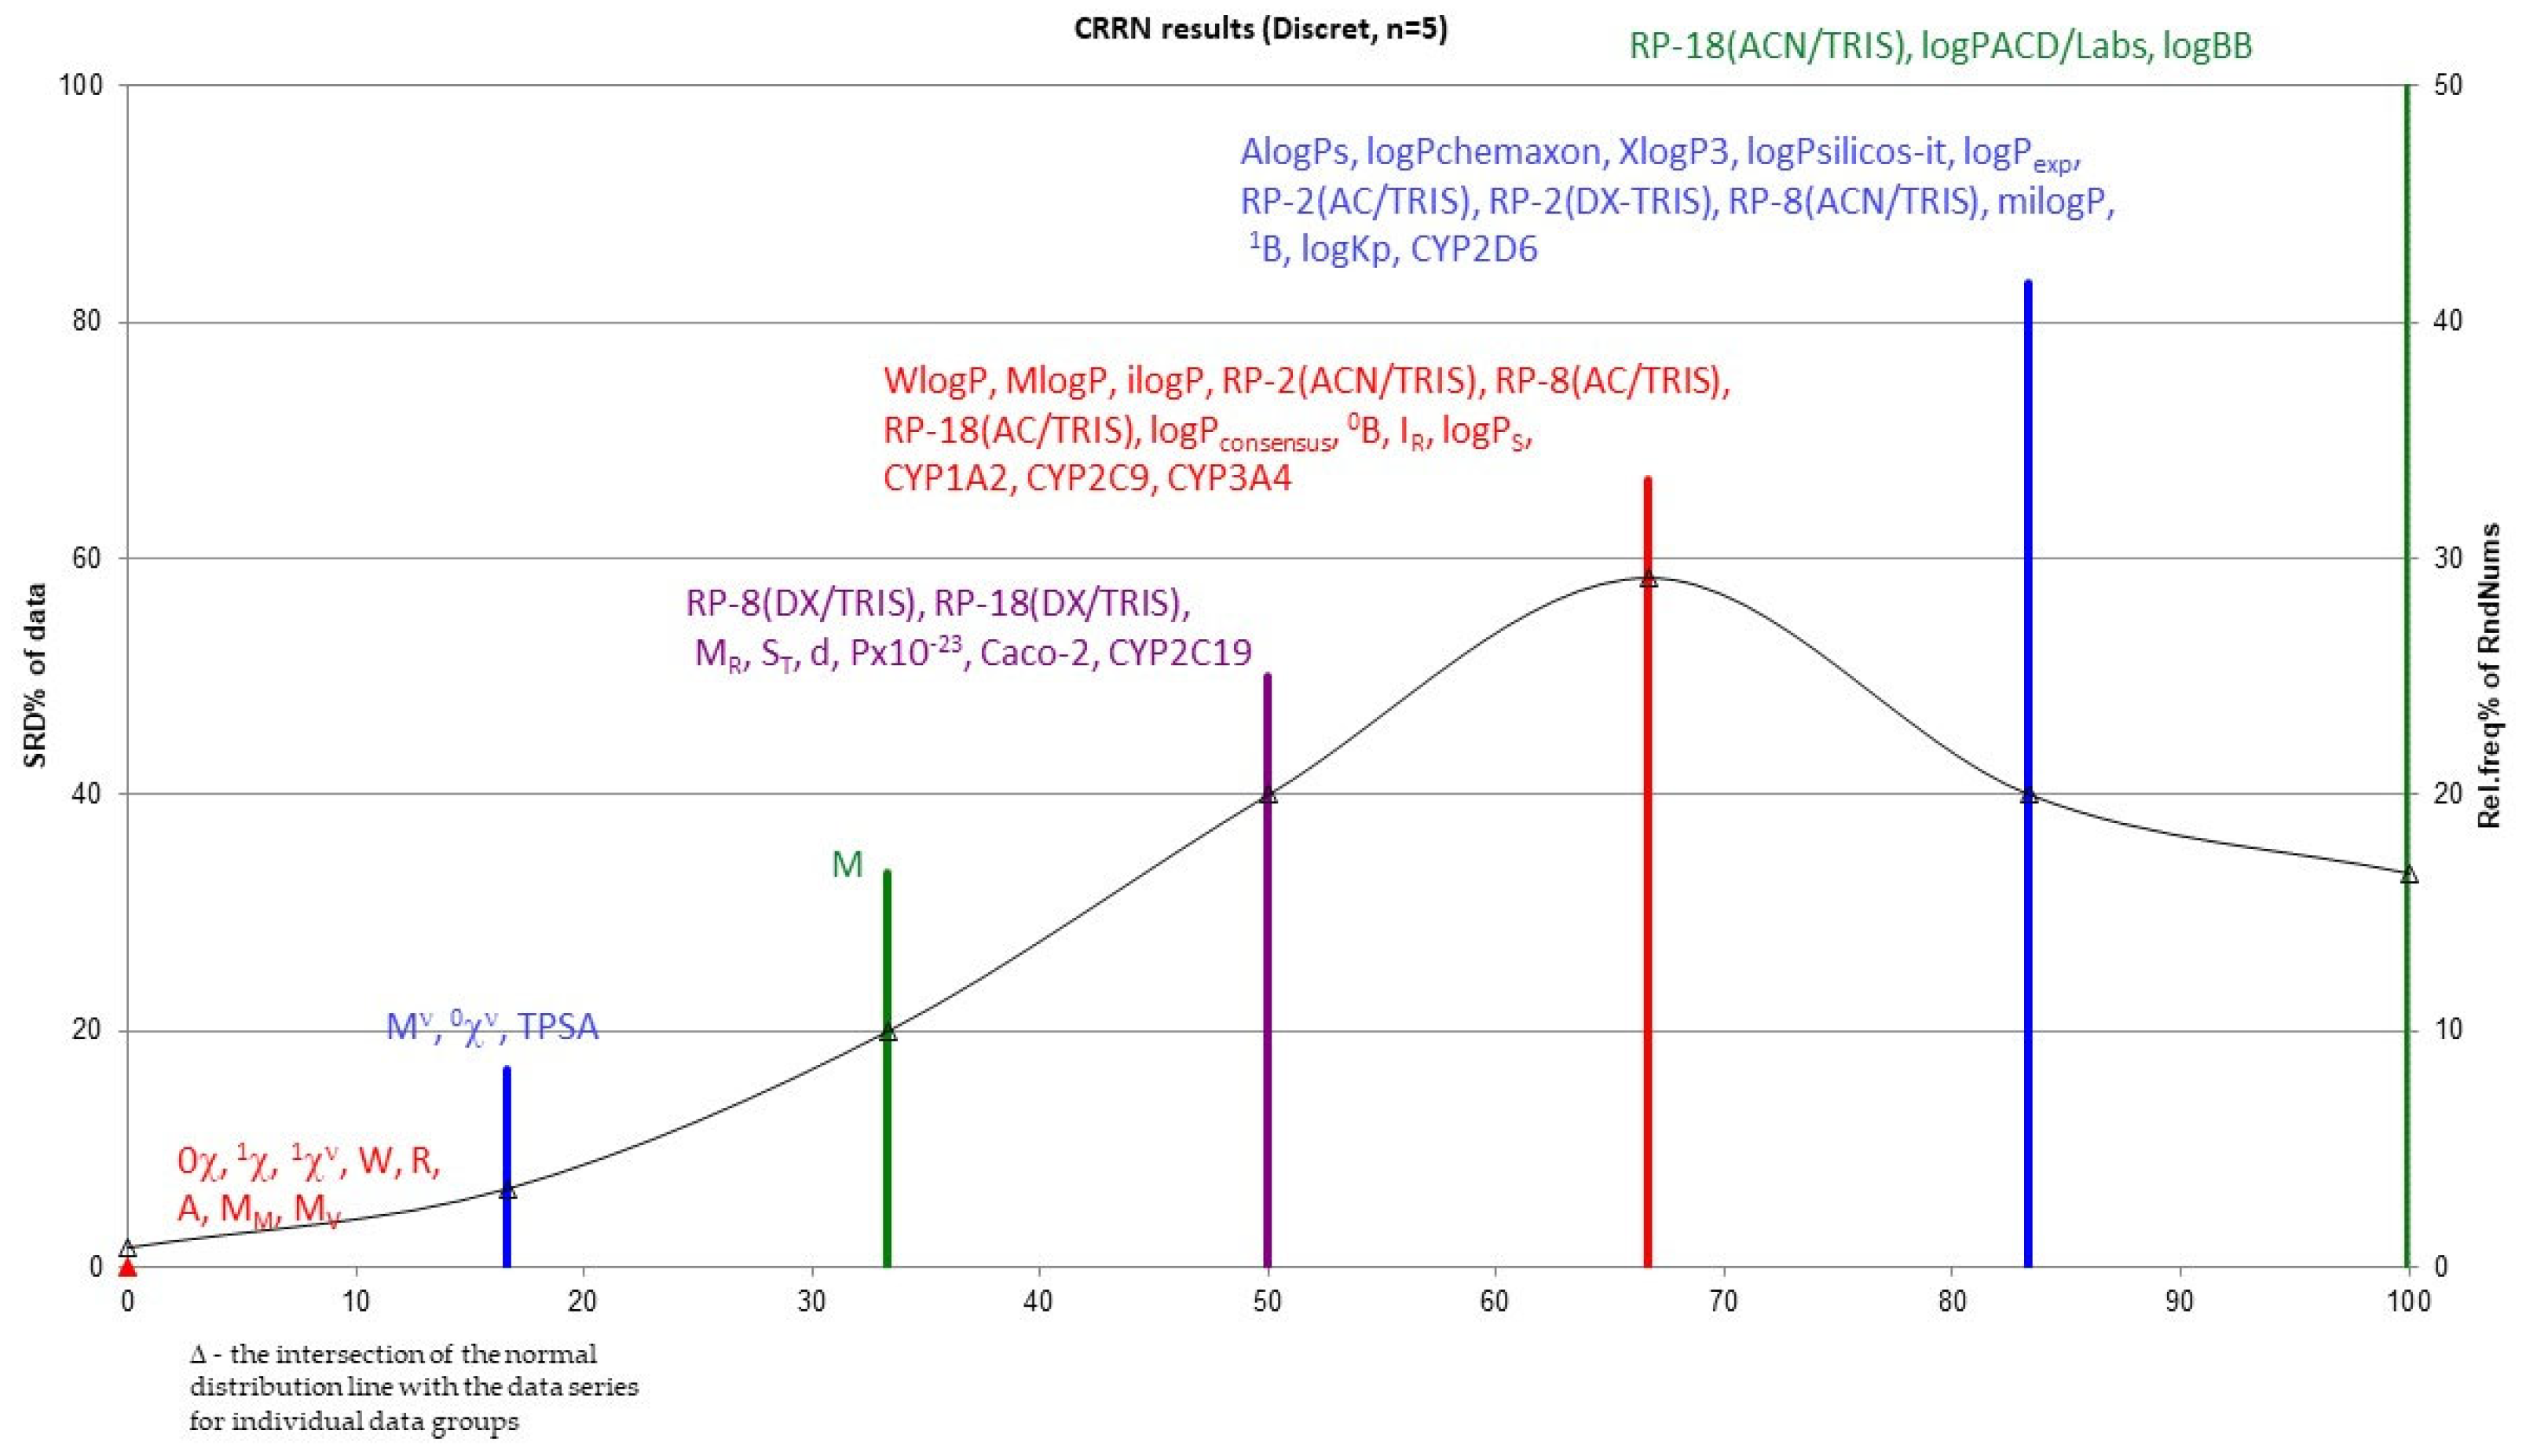
We also used one of the non-parametric analysis methods to analyze the data obtained. It was SRD analysis, i.e., the sum of ranking differences. The study was conducted to compare data describing the group of tested drugs. The analysis proposed by Prof. Heberger and described in his works [
30,
31,
32] provides many possibilities for analyzing the obtained results. It has already been successfully used by many researchers, for example, to study retention indices of polycyclic aromatic hydrocarbons [
33], anticancer acetylene quinoline derivatives [
34] or triazine derivatives [
35]. In our work, we proposed SRD analysis for the evaluation of all obtained data, i.e., lipophilicity values, physicochemical properties, ADMET parameters and topological index values [
36,
37]. The proper graph is presented in
Figure 7.
The Wiener (W), Rouvray (R) and Pyka A indices will be the best in this role. In the same group, there is also molar mass and molar volume, which are very closely related to the structure of the compound. For this entire group of parameters, SRD = 0. Other useful indices, not far from the reference for which SRD = 2, are the other topological indices, namely the Gutman valence index (Mν), the Randić zero-order valence index (0χν) and also TPSA (topological polar surface area) (for them, SRD = 2), as well as the Gutman index M (for which SRD = 4). This confirms the validity of calculating structural descriptors, particularly topological indices, to describe chemical compounds, including compounds with pharmacological activity. It turns out that the most useful topological indices include both those based on the adjacency matrix (Gutman and Randić) and those based on the distance matrix—Wiener, Rouvray and Pyka A.
