
Biodegradable Polylactide Nanocapsules Containing Quercetin for In Vitro Suppression of Mouse B16F10 and Human Sk-Mel-28 Melanoma Cell Lines
Abstract
1. Introduction
2. Results
2.1. Part 1—Nanocapsule Preparation and Properties
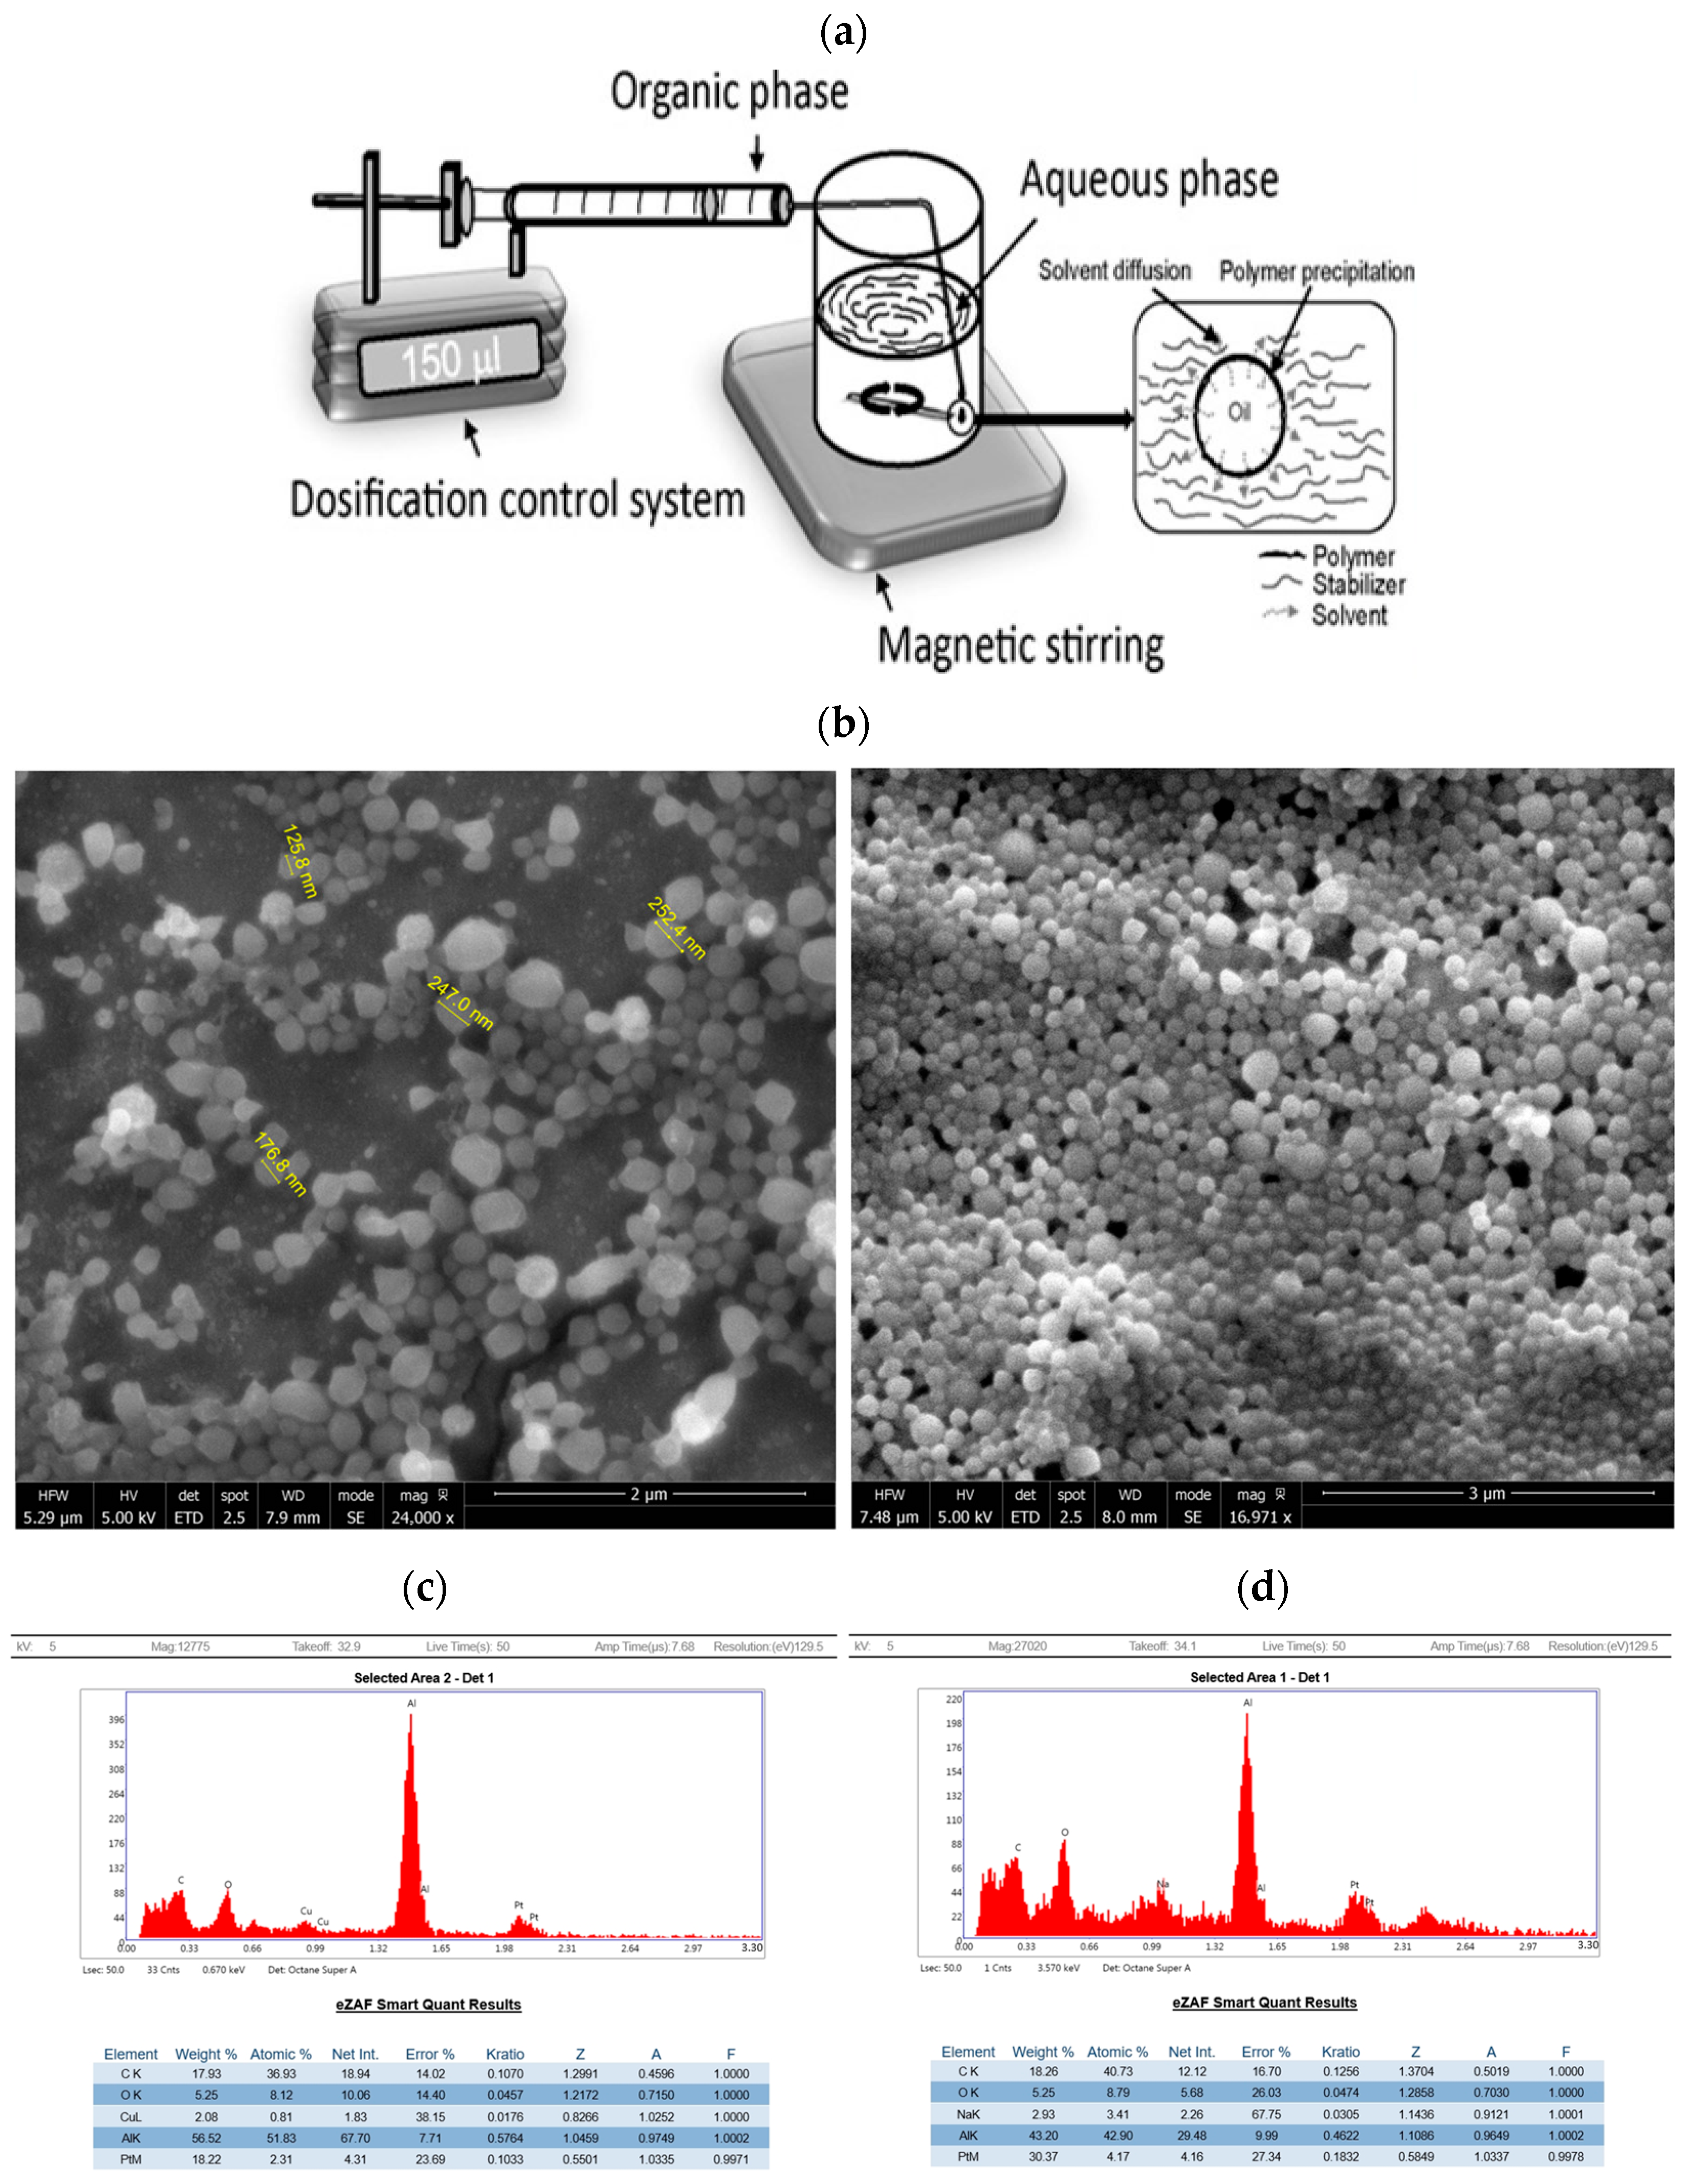
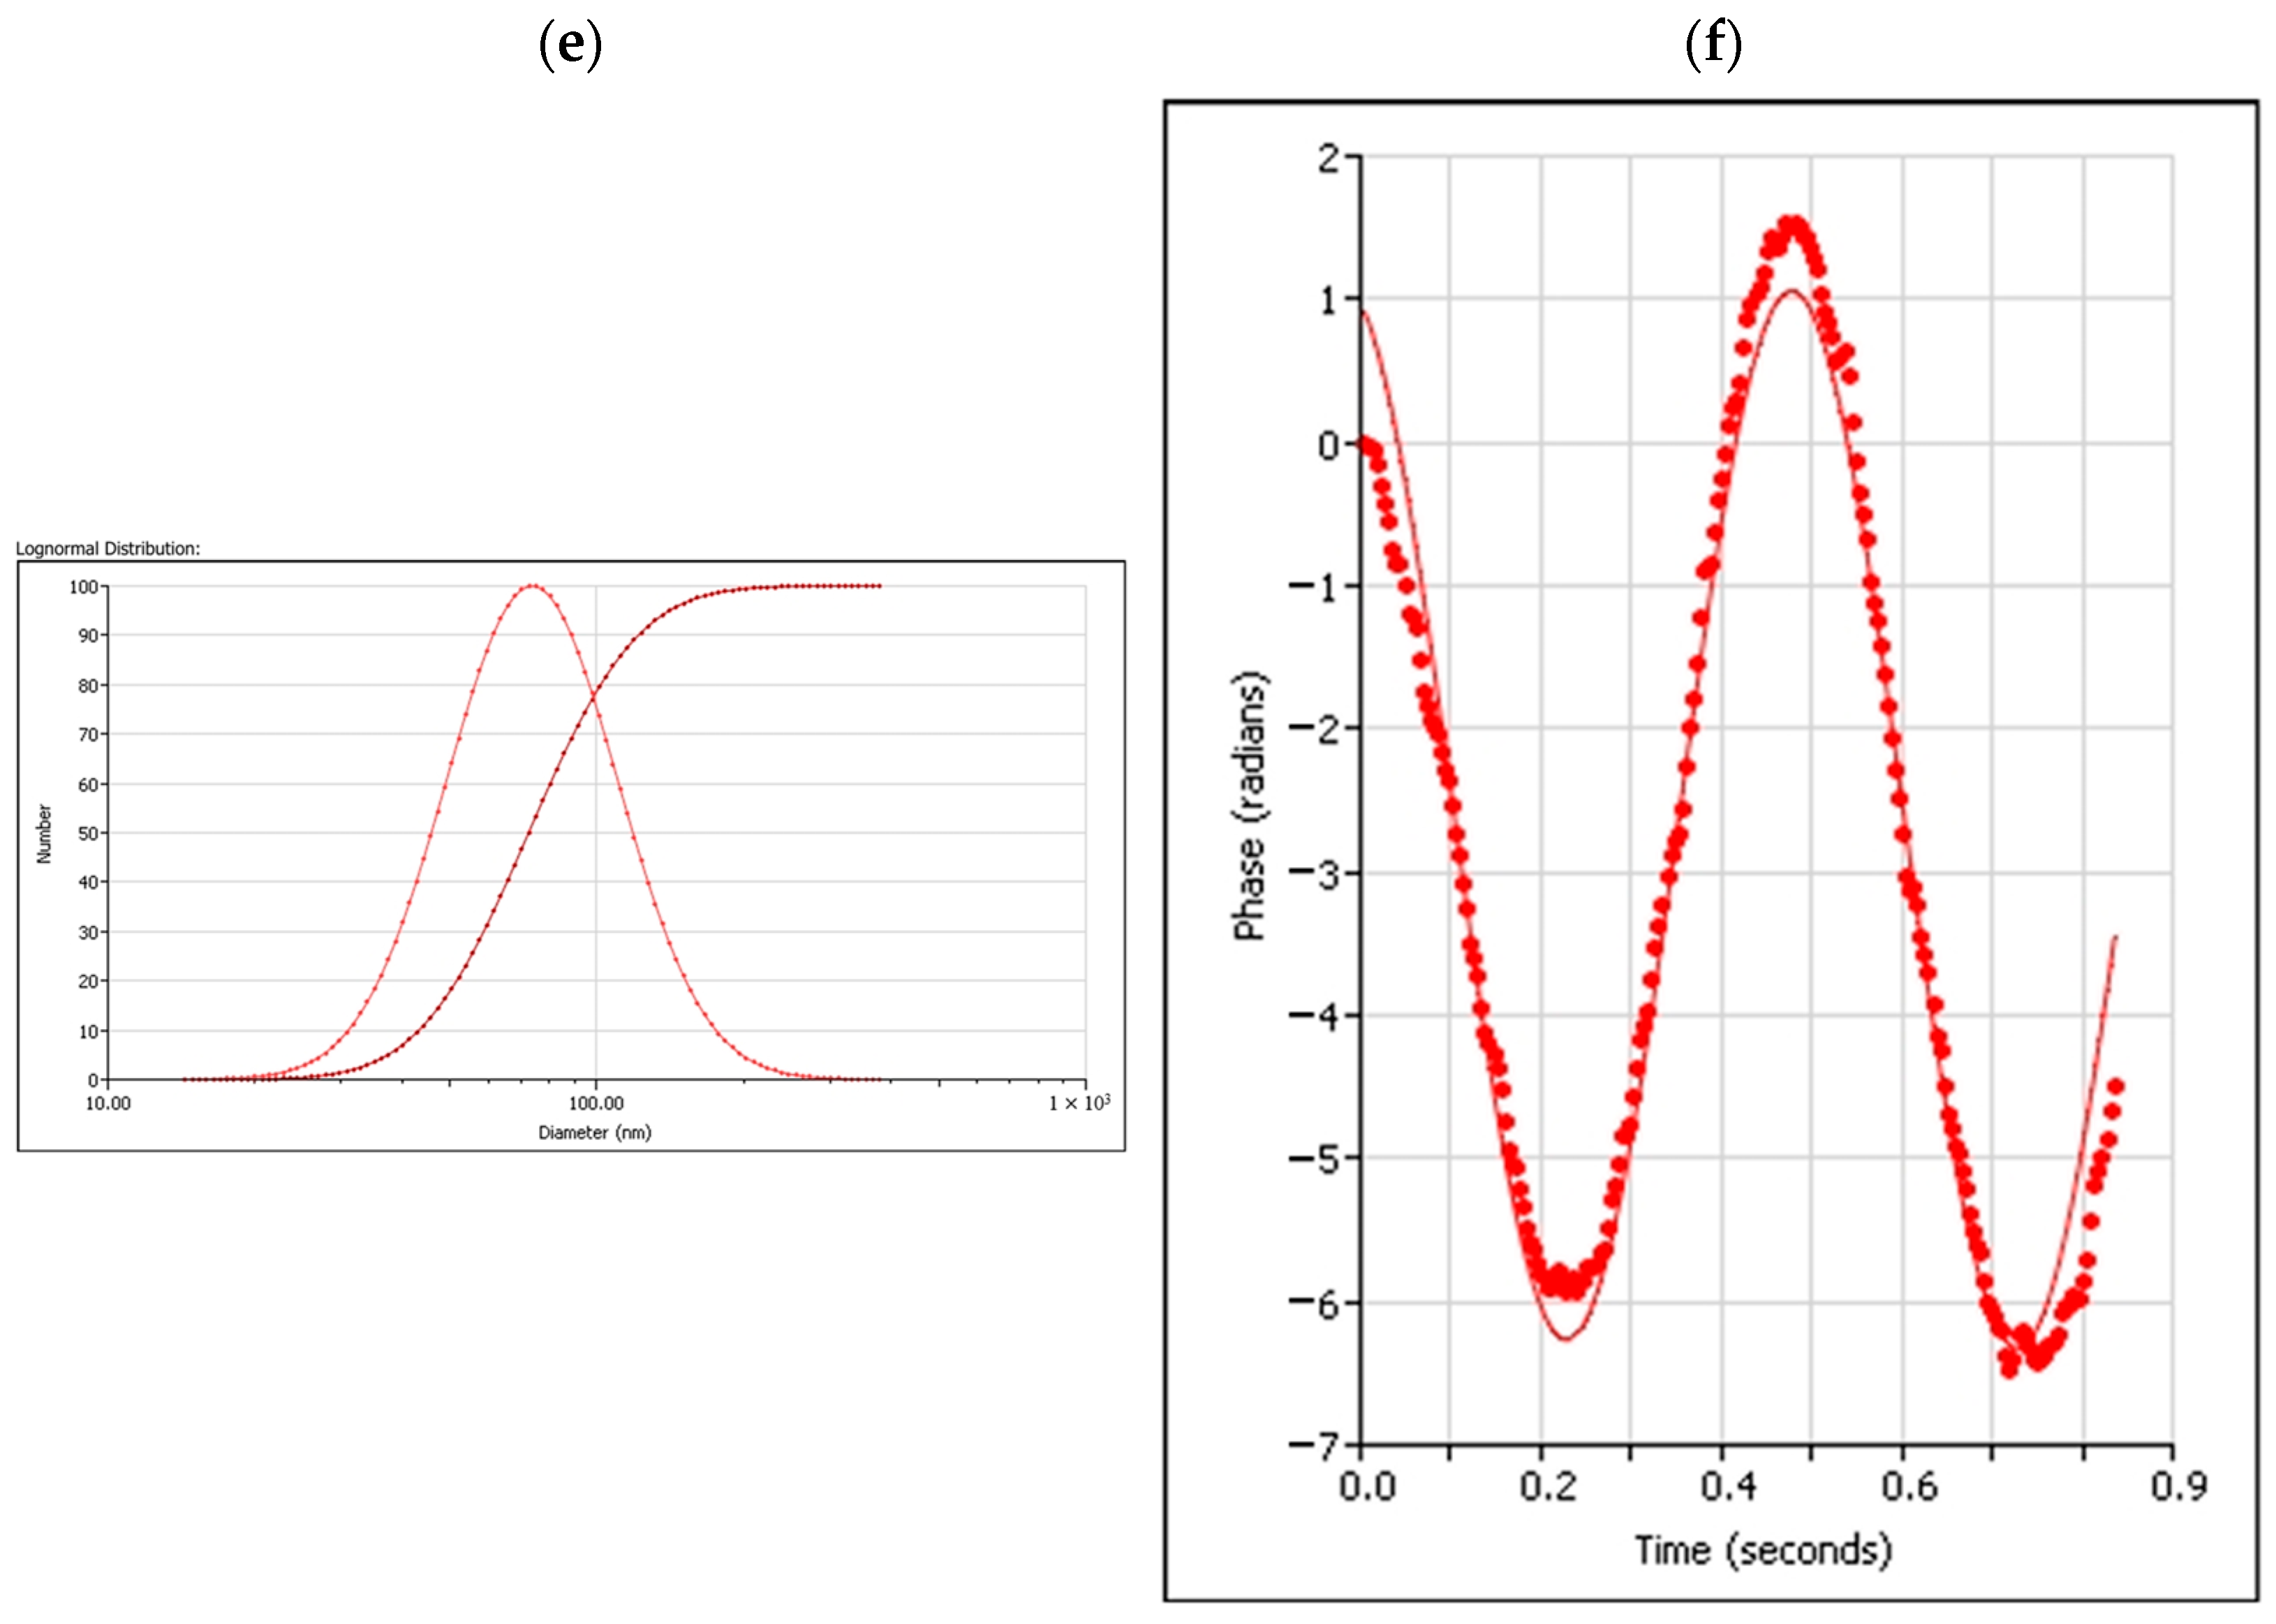
2.1.1. Formation of PLA Nanocapsules Containing Quercetin Using Nanoprecipitation and Solvent Evaporation
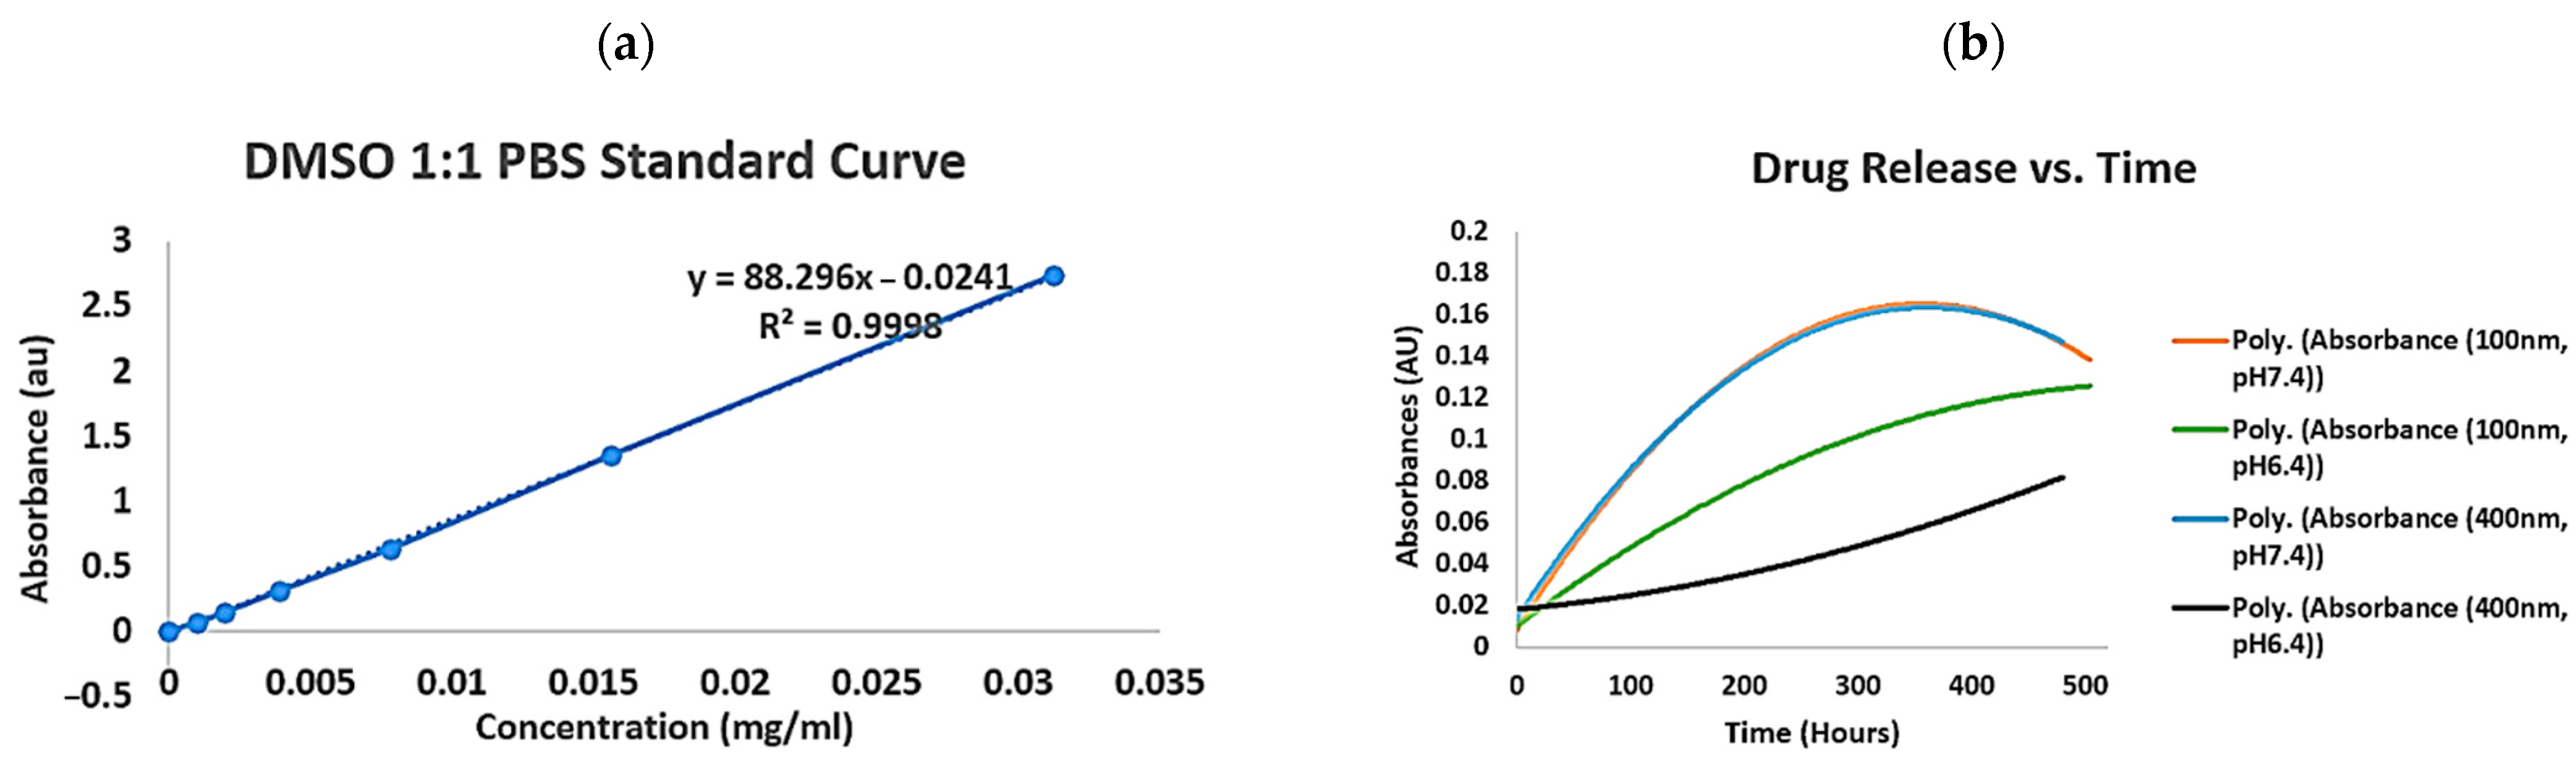
2.1.2. PH and Size Impact on Quercetin Nanocapsule Drug Release
2.2. Part 2—Effects of Quercetin Nanocapsules on the Mouse B16F10 Melanoma Cell Line
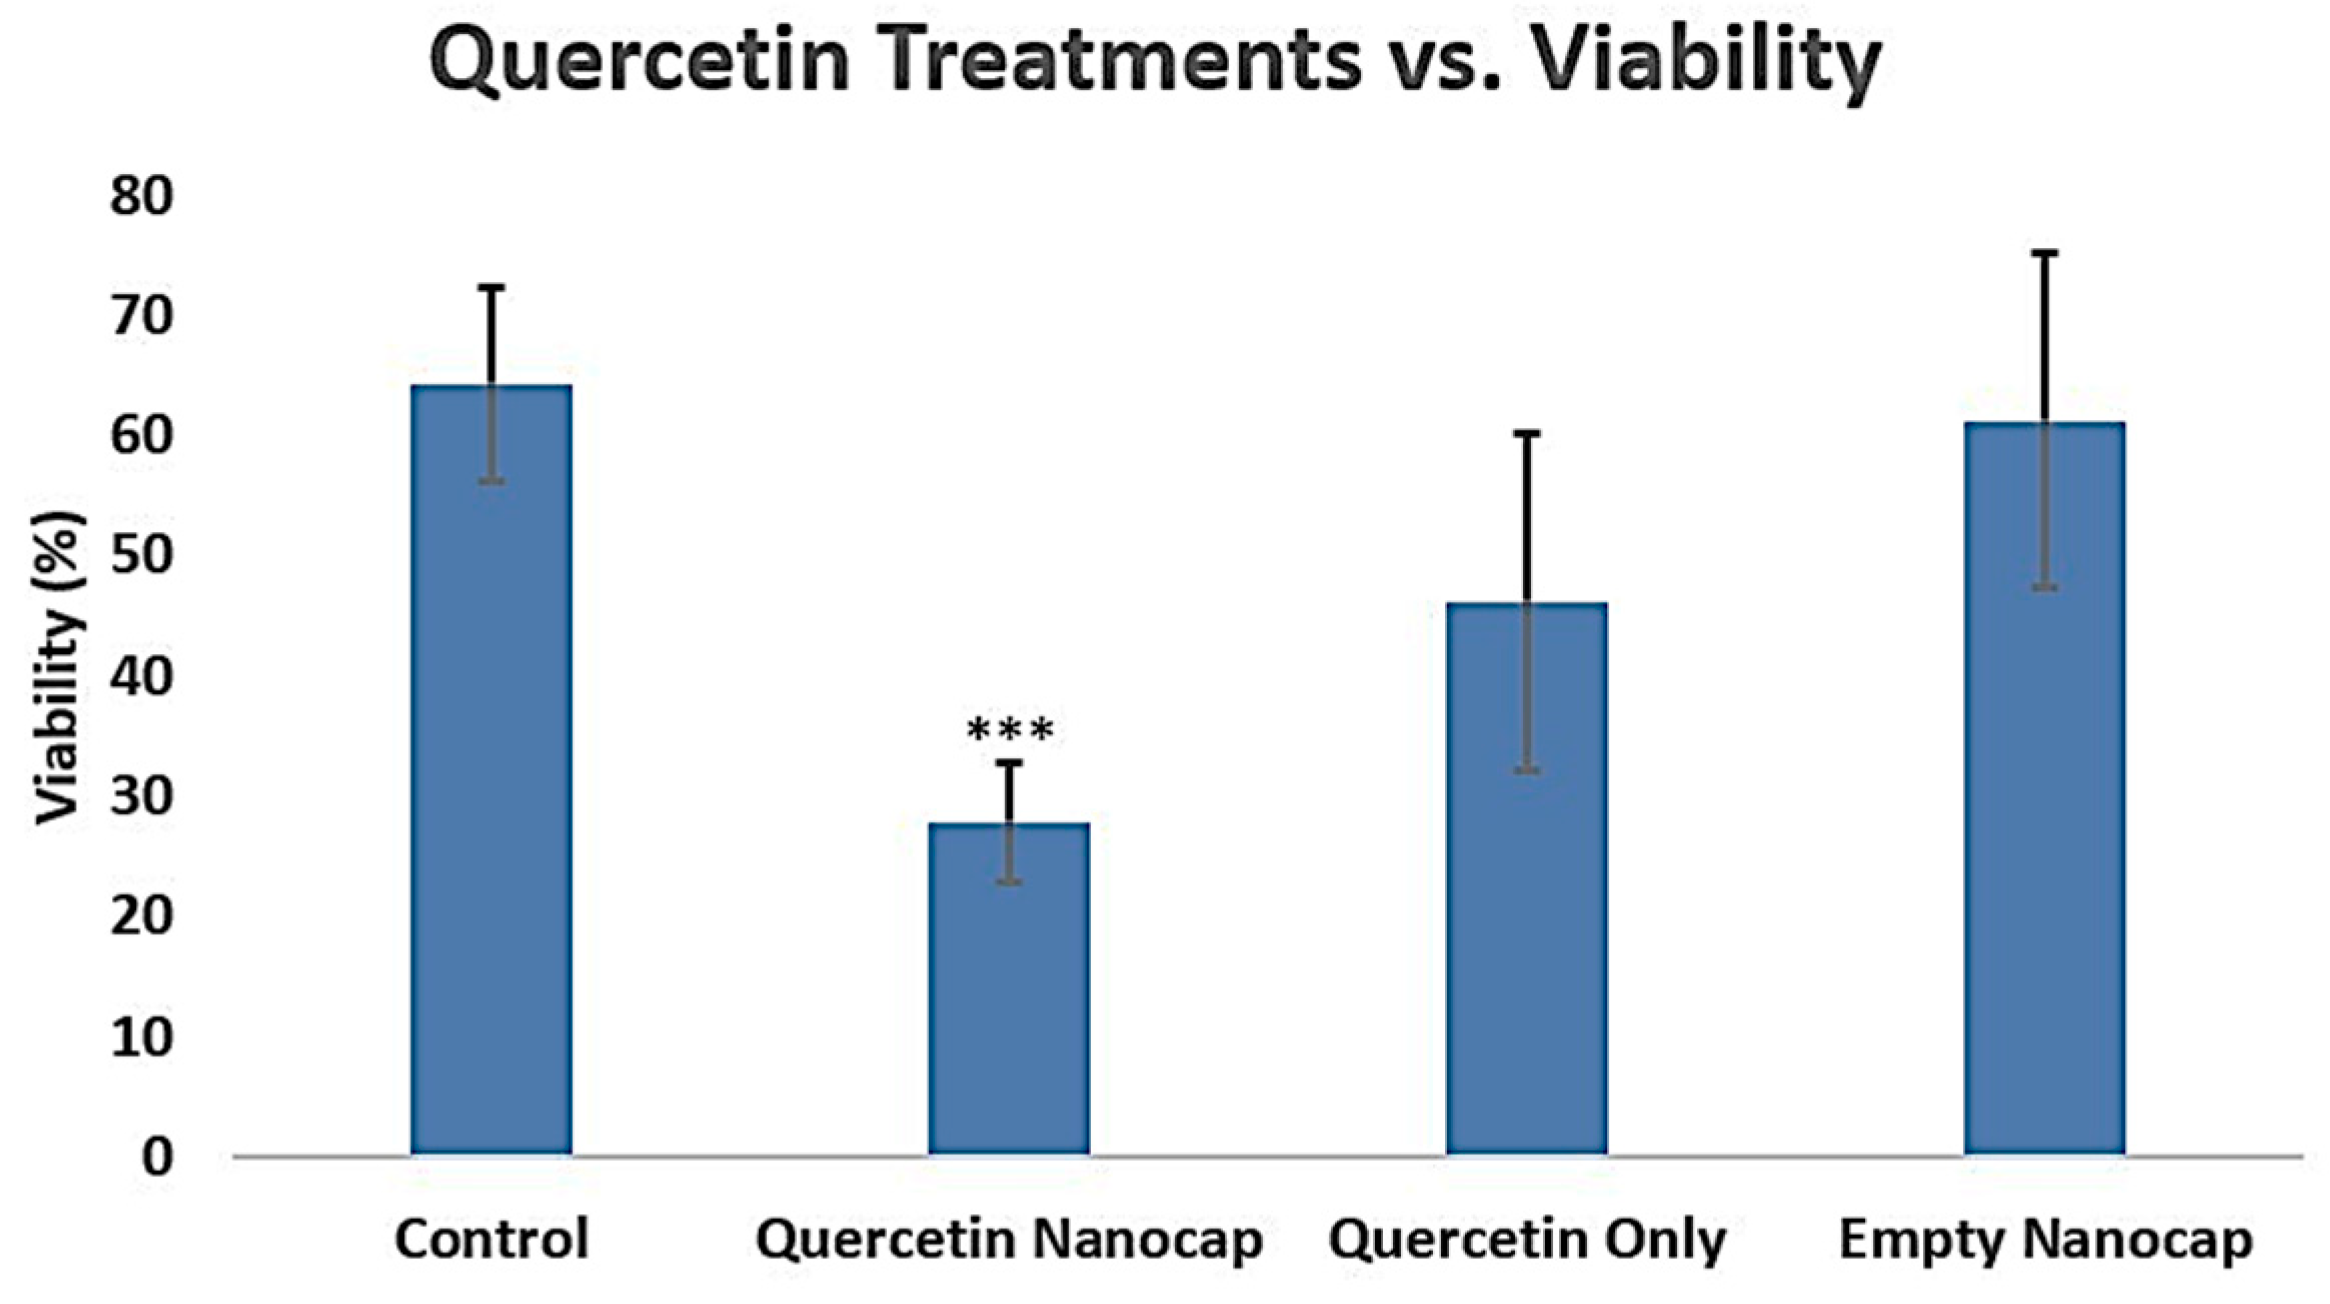
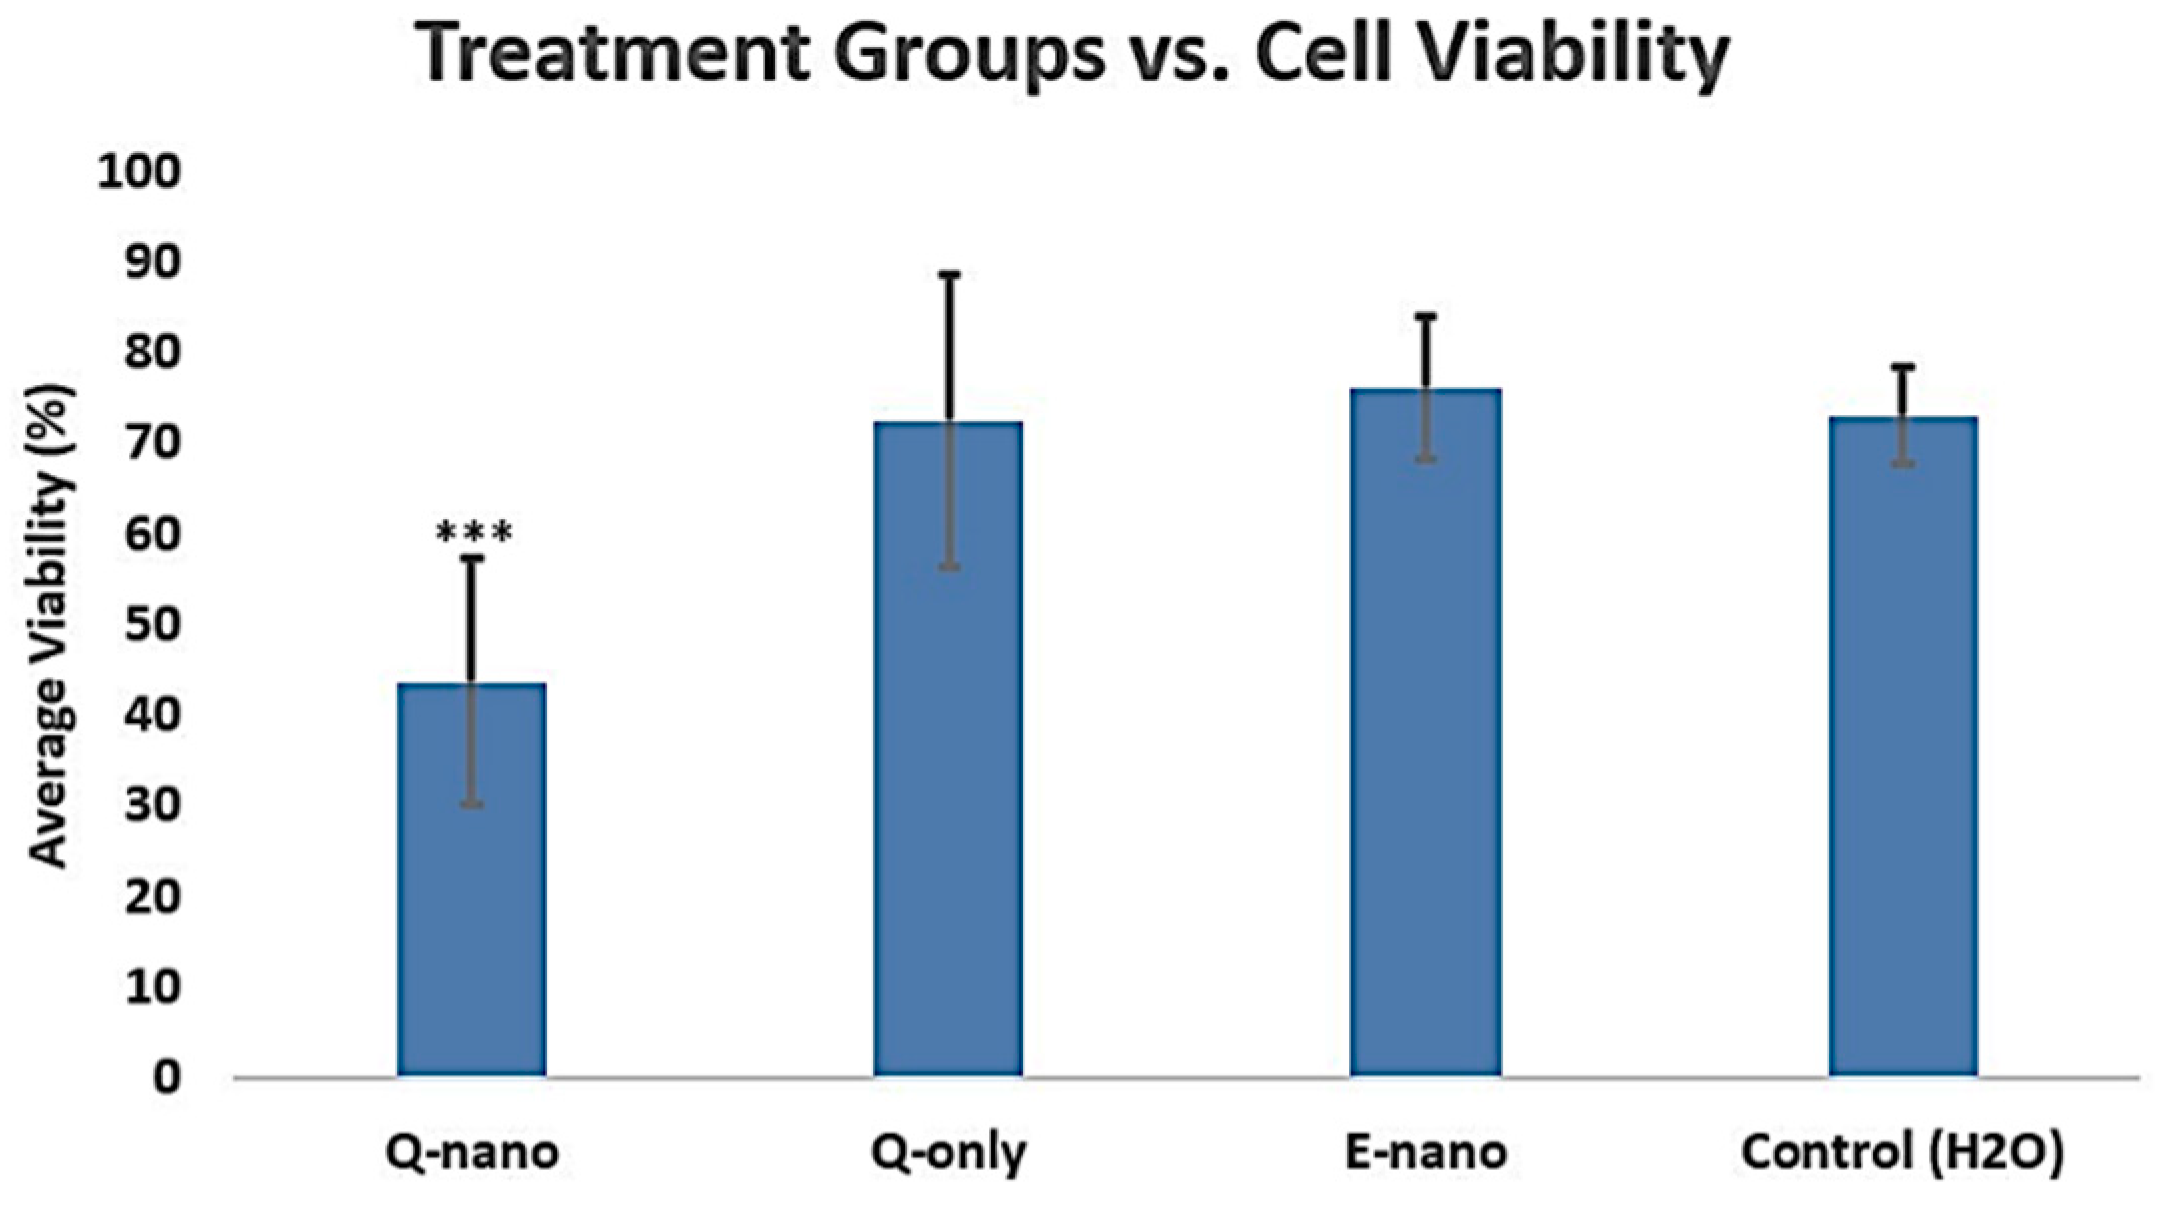
2.2.1. Cell Viability Assay
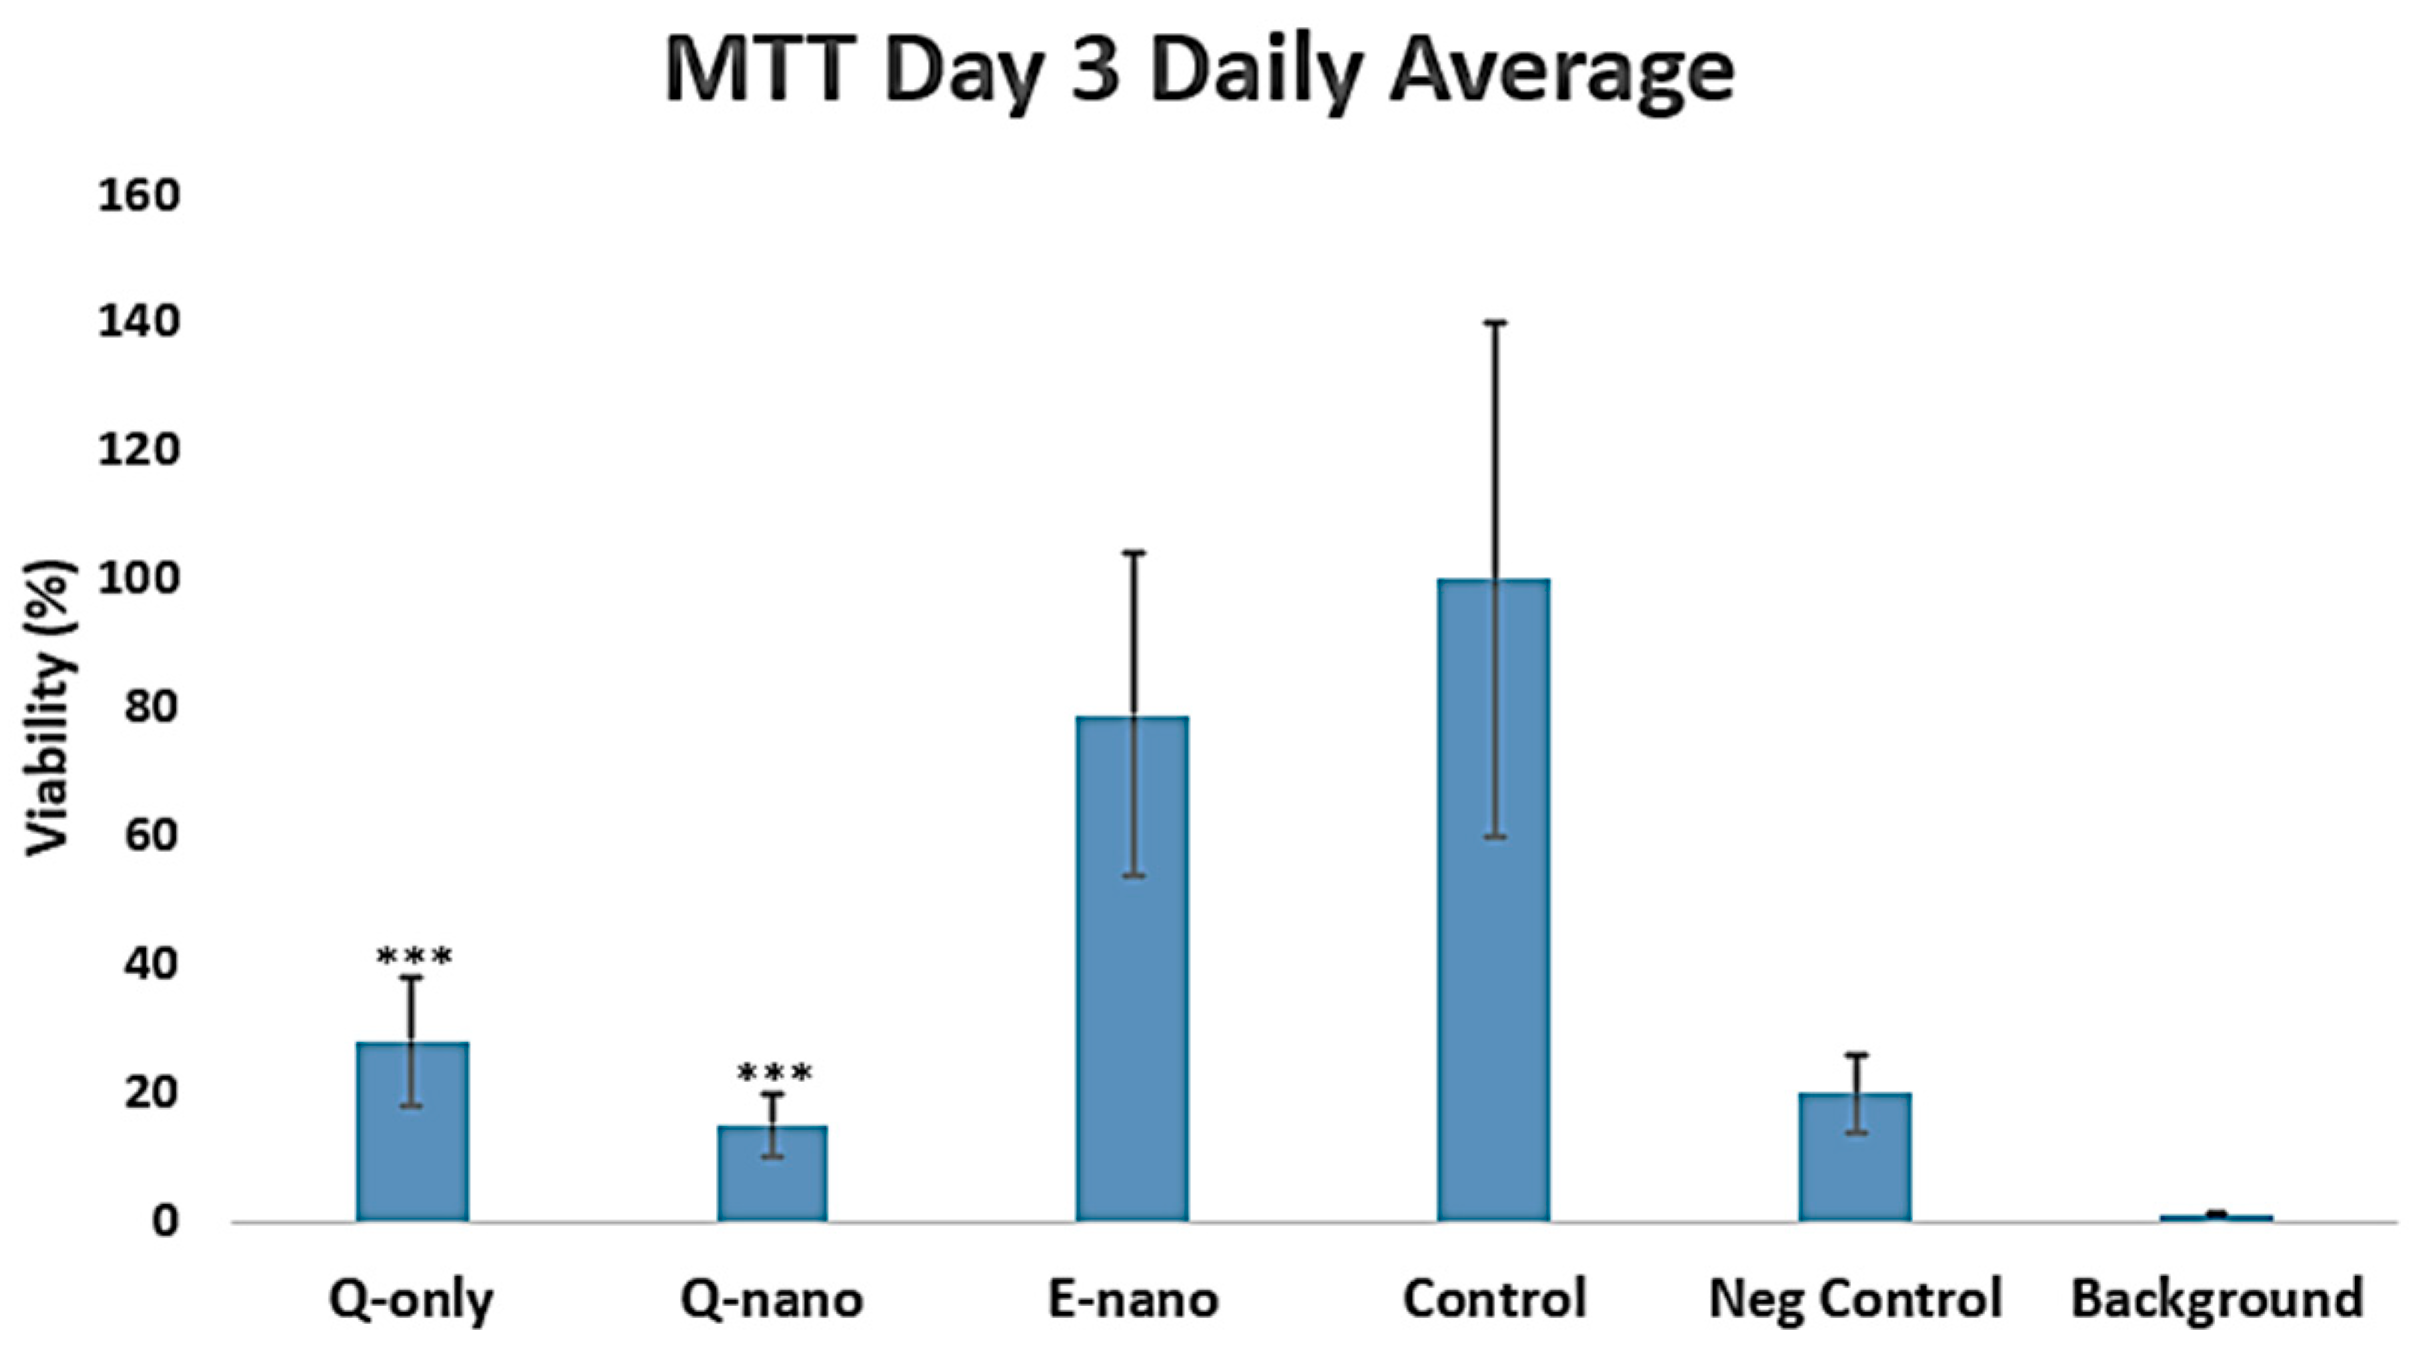
2.2.2. MTT Assay
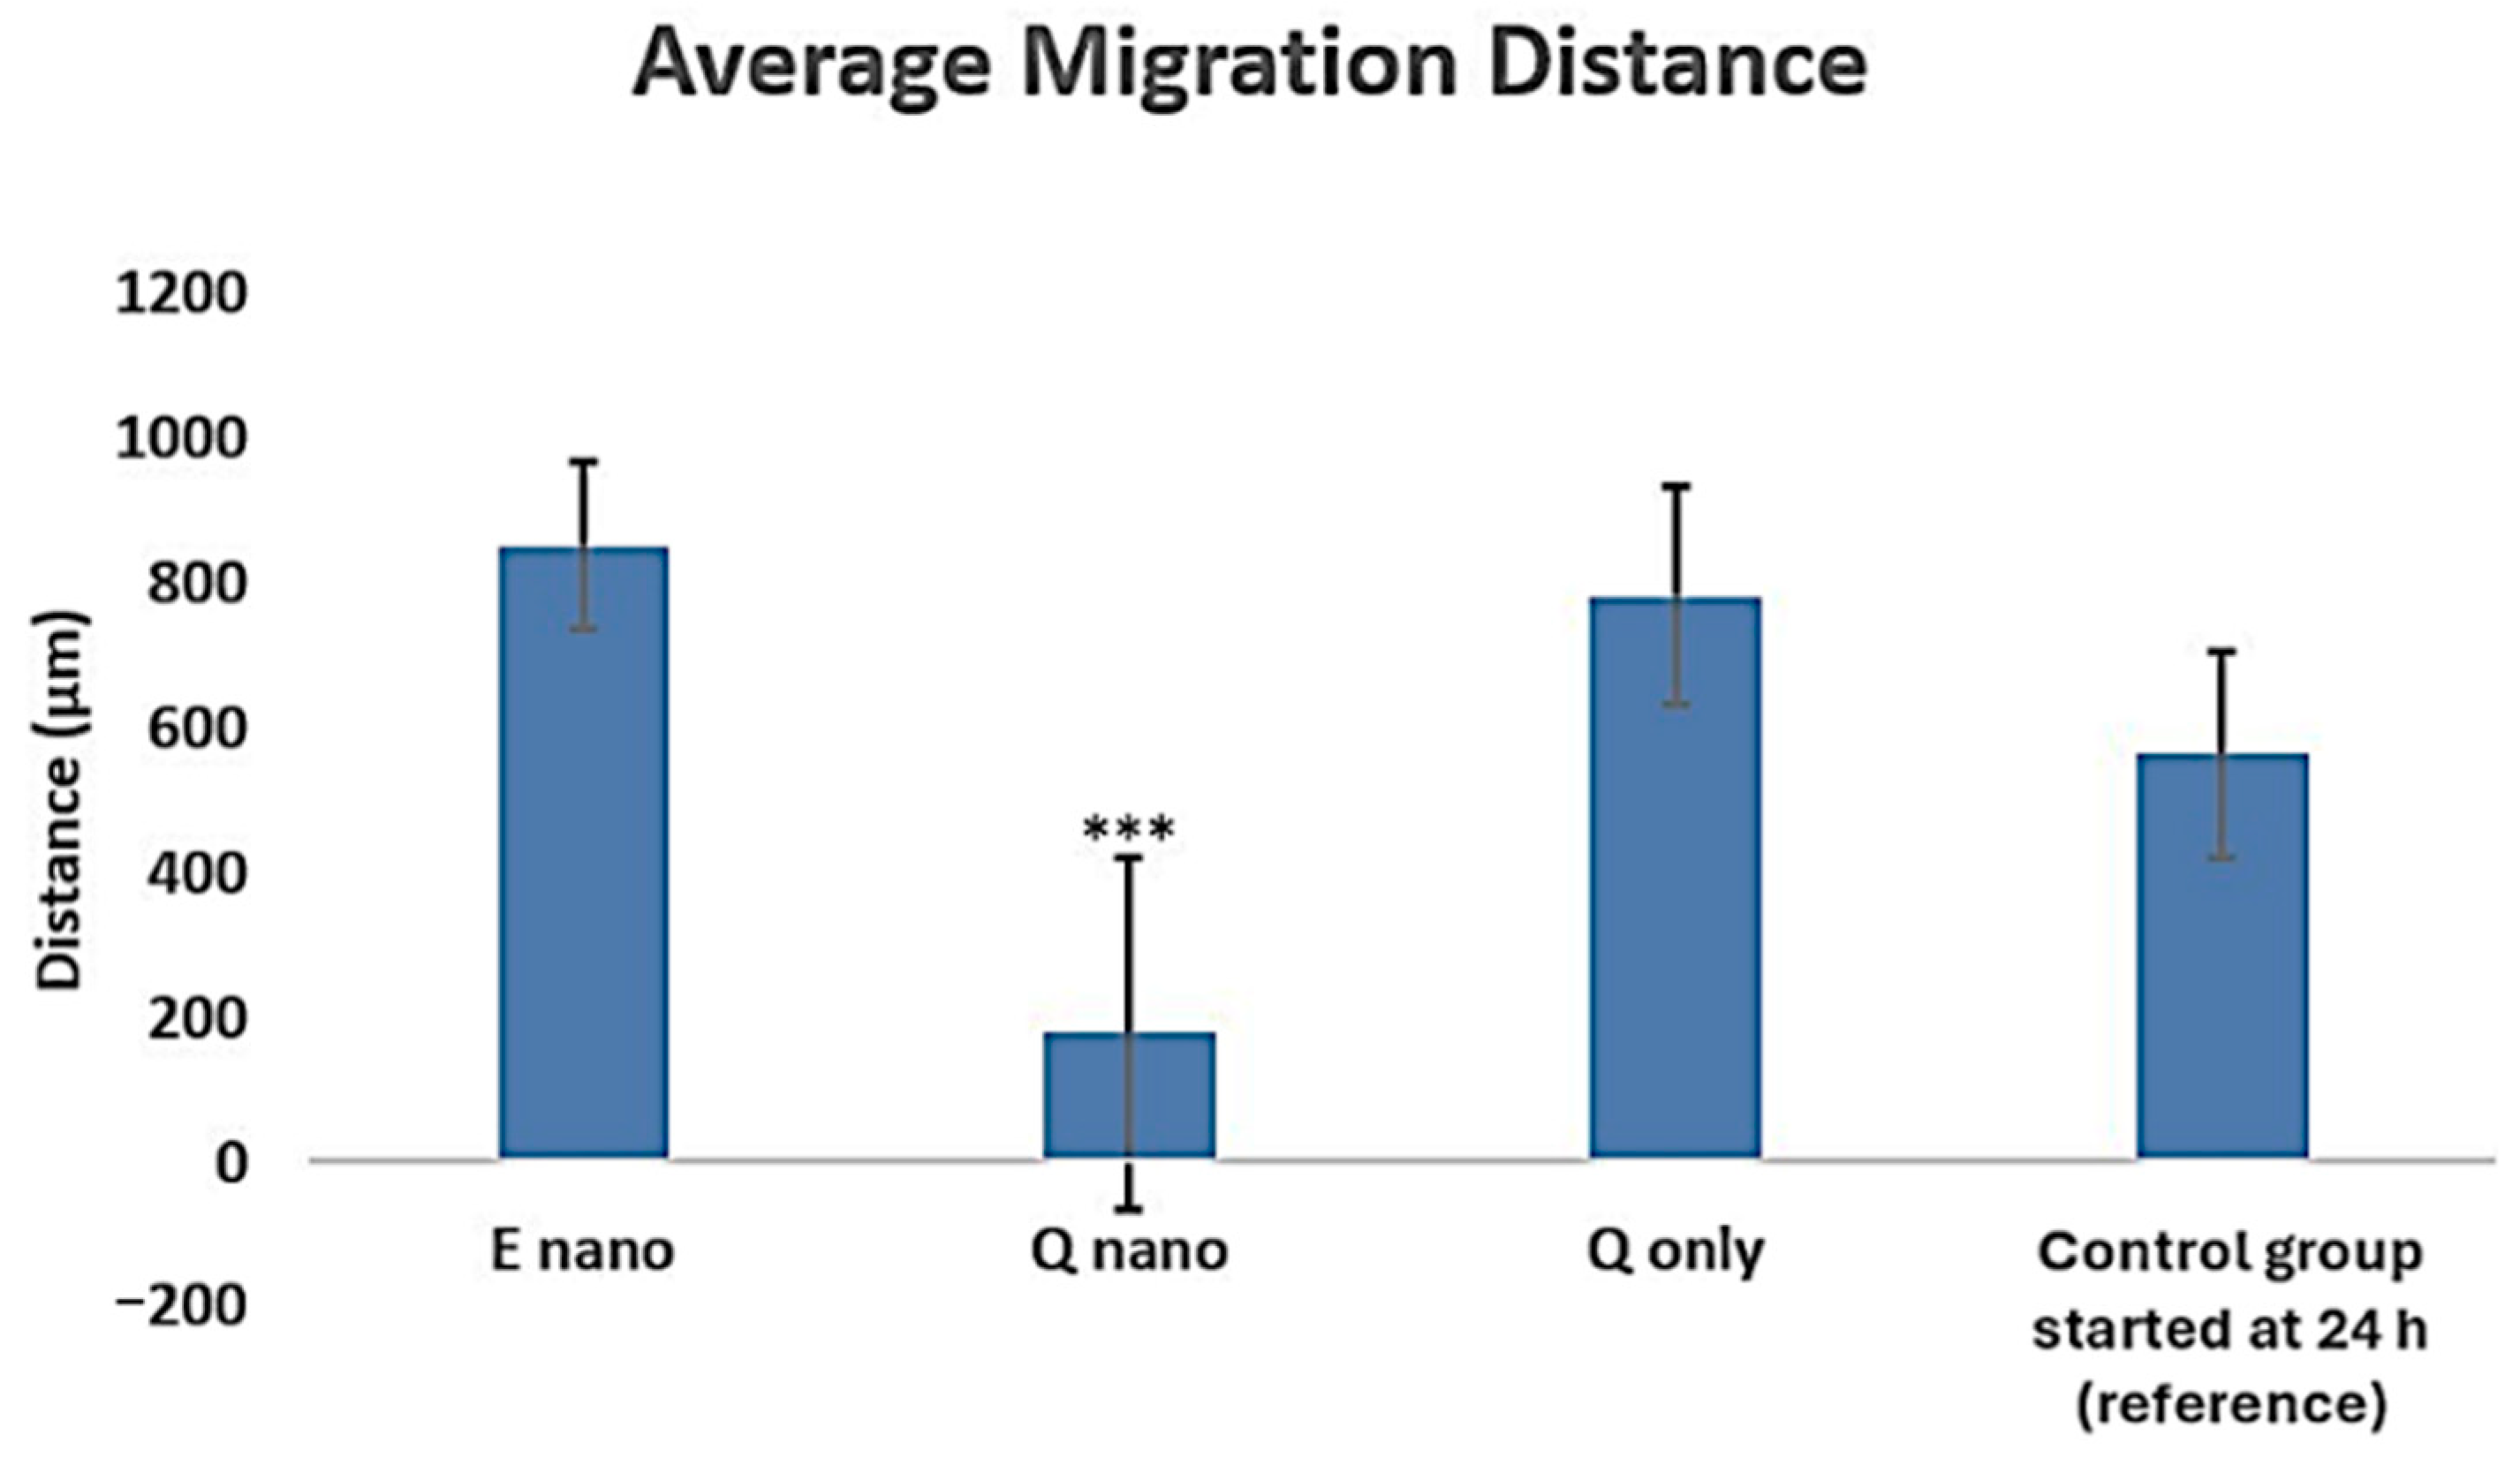
2.2.3. Scratch Test
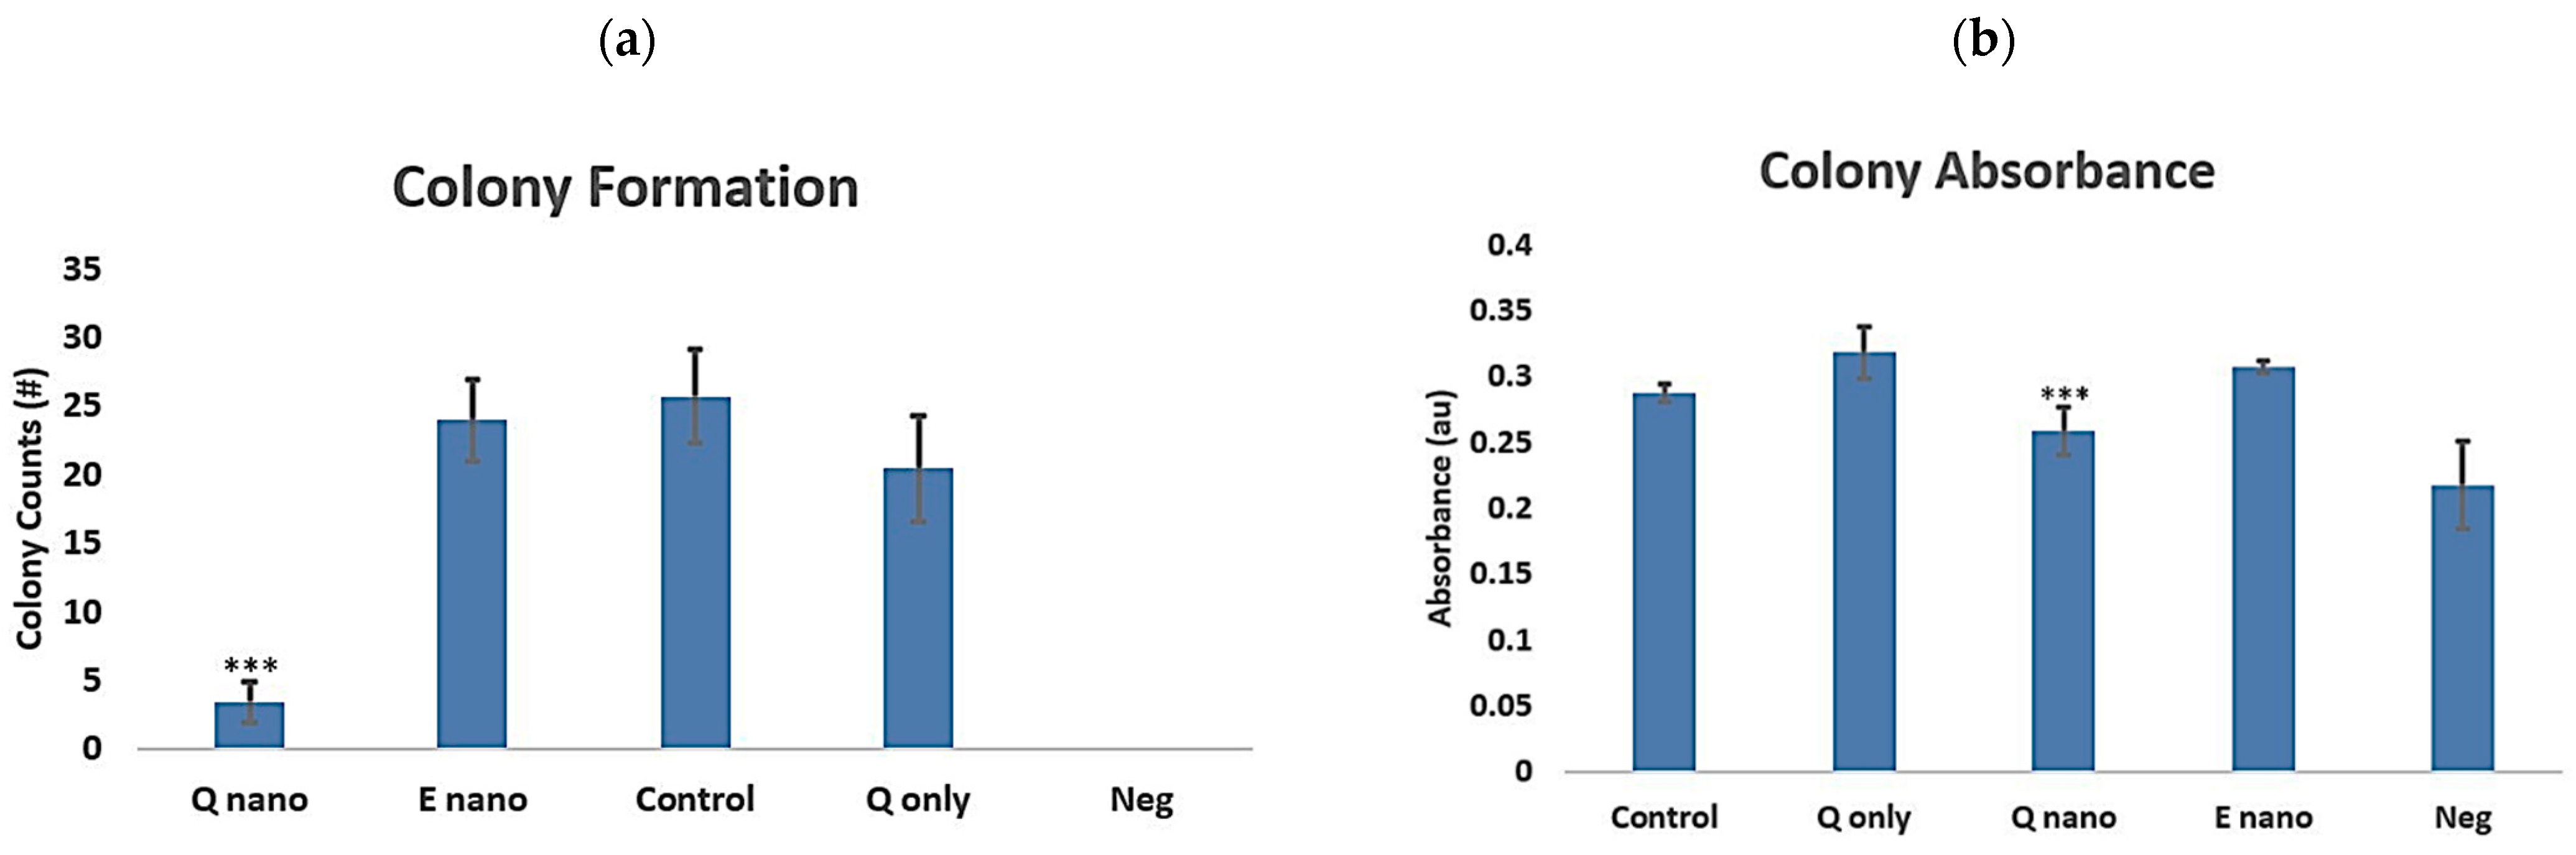
2.2.4. Colony Test
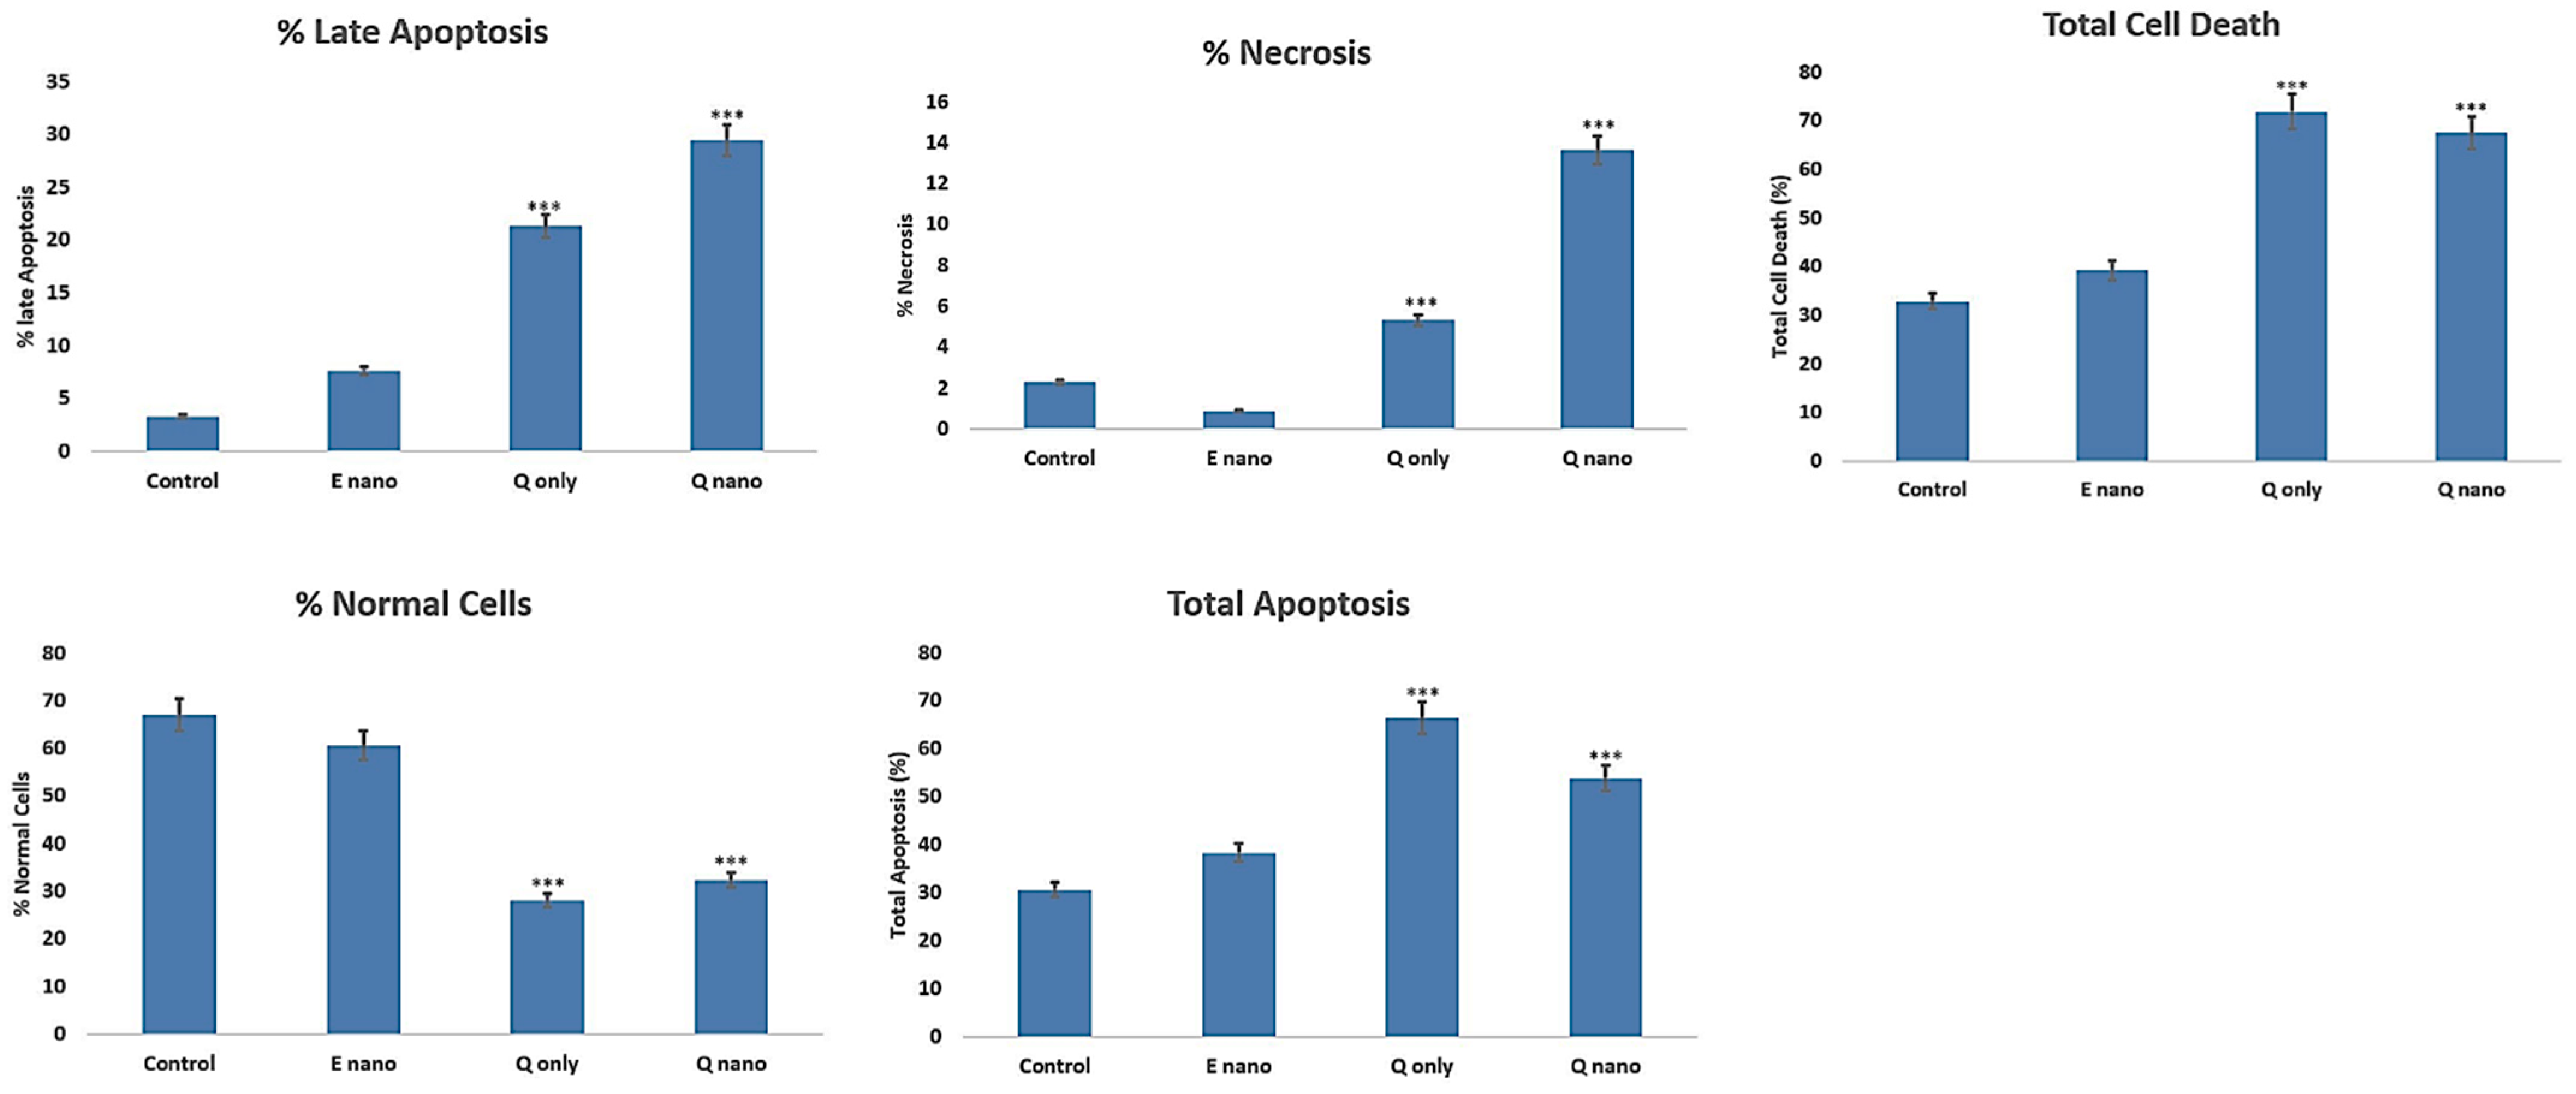
2.2.5. Annexin PI Dual Staining
2.2.6. Three-Dimensional Cell Culture Viability Study
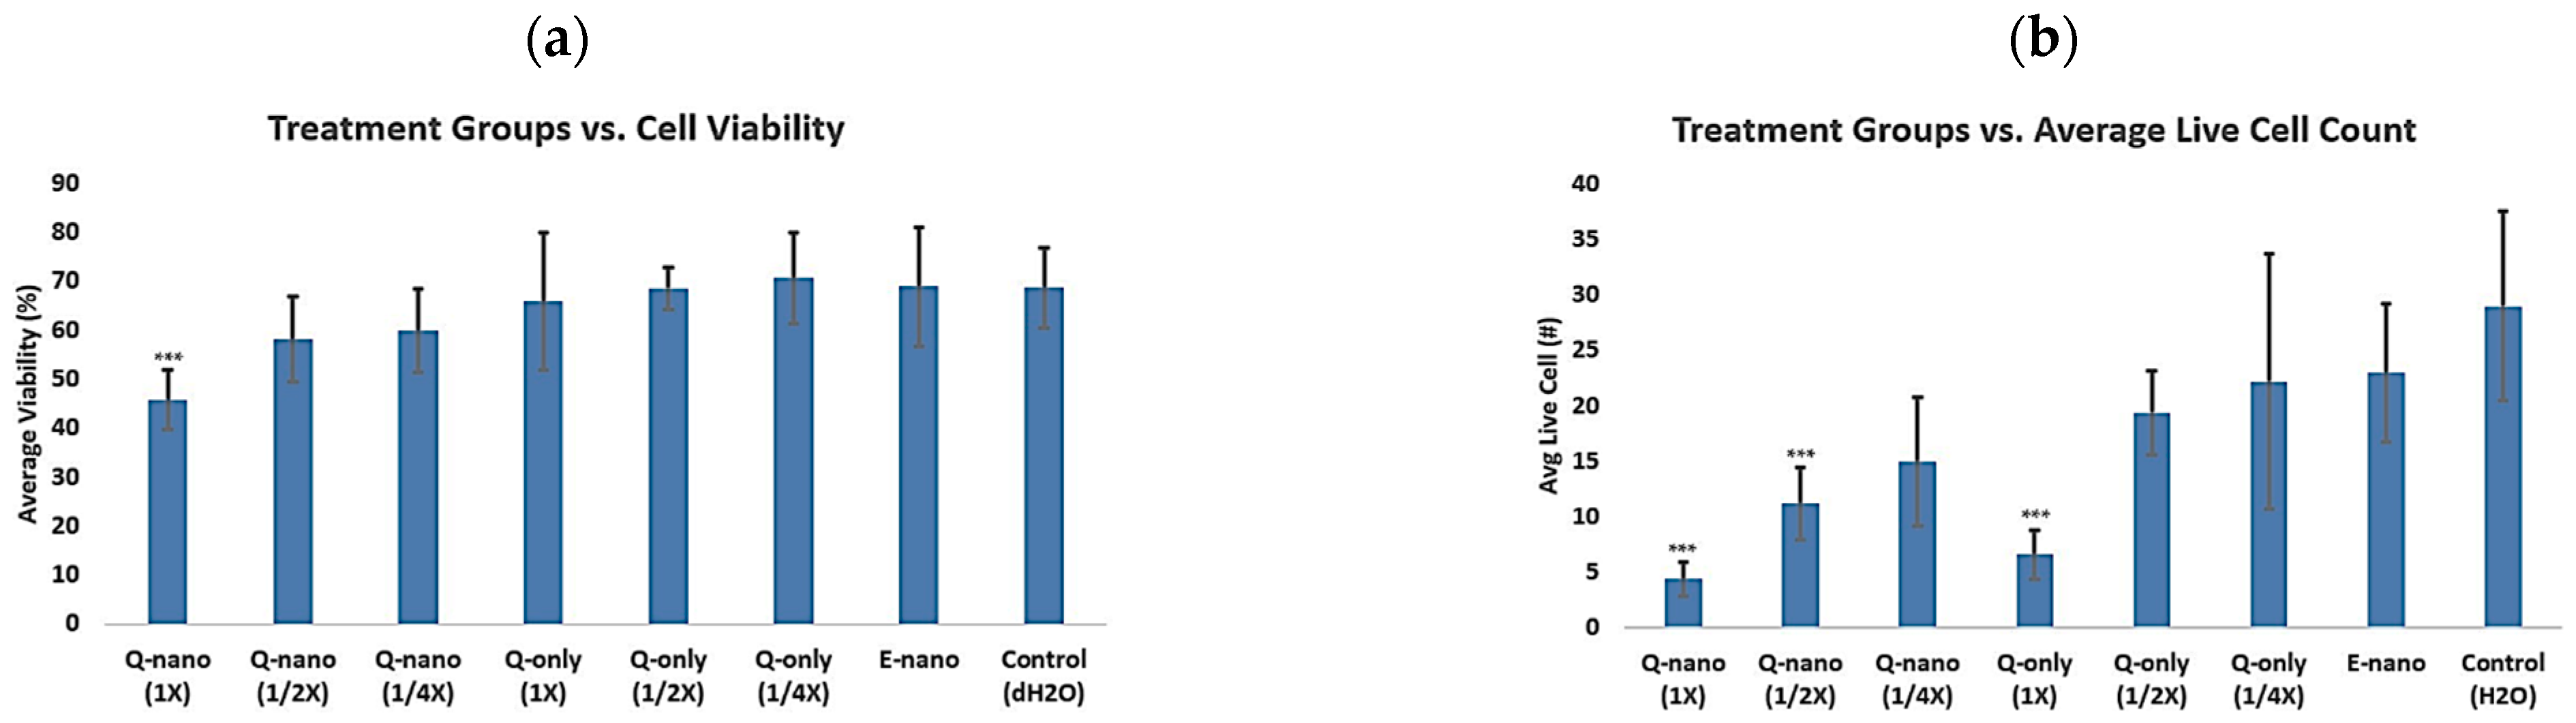
2.2.7. Multidose 3D Culture Study
2.3. Part 3—Effects of Quercetin Nanocapsules in the Human Sk-Mel-28 Melanoma Line
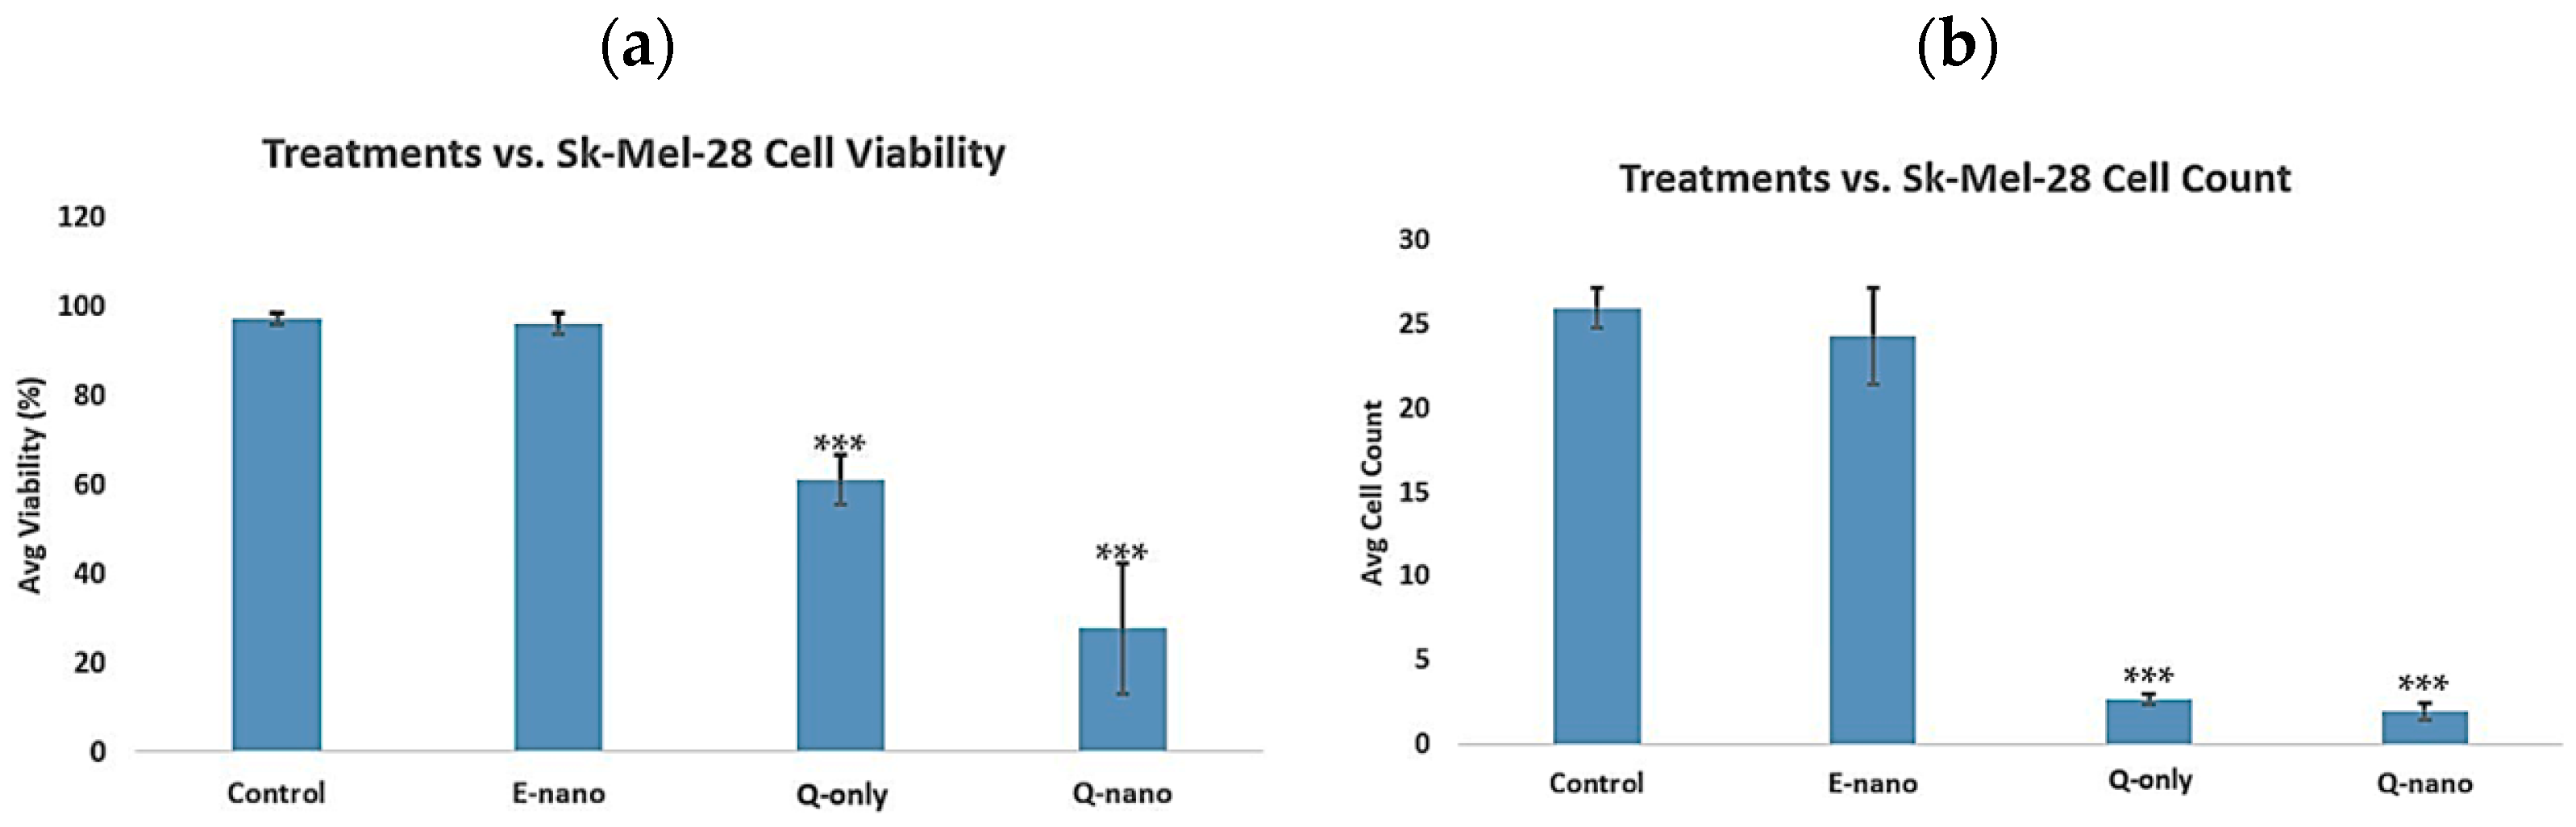
2.3.1. Two-Dimensional Cell Viability and Cell Count Assay
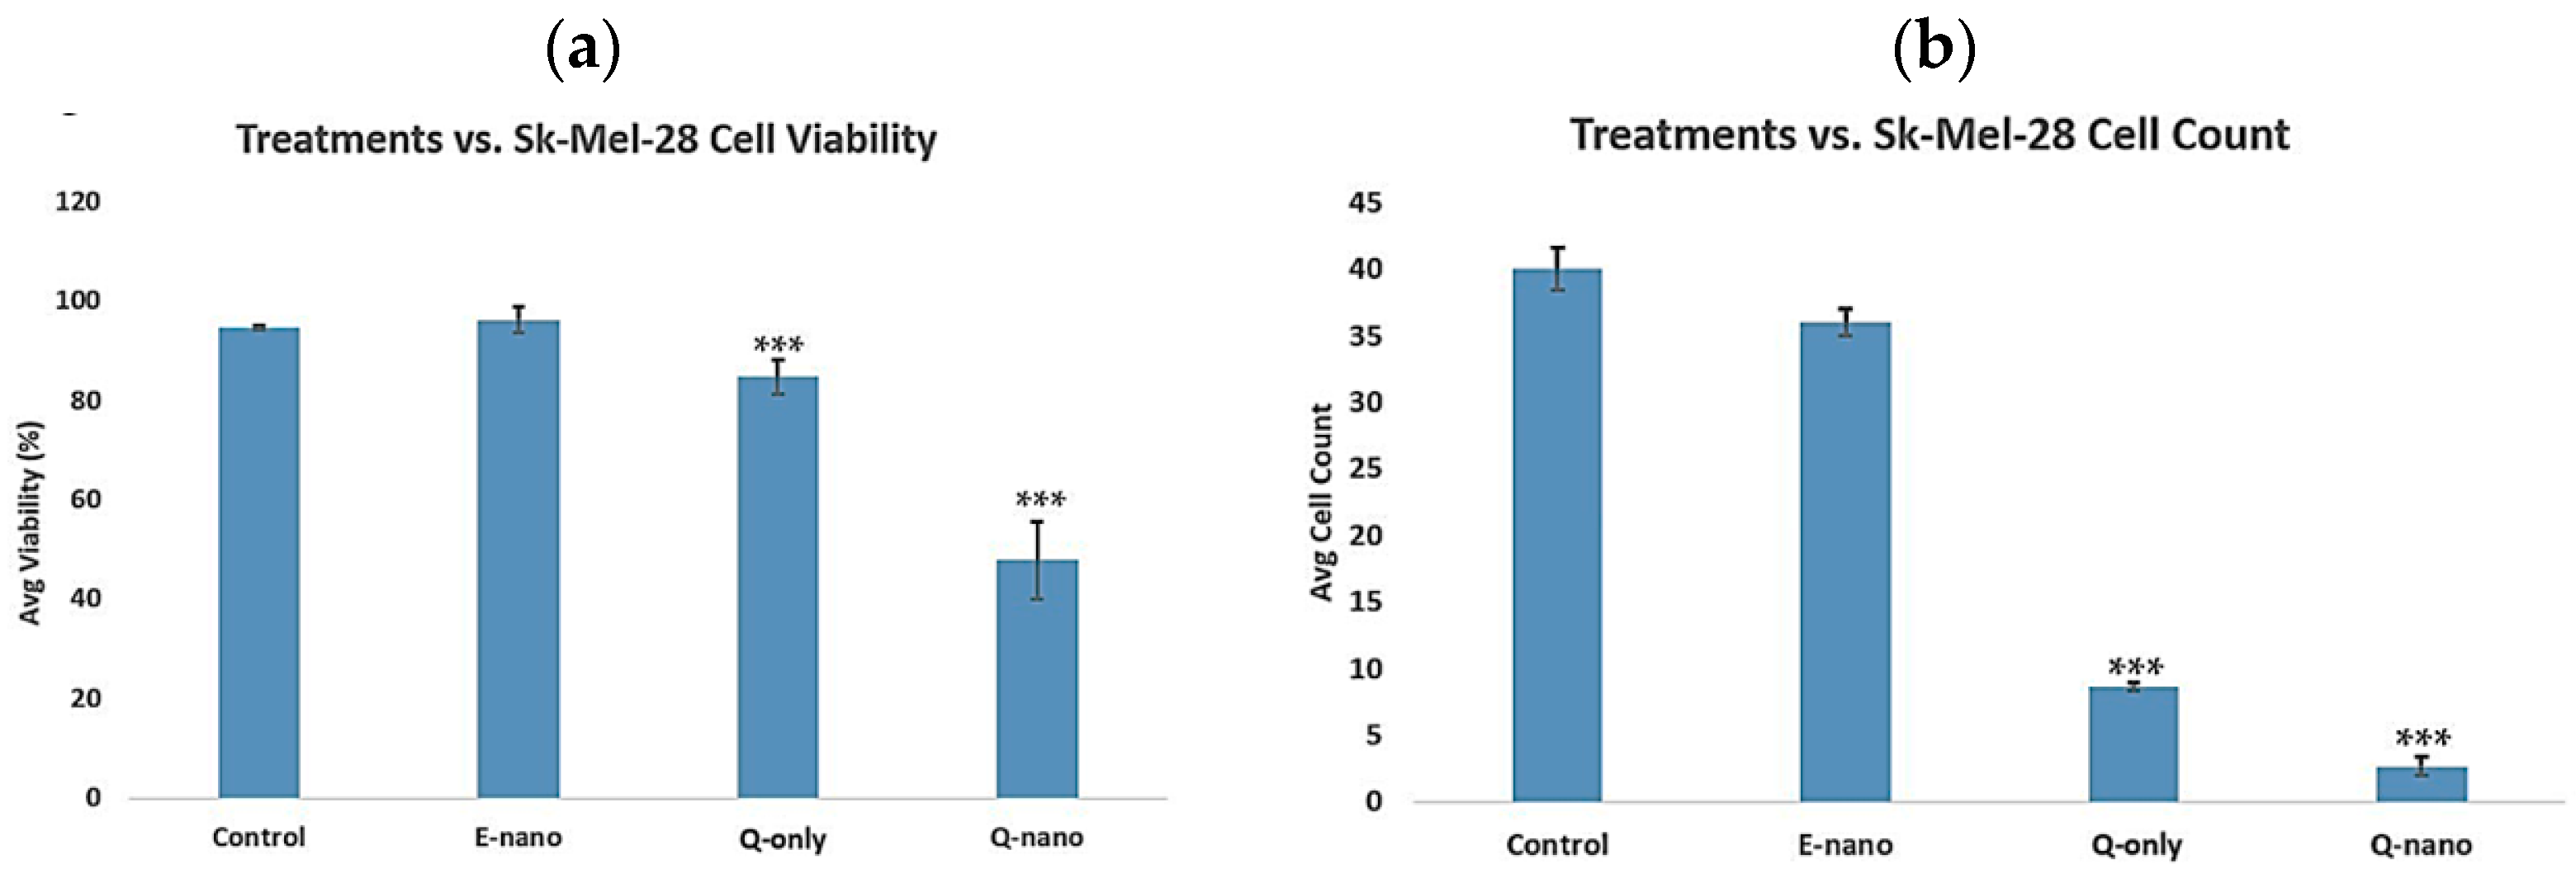
2.3.2. Three-Dimensional Cell Viability and Cell Count Assay
3. Discussion
4. Materials and Methods
4.1. Part 1—Nanocapsule Preparation and Properties
4.1.1. Polylactic-(Dl)-Acid Nanocapsule Preparation
4.1.2. Quercetin Nanocapsule Preparation
4.1.3. Concentration and Purification
4.1.4. Quercetin Nanocapsule Release at Different PH Levels
4.2. Part 2—Effects of Quercetin Nanocapsules on Melanoma Cell Lines
4.2.1. Tumour Cells and Culture Conditions
4.2.2. Two-Dimensional Cell Viability Assay
4.2.3. MTT Assay
4.2.4. Scratch Test
4.2.5. Colony Test
4.2.6. Annexin PI Dual Staining
4.2.7. Three-Dimensional Cell Culture Viability Study
4.2.8. Multidose 3D Culture Study
4.2.9. Data Analysis
5. Conclusions
Author Contributions
Funding
Institutional Review Board Statement
Informed Consent Statement
Data Availability Statement
Conflicts of Interest
References
- Júnior, R.G.; Ferraz, C.A.A.; e Silva, M.G.; de Lavor, É.M.; Rolim, L.A.; de Lima, J.T.; Fleury, A.; Picot, L.; de Souza Siqueira Quintans, L.; Júnior, L.J.Q.; et al. Flavonoids: Promising natural products for treatment of Skin cancer (melanoma). In Natural Products and Cancer Drug Discovery; IntechOpen: London, UK, 2017. [Google Scholar] [CrossRef]
- Harris, Z.; Donovan, M.G.; Branco, G.M.; Limesand, K.H.; Burd, R. Quercetin as an emerging anti-melanoma agent: A four-focus area therapeutic development strategy. Front. Nutr. 2016, 3, 48. [Google Scholar] [CrossRef] [PubMed]
- Vargas, A.J.; Sittadjody, S.; Thangasamy, T.; Mendoza, E.E.; Limesand, K.H.; Burd, R. Exploiting tyrosinase expression and activity in melanocytic tumors. Integr. Cancer Ther. 2011, 10, 328–340. [Google Scholar] [CrossRef] [PubMed]
- Thangasamy, T.; Sittadjody, S.; Lanza-Jacoby, S.; Wachsberger, P.R.; Limesand, K.H.; Burd, R. Quercetin selectively inhibits bioreduction and enhances apoptosis in melanoma cells that overexpress tyrosinase. Nutr. Cancer 2007, 59, 258–268. [Google Scholar] [CrossRef] [PubMed]
- Bharath, A.; Turner, R. Impact of climate change on skin cancer. J. R. Soc. Med. 2009, 102, 215–218. [Google Scholar] [CrossRef]
- Switzer, B.; Puzanov, I.; Skitzki, J.J.; Hamad, L.; Ernstoff, M.S. Managing metastatic melanoma in 2022: A clinical review. JCO Oncol. Pract. 2022, 18, 335–351. [Google Scholar] [CrossRef]
- Wang, Y.; Chang, T.M.S. A polymer–lipid membrane artificial cell nanocarrier containing enzyme–oxygen biotherapeutic inhibits the growth of B16F10 melanoma in 3D culture and in a mouse model. Artif. Cells Nanomed. Biotechnol. 2021, 49, 461–470. [Google Scholar] [CrossRef]
- Chang, T.M.S. ARTIFICIAL CELL evolves into nanomedicine, biotherapeutics, blood substitutes, drug delivery, enzyme/gene therapy, cancer therapy, cell/stem cell therapy, nanoparticles, liposomes, bioencapsulation, replicating synthetic cells, cell encapsulation/scaffold, biosorbent/immunosorbent haemoperfusion/plasmapheresis, regenerative medicine, encapsulated microbe, nanobiotechnology, nanotechnology. Artif. Cells Nanomed. Biotechnol. 2019, 47, 997–1013. [Google Scholar] [CrossRef]
- Wang, J.; Zhao, X.-H. Degradation kinetics of Fisetin and quercetin in solutions affected by medium ph, temperature and co-existed proteins. J. Serbian Chem. Soc. 2016, 81, 243–253. [Google Scholar] [CrossRef]
- Ramešová, Š.; Sokolová, R.; Degano, I.; Bulíčková, J.; Žabka, J.; Gál, M. On the stability of the bioactive flavonoids quercetin and luteolin under oxygen-free conditions. Anal. Bioanal. Chem. 2011, 402, 975–982. [Google Scholar] [CrossRef]
- Chang, T.M. Therapeutic applications of polymeric artificial cells. Nat. Rev. Drug Discov. 2005, 4, 221–235. [Google Scholar] [CrossRef]
- Chang, T.M.S. Artificial Cells: Biotechnology, Nanotechnology, Blood Substitutes, Regenerative Medicine, Bioencapsulation, Cell/Stem Cell Therapy; World Scientific: Singapore, 2007; Available online: https://www.mcgill.ca/artcell/files/artcell/2007_ebook_artcell_web.pdf (accessed on 18 June 2025).
- Chang, T.M. Editorial: Innovative Medical Technology based on artificial cells, including its different configurations. Front. Med. Technol. 2023, 5, 1306419. [Google Scholar] [CrossRef] [PubMed]
- Akbarzadeh, A.; Rezaei-Sadabady, R.; Davaran, S.; Joo, S.W.; Zarghami, N.; Hanifehpour, Y.; Samiei, M.; Kouhi, M.; Nejati-Koshki, K. Liposome: Classification, preparation, and applications. Nanoscale Res. Lett. 2013, 8, 102. [Google Scholar] [CrossRef]
- Sogias, I.A.; Williams, A.C.; Khutoryanskiy, V.V. Chitosan-based mucoadhesive tablets for oral delivery of Ibuprofen. Int. J. Pharm. 2012, 436, 602–610. [Google Scholar] [CrossRef] [PubMed]
- Zhang, L.; Gu, F.; Chan, J.; Wang, A.; Langer, R.S.; Farokhzad, O.C. Nanoparticles in medicine: Therapeutic applications and developments. Clin. Pharmacol. Ther. 2007, 83, 761–769. [Google Scholar] [CrossRef] [PubMed]
- Zhao, C.; Chang, T.M. Superparamagnetic polyhemoglobin-tyrosinase nanocapsules: A novel biotherapeutic with enhanced tumor suppression with control by external magnetic field. Front. Bioeng. Biotechnol. 2025, 13, 1562145. [Google Scholar] [CrossRef] [PubMed]
- Ghasemi, S.; Ahmadi, L.; Farjadian, F. Thermo-responsive pnipaam-B-pla amphiphilic block Copolymer Micelle as nanoplatform for Docetaxel Drug Release. J. Mater. Sci. 2022, 57, 17433–17447. [Google Scholar] [CrossRef]
- Patel, D.H.; Sharma, N. Inhibitory effect of quercetin on epithelial to mesenchymal transition in SK-MEL-28 human melanoma cells defined by in vitro analysis on 3D collagen gels. OncoTargets Targets Ther. 2016, 9, 6445–6459. [Google Scholar] [CrossRef]
- Sitia, L.; Ferrari, R.; Violatto, M.B.; Talamini, L.; Dragoni, L.; Colombo, C.; Colombo, L.; Lupi, M.; Ubezio, P.; D’iNcalci, M.; et al. Fate of PLA and PCL-based polymeric nanocarriers in cellular and animal models of triple-negative breast cancer. Biomacromolecules 2016, 17, 744–755. [Google Scholar] [CrossRef]
- Alippilakkotte, S.; Sreejith, L. Pectin mediated synthesis of curcumin loaded poly(lactic acid) nanocapsules for cancer treatment. J. Drug Deliv. Sci. Technol. 2018, 48, 66–74. [Google Scholar] [CrossRef]
- Zhang, J.; Tao, W.; Chen, Y.; Chang, D.; Wang, T.; Zhang, X.; Mei, L.; Zeng, X.; Huang, L. Doxorubicin-loaded star-shaped copolymer PLGA-vitamin E TPGS nanoparticles for lung cancer therapy. J. Mater. Sci. Mater. Med. 2015, 26, 165. [Google Scholar] [CrossRef]
- Da Luz, C.M.; Boyles, M.S.P.; Falagan-Lotsch, P.; Pereira, M.R.; Tutumi, H.R.; Santos, E.d.O.; Martins, N.B.; Himly, M.; Sommer, A.; Foissner, I.; et al. Poly-lactic acid nanoparticles (PLA-NP) promote physiological modifications in lung epithelial cells and are internalized by clathrin-coated pits and lipid rafts. J. Nanobiotechnol. 2017, 15, 11. [Google Scholar] [CrossRef] [PubMed]
- Hussain, M.; Khan, S.M.; Shafiq, M.; Abbas, N. A review on PLA-based biodegradable materials for biomedical applications. Giant 2024, 18, 100261. [Google Scholar] [CrossRef]
- da Silva, D.; Kaduri, M.; Poley, M.; Adir, O.; Krinsky, N.; Shainsky-Roitman, J.; Schroeder, A. Biocompatibility, biodegradation and excretion of polylactic acid (PLA) in medical implants and theranostic systems. Chem. Eng. J. 2018, 340, 9–14. [Google Scholar] [CrossRef]
- Frenț, O.-D.; Stefan, L.; Morgovan, C.M.; Duteanu, N.; Dejeu, I.L.; Marian, E.; Vicaș, L.; Manole, F. A systematic review: Quercetin—Secondary metabolite of the flavonol class, with multiple health benefits and low bioavailability. Int. J. Mol. Sci. 2024, 25, 12091. [Google Scholar] [CrossRef]
- Kapałczyńska, M.; Kolenda, T.; Przybyła, W.; Zajączkowska, M.; Teresiak, A.; Filas, V.; Ibbs, M.; Bliźniak, R.; Łuczewski, L.; Lamperska, K. 2D and 3D cell cultures—A comparison of different types of cancer cell cultures. Arch. Med. Sci. 2018, 14, 910–919. [Google Scholar] [CrossRef]
- Lie, K.C.; Bonturi, C.R.; Salu, B.R.; de Oliveira, J.R.; Galo, M.B.; Paiva, P.M.G.; Correia, M.T.d.S.; Oliva, M.L.V. Impairment of SK-mel-28 development—A human melanoma cell line—By the CRATAEVA tapia bark lectin and its sequence-derived peptides. Int. J. Mol. Sci. 2023, 24, 10617. [Google Scholar] [CrossRef]
- Nasimi, H.; Madsen, J.S.; Zedan, A.H.; Schmedes, A.V.; Malmendal, A.; Osther, P.J.S.; Alatraktchi, F.A. Correlation between stage of prostate cancer and tyrosine and tryptophan in urine samples measured electrochemically. Anal. Biochem. 2022, 649, 114698. [Google Scholar] [CrossRef] [PubMed]
- Hao, G.; Xu, Z.P.; Li, L. Manipulating extracellular tumour pH: An effective target for cancer therapy. RSC Adv. 2018, 8, 22182–22192. [Google Scholar] [CrossRef]

| Samples | Quercetin PLA Nanocapsules (100 nm, 700 rpm) | Quercetin PLA Nanocapsules (400 nm, 400 rpm) |
|---|---|---|
| Encapsulation efficiency (%) | 46% | 49% |
| Peak release (μg/mL/day) | 8.39 (pH 7.4 PBS) 8.29 (pH 6.4 PBS) | 4.64 (pH 7.4 PBS) 4.57 (pH 6.4 PBS) |
| Time required to reach peak release (h) | 288 (pH 7.4 PBS) 432 (pH 6.4 PBS) | 360 (pH 7.4 PBS) 408 (pH 6.4 PBS) |
Disclaimer/Publisher’s Note: The statements, opinions and data contained in all publications are solely those of the individual author(s) and contributor(s) and not of MDPI and/or the editor(s). MDPI and/or the editor(s) disclaim responsibility for any injury to people or property resulting from any ideas, methods, instructions or products referred to in the content. |
© 2025 by the authors. Licensee MDPI, Basel, Switzerland. This article is an open access article distributed under the terms and conditions of the Creative Commons Attribution (CC BY) license (https://creativecommons.org/licenses/by/4.0/).
Share and Cite
Zhao, C.; Chang, T.M.S. Biodegradable Polylactide Nanocapsules Containing Quercetin for In Vitro Suppression of Mouse B16F10 and Human Sk-Mel-28 Melanoma Cell Lines. Pharmaceuticals 2025, 18, 980. https://doi.org/10.3390/ph18070980
Zhao C, Chang TMS. Biodegradable Polylactide Nanocapsules Containing Quercetin for In Vitro Suppression of Mouse B16F10 and Human Sk-Mel-28 Melanoma Cell Lines. Pharmaceuticals. 2025; 18(7):980. https://doi.org/10.3390/ph18070980
Chicago/Turabian StyleZhao, Chenhui, and Thomas Ming Swi Chang. 2025. "Biodegradable Polylactide Nanocapsules Containing Quercetin for In Vitro Suppression of Mouse B16F10 and Human Sk-Mel-28 Melanoma Cell Lines" Pharmaceuticals 18, no. 7: 980. https://doi.org/10.3390/ph18070980
APA StyleZhao, C., & Chang, T. M. S. (2025). Biodegradable Polylactide Nanocapsules Containing Quercetin for In Vitro Suppression of Mouse B16F10 and Human Sk-Mel-28 Melanoma Cell Lines. Pharmaceuticals, 18(7), 980. https://doi.org/10.3390/ph18070980