

Development of a Novel Drug Delivery System “Nanoemulfoam” for Topical Delivery of Terbinafine Hydrochloride as a Repurposed Therapy in Skin Cancer: Formulation, Optimization, In Vitro Characterization, Ex Vivo Transdermal Permeability, Cytotoxicity Studies, and In Silico Assessment

 ,
,  , , and
Abstract

1. Introduction
2. Results and Discussion
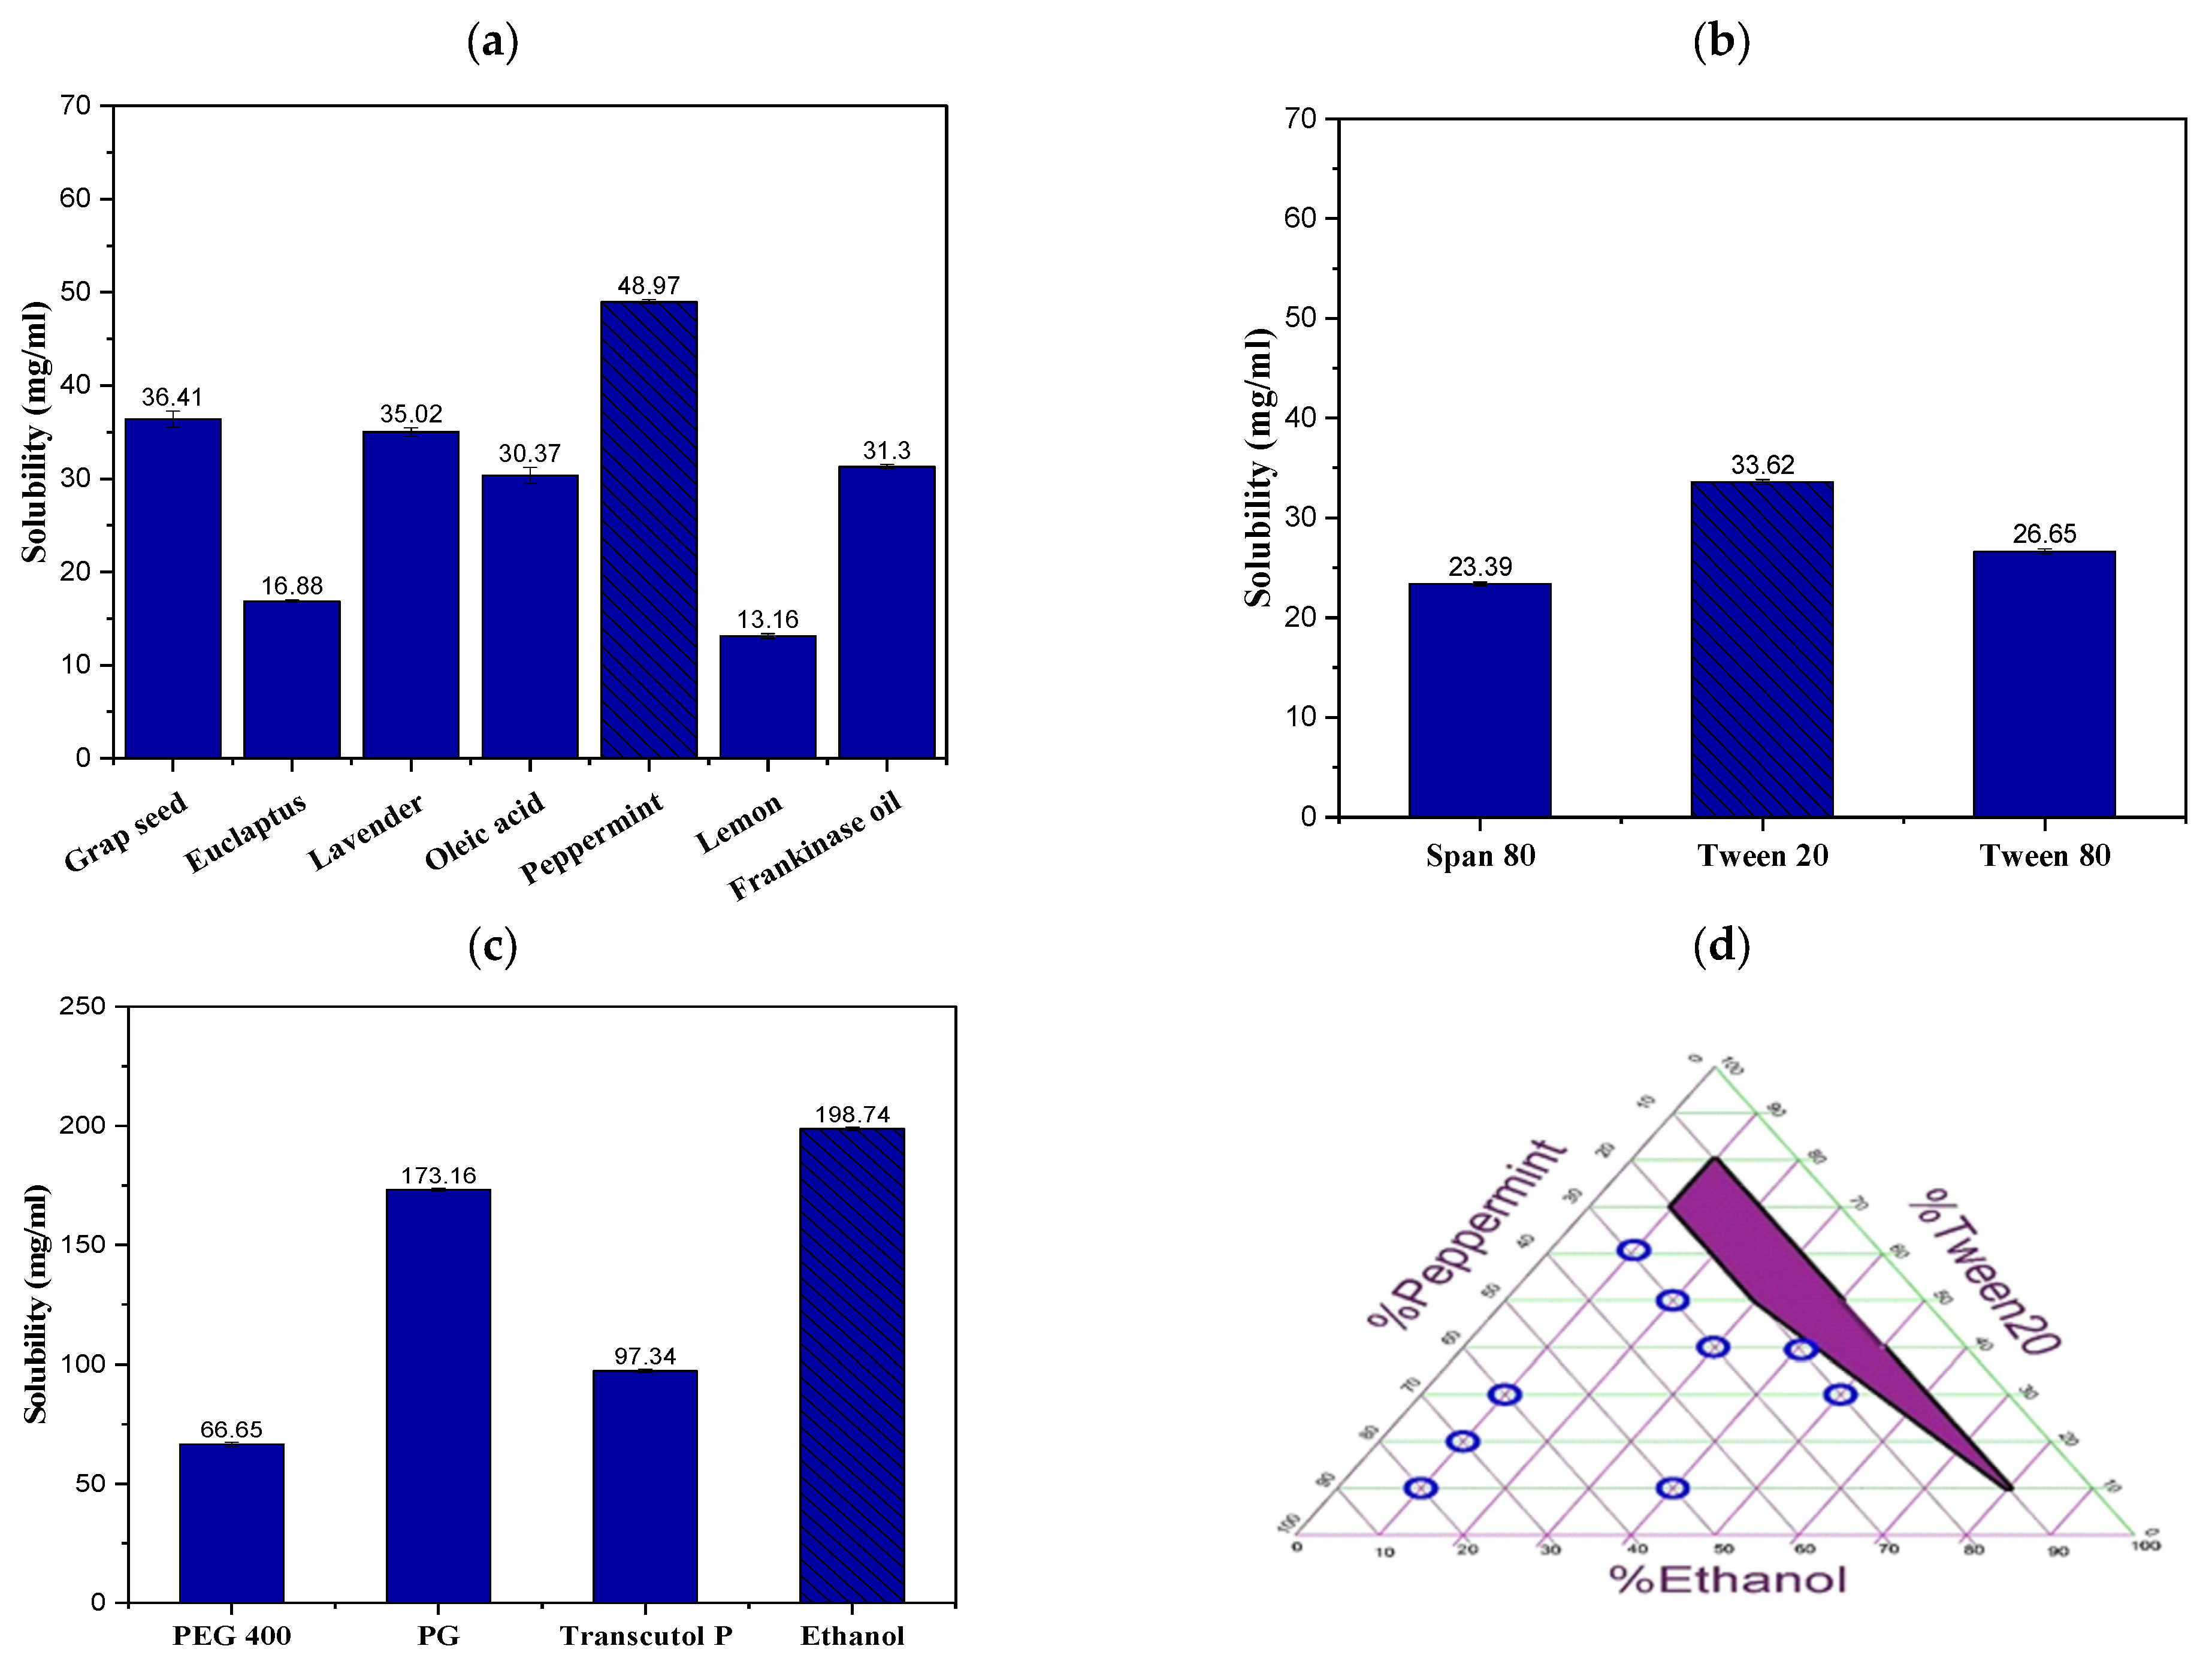
2.1. Solubility Study of TRB in NE Formulation Constituents
2.2. Construction of the Ternary Phase Diagram
2.3. Thermodynamic Stability Tests
2.4. Experimental Statistical Analysis
2.4.1. Variables Influence on the PS (Y1)
2.4.2. Variables Influence on the ZP (Y2)
2.4.3. Variables Influence on the DE% (Y3)
2.5. Optimization and Validation of Variables
2.6. In Vitro Characterization of the Optimum TRB-Loaded NE Formula
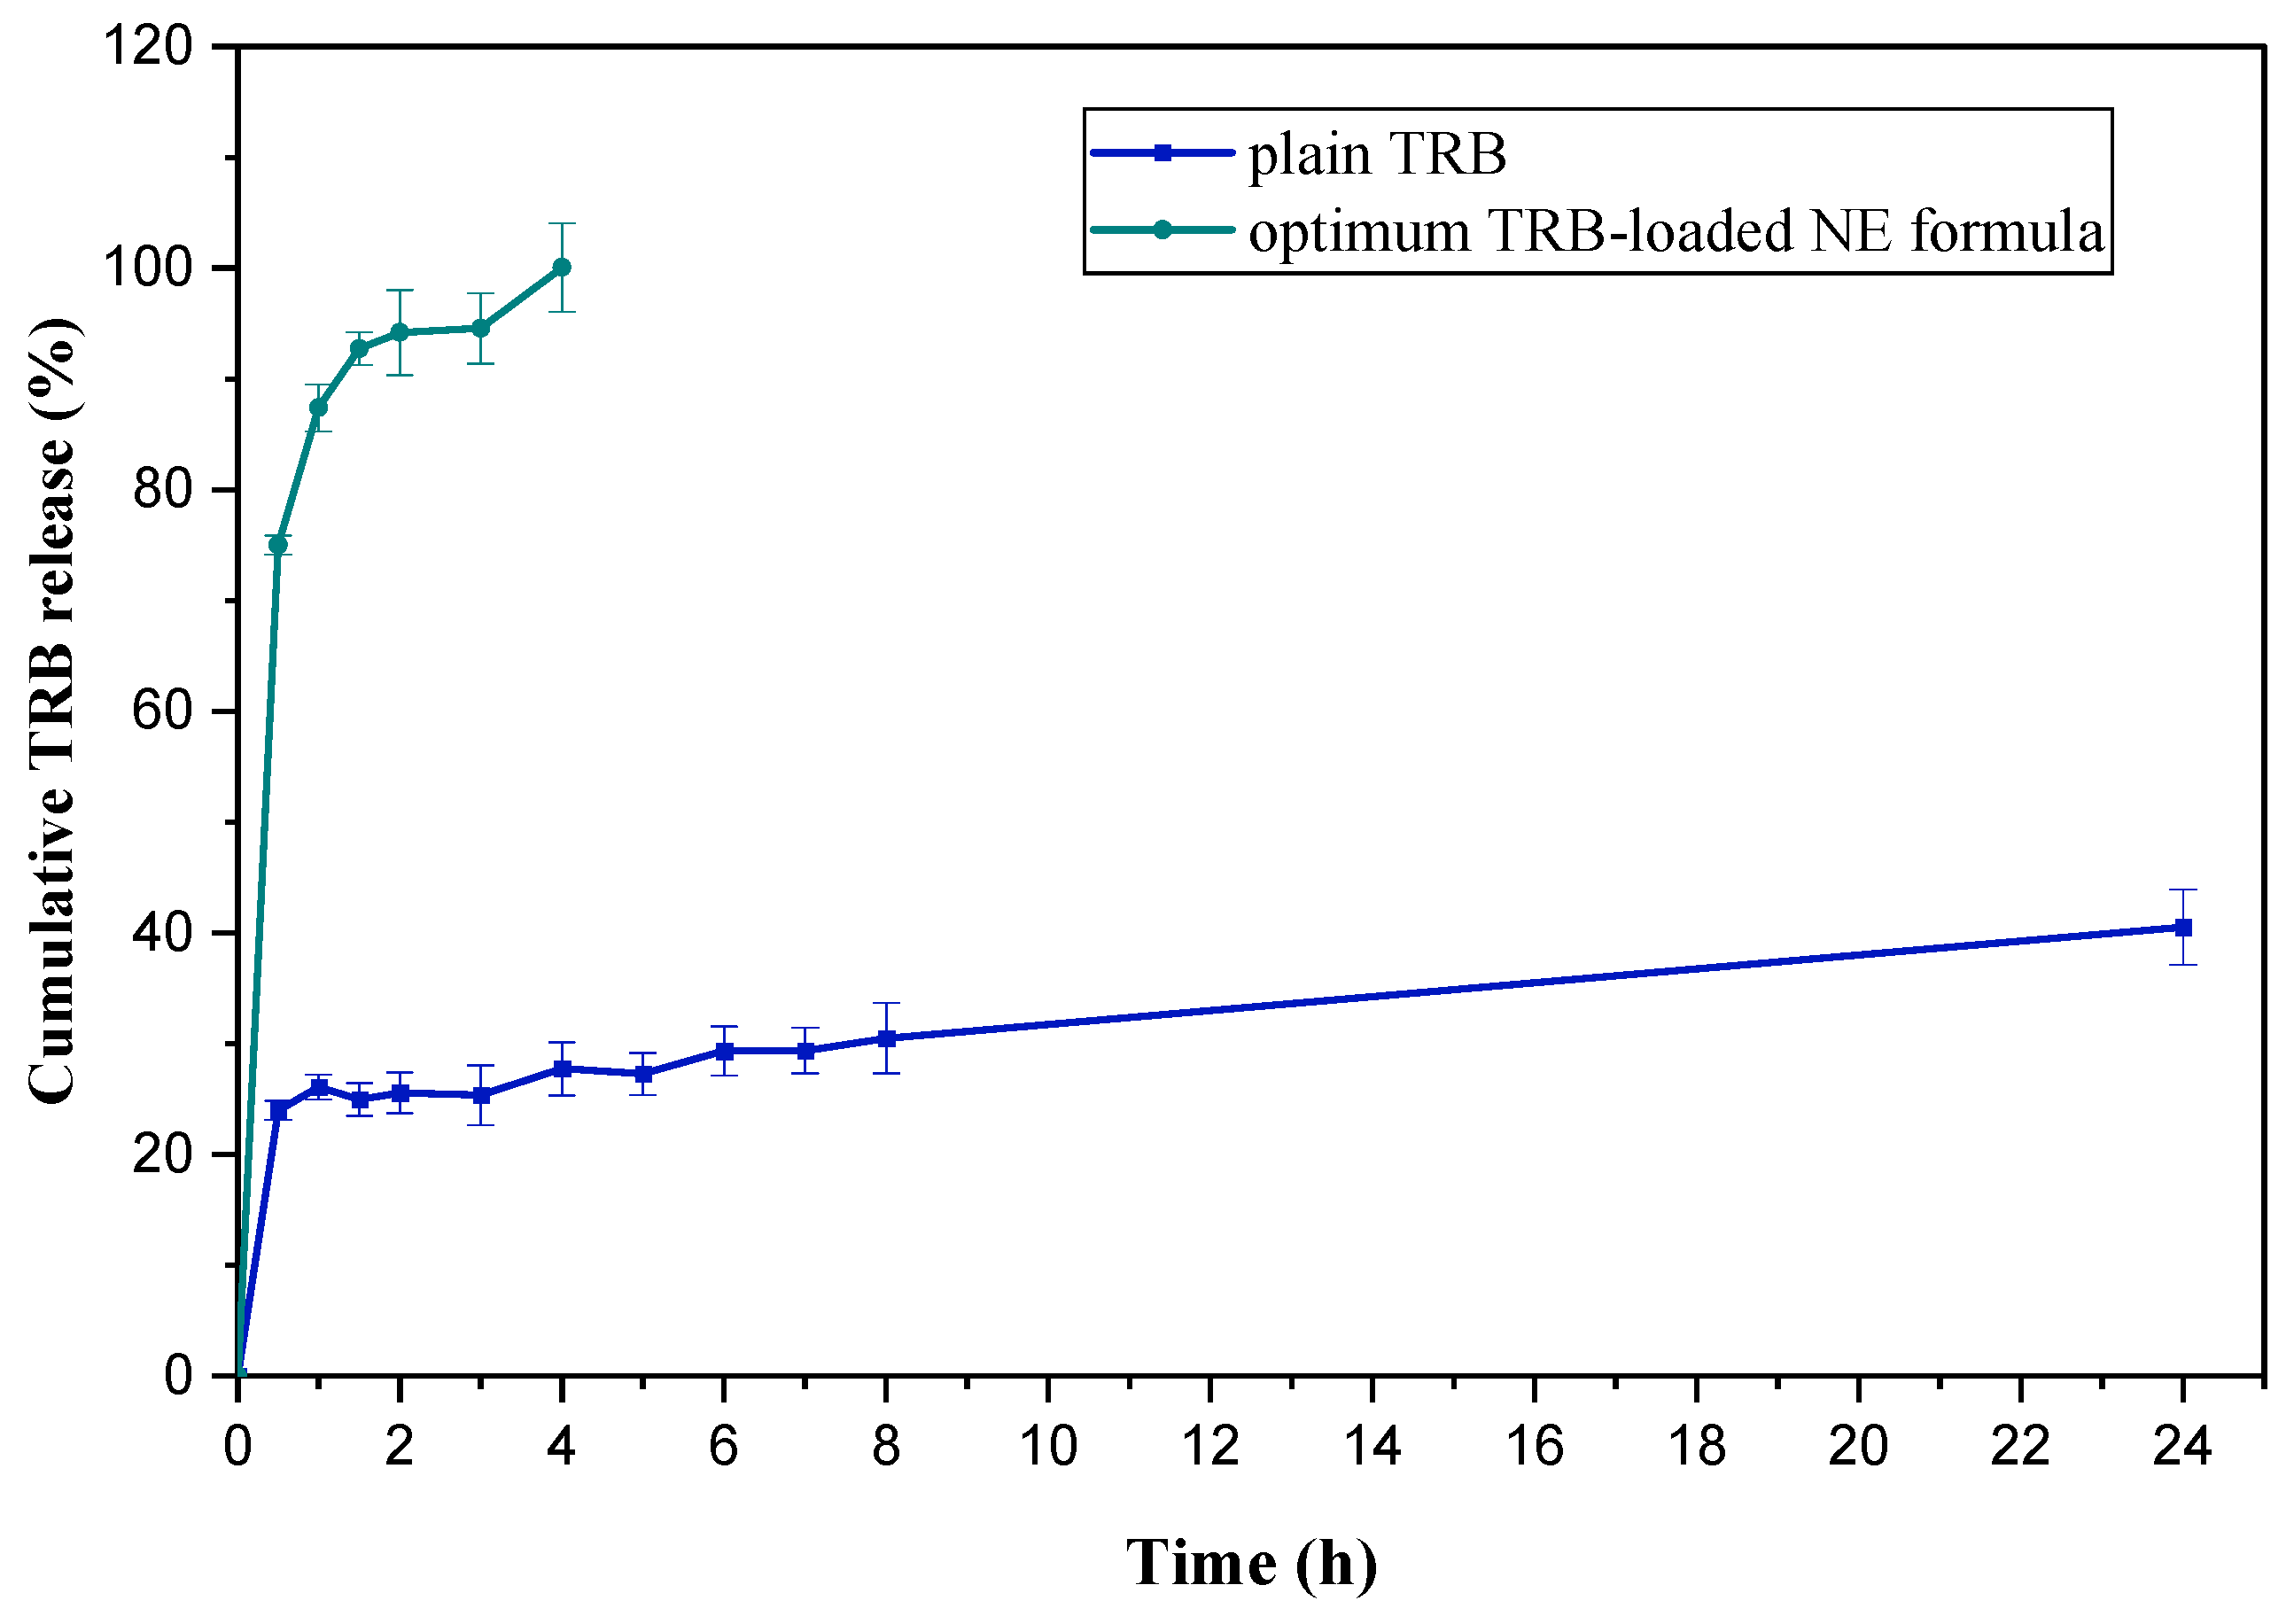
2.6.1. In Vitro Cumulative Release Study of TRB-Loaded NE Formula
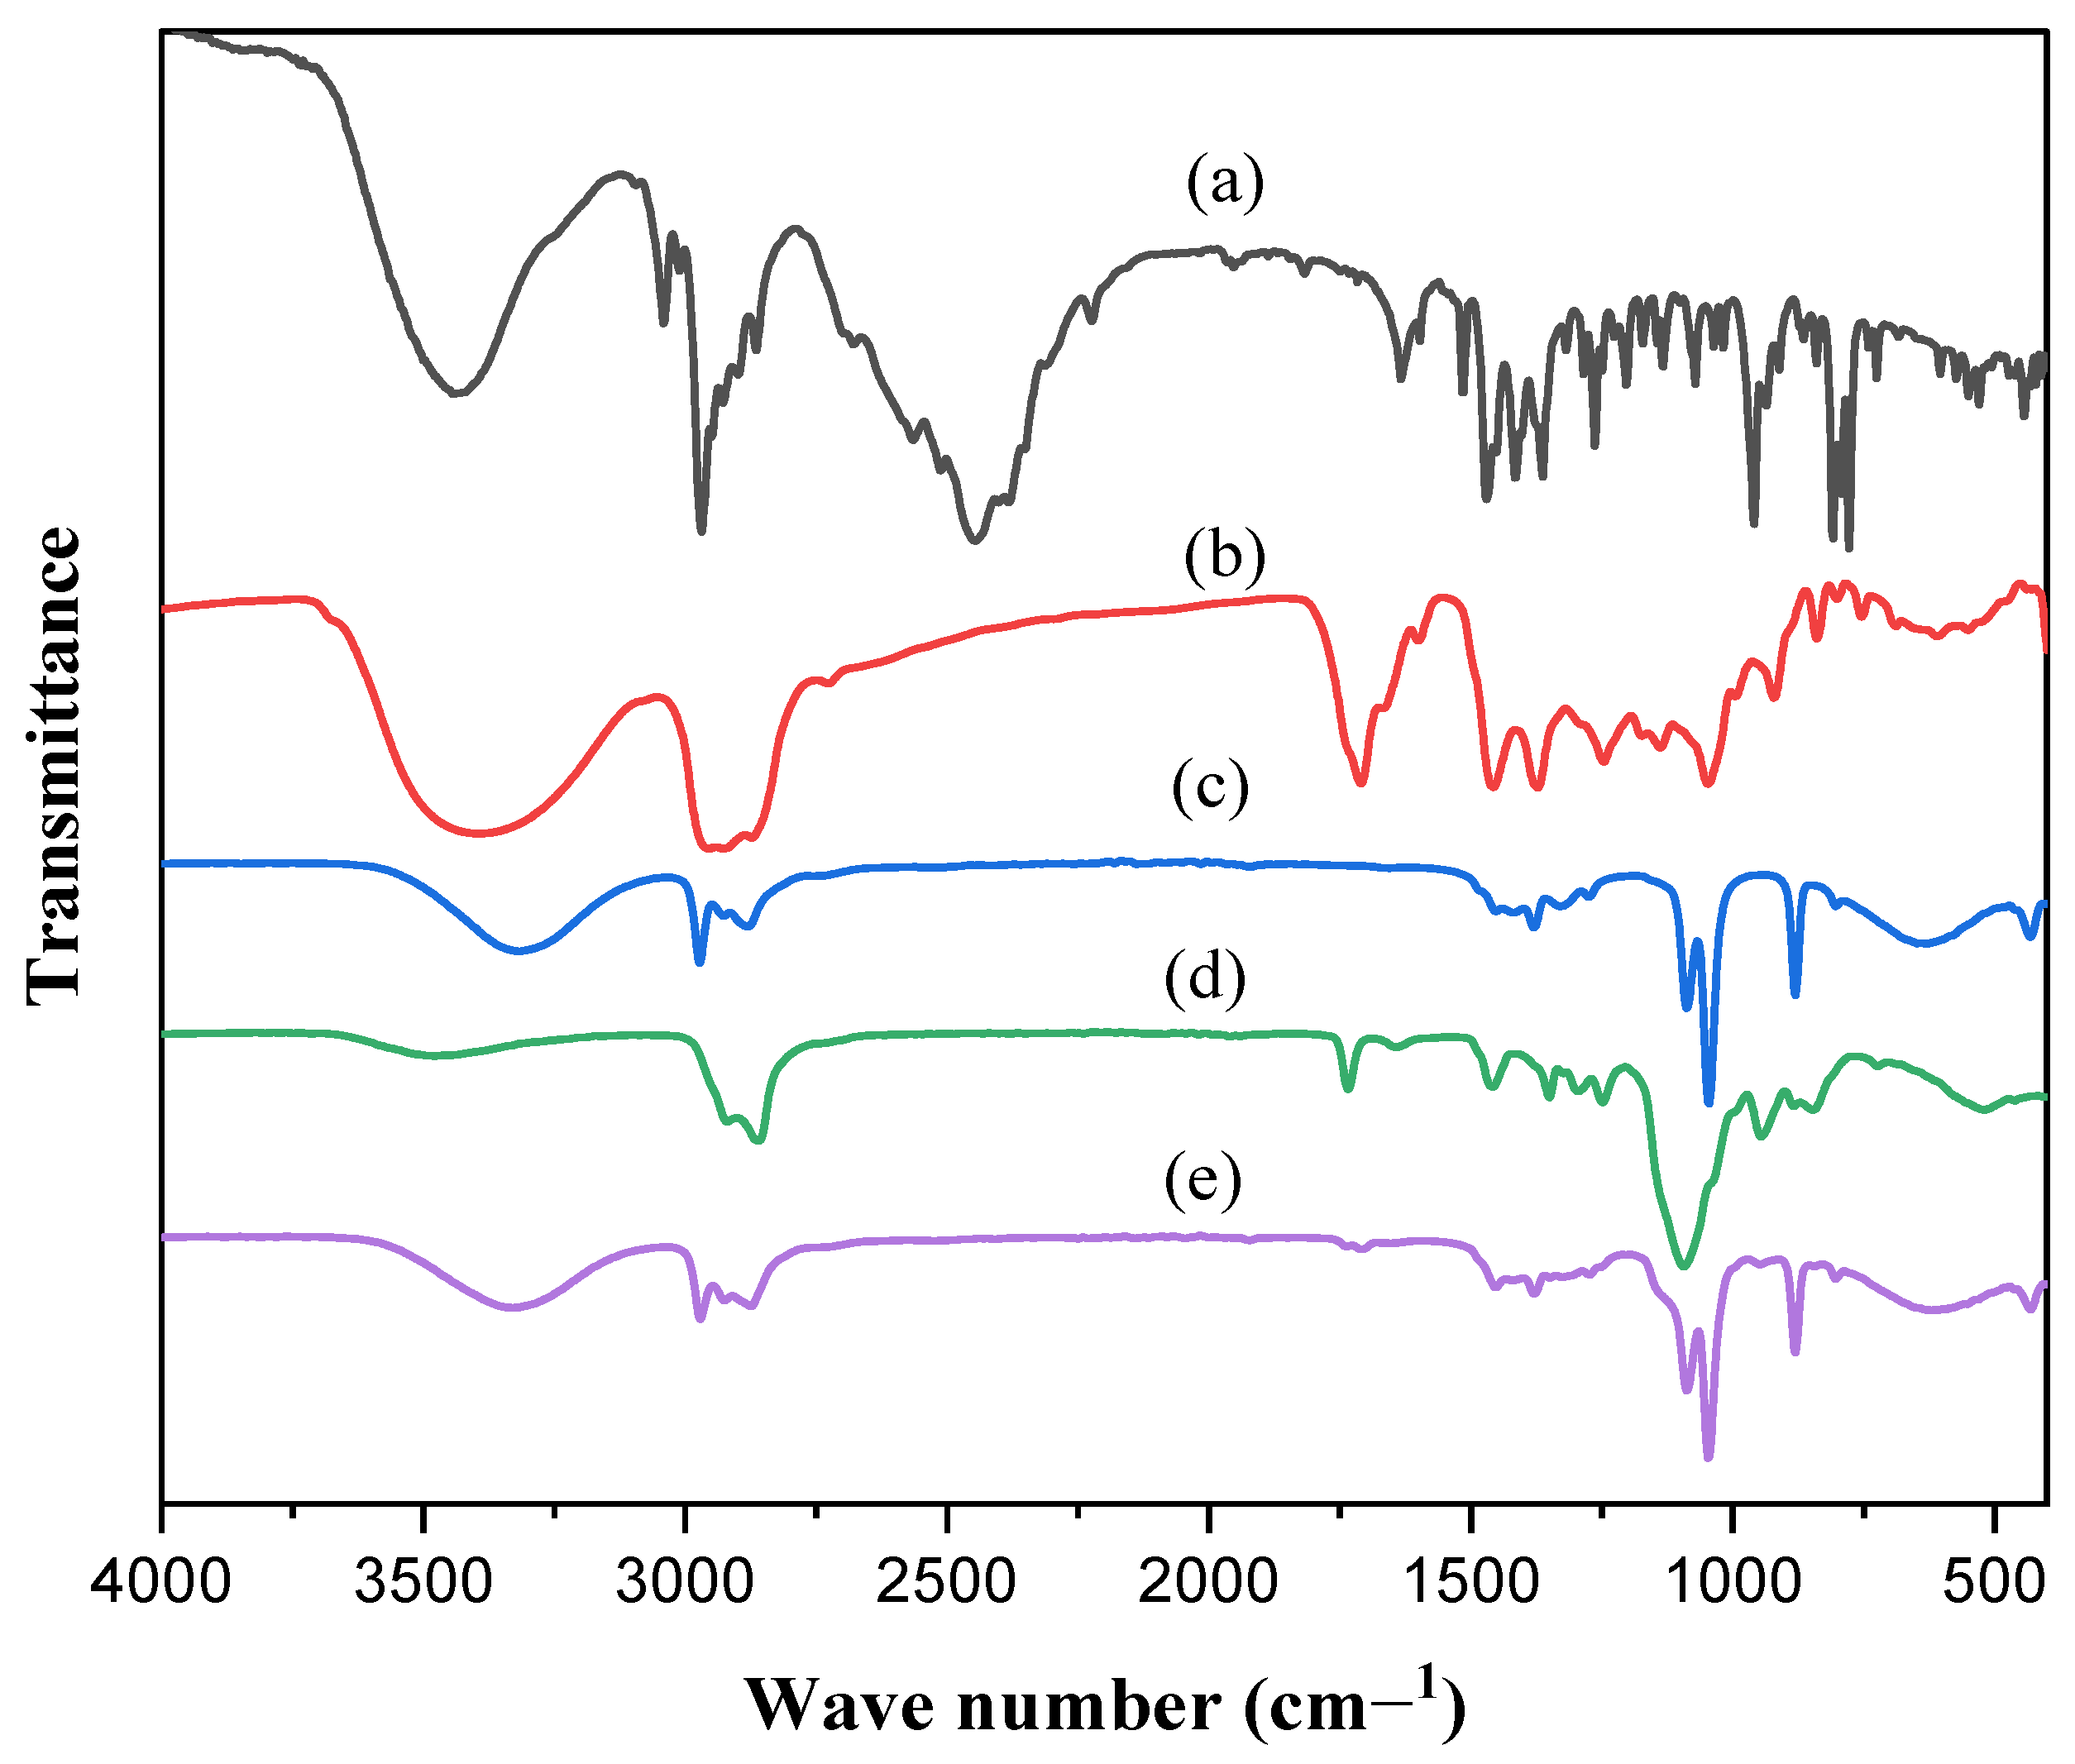
2.6.2. FT-IR Spectroscopy
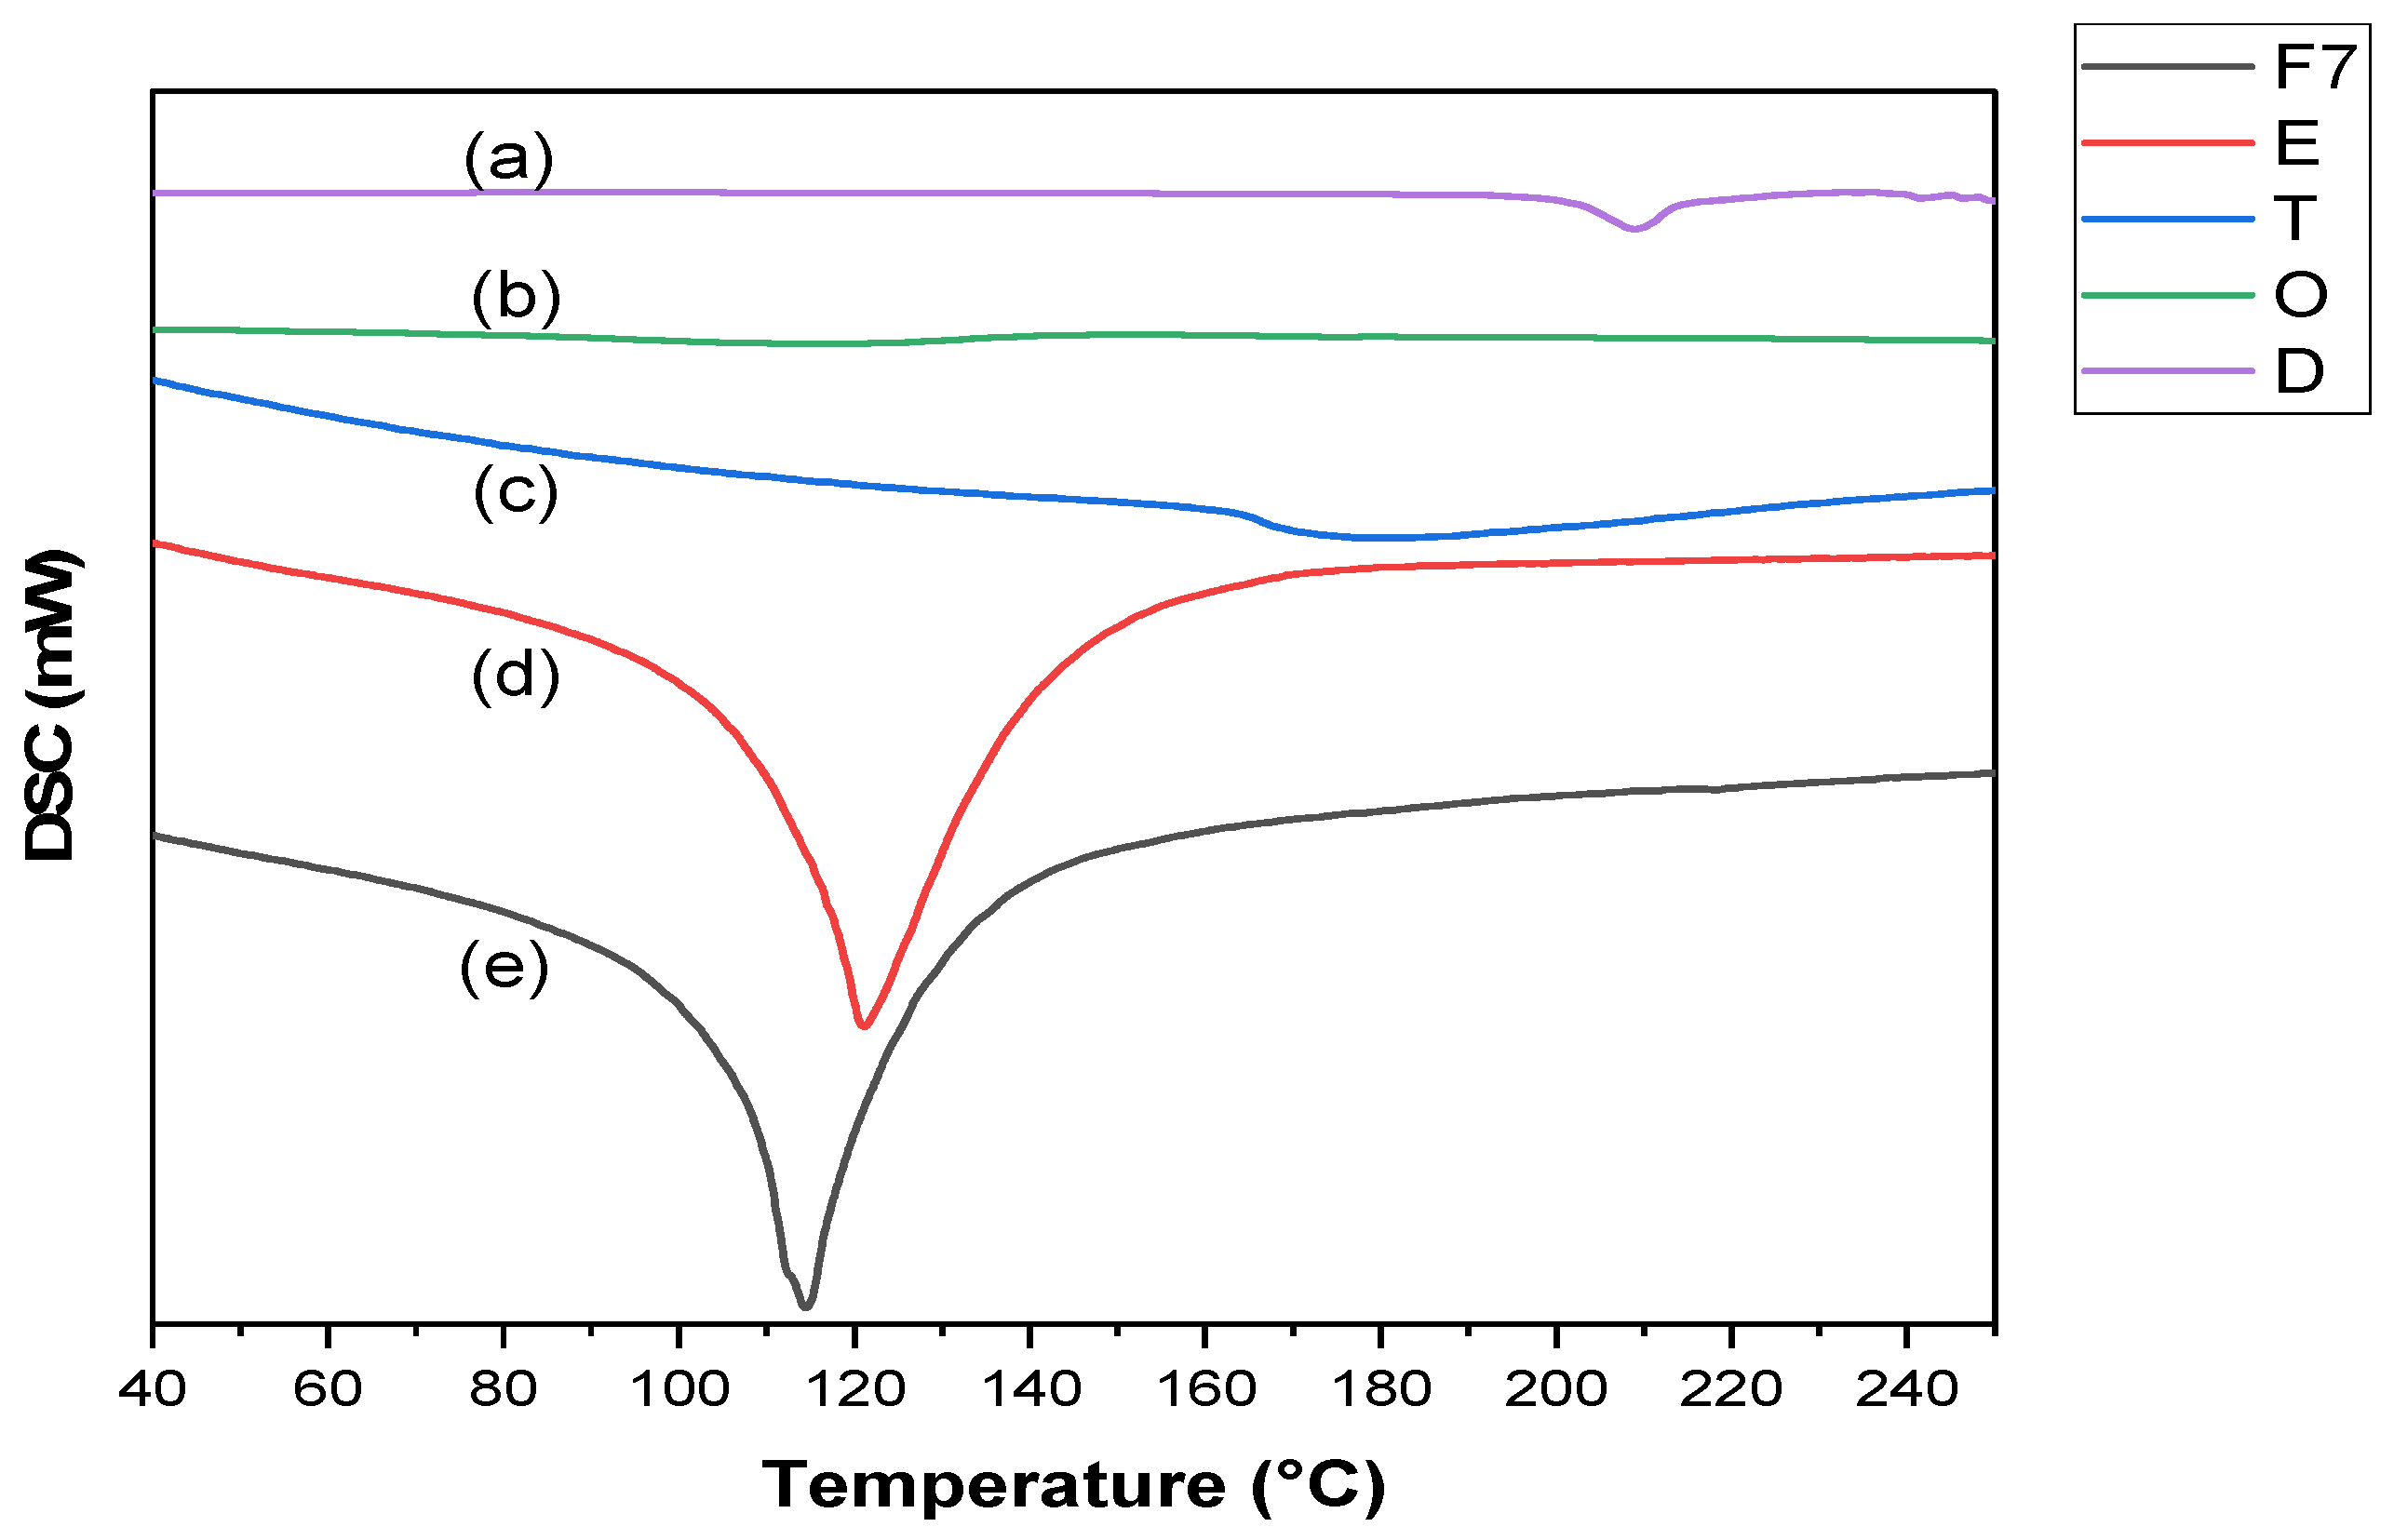
2.6.3. DSC Study
2.6.4. TEM Study
2.7. Preparation of TRB-Loaded NEF Formulation
2.8. Evaluation of the Prepared TER-Loaded NEF
2.8.1. Foam Calculated Parameters
2.8.2. Foam Half-Life
2.8.3. Viscosity
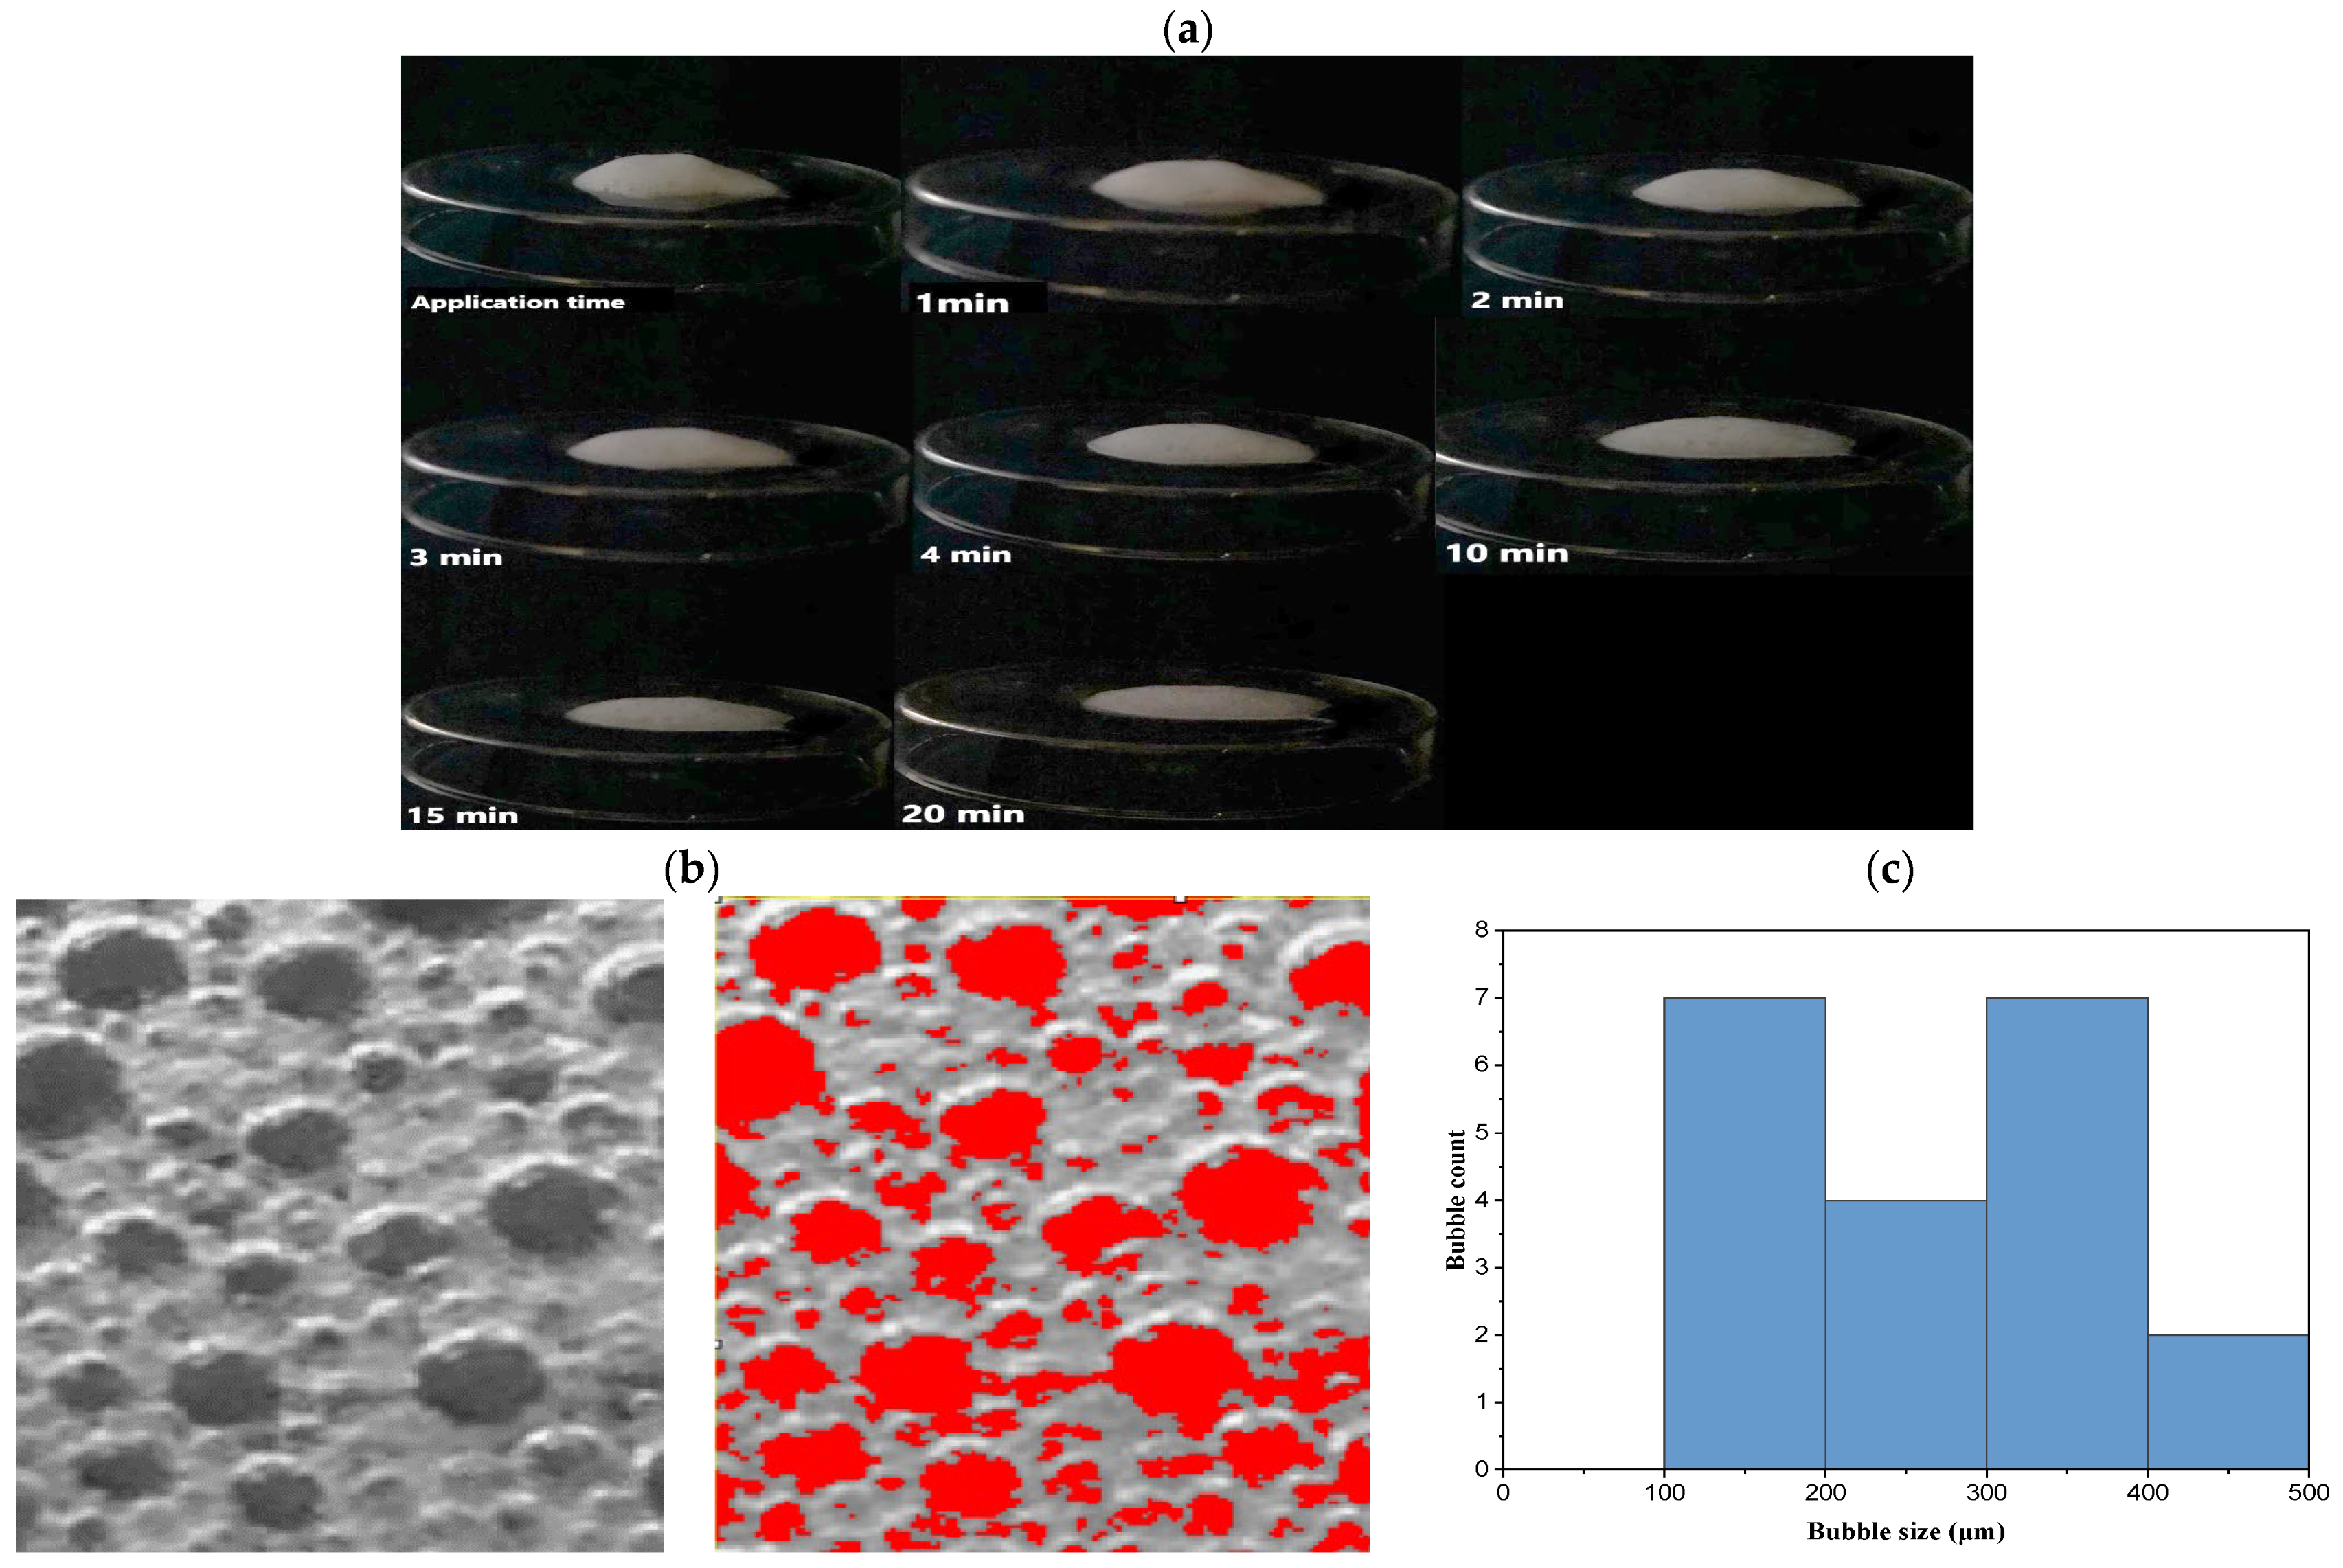
2.8.4. Foam Collapse
2.8.5. Bubble Size Estimation
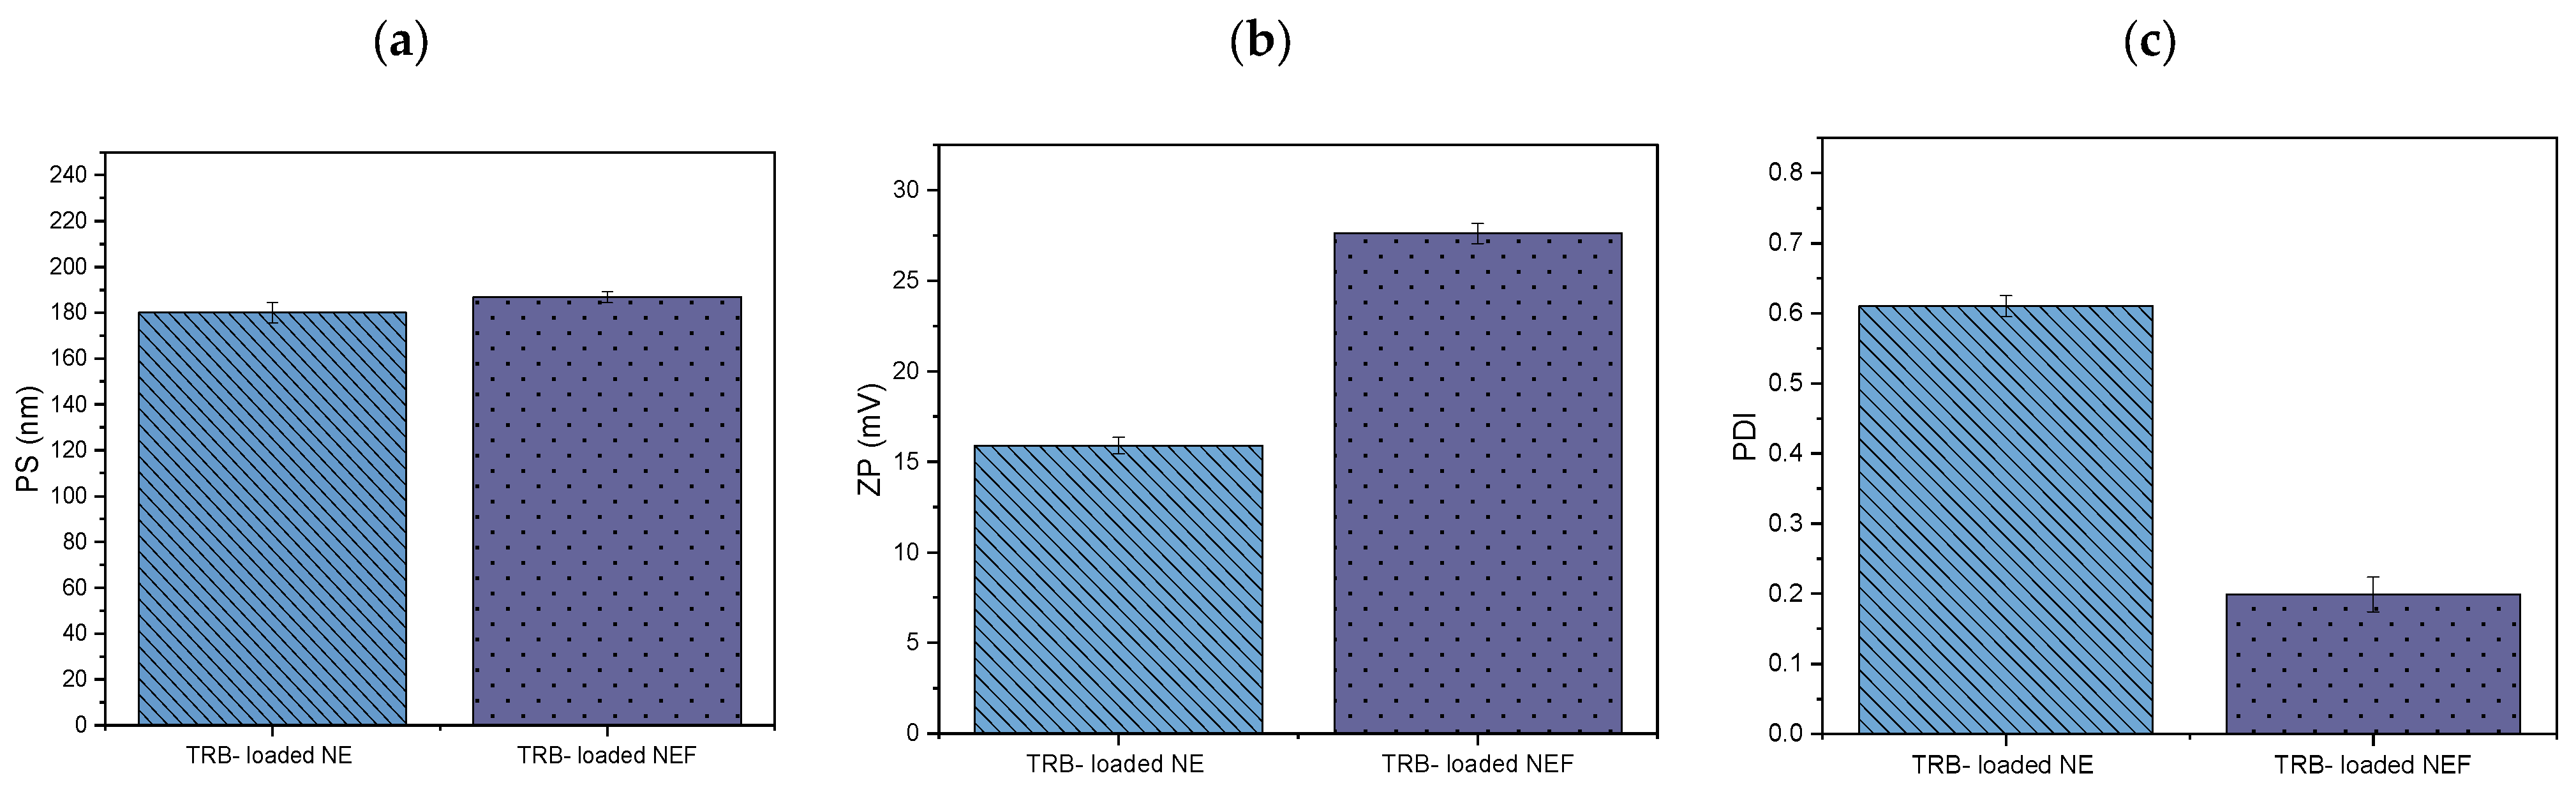
2.8.6. Measurement of PS, PDI, and ZP
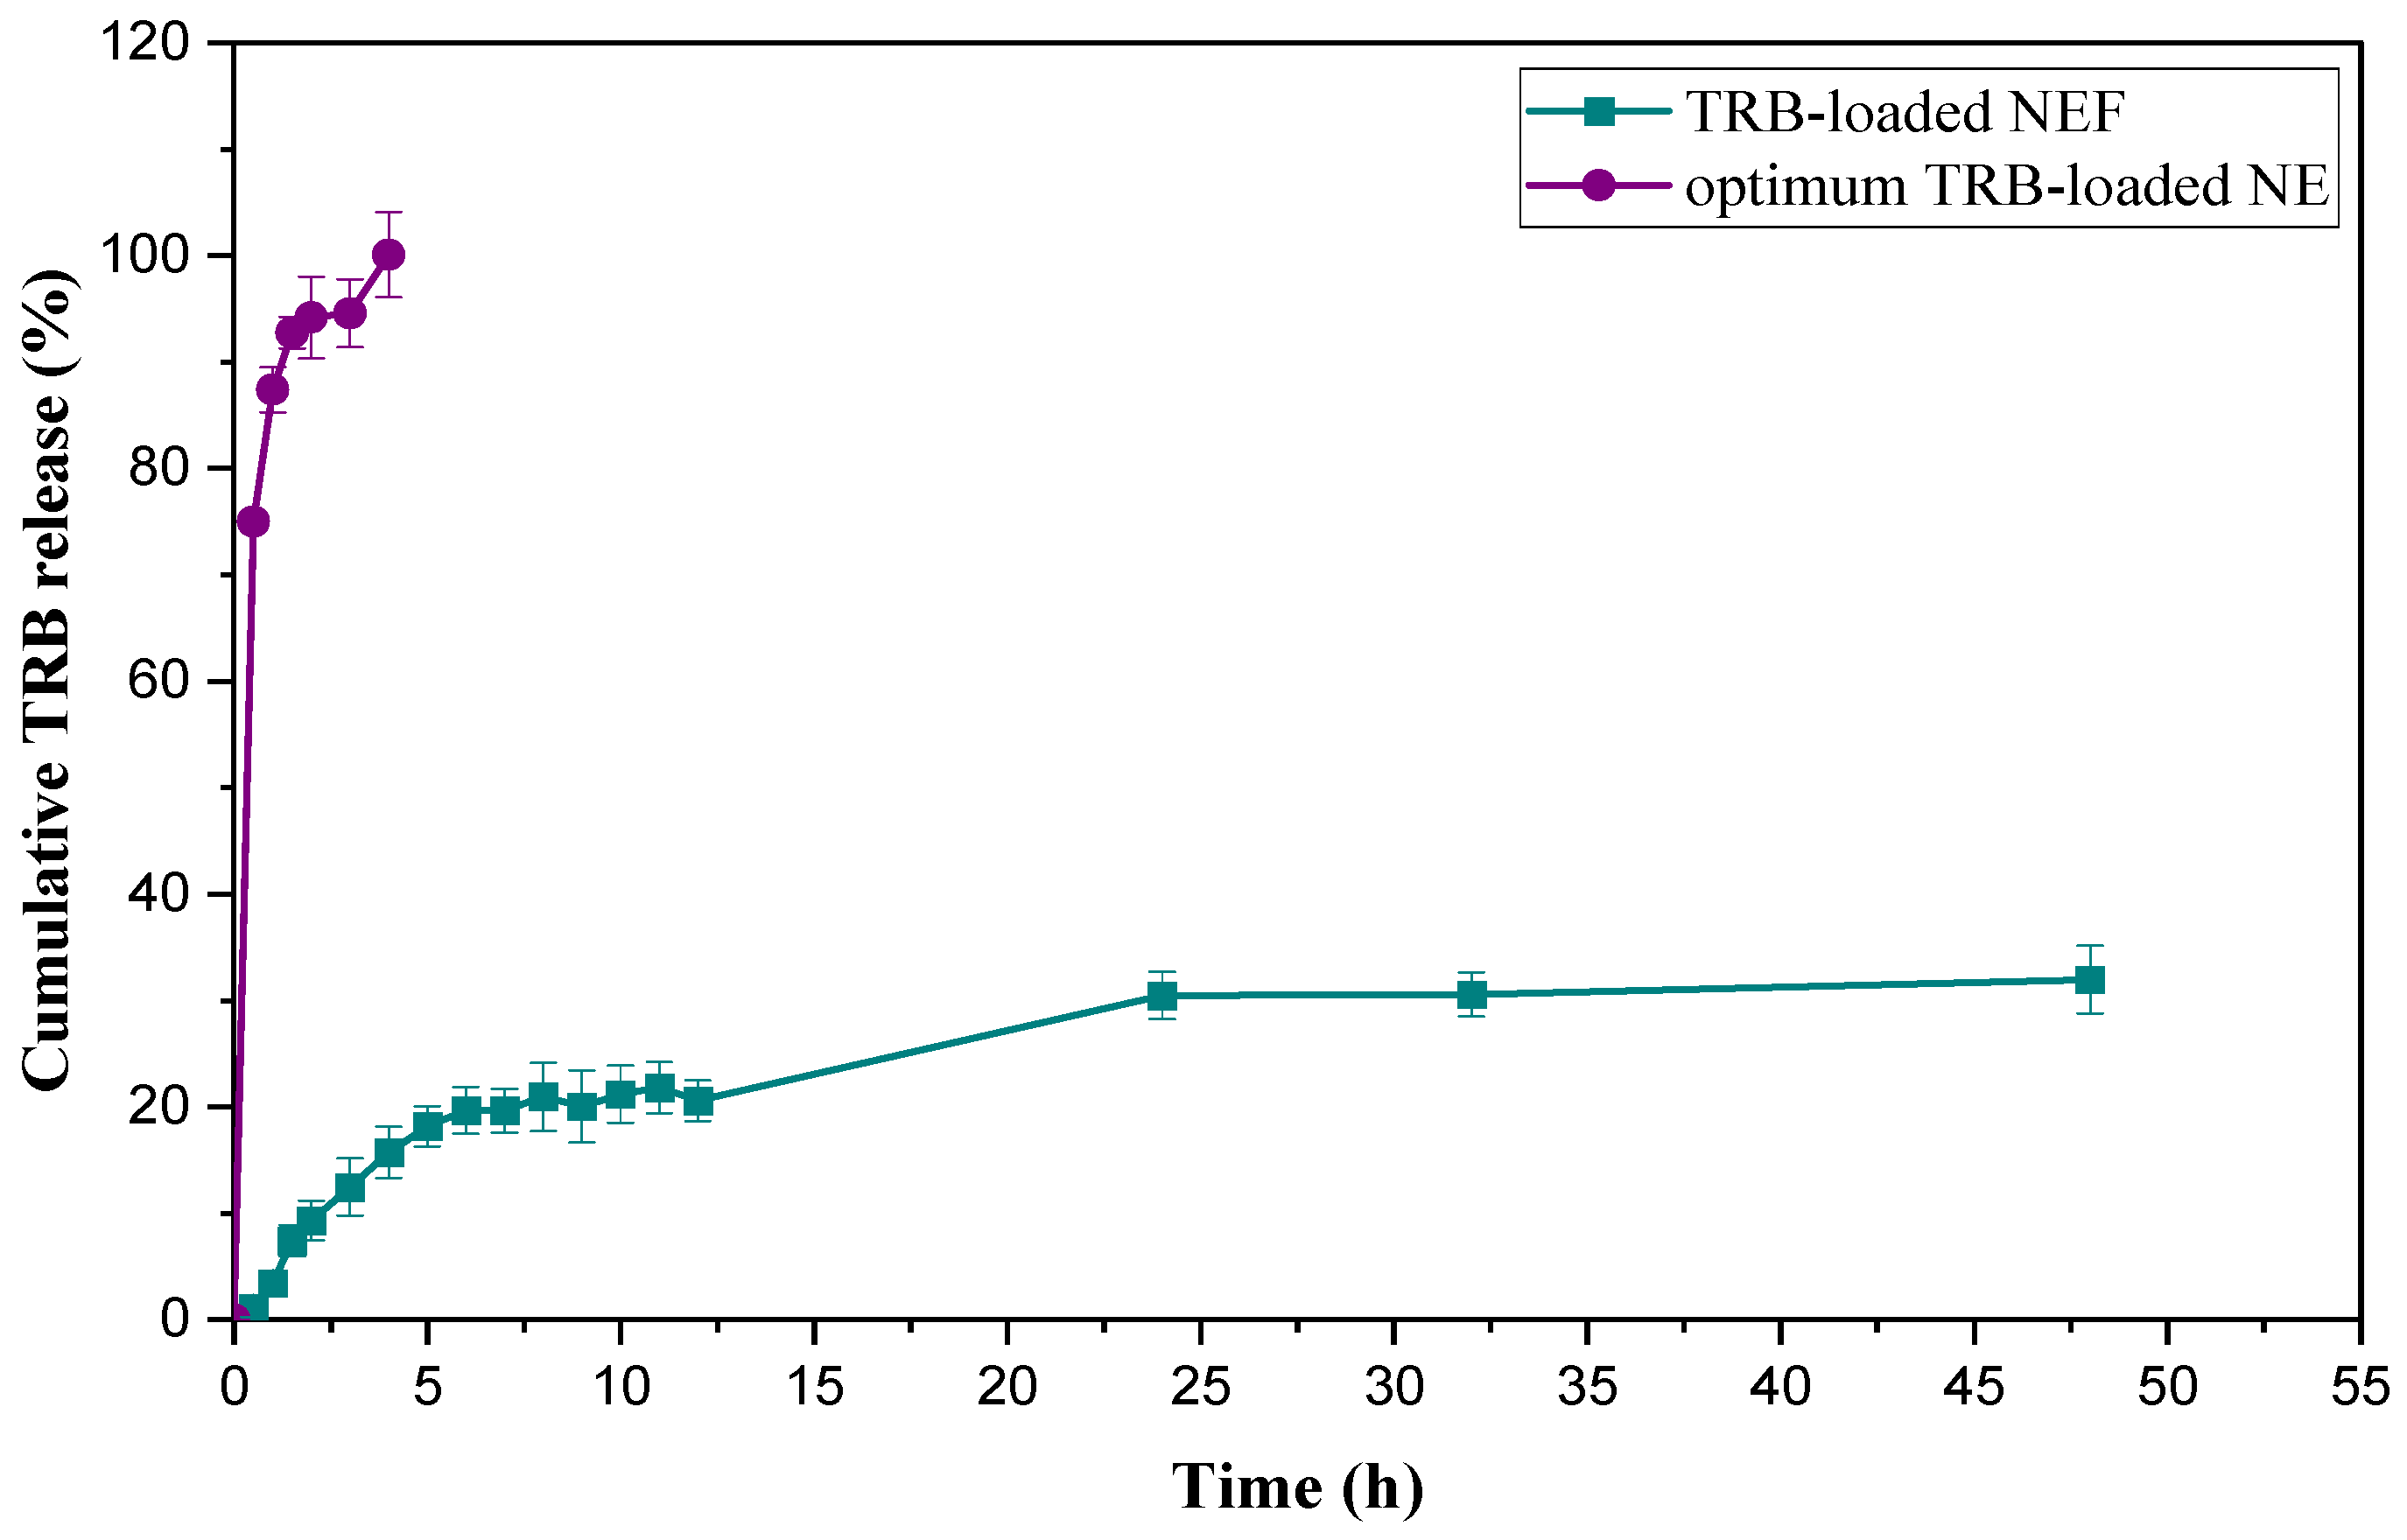
2.8.7. In Vitro Cumulative Release Study of TRB-Loaded NEF Formula
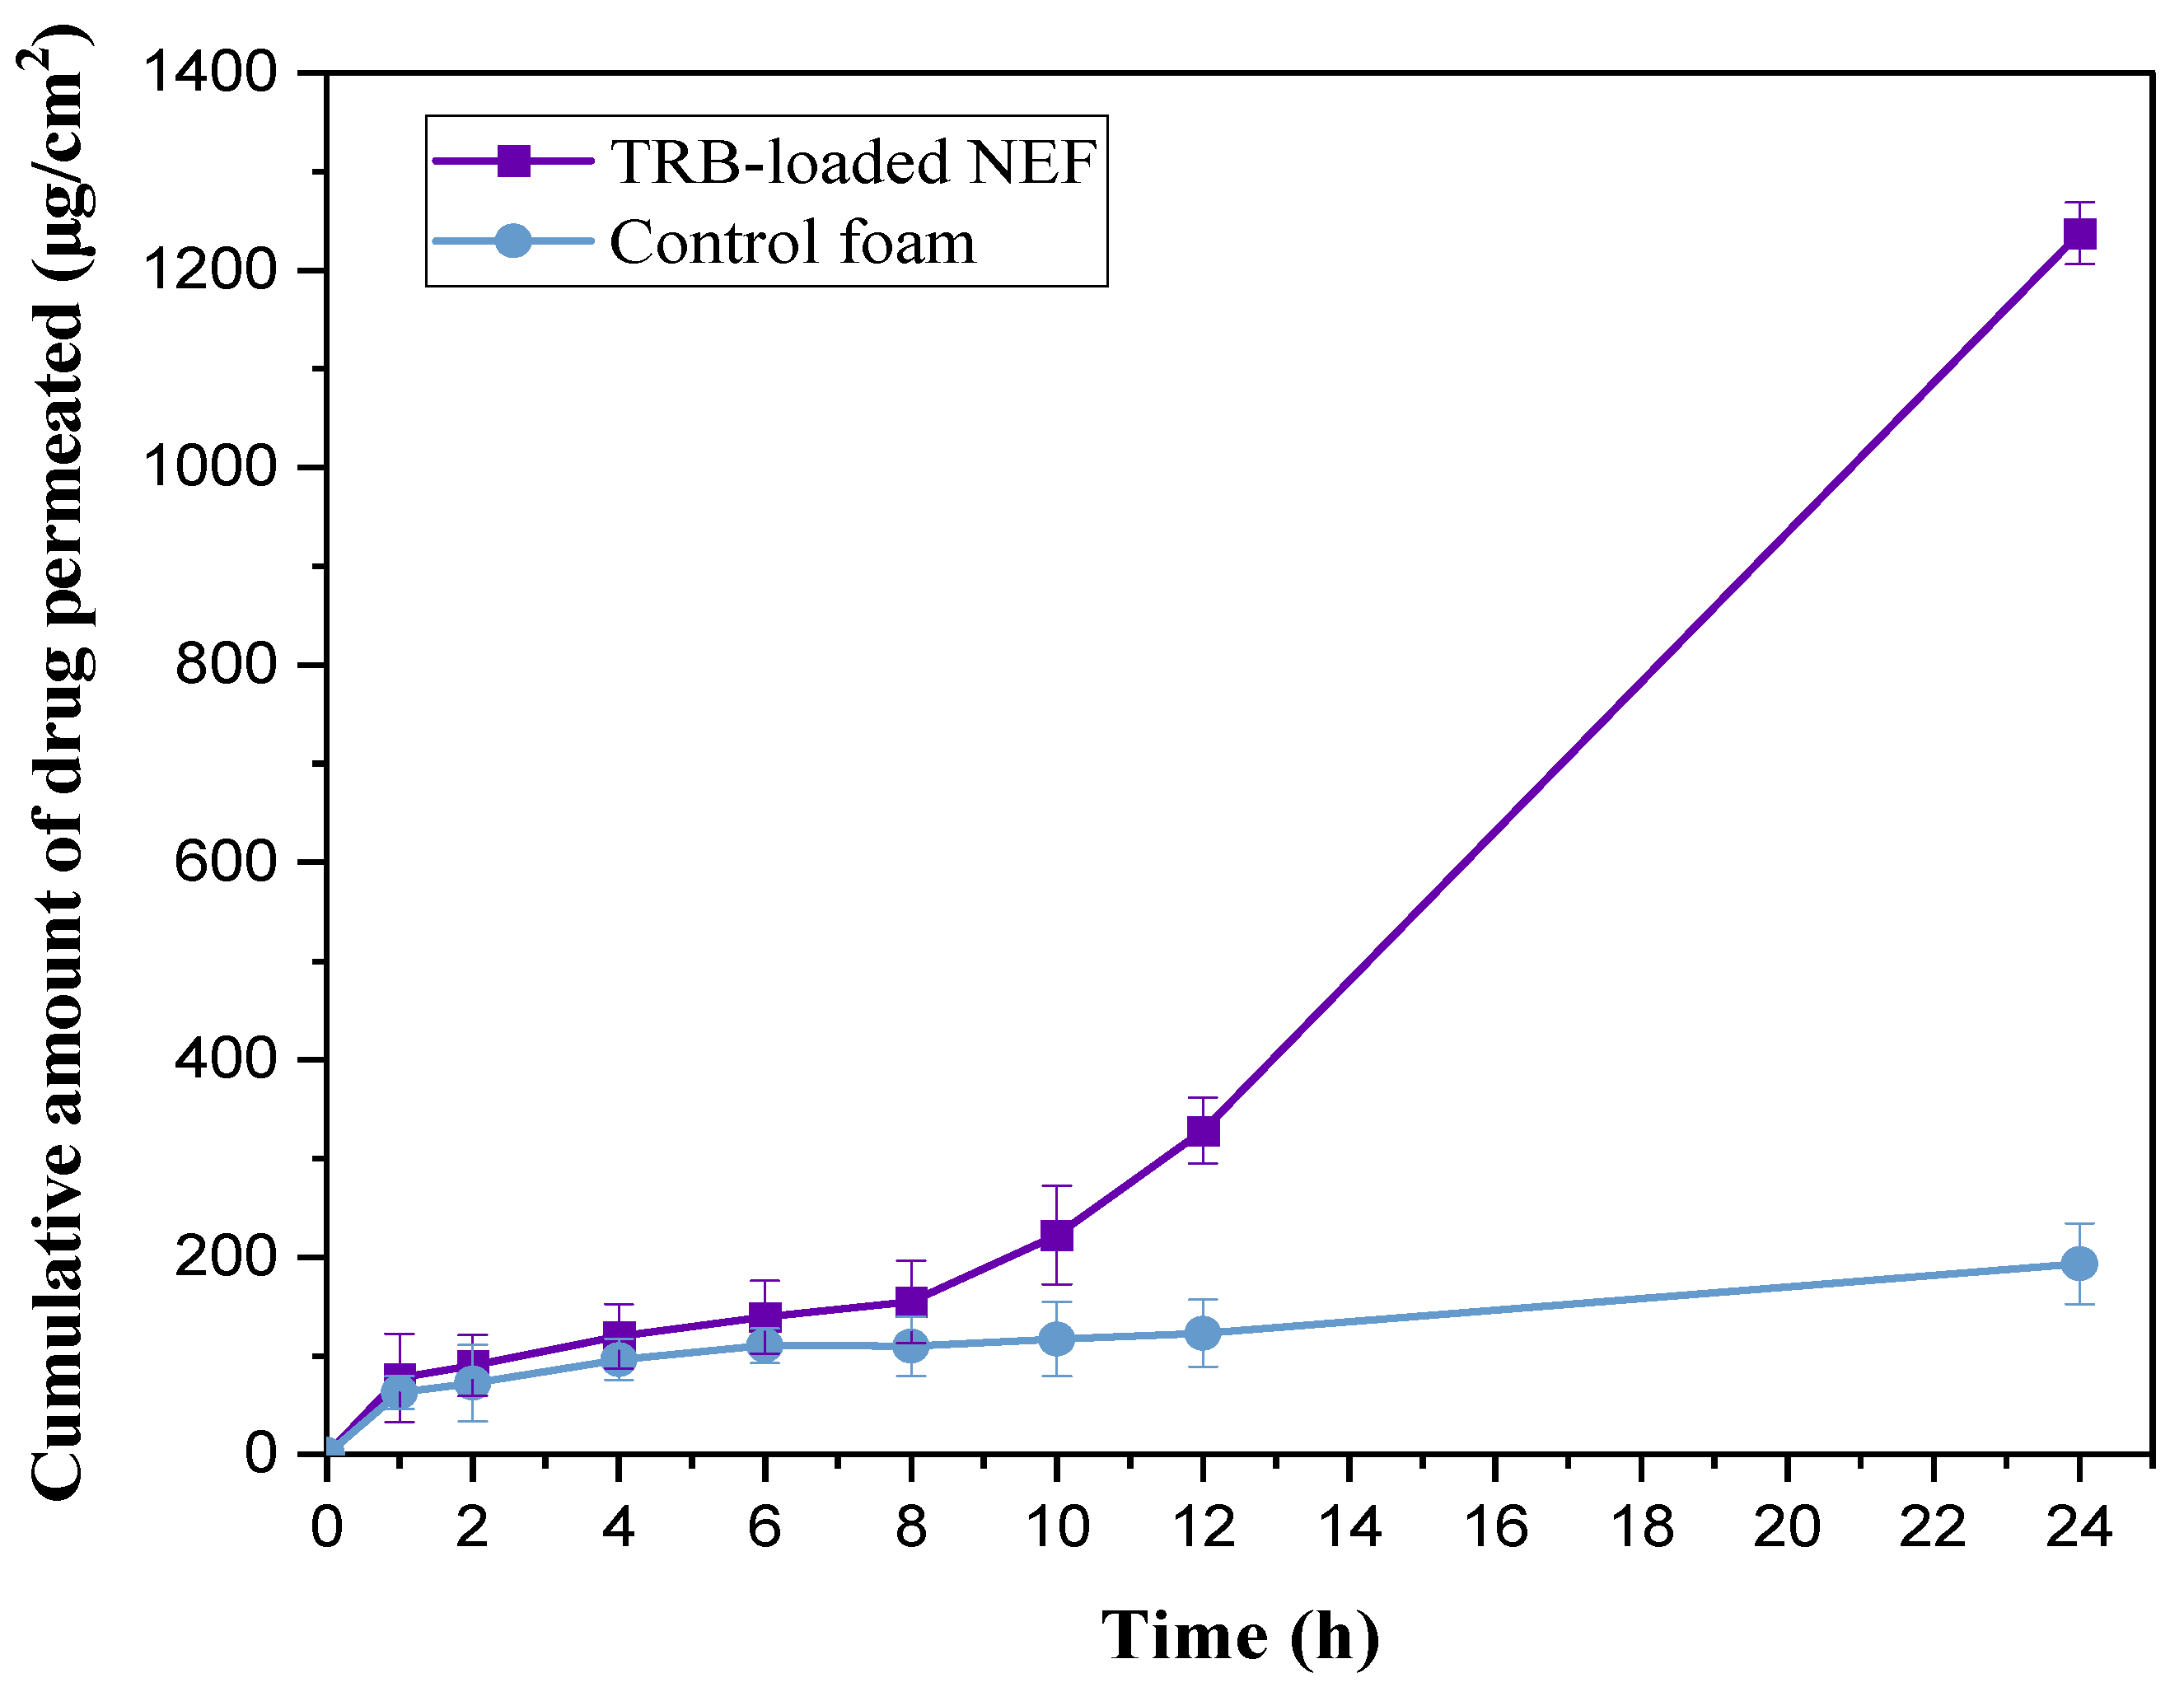
2.8.8. Ex Vivo Permeation Study
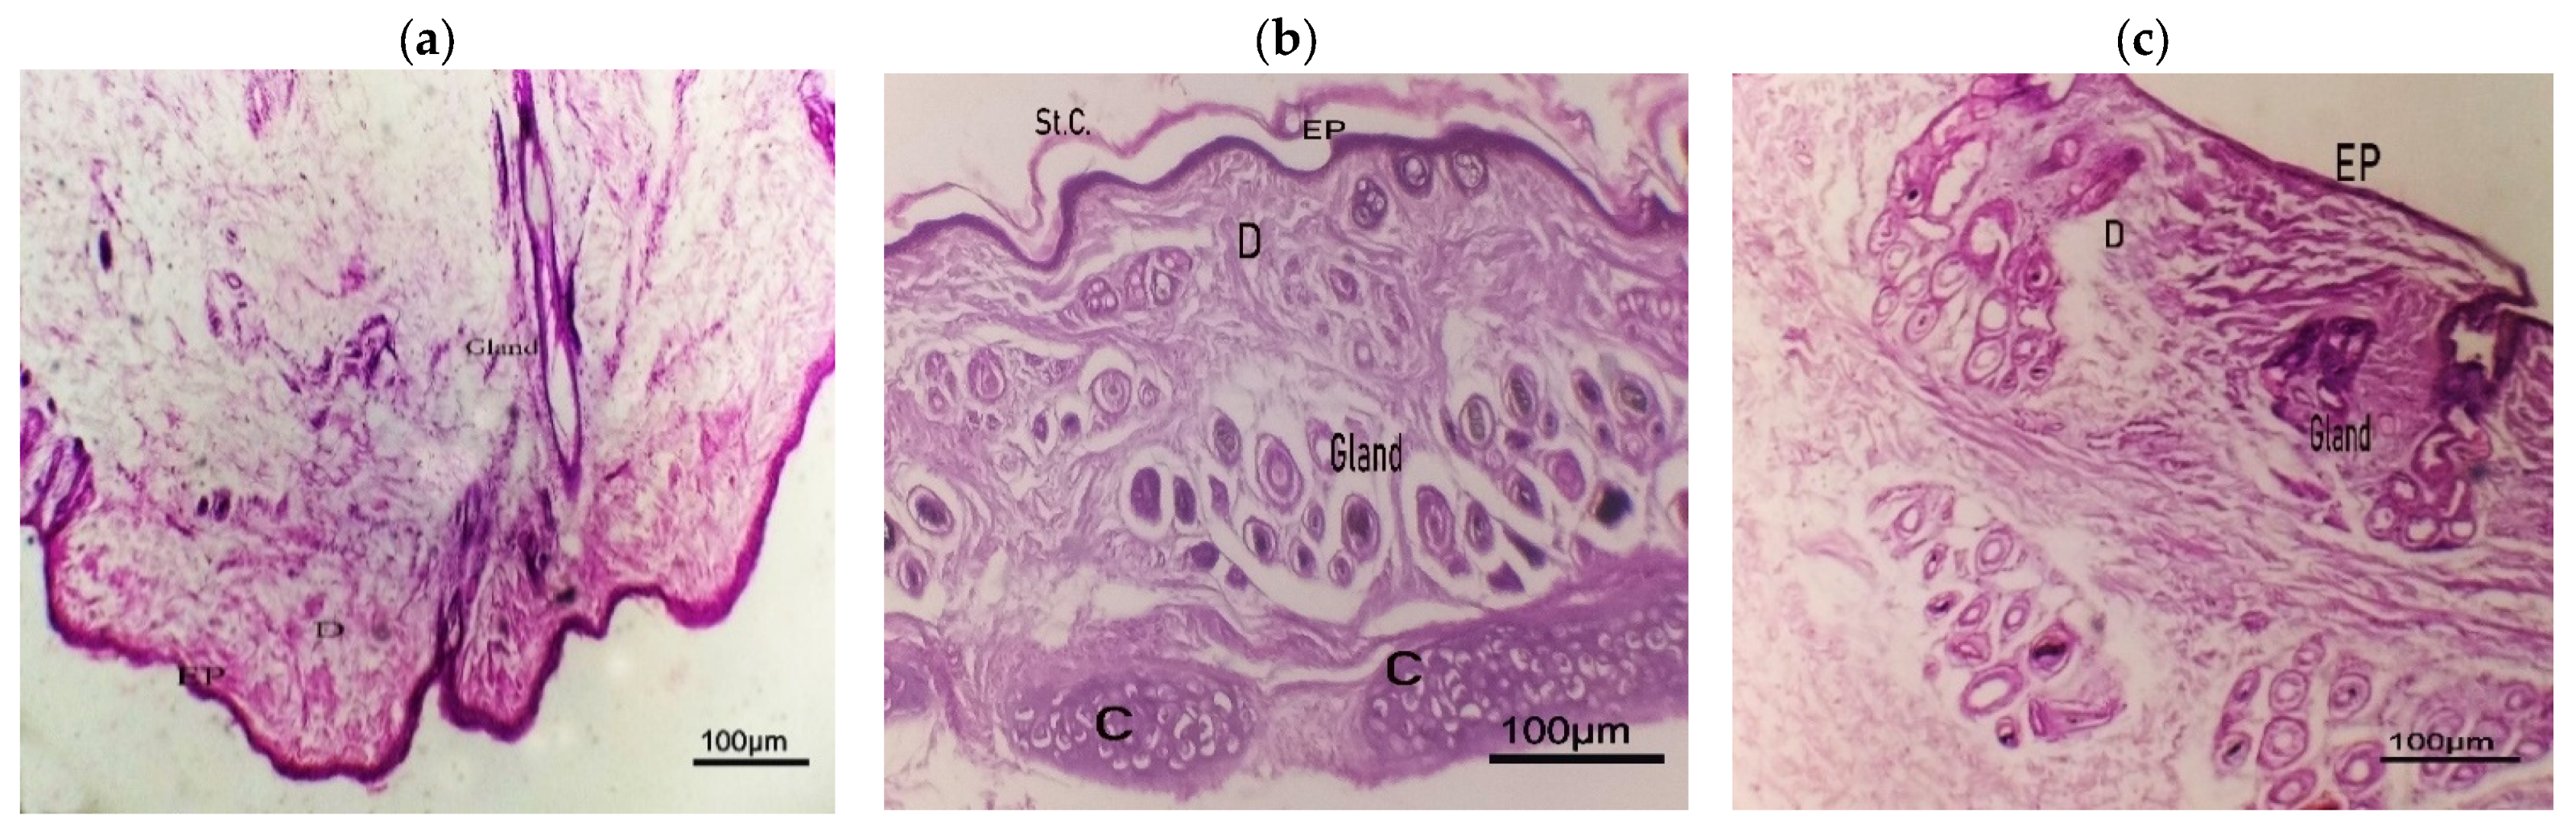
2.8.9. Histopathological Study
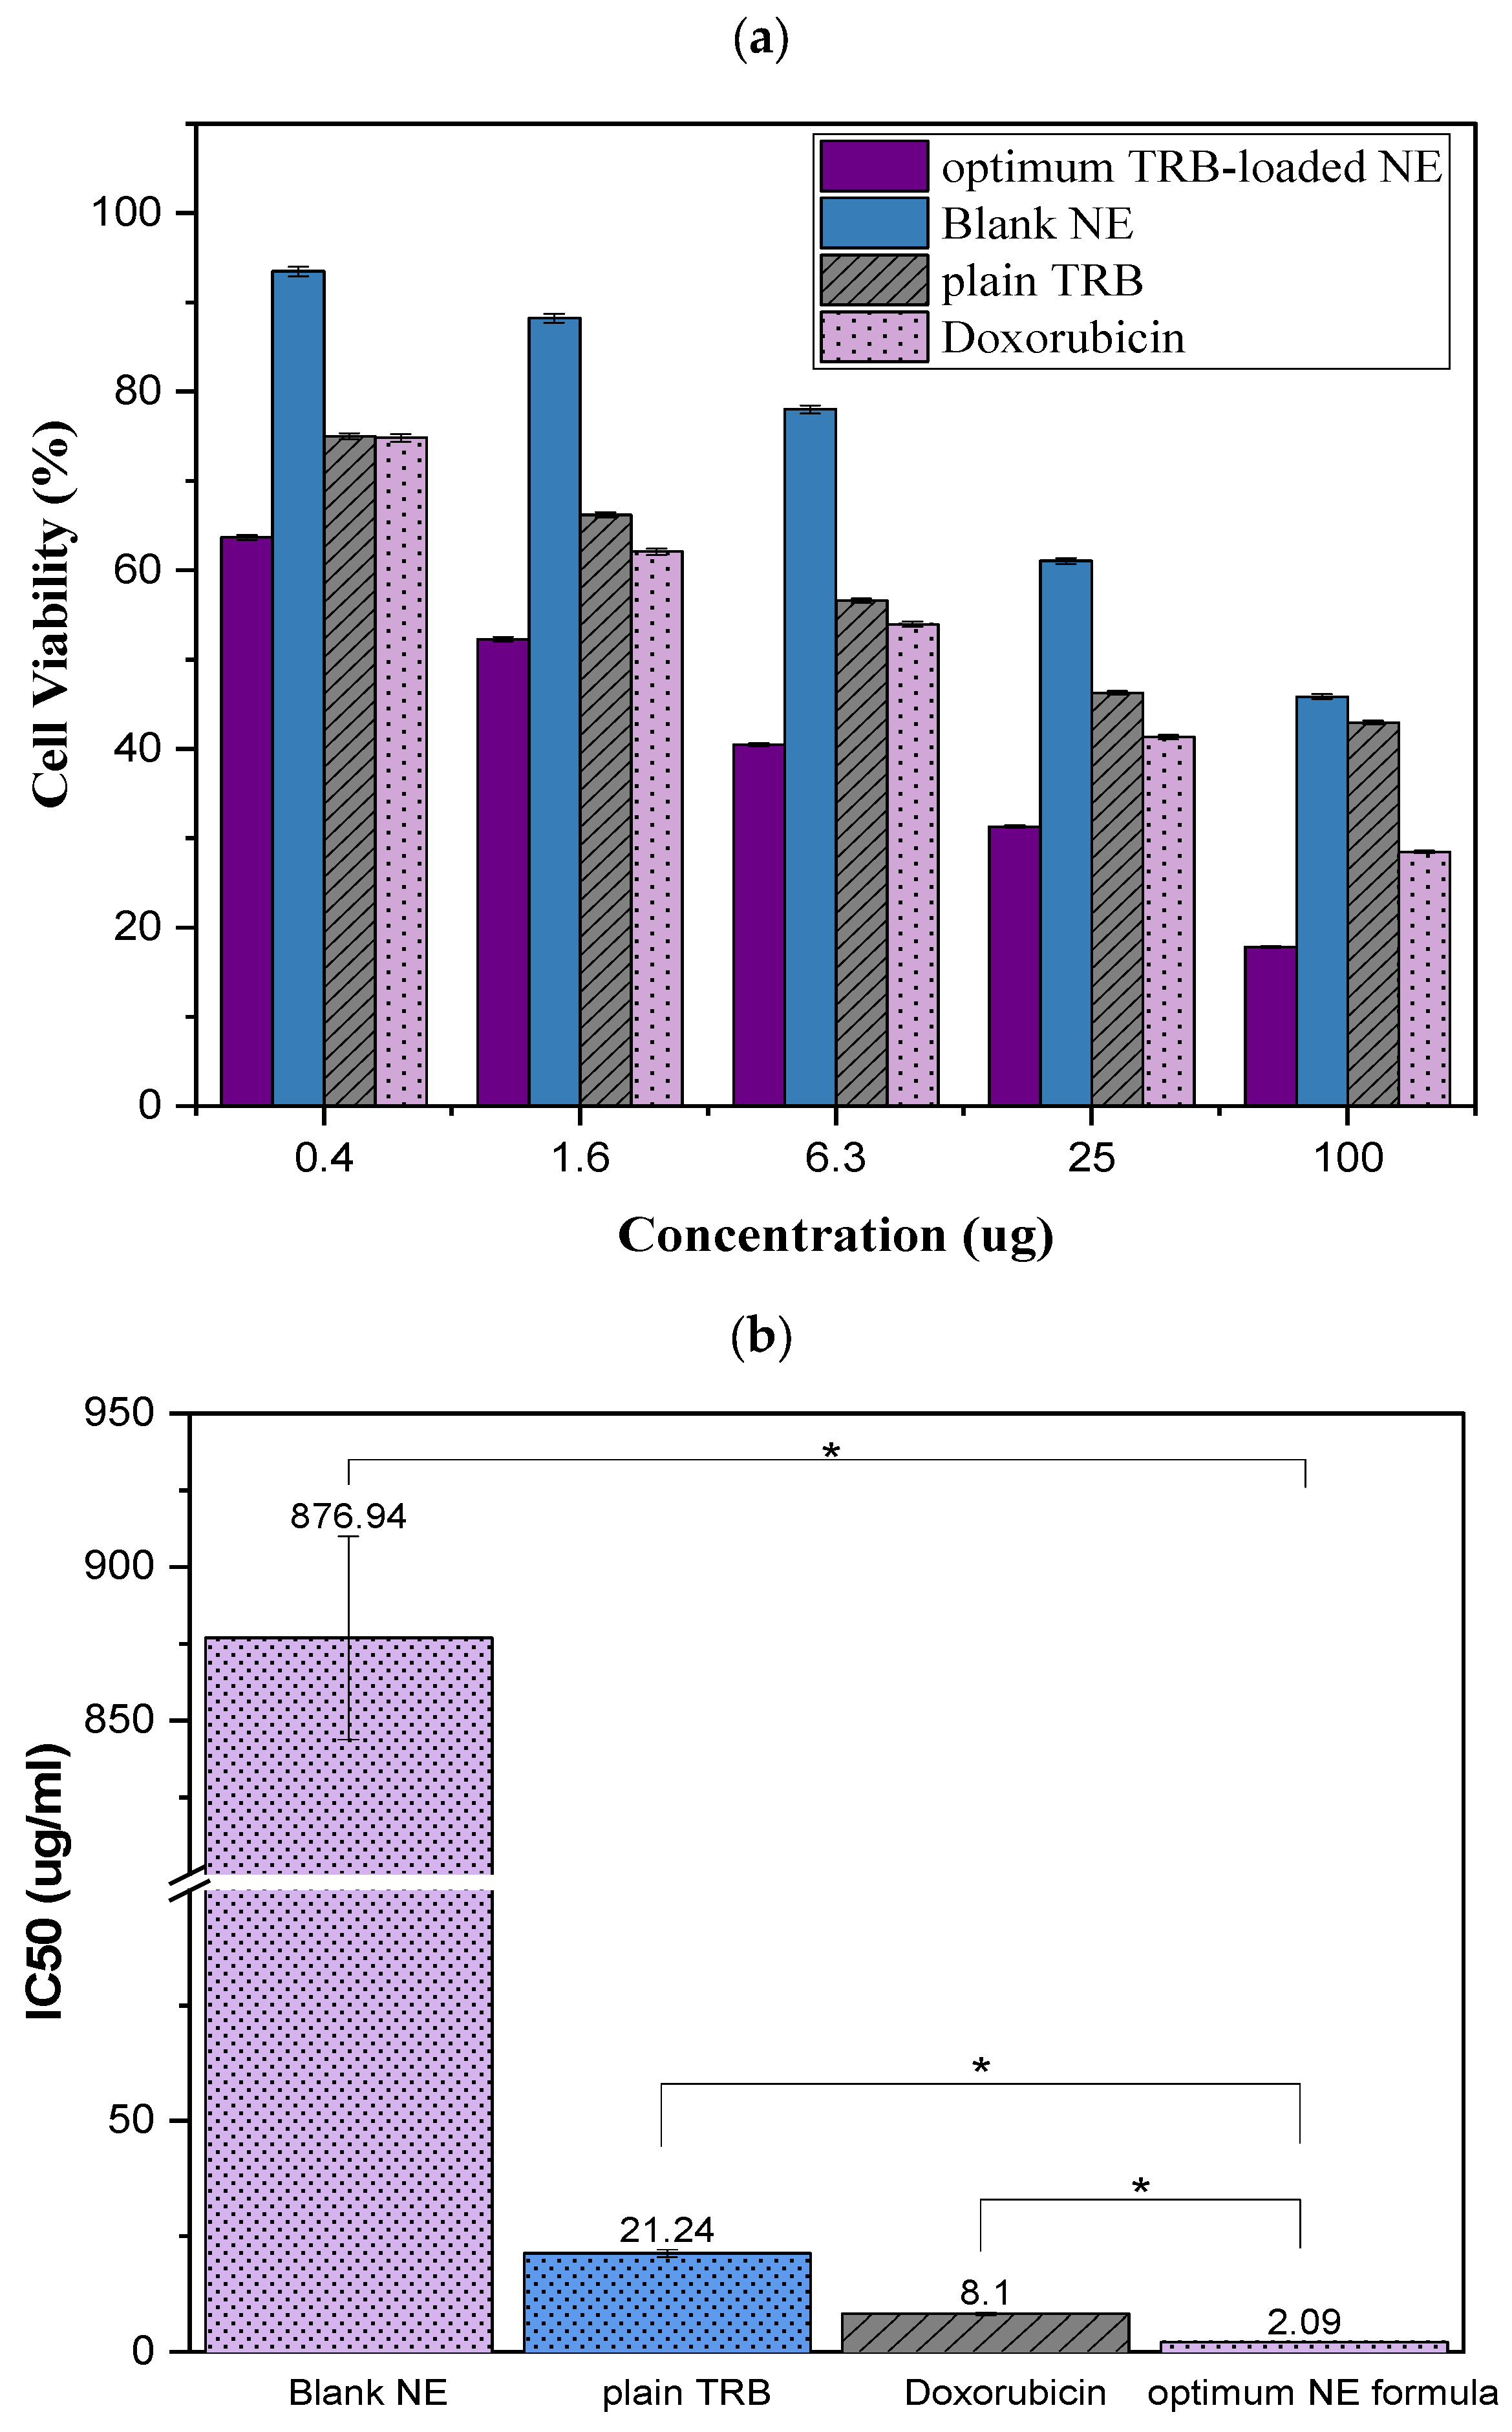
2.9. Cytotoxicity Assessment
2.9.1. Cell Viability Assay
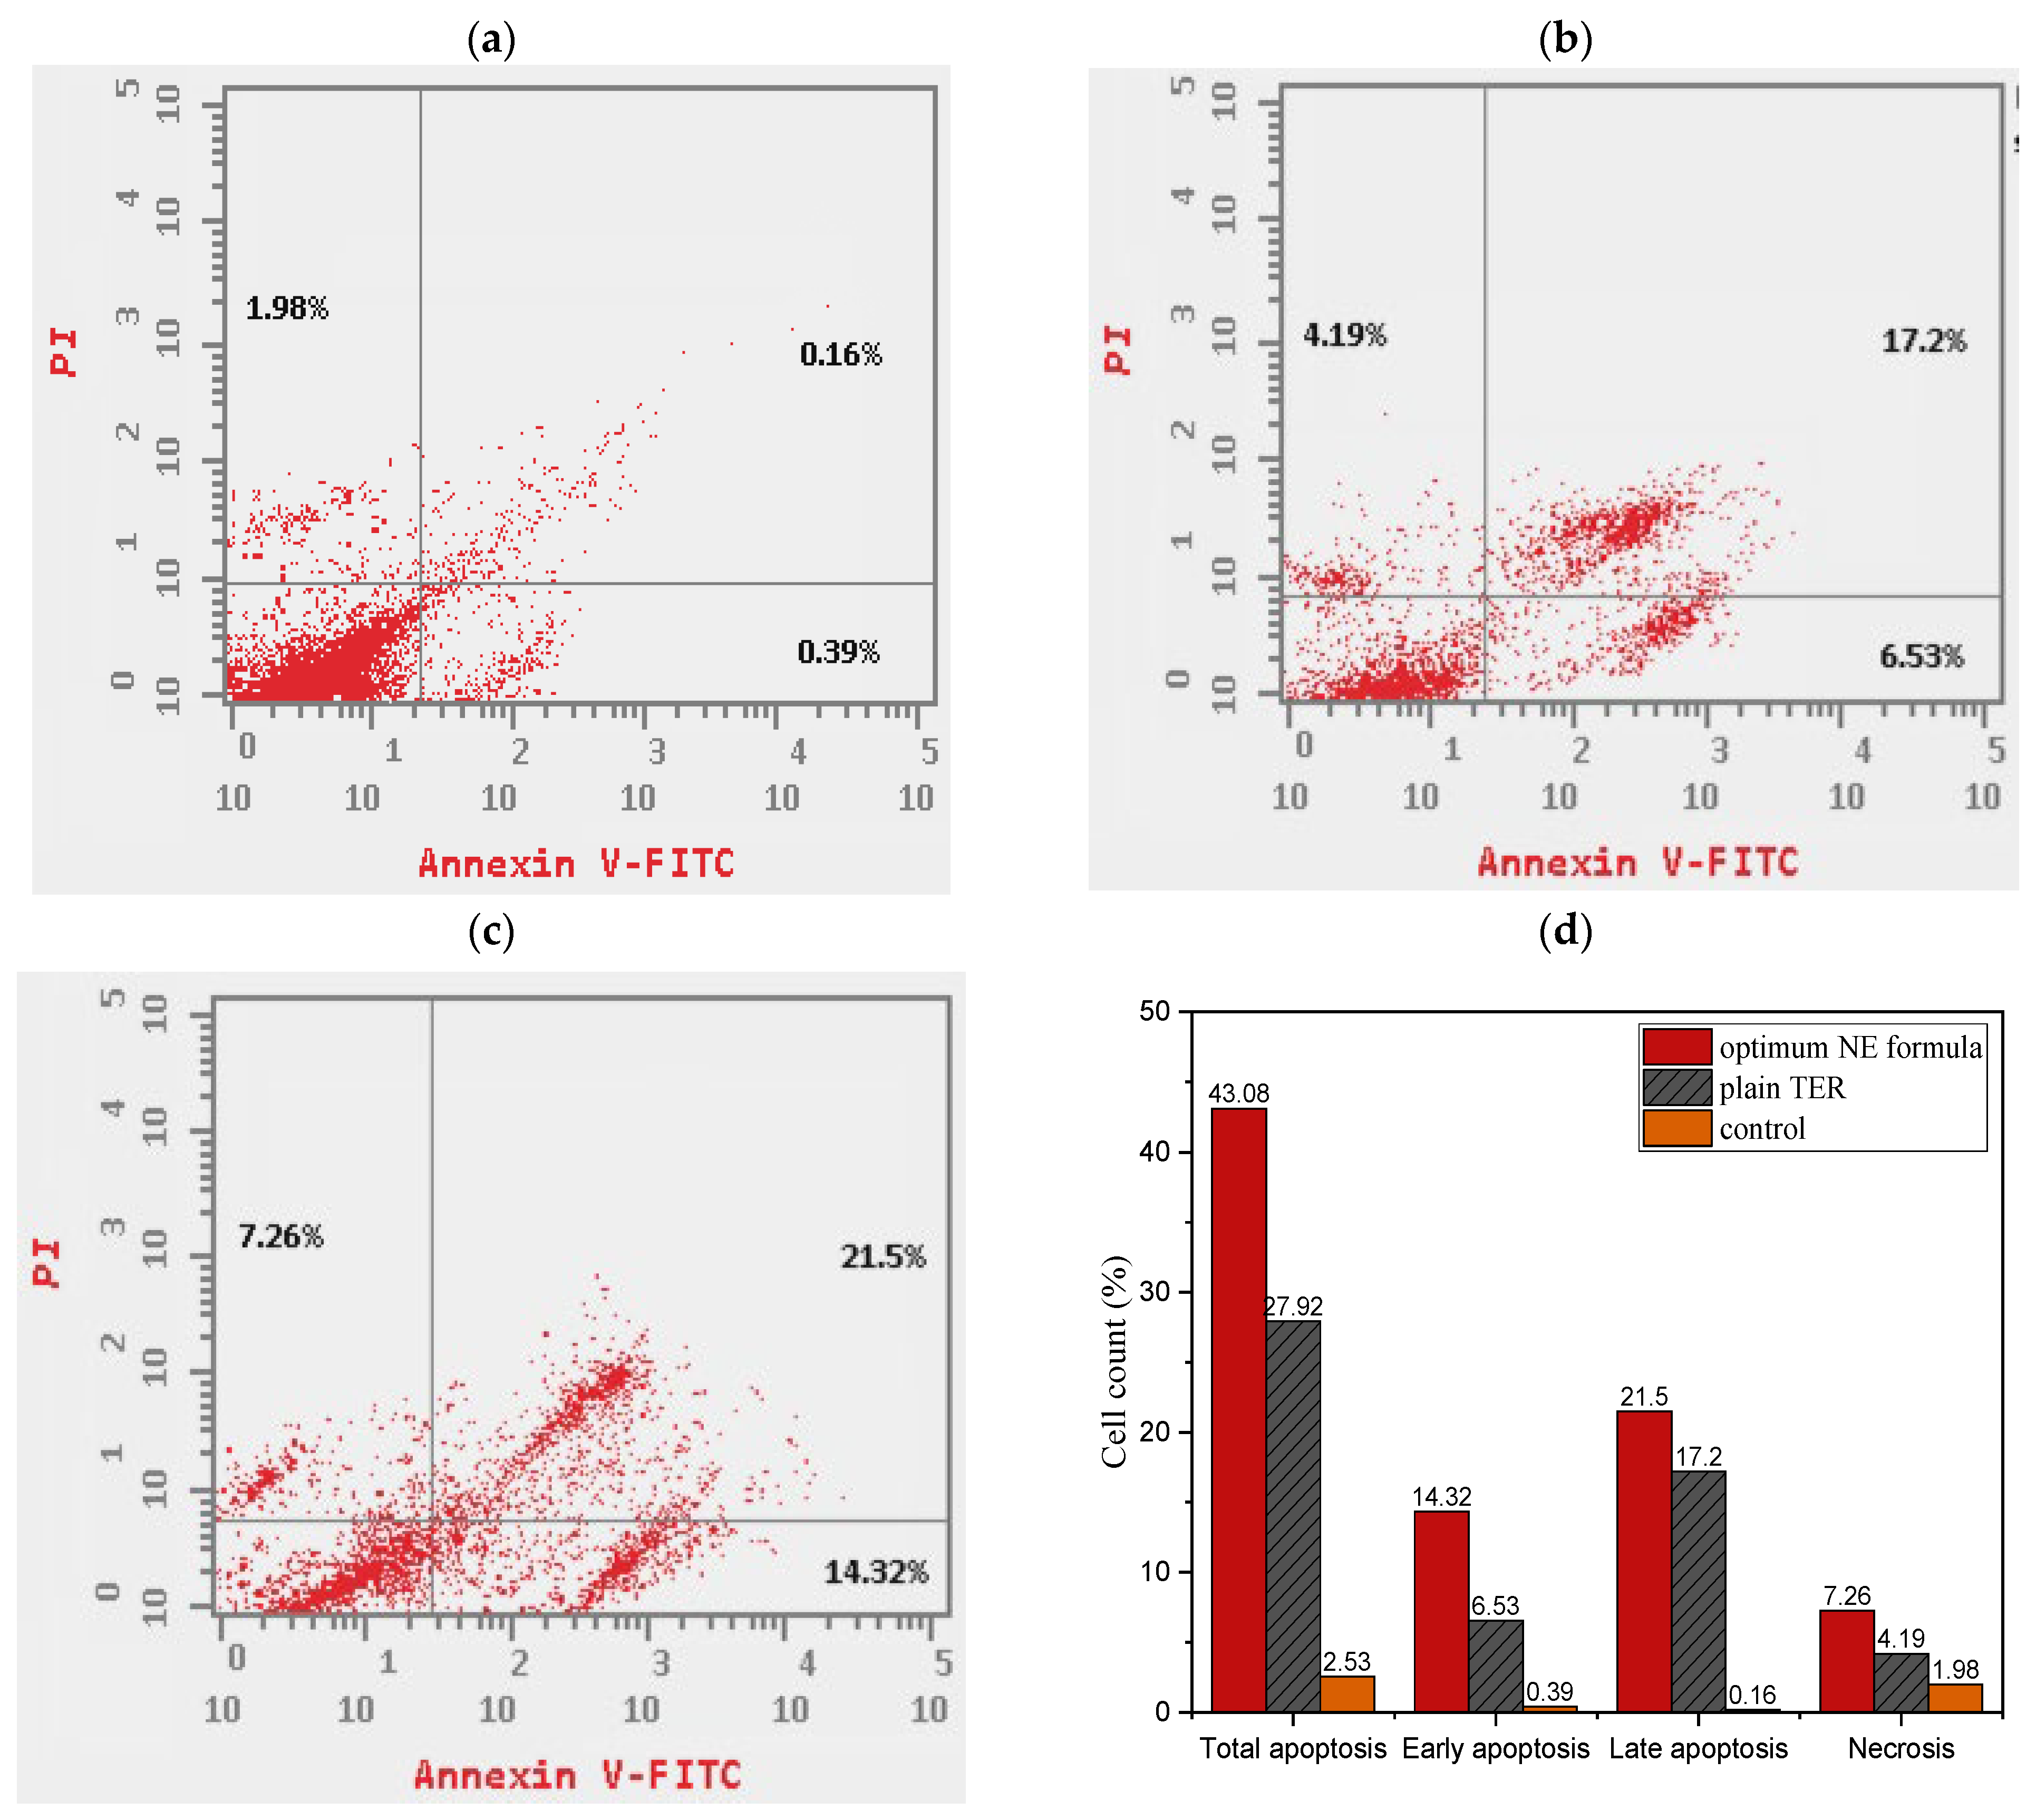
2.9.2. Apoptosis Assay
2.9.3. Cell Cycle Study
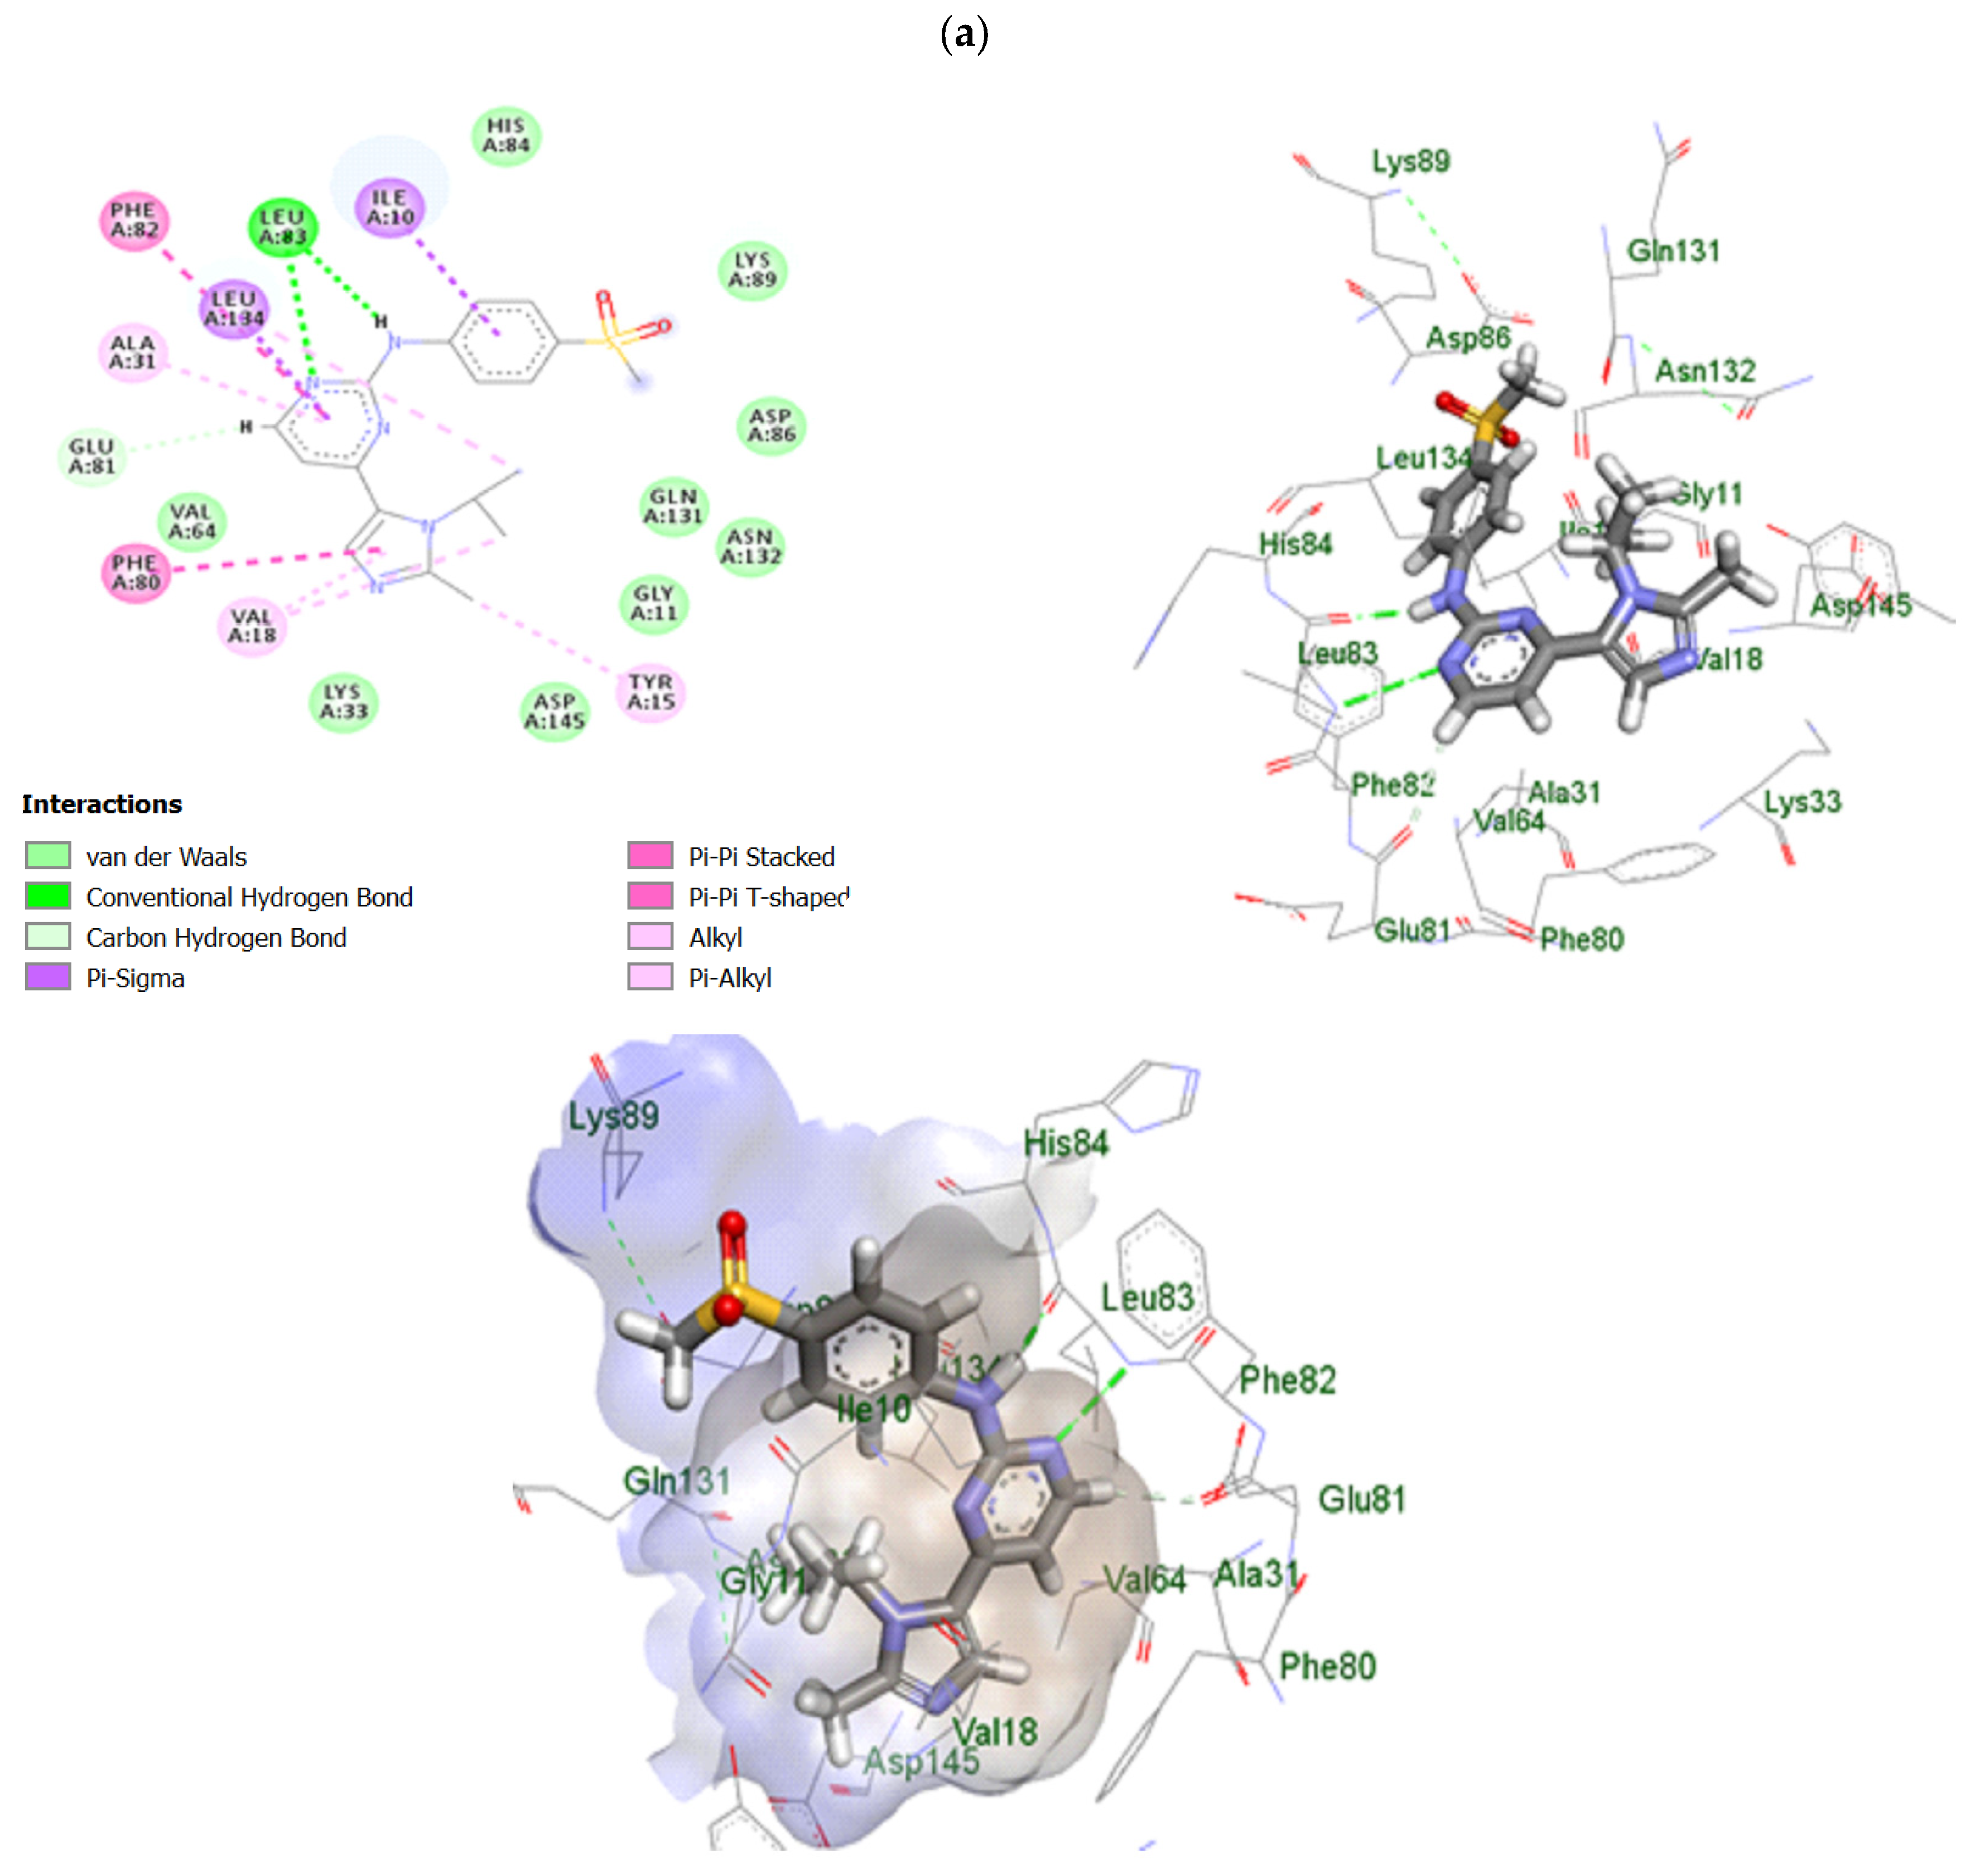
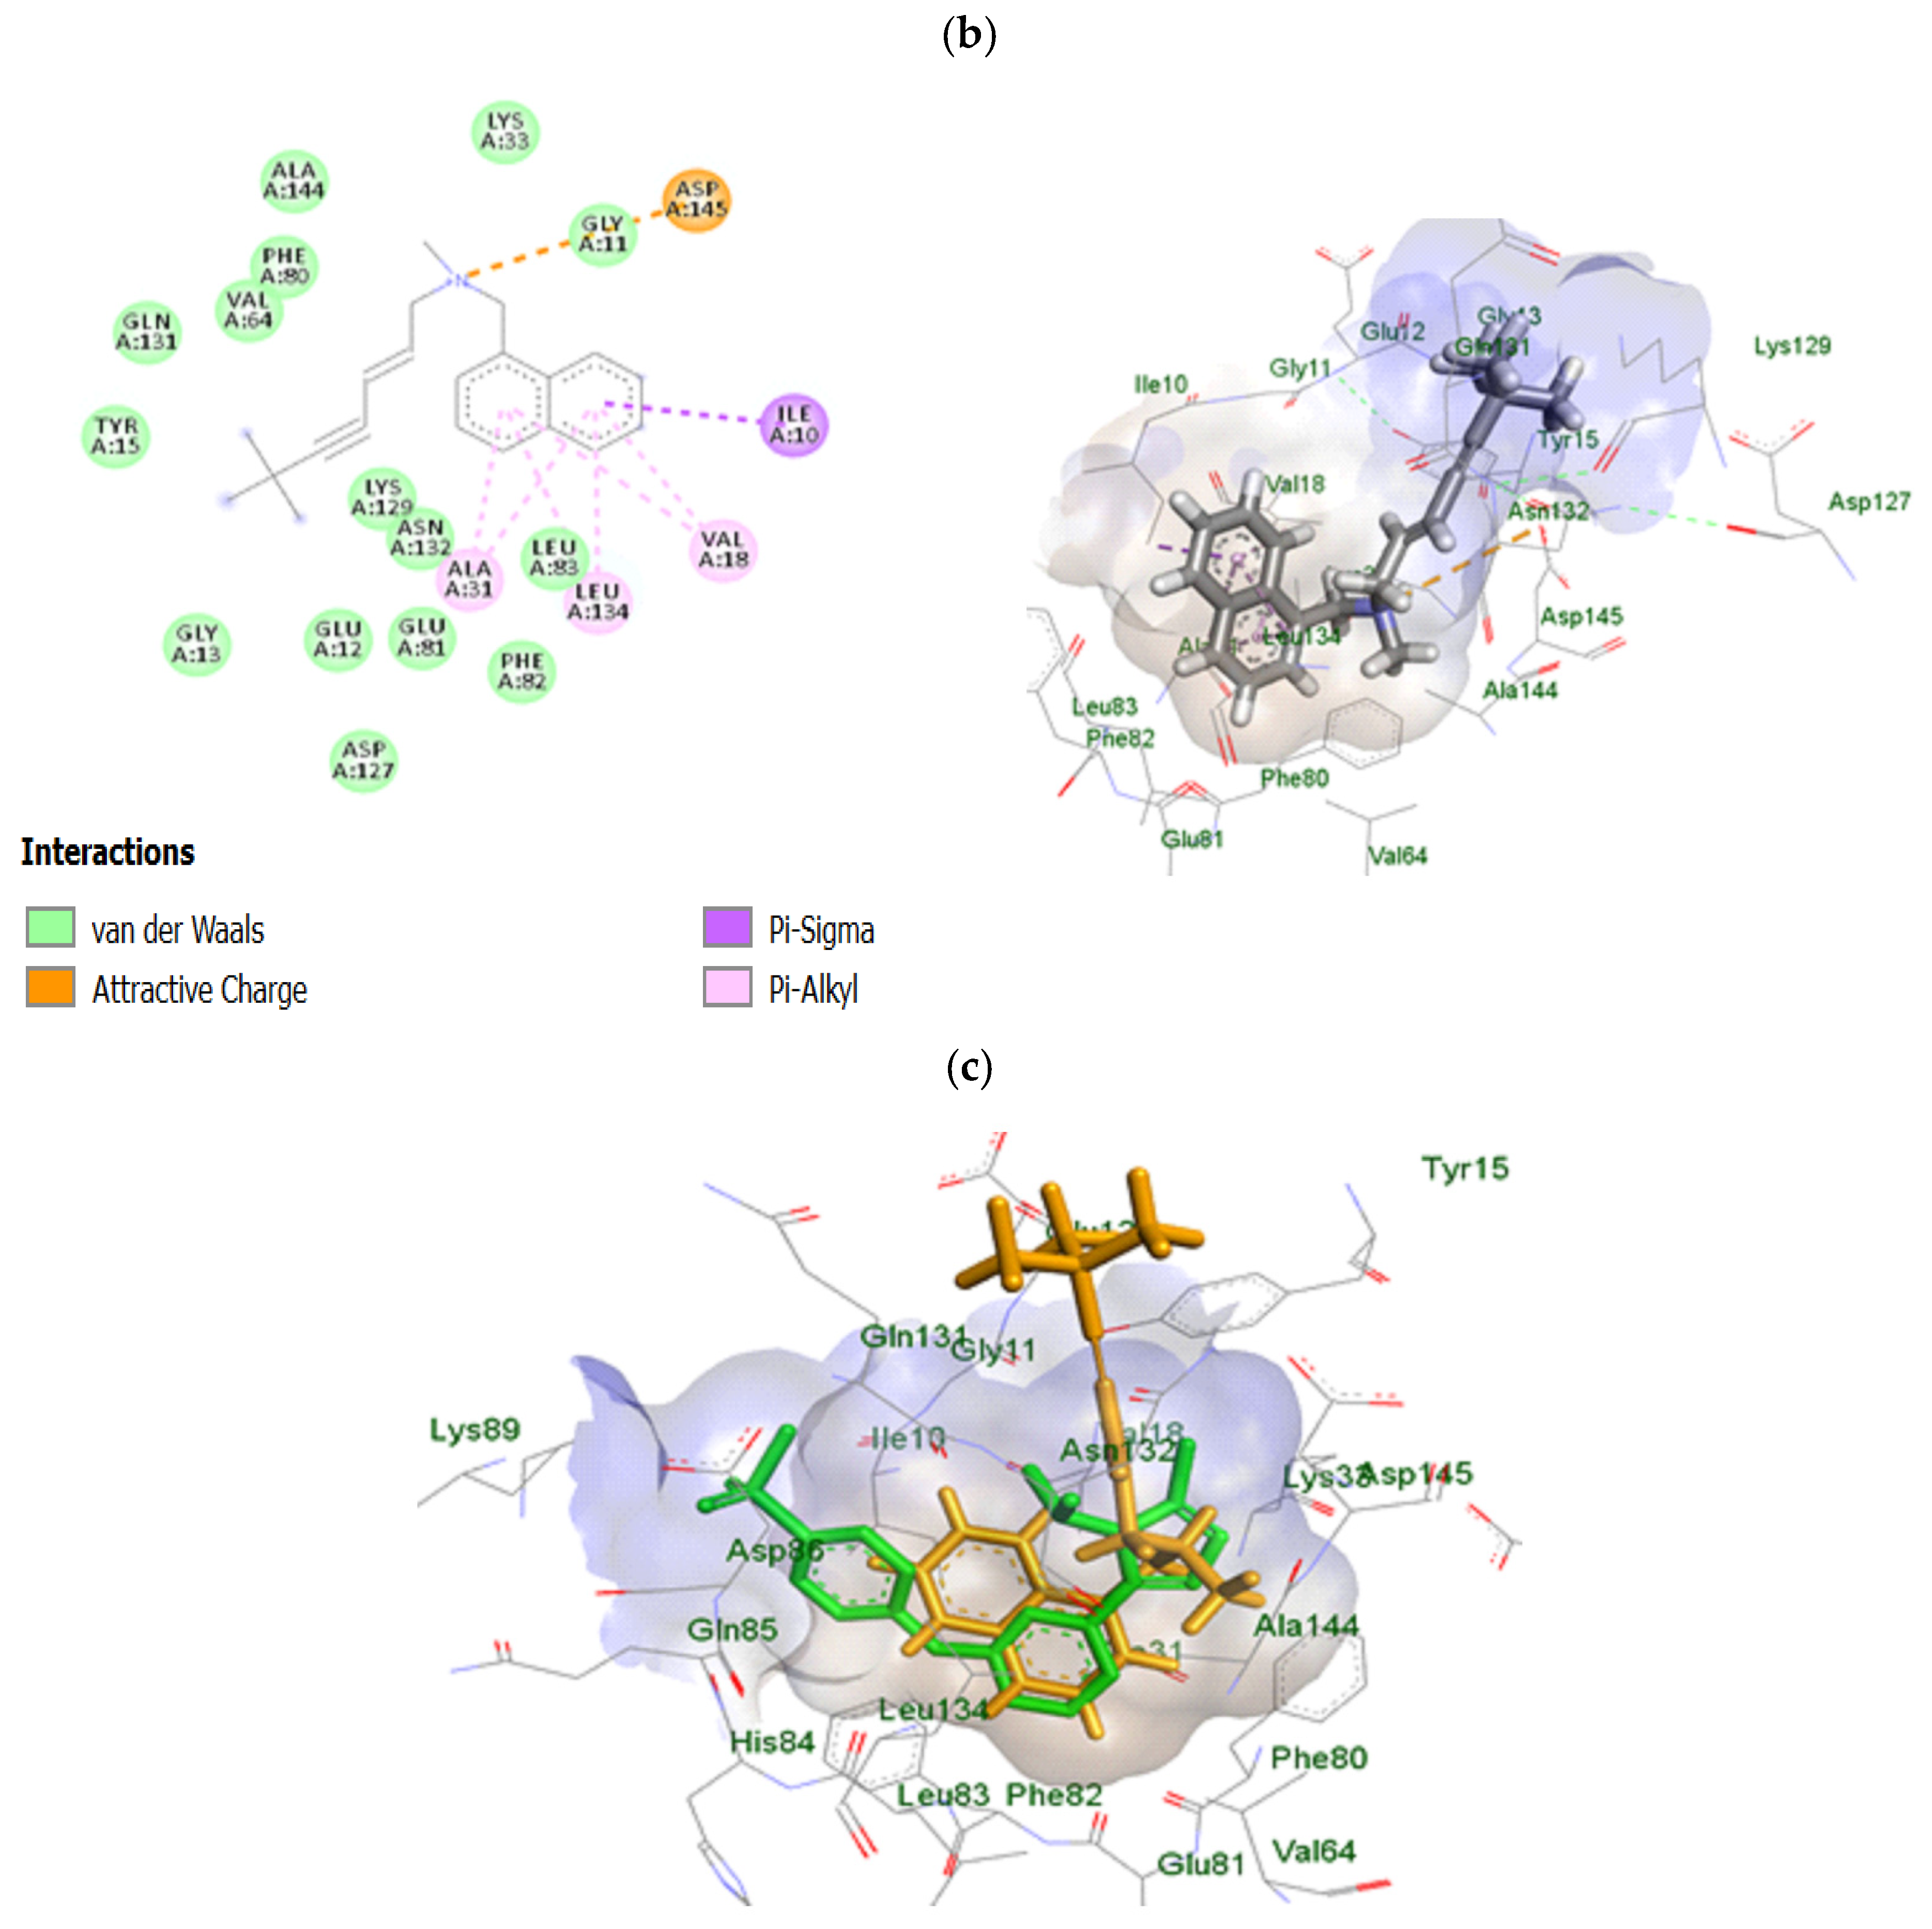
2.10. In Silico Study of TRB-Loaded NEF
3. Materials and Methods
3.1. Materials
3.2. Methods
3.2.1. Solubility Study of TRB in the NE Formulation Constituents
3.2.2. Ternary Phase Diagram Construction
3.2.3. Experimental Design of TRB-Loaded NE
3.2.4. Optimization of Formulation Components
3.2.5. Preparation of TRB-Loaded NE
3.2.6. Characterization of TRB-Loaded NE
Thermodynamic Stability Test
Measurement of PS, ZP, and PDI
In Vitro Cumulative Release Study and DE% Measurement
Fourier-Transform Infrared (FT-IR) Spectroscopy of the Optimum TRB-Loaded NE
Differential Scanning Calorimetry (DSC) of the Optimum TRB-Loaded NE
Transmission Electron Microscopy (TEM) of the Optimum TRB-Loaded NE
3.2.7. Preparation of TRB-Loaded NEF
3.2.8. Evaluation of the Prepared TRB-Loaded NEF
Foam Calculated Parameters
Foam Half-Life
Viscosity
Foam Collapse Capability
Bubble Size Estimation
Measurement of PS, ZP, and PDI
In Vitro Cumulative Release Study of TRB-Loaded NEF Formula
Ex Vivo Study
Histopathological Study
3.2.9. Cytotoxicity Evaluation of TRB-Loaded NEF
Cell Culture
In Vitro Cell Viability Assay
Apoptosis Assay
Cell Cycle Study
3.2.10. In Silico Study of TRB-Loaded NEF
3.2.11. Statistical Analysis
4. Conclusions
Supplementary Materials
Author Contributions
Funding
Institutional Review Board Statement
Informed Consent Statement
Data Availability Statement
Acknowledgments
Conflicts of Interest
References
- Leiter, U.; Eigentler, T.; Garbe, C. Epidemiology of Skin Cancer. In Sunlight, Vitamin D and Skin Cancer; Springer: New York, NY, USA, 2014; pp. 120–140. [Google Scholar]
- Roky, A.H.; Islam, M.M.; Ahasan, A.M.F.; Mostaq, M.S.; Mahmud, M.Z.; Amin, M.N.; Mahmud, M.A. Overview of skin cancer types and prevalence rates across continents. Cancer Pathog. Ther. Chin. Med. Assoc. 2024, 3, 89–100. [Google Scholar] [CrossRef] [PubMed]
- Wang, M.; Gao, X.; Zhang, L. Recent global patterns in skin cancer incidence, mortality, and prevalence. Chin. Med. J. 2024, 138, 185–192. [Google Scholar] [CrossRef] [PubMed]
- Narayanan, D.L.; Saladi, R.N.; Fox, J.L. Ultraviolet radiation and skin cancer. Int. J. Dermatol. 2010, 49, 978–986. [Google Scholar] [CrossRef] [PubMed]
- YYounis, M.K.; Khalil, I.A.; Younis, N.S.; Eldeen, R.R.F.; Abdelnaby, R.M.; Aldeeb, R.A.; Taha, A.A.; Hassan, D.H. Aceclofenac/Citronellol Oil Nanoemulsion Repurposing Study: Formulation, In Vitro Characterization, and In Silico Evaluation of Their Antiproliferative and Pro-Apoptotic Activity against Melanoma Cell Line. Biomedicines 2023, 11, 2531. [Google Scholar] [CrossRef]
- Alyami, M.H.; Musallam, A.A.; Ibrahim, T.M.; Mahdy, M.A.; Elnahas, H.M.; Aldeeb, R.A. The Exploitation of pH-Responsive Eudragit-Coated Mesoporous Silica Nanostructures in the Repurposing of Terbinafine Hydrochloride for Targeted Colon Cancer Inhibition: Design Optimization, In Vitro Characterization, and Cytotoxicity Assessment. Pharmaceutics 2023, 15, 2677. [Google Scholar] [CrossRef]
- Elsewedy, H.S.; Dhubiab, B.E.A.; Mahdy, M.A.; Elnahas, H.M. Development, optimization, and evaluation of PEGylated brucine-loaded PLGA nanoparticles. Drug Deliv. 2020, 27, 1134–1146. [Google Scholar] [CrossRef]
- Musallam, A.A.; Mahdy, M.A.; Elnahas, H.M.; Aldeeb, R.A. Optimization of mirtazapine loaded into mesoporous silica nanostructures via Box-Behnken design: In-vitro characterization and in-vivo assessment. Drug Deliv. 2022, 29, 1582–1594. [Google Scholar] [CrossRef]
- Sánchez-López, E.; Guerra, M.; Dias-Ferreira, J.; Lopez-Machado, A.; Ettcheto, M.; Cano, A.; Espina, M.; Camins, A.; Garcia, M.L.; Souto, E.B. Current applications of nanoemulsions in cancer therapeutics. Nanomaterials 2019, 9, 821. [Google Scholar] [CrossRef]
- Adnan, M.; Akhter, M.H.; Afzal, O.; Altamimi, A.S.A.; Ahmad, I.; Alossaimi, M.A.; Jaremko, M.; Emwas, A.-H.; Haider, T.; Haider, M.F. Exploring Nanocarriers as Treatment Modalities for Skin Cancer. Molecules 2023, 28, 5905. [Google Scholar] [CrossRef]
- Alhakamy, N.A.; Shadab, M. Repurposing itraconazole loaded PLGA nanoparticles for improved antitumor efficacy in non-small cell lung cancers. Pharmaceutics 2019, 11, 685. [Google Scholar] [CrossRef]
- Eita, A.S.; Makky, A.M.A.; Anter, A.; Khalil, I.A. Atorvastatin-loaded emulsomes foam as a topical antifungal formulation. Int. J. Pharm. X 2022, 4, 100140. [Google Scholar] [CrossRef] [PubMed]
- Eita, A.S.; Makky, A.M.A.; Anter, A.; Khalil, I.A. Repurposing of atorvastatin emulsomes as a topical antifungal agent. Drug Delivery 2022, 29, 3414–3431. [Google Scholar] [CrossRef] [PubMed]
- Huang, C.-S.; Ho, W.-L.; Lee, W.-S.; Sheu, M.-T.; Wang, Y.-J.; Tu, S.-H.; Chen, R.-J.; Chu, J.-S.; Chen, L.-C.; Lee, C.-H.; et al. SP1-regulated p27/Kip1 gene expression is involved in terbinafine-induced human A431 cancer cell differentiation: An in vitro and in vivo study. Biochem. Pharmacol. 2008, 75, 1783–1796. [Google Scholar] [CrossRef]
- Uzun, C.; Güven, O. Controlled Release of Terbinafine Hydrochloride from PH Sensitive Poly(Acrylamide/Maleic Acid) Hydrogels. Int. J. Pharm. 2000, 203, 149–157. [Google Scholar] [CrossRef]
- Li, C.; Wang, Y.; Liu, D.; Wong, C.C.; Coker, O.O.; Zhang, X.; Liu, C.; Zhou, Y.; Liu, Y.; Kang, W.; et al. Squalene epoxidase drives cancer cell proliferation and promotes gut dysbiosis to accelerate colorectal carcinogenesis. Gut 2022, 71, 2253–2265. [Google Scholar] [CrossRef]
- Farkas, D.; Kállai-Szabó, N.; Sárádi-Kesztyűs, Á.; Lengyel, M.; Magramane, S.; Kiss, É.; Antal, I. Investigation of propellant-free aqueous foams as pharmaceutical carrier systems. Pharm. Dev. Technol. 2021, 26, 253–261. [Google Scholar] [CrossRef]
- Farkas, D.; Kállai-Szabó, N.; Antal, I. Foams as carrier systems for pharmaceuticals and cosmetics. Acta Pharm. Hung. 2019, 89, 5–15. [Google Scholar] [CrossRef]
- Parsa, M.; Trybala, A.; Malik, D.J.; Starov, V. Foam in pharmaceutical and medical applications. Curr. Opin. Colloid Interface Sci. 2019, 44, 153–167. [Google Scholar] [CrossRef]
- Abdallah, M.H.; Abu Lila, A.S.; El-Nahas, H.M.; Ibrahim, T.M. Optimization of Potential Nanoemulgels for Boosting Transdermal Glimepiride Delivery and Upgrading Its Anti-Diabetic Activity. Gels 2023, 9, 494. [Google Scholar] [CrossRef]
- Abdulla, N.A.; Balata, G.F.; El-ghamry, H.A.; Gomaa, E. Intranasal delivery of Clozapine using nanoemulsion-based in-situ gels: An approach for bioavailability enhancement. Saudi Pharm. J. 2021, 29, 1466–1485. [Google Scholar] [CrossRef]
- Gul, U.; Khan, M.I.; Madni, A.; Sohail, M.F.; Rehman, M.; Rasul, A.; Peltonen, L. Olive oil and clove oil-based nanoemulsion for topical delivery of terbinafine hydrochloride: In vitro and ex vivo evaluation. Drug Deliv. 2022, 29, 600–612. [Google Scholar] [CrossRef] [PubMed]
- Elgendy, H.A.; Makky, A.M.A.; Elakkad, Y.E.; Awad, H.H.; Hassab, M.A.E.; Younes, N.F. Atorvastatin loaded lecithin-coated zein nanoparticles based thermogel for the intra-articular management of osteoarthritis: In-silico, in-vitro, and in-vivo studies. J. Pharm. Investig. 2024, 54, 497–518. [Google Scholar] [CrossRef]
- Mulleria, S.S.; Marina, K.; Ghetia, S.M. Formulation, Optimization and in vitro Evaluation of Apremilast Nanoemulgel for Topical Delivery. Int. J. Pharm. Investig. 2021, 11, 230–237. [Google Scholar] [CrossRef]
- Elmataeeshy, M.E.; Sokar, M.S.; Bahey-El-Din, M.; Shaker, D.S. Enhanced transdermal permeability of Terbinafine through novel nanoemulgel formulation; Development, in vitro and in vivo characterization. Future J. Pharm. Sci. 2018, 4, 18–28. [Google Scholar] [CrossRef]
- Gorjian, H.; Mihankhah, P.; Khaligh, N.G. Influence of tween nature and type on physicochemical properties and stability of spearmint essential oil (Mentha spicata L.) stabilized with basil seed mucilage nanoemulsion. J. Mol. Liq. 2022, 359, 119379. [Google Scholar] [CrossRef]
- Shehata, T.M.; Elnahas, H.M.; Elsewedy, H.S. Development, Characterization and Optimization of the Anti-Inflammatory Influence of Meloxicam Loaded into a Eucalyptus Oil-Based Nanoemulgel. Gels 2022, 8, 262. [Google Scholar] [CrossRef]
- Cho, H.J.; Lee, D.W.; Marasini, N.; Poudel, B.K.; Kim, J.H.; Ramasamy, T.; Yoo, B.K.; Choi, H.-G.; Yong, C.S.; Kim, J.O. Optimization of self-microemulsifying drug delivery system for telmisartan using Box-Behnken design and desirability function. J. Pharm. Pharmacol. 2013, 65, 1440–1450. [Google Scholar] [CrossRef]
- Elgendy, H.A.; Makky, A.M.A.; Elakkad, Y.E.; Ismail, R.M.; Younes, N.F. Syringeable atorvastatin loaded eugenol enriched PEGylated cubosomes in-situ gel for the intra-pocket treatment of periodontitis: Statistical optimization and clinical assessment. Drug Deliv. 2023, 30, 2162159. [Google Scholar] [CrossRef]
- Hassan, S.U.; Khalid, I.; Hussain, L.; Barkat, K.; Khan, I.U. Development and Evaluation of pH-Responsive Pluronic F 127 Co-Poly- (Acrylic Acid) Biodegradable Nanogels for Topical Delivery of Terbinafine HCL. Dose-Response 2022, 20, 15593258221095977. [Google Scholar] [CrossRef]
- Ibrahim, T.M.; Abdallah, M.H.; El-Megrab, N.A.; El-Nahas, H.M. Upgrading of dissolution and anti-hypertensive effect of Carvedilol via two combined approaches: Self-emulsification and liquisolid techniques. Drug Dev. Ind. Pharm. 2018, 44, 873–885. [Google Scholar] [CrossRef]
- Ullah, I.; Alhodaib, A.; Naz, I.; Ahmad, W.; Ullah, H.; Amin, A.; Nawaz, A. Fabrication of Novel Omeprazole-Based Chitosan Coated Nanoemulgel Formulation for Potential Anti-Microbia; In Vitro and Ex Vivo Characterizations. Polymers 2023, 15, 1298. [Google Scholar] [CrossRef] [PubMed]
- Arzhavitina, A. Foams as Novel Delivery Vehicle for Topical Application. Ph.D. Thesis, Christian Albrecht University, Kiel, Germany, 2009. [Google Scholar]
- Hoc, D.; Haznar-Garbacz, D. Foams as unique drug delivery systems. Eur. J. Pharm. Biopharm. 2021, 167, 73–82. [Google Scholar] [CrossRef] [PubMed]
- Bureiko, A.; Trybala, A.; Kovalchuk, N.; Starov, V. Current applications of foams formed from mixed surfactant-polymer solutions. Adv. Colloid Interface Sci. 2015, 222, 670–677. [Google Scholar] [CrossRef] [PubMed]
- Arzhavitina, A.; Steckel, H. Foams for pharmaceutical and cosmetic application. Int. J. Pharm. 2010, 394, 1–17. [Google Scholar] [CrossRef]
- Miyashita, M.; Akamatsu, M.; Sakai, K.; Sakai, H. Improving foam stability of ethanol/water mixture with anionic surfactant and long-chain alcohol. Chem. Lett. 2020, 49, 453–456. [Google Scholar] [CrossRef]
- Brierley, E.R.; Wilde, P.J.; Onishi, A.; Hughes, P.S.; Simpson, W.J.; Clark, D.C. The influence of ethanol on the foaming properties of beer protein fractions: A comparison of rudin and microconductivity methods of foam assessment. J. Sci. Food Agric. 1996, 70, 531–537. [Google Scholar] [CrossRef]
- Wang, H.; Li, J.; Wang, Z.; Wang, D.; Zhan, H. Experimental Investigation of the Mechanism of Foaming Agent Concentration Affecting Foam Stability. J. Surfactants Deterg. 2017, 20, 1443–1451. [Google Scholar] [CrossRef]
- Gennari, C.G.M.; Selmin, F.; Minghetti, P.; Cilurzo, F. Medicated Foams and Film Forming Dosage Forms as Tools to Improve the Thermodynamic Activity of Drugs to be Administered Through the Skin. Curr. Drug Deliv. 2019, 16, 461–471. [Google Scholar] [CrossRef]
- Zhao, Y.; Brown, M.B.; Jones, S.A. The effects of particle properties on nanoparticle drug retention and release in dynamic minoxidil foams. Int. J. Pharm. 2010, 383, 277–284. [Google Scholar] [CrossRef]
- Khan, A.S.; Shah, K.U.; Al Mohaini, M.; Alsalman, A.J.; Al Hawaj, M.A.; Alhashem, Y.N.; Ghazanfar, S.; Khan, K.A.; Niazi, Z.R.; Farid, A. Tacrolimus-Loaded Solid Lipid Nanoparticle Gel: Formulation Development and In Vitro Assessment for Topical Applications. Gels 2022, 8, 129. [Google Scholar] [CrossRef]
- Jain, S.; Pattewad, V.; Bhargavi, N.; Yadav, S.; Sharma, R.; Ghadi, R.; Date, T.; Katiyar, S.S.; Chaudhari, D.; Kuche, K.; et al. Exploring the therapeutic potential of functional excipient-based nanoemulgel of fluticasone propionate for the management of psoriasis. J. Drug Deliv. Sci. Technol. 2023, 84, 104435. [Google Scholar] [CrossRef]
- Williams, A.C.; Barry, B.W. Penetration enhancers. Adv. Drug Deliv. Rev. 2012, 64, 128–137. [Google Scholar] [CrossRef]
- Alhasso, B.; Ghori, M.U.; Conway, B.R. Systematic Review on the Effectiveness of Essential and Carrier Oils as Skin Penetration Enhancers in Pharmaceutical Formulations. Sci. Pharm. 2022, 90, 14. [Google Scholar] [CrossRef]
- Sedeky, A.S.; Khalil, I.A.; Hefnawy, A.; El-Sherbiny, I.M. Development of core-shell nanocarrier system for augmenting piperine cytotoxic activity against human brain cancer cell line. Eur. J. Pharm. Sci. 2018, 118, 103–112. [Google Scholar] [CrossRef]
- Zarif Attalla, K.; Hassan, D.H.; Teaima, M.H.; Yousry, C.; El-Nabarawi, M.A.; Said, M.A.; Elhabal, S.F. Enhanced Intranasal Delivery of Atorvastatin via Superparamagnetic Iron-Oxide-Loaded Nanocarriers: Cytotoxicity and Inflammation Evaluation and In Vivo, In Silico, and Network Pharmacology Study for Targeting Glioblastoma Management. Pharmaceuticals 2025, 18, 421. [Google Scholar] [CrossRef]
- Chien, M.H.; Lee, T.S.; Kao, C.; Yang, S.F.; Lee, W. Sen. Terbinafine inhibits oral squamous cell carcinoma growth through anti-cancer cell proliferation and anti-angiogenesis. Mol. Carcinog. 2012, 51, 389–399. [Google Scholar] [CrossRef]
- Hu, L.-P.; Huang, W.; Wang, X.; Xu, C.; Qin, W.-T.; Li, D.; Tian, G.; Li, Q.; Zhou, Y.; Chen, S.; et al. Terbinafine prevents colorectal cancer growth by inducing dNTP starvation and reducing immune suppression. Mol. Ther. 2022, 30, 3284–3299. [Google Scholar] [CrossRef]
- Zhang, E.-B.; Zhang, X.; Wang, K.; Zhang, F.; Chen, T.-W.; Ma, N.; Ni, Q.-Z.; Wang, Y.-K.; Zheng, Q.-W.; Cao, H.-J.; et al. Antifungal agent Terbinafine restrains tumor growth in preclinical models of hepatocellular carcinoma via AMPK-mTOR axis. Oncogene 2021, 40, 5302–5313. [Google Scholar] [CrossRef]
- Belal, A.; Gawad, N.M.A.; Mehany, A.B.M.; Abourehab, M.A.S.; Elkady, H.; Al-Karmalawy, A.A.; Ismael, A.S. Design, synthesis and molecular docking of new fused 1H-pyrroles, pyrrolo[3,2-d]pyrimidines and pyrrolo[3,2-e][1, 4]diazepine derivatives as potent EGFR/CDK2 inhibitors. J. Enzym. Inhib. Med. Chem. 2022, 37, 1884–1902. [Google Scholar] [CrossRef]
- Phagna, M.; Badhwar, R.; Singh, M.; Alhalmi, A.; Khan, R.; Noman, O.M.; Alahdab, A. Development and Characterization of Terbinafine-Loaded Nanoemulgel for Effective Management of Dermatophytosis. Gels 2023, 9, 894. [Google Scholar] [CrossRef]
- Aldeeb, R.A.E.; Mahdy, M.A.E.G.; El-Nahas, H.M.; Musallam, A.A. Design of mirtazapine solid dispersion with different carriers’ systems: Optimization, in vitro evaluation, and bioavailability assessment. Drug Deliv. Transl. Res. 2023, 13, 2340–2352. [Google Scholar] [CrossRef] [PubMed]
- Attia, M.S.; Radwan, M.F.; Ibrahim, T.S.; Ibrahim, T.M. Development of Carvedilol-Loaded Albumin-Based Nanoparticles with Factorial Design to Optimize In Vitro and In Vivo Performance. Pharmaceutics 2023, 15, 1425. [Google Scholar] [CrossRef]
- Yang, Y.; Ou, R.; Guan, S.; Ye, X.; Hu, B.; Zhang, Y.; Lu, S.; Zhou, Y.; Yuan, Z.; Zhang, J.; et al. A novel drug delivery gel of terbinafine hydrochloride with high penetration for external use. Drug Deliv. 2015, 22, 1086–1093. [Google Scholar] [CrossRef] [PubMed]
- Sedki, M.; Khalil, I.A.; El-Sherbiny, I.M. Hybrid nanocarrier system for guiding and augmenting simvastatin cytotoxic activity against prostate cancer. Artif. Cells Nanomed. Biotechnol. 2018, 46, S641–S650. [Google Scholar] [CrossRef] [PubMed]
- Mohamed, M.E.; Abdelnaby, R.M.; Younis, N.S. β-caryophyllene ameliorates hepatic ischemia reperfusion-induced in-jury: The involvement of Keap1/Nrf2/HO 1/NQO 1 and TLR4/NF-κB/NLRP3 signaling pathways. Eur. Rev. Med. Pharmacol. Sci. 2022, 26, 8551–8566. [Google Scholar] [CrossRef]


| Factors | Actual Levels (Coded) | |
|---|---|---|
| Low Limit (−1) | High Limit (+1) | |
| A: oil concentration (%) | 10 | 20 |
| B: Smix concentration (%) | 22 | 88 |
| Responses | Goals | |
| Y1: PS (nm) | Minimize | |
| Y2: ZP (mV) | Maximize | |
| Y3: DE% (%) | Maximize | |
| F | A: Oil Concentration (%) | B: Tween 20 Concentration in the Smix (%) | Y1: PS (nm) | Y2: ZP (mV) * | Y3: DE% (%) |
|---|---|---|---|---|---|
| 1 | 20 | 22 | 173.40 ± 2.51 | 9.37 ± 0.97 | 71.51 ± 1.67 |
| 2 | 17 | 76 | 188.20 ± 3.41 | 8.16 ± 0.88 | 55.60 ± 0.92 |
| 3 | 16 | 51 | 180.10 ± 2.31 | 12.30 ± 1.57 | 79.78 ± 1.89 |
| 4 | 10 | 68 | 171.50 ± 1.71 | 11.90 ± 0.98 | 58.73 ± 1.67 |
| 5 | 20 | 88 | 157.70 ± 2.81 | 6.88 ± 0.57 | 55.16 ± 1.33 |
| 6 | 13 | 88 | 123.10 ± 1.91 | 7.26 ± 0.50 | 68.30 ± 1.95 |
| 7 | 10 | 22 | 186.60 ± 2.84 | 13.90 ± 0.99 | 86.50 ± 1.78 |
| 8 | 20 | 58 | 195.30 ± 3.31 | 6.60 ± 1.37 | 66.66 ± 1.34 |
| 9 | 10 | 22 | 180.10 ± 2.91 | 15.90 ± 0.77 | 88.50 ± 1.84 |
| 10 | 15 | 22 | 169.30 ± 2.11 | 10.50 ± 0.52 | 76.41 ± 1.74 |
| 11 | 20 | 22 | 146.90 ± 3.01 | 10.20 ± 0.47 | 75.80 ± 1.54 |
| 12 | 20 | 88 | 164.20 ± 2.81 | 7.09 ± 0.87 | 60.20 ± 0.80 |
| Factors | Optimized Level | ||
|---|---|---|---|
| A: oil concentration (%) | 10% | ||
| B: Tween 20 concentration in the Smix (%) | 22% | ||
| Responses | Observed | Predicted | Prediction error (%) |
| Y1: PS (nm) | 186.60 ± 2.84 | 182.80 | −2.07 |
| Y2: ZP (mV) | −13.90 ± 0.99 | −14.20 | 2.11 |
| Y3: DE% (%) | 86.50 ± 1.78 | 83.70 | −3.34 |
| Parameters | TER-Loaded NEF | TER-Loaded Control Foam |
|---|---|---|
| Jss (μg/cm2·h−1) | 47.53 ± 4.98 | 6.39 ± 1.83 |
| Kp × 10−3 (cm/h) | 19.01 ± 2.96 | 2.55 ± 0.87 |
| Tlag (h) | 1.91 ± 0.37 | - |
| Er | 7.43 | - |
Disclaimer/Publisher’s Note: The statements, opinions and data contained in all publications are solely those of the individual author(s) and contributor(s) and not of MDPI and/or the editor(s). MDPI and/or the editor(s) disclaim responsibility for any injury to people or property resulting from any ideas, methods, instructions or products referred to in the content. |
© 2025 by the authors. Licensee MDPI, Basel, Switzerland. This article is an open access article distributed under the terms and conditions of the Creative Commons Attribution (CC BY) license (https://creativecommons.org/licenses/by/4.0/).
Share and Cite
Musallam, A.A.; Aldeeb, R.A.; Mansour, R.M.; Kassem, M.A.E.-k.; Saeed, D.F.; Mahdy, M.A.; Abdelnaby, R.M.; Elnahas, H.M.; Ibrahim, T.M. Development of a Novel Drug Delivery System “Nanoemulfoam” for Topical Delivery of Terbinafine Hydrochloride as a Repurposed Therapy in Skin Cancer: Formulation, Optimization, In Vitro Characterization, Ex Vivo Transdermal Permeability, Cytotoxicity Studies, and In Silico Assessment. Pharmaceuticals 2025, 18, 972. https://doi.org/10.3390/ph18070972
Musallam AA, Aldeeb RA, Mansour RM, Kassem MAE-k, Saeed DF, Mahdy MA, Abdelnaby RM, Elnahas HM, Ibrahim TM. Development of a Novel Drug Delivery System “Nanoemulfoam” for Topical Delivery of Terbinafine Hydrochloride as a Repurposed Therapy in Skin Cancer: Formulation, Optimization, In Vitro Characterization, Ex Vivo Transdermal Permeability, Cytotoxicity Studies, and In Silico Assessment. Pharmaceuticals. 2025; 18(7):972. https://doi.org/10.3390/ph18070972
Chicago/Turabian StyleMusallam, Abeer A., Reem A. Aldeeb, Riham M. Mansour, Manar Abd El-karim Kassem, Doaa Fayez Saeed, Mahmoud A. Mahdy, Rana M. Abdelnaby, Hanan M. Elnahas, and Tarek M. Ibrahim. 2025. "Development of a Novel Drug Delivery System “Nanoemulfoam” for Topical Delivery of Terbinafine Hydrochloride as a Repurposed Therapy in Skin Cancer: Formulation, Optimization, In Vitro Characterization, Ex Vivo Transdermal Permeability, Cytotoxicity Studies, and In Silico Assessment" Pharmaceuticals 18, no. 7: 972. https://doi.org/10.3390/ph18070972
APA StyleMusallam, A. A., Aldeeb, R. A., Mansour, R. M., Kassem, M. A. E.-k., Saeed, D. F., Mahdy, M. A., Abdelnaby, R. M., Elnahas, H. M., & Ibrahim, T. M. (2025). Development of a Novel Drug Delivery System “Nanoemulfoam” for Topical Delivery of Terbinafine Hydrochloride as a Repurposed Therapy in Skin Cancer: Formulation, Optimization, In Vitro Characterization, Ex Vivo Transdermal Permeability, Cytotoxicity Studies, and In Silico Assessment. Pharmaceuticals, 18(7), 972. https://doi.org/10.3390/ph18070972