Article

PARP Inhibition in Colorectal Cancer—A Comparison of Potential Predictive Biomarkers for Therapy

by
Abdulaziz Alfahed
Department of Medical Laboratory, College of Applied Medical Sciences, Prince Sattam bin Abdulaziz University, Al-Kharj 11942, Saudi Arabia
Pharmaceuticals 2025, 18(6), 905; https://doi.org/10.3390/ph18060905
Submission received: 19 May 2025 / Revised: 8 June 2025 / Accepted: 14 June 2025 / Published: 17 June 2025
(This article belongs to the Special Issue Precision Oncology: Targeting Molecular Subtypes in Cancer Therapy)

Abstract

Background/Objectives: PARP inhibitors (PARPis) currently play frontline roles in the management of prostate, pancreatic, ovarian and breast cancers, but their roles in colorectal cancer (CRC) management have yet to be clarified. Importantly, the specific predictive biomarkers for PARPis in CRC are still matters of investigations. The aim of this study is to identify the potential predictive biomarkers of PARP inhibition in CRC. Methods: Gene set enrichment analyses (GSEAs) and drug ontology enrichment analyses (DOEAs) of PARPi response gene sets were applied as the surrogates of PARPi response to two CRC cohorts in order to compare the predictive capacities of TP53 mutation status, MSI status, as well as PARP1 and PARP2 expression for PARP inhibition to those of a homologous repair deficiency surrogate, and large-scale state transition (LST). Differential enrichment score (ES) and ontology enrichment (OE) analyses were used to interrogate the differential correlation of the predictive biomarkers with PARPi response, relative to LST. Results: The results demonstrated that LST-low, rather than LST-high, CRC subsets exhibited an enrichment of the PARPi response, in contrast to what has been established for other cancers. Furthermore, CRC subsets with wild-type TP53, positive MSI, as well as high PARP1 and PARP2 expression exhibited an enrichment of the PARPi response gene sets. Moreover, there was no differential enrichment of the PARPi response between LST and each of the MSI statuses, PARP1 expression and PARP2 expression. Furthermore, the preliminary differential enrichment observed between the LST-based and TP53 mutation status-based PARPi responses could not be validated with further testing. Conclusions: MSI status, TP53 mutation status as well as PARP1 and PARP2 expression may be substitutes for low LST as predictive biomarkers of PARPi response in CRC.

1. Introduction

Colorectal cancer remains an important public health disease worldwide [1], in spite of the effort that has been expended towards understanding its molecular pathogenesis [2]. Currently, CRC is the third commonest cancer and the fourth cancer in terms of highest mortality rates [1]. These dismal statistics warrant continuous efforts at elucidating CRC biology in order to uncover the biomarkers of prognostic and predictive relevance [3,4].
PARP inhibition has become a foremost strategy for cancer therapy in recent times [5,6]. Currently, PARP inhibitors (PARPis) are major players in the first- and later-line therapies for breast, prostate, ovarian and pancreatic cancers [5,7], for which the Food and Drug Administration has approved multiple PARPis for therapies [5]. This study explored the genomic data of CRC cohorts for potential biomarkers of PARP inhibition. Although PARP inhibition has been investigated in CRC cell culture studies [8,9,10], the specific predictive biomarkers for the PARPis in CRC are still a matter of clinical and preclinical investigations. The approved biomarkers for PARPi response prediction in breast, ovarian, pancreatic and prostate cancers are BRCA alterations and homologous repair deficiency (HRD) [11,12,13]. And whilst HRD is detectable in CRC using next generation sequencing and DNA SNP array methodologies [8], with the frequency of BRCA1 and BRCA2 mutations for CRC in the order of 0.2–2.8%, BRCA mutations are not common molecular alterations in this cancer [14,15,16]. Moreover, HRD scores may not fully capture the context in which PARP1 and PARP2 protect the CRC genome against worsening genotoxic stress, nor the contexts in which their inhibition would be beneficial for tumor cell killing [8]. Furthermore, HRD detection has demonstrated certain features that limits its clinical usefulness as a dynamic biomarker for responses to PARP inhibition [17]. These limitations include the finding that genomic scars detected by HRD tests persist in spite of the reinstatement of homologous recombination repair function that may occur as part of cancer evolution [17]. The PARPi biomarkers that have been interrogated in CRC, including TP53 and ATM mutation statuses, and microsatellite instability (MSI) [8,10,18]. The aim of this study is to explore the CRC expression datasets with a view to identifying the predictive biomarkers for PARP inhibition in CRC. The specific objectives include the following: (i) to elucidate the biological significances of the PARPi targets, PARP1/2, in CRC; (ii) to clarify the roles of HRD in predicting PARPi response in CRC; and (iii) to interrogate the potential predictive relevance of PARP1/2 expression, TP53 mutations, ATM expression, MSI status, aneuploidy and fraction genome altered (FGA) in PARP inhibition, and compare these findings to the HRD scores and HRD surrogates. The study hypothesis is that the biomarkers TP53 mutations, MSI, FGA, ATM expression and PARP1/2 expression may be more relevant to CRC biology than HRD because of the rarity of BRCA mutations in CRC and hence, may also be suitable markers for PARPi in this cancer type as is the case for HRD and its surrogates.

2. Results

PARP1 and PARP2 expression exhibited a direct relationship with each other, suggesting that both PARP genes may function together in the same biological pathways (R = 0.242, p < 0.001; X2 = 17.663, p < 0.001). For the purpose of GSEA, the HRD and LST scores were dichotomized using biologically relevant thresholds from previous studies.

2.1. PARP1 and PARP2 Expression Display Correlations with the Clinico-Molecular and Genomic Features of CRC

One-way ANOVA was used to test for differences in the PARP1 and PARP2 expression levels between the clinicopathological and molecular subsets of CRC. Both PARP1 and PARP2 expression displayed significant correlations with MSI status, the molecular subtypes of CRC, aneuploidy and BRAF mutations but not TP53 mutations, FGA or LST. Specifically, PARP1 and PARP2 expression were higher in MSI more than MSS tumours, and in Hypermutated more than either chromosomal instability (CIN)/Epithelial or genome-stable (GS)/Mesenchymal tumours. Moreover, PARP1 and PARP2 expression were lower in tumor subsets with high Aneuploidy score, although the correlation with LST and FGA did not achieve statistical significance for PARP1 and PARP2, respectively (Supplementary Materials S1 and Figure 1). The results confirmed the hypothesis that PARP1 and PARP2 are relevant to the molecular pathogenesis of CRC. Specifically, the results showed that the PARP genes may function in the maintenance of genomic stability in CRC with low chromosomal instability. In addition, PARP1 and PARP2 expression displayed direct correlations with Mutation Count and TMB, highlighting their association with MSI and Hypermutated CRC subsets (Supplementary Materials S1 and Figure 1). Furthermore, high PARP2 expression, but not PARP1, showed an association with right-sided tumors, late pathological tumor stages, and disease-free survival (Supplementary Materials S2 and S3). Also, bivariate correlation demonstrated indirect correlations between the PARP genes and their promoter methylation in the TCGA cohort (methylation data were not available for the Sidra-LUMC cohort), while one-way ANOVA showed that PARP1 and PARP2 copy number alterations (CNAs) were correlated with PARP1 and PARP2 expression, respectively, in both CRC cohorts (Supplementary Materials S4). The results of multiple linear regression analyses showed that both copy number status and methylation states contribute independently to the deregulation of PARP1 expression in CRC, whereas PARP2 CNA, but not methylation, was independently associated with PARP2 expression deregulation. (Supplementary Materials S4). The overall results demonstrated that PARP1 and PARP2 may have biological roles in CRC pathogenesis.

2.2. PARPi Response Gene Set Validation in Using Breast Cancer (BC) Cohort

To validate the utility of PARPi gene set enrichment and drug ontology enrichment analyses (GSEAs and DOEAs) for PARPi response surrogacy, as well as to select the most sensitive PARPi response gene sets for application to the colorectal (CRC) cohorts, and confirm which HRD state (high versus low) in BC exhibits enrichment for PARPi response, GSEAs were performed with TAI, LOH, LST, and BRCA1 and BRCA2 expression phenotypes for the BC cohorts using 22 PARPi gene sets for olaparib, rucaparib, veliparib and talazoparib. The gene sets were obtained from the Harmonizome database (https://maayanlab.cloud/Harmonizome/; accessed on 28 April 2025) and compiled into a single PARPi response gene set of 1242 genes. The results demonstrated an enrichment of the PARPi response gene set in the HRD-high, TAI-high, LST-high, LOH-high and BC subsets, thereby validating the GSEAs as surrogates for PARPi response (Figure 2). The results also demonstrated that the high HRD/HRD surrogate subset of BC were enriched in the PARPi response, in keeping with the established relationship between HRD and PARPi responses in BC. The enriched genes from the BC analyses were compiled into a PARPi response gene set for the CRC cohort analyses.

2.3. PARPi Response Enrichment in CRC Cases with Low Chromosomal Instability (CIN)

The CRC cohorts were interrogated for the identification of the predictive biomarkers of PARPi response, using GSEAs, and the compiled PARPi response gene set. The GSEA results showed that LST, MSI, TP53 mutation status as well as PARP1 and PARP2 expression, but not TP53 expression or ATM expression predicted an enrichment of the PARPi response gene set in both the CRC cohorts (Table 1 and Table 2). Specifically, the CRC subset with low LST, a positive MSI status, TP53 wild-type and high PARP1 and PARP2 expression demonstrated enrichment for the PARPi response gene set. The CRC subsets with high LST, MSS and positive TP53 mutations, and low PARP1 and PARP2 expression showed no enrichment of the PARPi response. The results showed that tumors with low CIN features (namely, low LST, TP53 wild-type and MSI positivity) were enriched for PARPi response. To confirm whether a PARPi response was associated with low CIN in CRC, GSEA was performed using the CIN indices, FGA and Aneuploidy scores, as phenotypes. FGA- and Aneuploidy-based GSEAs confirmed the enrichment of the PARPi response in the low FGA and Aneuploidy CRC subsets. (Table 1 and Table 2; Figure 3). This is in contrast to the established relationship between HRD scores and PARPi response in breast, prostate, pancreatic and ovarian cancers.

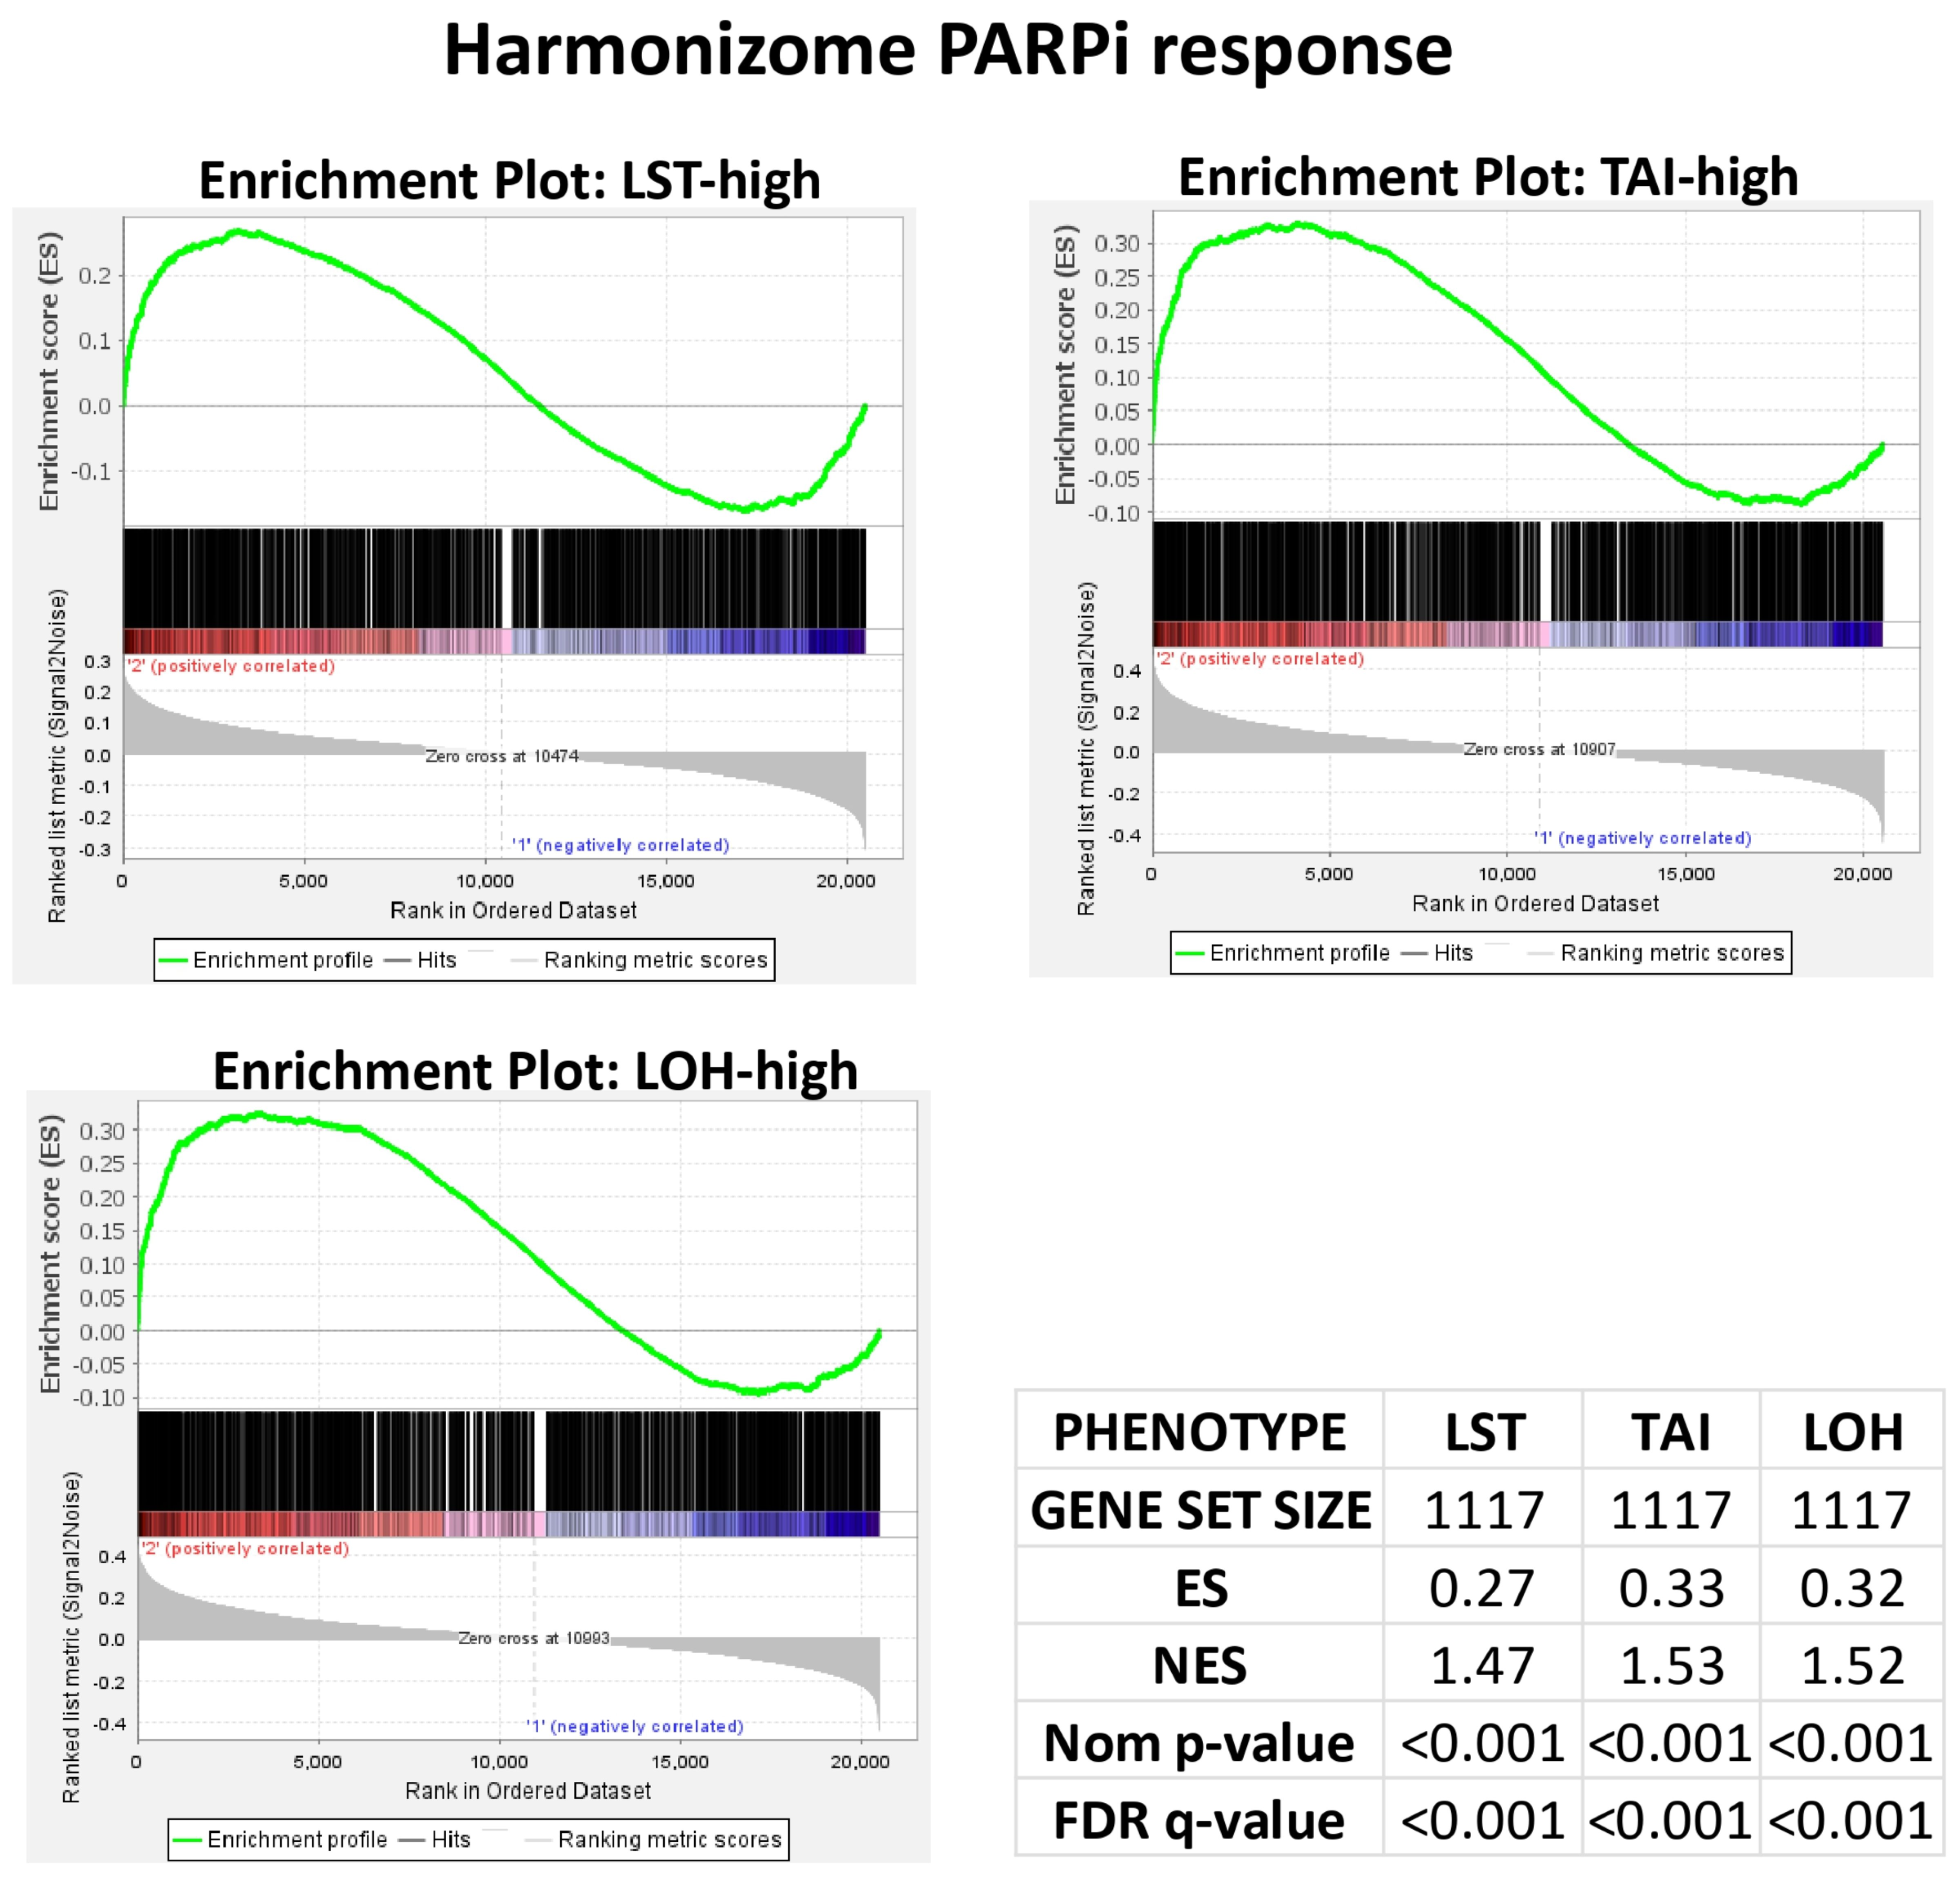
2.4. PARP1 Expression, PARP2 Expression and MSI Status Exhibit Non-Inferior Associations with PARPi Response in CRC

GSEAs followed by differential enrichment score (ES) analyses were executed to compare the performance of the biomarkers TP53 mutation, MSI status, PARP1 expression and PARP2 expression relative to the HRD surrogate, LST. There was no significant differential ES between LST, on the one hand, and MSI status, or PARP1 or PARP2 expression, on the other. The results demonstrated that MSI and PARP1/2 expression may substitute as biomarkers of PARPi in CRC. The differential ES analysis for TP53 mutation status demonstrated a significantly lower relationship with PARPi response in comparison to LST in the TCGA, but not in the Sidra-LUMC cohort (Table 3 and Table 4).

2.5. Drug Ontology Enrichment Analysis Confirms the Relative Magnitude of the Relationships Between PARPi Response Biomarkers

Drug ontology enrichment was performed on Enrichr for the LST-based, MSI-based, and PARP1 and PARP2 expression-based enrichment of PARPi gene sets using the LINCS L1000 Chem Pert Consensus Signatures. The results confirmed the association of LST, MSI, TP53 mutation status, and PARP1 and PARP2 expression with PARPi response ontology terms in both CRC cohorts (Supplementary Materials S5). The Wilcox signed-rank test of the fraction of the overlapping genes between the PARPi gene modules and the biomarker-based enriched gene list (gene set enrichment fraction, GSEF) demonstrated no significant differences between LST-based enrichment and those of MSI status, and PARP1, and PARP2 expression (Figure 4). Furthermore, GSEF analysis showed no differences between the LST-based enrichment and that of TP53 wildtype-based PARPi response enrichment in either CRC cohorts.

3. Discussion

This study has investigated the potential utility of alternative biomarkers for PARPi response prediction in CRC. Biomarkers with known biological significance in CRC, including TP53 mutations, MSI status and CIN markers such as FGA, aneuploidy score, in addition to the direct PARPi targets—PARP1 and PARP2—were interrogated for their potential utility as PARPi response biomarkers. This study first demonstrated the clinicopathological and molecular significances of PARP1 and PARP2 expression in CRC, thereby laying down the basis for their interrogation as potential predictive markers for PARPi response. The interrogation of CRC biomarkers demonstrated a consistent enrichment of PARPi response for some but not all of the biomarkers in both the CRC cohorts. To the best of my knowledge, no previous study on CRC or any other cancer has interrogated PARP1 or PARP2 expression for their capacities as predictive biomarkers of PARPi response. More importantly, this study also showed that some of the biomarkers may have a similar performance in PARPi response prediction compared to the traditional HRD/HRD surrogates. The study findings may have implications for the clinical deployment of PARPi biomarkers, and should be of importance to clinical oncology practice in low-resource settings. Whilst TP53 mutations, MSI and PARP1 and PARP2 expression testing can be performed with low throughput and more affordable molecular pathology tests such as PCR and immunohistochemistry [19,20], the assay for FGA, aneuploidy and HRD or any of its components require the deployment of high throughput and more expensive genomic technologies [8,21]. Moreover, this study may potentially have identified an additional drug group, besides immune checkpoint inhibitors [22,23], for the treatment of the MSI subset of CRC.
The patterns of PARPi enrichment observed in this study are in tandem with the results of the Smeby et al. study in two ways. First, the enrichment of the PARPi response observed for the CRC wild-type TP53 status conforms with the Smeby et al. [8] findings. In that study, the authors demonstrated that PARP inhibition was associated with wild-type TP53 status, even in the microsatellite stable (MSS) molecular subset of CRC. Secondly, the study demonstrated that PARPi sensitivity in CRC was not predicted by HRD-related genomic and transcriptomic signatures [8]. This is in line with the present study which showed that PARPi response was enriched in the LST-low, rather than the LST-high, subset of CRC. However, this study observed a low performance of TP53 mutation status in predicting PARPi response enrichment, in spite of the central role TP53 mutations play in CRC pathogenesis. Based on the findings that different TP53 mutation types can confer differential tumor biology on cancers [24], I propose that the lumping together of all the TP53 mutations as one subset in this study may have precluded a determination of the accurate extent of the relationship between PARPi response and TP53 mutation status. Therefore, further research directed at the identification of PARPi response-specific TP53 mutations in the CRC cohorts may help clarify the roles of TP53 mutations in PARPi response and improve the performance of TP53 mutation status in predicting PARPi response in CRC.
Whilst the findings of an association of MSI with PARPi response are in tandem with the Smeby et al. study [8], they contradict the observations of Ganther-Williams et al. (n = 27) [10], who demonstrated no relationship between PARPi response and MSI status. It can be argued, however, that the aforementioned contradictory study was limited by sample size. In furtherance of this argument, the sensitivity of MSI CRC to PARPi may be attributable to the loss of MRE11 and RAD50 that was established in the MSI CRC subset [25,26]. MRE11 and RAD50, which are involved in dsDNA repair, are mutated by frameshift mechanisms in their microsatellite loci in MSI cancer subsets [26]. It is therefore conceivable that the mutation and loss of MRE11 and RAD50 formed a synthetic lethal mechanism with PARP inhibition in the MSI-positive CRC subset. The small sample size used in the Ganther-Williams et al. study may have precluded the power of that study to demonstrate the relationship between MSI and PARPi response. The present study utilized a sample size of over 800 samples to interrogate the relationships between the biomarkers and PARPi response in CRC.
The PARP1 and PARP2 biology observed for the CRC cases in this study differs significantly from their established status in breast, ovarian, prostate and pancreatic cancers. In the latter cancer types, high PARP1 and PARP2 expression are observed in the subsets of cancers with high chromosomal instability [27,28,29,30], hence their associations with CIN markers such as HRD, LST, TAI and LOH. These associations are related to the roles the base excision repair (BER) pathway plays in the rescue of HR-deficient cancer cells from apoptosis [31]. The BER pathway—whose members include the PARP genes—is upregulated in the breast, prostate, ovarian and prostate cancer subsets with HRD, as a secondary protective DNA repair mechanism against HRD [31]. Hence, targeting the BER pathway—specifically PARP1 and PARP2—forms the basis for the “synthetic lethality” mechanism that the PARP inhibition strategy utilizes for the treatment of those cancer subsets with HRD [31]. The present study observed an association between MSI and PARP gene expression, although no previous study has demonstrated the specific upregulation of PARP1 or PARP2 in that molecular subtype of CRC, to the best of my knowledge. The association of PARP1 and PARP2 expression with MSI in this study explains the association of PARPi response with low LST, rather than high LST, and this demonstrates why low LST, rather than high LST, would be the predictive biomarker of PARPi response in CRC. This is in contrast with the LST-PARPi response relationship applied clinically for HRD-PARPi synthetic lethality in prostate, ovarian, breast and pancreatic cancers [31]. Furthermore, this study demonstrated that none of the high subsets of the CRC CIN markers—FGA and aneuploidy scores—were associated with PARPi response enrichment, even with their demonstrated associations with the HRD surrogate, LST. This further confirmed that PARPi response in CRC may be associated with tumors with low CIN.
LST is a suitable surrogate for HRD, and has been utilized in multiple cancer studies as a genomic signature for HRD [32,33,34]. The use of GSEA and DOEA as surrogates for PARPi response is appropriate since the enrichments of the PARPi gene sets in phenotype subsets represent changes or perturbation inducible by the PARPis [35,36]. Drug treatment can trigger changes in the expression patterns of gene clusters, and these changes in pattern are related to the mode of action of the drug, as well as to how that drug affects vital cellular processes such as apoptosis, cell cycle and cell signaling [37]. As GSEA and DOEA can be used to analyze gene expression changes, they thus represent tools that can be used to predict drug responses [38,39]. The PARPi response gene sets applied in this study were generated by the treatment of colorectal, lung, prostate, and hepatocellular cancers and leukemia cell lines with veliparib, olaparib, rucaparib and talazoparib. The genes in the sets represent those which showed significant upregulation and downregulation following treatments with PARPis [35,36]. The GSEAs and differential ES analyses results were validated using DOEAs with differential drug ontology enrichment, which is a confirmatory technique for GSEAs [40,41]. Both GSEAs and DOEAs are standard techniques for studying biological phenomena in cancers.
This study suffers from certain limitations, including (i) the fact that the gene perturbation programs utilized for PARPi response were generated from cancer cell culture studies which may not absolutely replicate the pattern of changes that may occur in natural cancers from patients, and (ii) the absence of ASCAT data for the Sidra-LUMC cohort precluded the use of HRD for a comparison of the CRC cohorts. Hence, this study is essentially a hypothesis-generating one, and a clinical translation of the identified biomarkers would require comprehensive and rigorous clinical validation. A comprehensive validation of PARP1 and PARP2 expression, TP53 mutation status and MSI status as predictive biomarkers of PARPi response in CRC would require a formal, well-powered clinical trial in which PARP inhibitors are administered to CRC patients—or not—on the basis of the status of the above markers in patients’ tumor.

4. Materials and Methods

4.1. Study Approach

In this study, PARPi gene set enrichment was utilized as a surrogate for PARPi response, and enrichment scores (ESs) were used to define the relative magnitude of the relationships between biomarkers and PARPi responses. First, the relationship of PARP expression with clinicopathological, molecular and genomic indices was probed to establish a biological role for PARP1 and PARP2 in CRC, and interrogate the mechanisms of PARP1 and PARP2 deregulation in CRC. Gene set enrichment analyses (GSEAs) were performed with select gene sets for PARPi response using an HRD/HRD surrogate, FGA, aneuploidy scores, TP53 mutation status, MSI status as well as PARP1, PARP2 and ATM expression. Then, the predictive capacities of FGA, aneuploidy scores, TP53 mutation status, MSI status as well as PARP1, PARP2 and ATM expression relative to the HRD/HRD surrogate was determined using a differential ES analysis. The results of the GSEAs and differential ES analyses were confirmed with differential gene set enrichment fraction (GSEF) analysis using standard statistical tests.

4.2. Cancer Cohorts

This study retrospectively analyzed the clinicopathological, RNASeq and masked segment data of 537 and 348 CRC cases from the cancer genome atlas (TCGA) [42], and the Sidra-Leiden University Medical Center’s Atlas and Compass of Immune–Cancer–Microbiome (Sidra-LUMC) [43] cohorts, respectively. These data are all domiciled in the Genome Data Commons (GDC) and CBioPortal databases [44,45]. In addition, the TCGA breast cancer (BC) cohort was included in this study to validate the utility of PARPi GSEAs and DOEAs for PARPi response surrogacy, select the most sensitive PARPi response gene sets for application to the CRC cohorts, and confirm the HRD state (high versus low) with enrichment for PARPi response.

4.3. Data Retrieval and Processing

The clinical and genomic data of interest were extracted from the TCGA, and Sidra-LUMC data using Linux-based scripts and codes which were written in the Windows-based Ubuntu 20.04 environment. Data normalization per cohort was accomplished using fractional ranking and the method described by Templeton [46]. Following fractional ranking, the data from all three cohorts were combined and analyzed as one cohort for assessing the biological and molecular relevancies of PARP1 and PARP2 expression in CRC. However, for the purpose of assessing the predictive capacity of the potential PARPi response biomarkers with GSEA, the expression datasets of the three cancer cohorts were individually interrogated. This was due to the unequal records of genes in the individual datasets (TCGA = 60,483, and Sidra-LUMC = 18,355).

4.4. Genomic Indices

Large-scale state transitions (LST) scores, as previously defined [32], were generated from the copy number segment data (data_cng_hg19.seg), and used as a surrogate for HRD in the CRC cohorts. HRD scores, which are derived from the aggregation of large-scale state transitions (LSTs), telomeric allelic imbalance (TAI) and a loss of heterozygosity (LOH) [47], could not be generated for all three CRC cohorts because of the unavailability of ASCAT data for the Sidra-LUMC cohort. However, the HRD scores were derived for the TCGA CRC and BC cohorts from a combination of LST, LOH and TAI, and clinically relevant thresholds for the high and low scores were applied as previously described. Fraction of Genome Altered (FGA) scores were generated from the copy number segment data following the previous definitions [48]. The MSI statuses were obtained from the clinicopathological data in the TCGA and Sidra-LUMC cohorts, or derived from the other molecular subtyping schemes. The Consensus Molecular Subtype (CMS) of CRC from the Sidra-LUMC cohort was converted into two-tier (MSI versus MSS) and three-tier (Epithelial/CIN versus Hypermutated/MSI versus GS/EMT/Mesenchymal) subtyping schemes based on their described characteristics [49,50]. Tumor mutation burden (TMB) and Mutation Count were extracted from the somatic mutation data of the individual CRC cohorts.

4.5. Gene Set Enrichment Analysis

Gene set enrichment analysis (GSEA) was performed on the GSEA_4.3.3 software with gene sets from the Harmonizome database (https://maayanlab.cloud/Harmonizome/; accessed on 28 April 2025) [35,51]. The gene sets were derived from the cell culture studies which demonstrated the upregulation and downregulation of gene programs following treatment of the cancer cells with PARPis olaparib, rucaparib, veliparib and talazoparib [35,36]. Twenty-two gene sets from the Harmonizome database were compiled into a single gene set of 1242 genes. This compilation was prompted by the justification that all PARP inhibitors target PARP1 and PARP2, i.e., they all have the same targets; hence, they should show similar perturbation patterns. However, responses to the same PARP inhibitor may differ slightly from one cell type to another. In addition, the gene sets may have been generated under separate experimental conditions, and therefore, the perturbation patterns may show slight variations from one experiment to another. Furthermore, the 22 gene sets were generated from only a few cell lines. In recognition of these factors, the entirety of the 22 gene sets were combined into a single set to accommodate the variations that may have been induced by cellular, experimental and sample size limitations. A GSEA was first performed on the TCGA BC cohort using LOH, LST, TAI and BRCA1 and BRCA2 expression as the gold-standards for PARPi response biomarkers. These analyses were used to validate the PARPi gene set for PARPi response, as well as confirm the surrogacy of LST for HRD scores. Linux-based scripts were also used to prepare gct-formatted gene expression datasets as per GSEA requirements [52,53], while the phenotype and derivative gene set files were prepared in an Excel spreadsheet and converted to cls and gct files, respectively.

4.6. Differential Enrichment Score (ES) Analysis

To compare the strength of the association between the PARPi response biomarkers and the PARPi gene sets, a differential ES analysis was utilized to assess the preferential enrichment of the PARPi gene sets for the PARP1/2 and ATM expression, TP53 mutation and MSI statuses, or FGA in comparison to the LST-based enrichment scores. The ES values obtained for the GSEAs were input into online correlation difference calculators (http://vassarstats.net/rdiff.html; accessed on 2 May 2025; https://www.danielsoper.com/statcalc/calculator.aspx?id=104; accessed 2 May 2025) [54,55] to assess whether there were significant differences between the ES obtained for LST and those obtained for each of the other biomarkers. The basis for using a differential ES analysis is that ES is a measure of the strength of a correlation or association between a phenotype of interest and the molecular attributes or gene pathway denoted in the gene sets [52,53,56], similar to the Pearson correlation coefficient, R; hence, ES can be transformed to z-scores using Fisher z-transformation techniques [57,58].

4.7. Differential PARPi Response Ontology

To confirm the results of the GSEAs and differential ES analyses, drug set ontology enrichment was performed with the core-enriched genes of the olaparib, rucaparib, veliparib and talazoparib gene sets. Drug ontology enrichment was performed on the Enrichr platform using the LINCS L1000 Chem Pert Consensus Signatures. The fractions of the genes overlapping between the PARPi gene module and the biomarker-based enrichment list were compared between LST and the other individual PARPi response biomarkers using the Wilcoxon signed-rank test.

4.8. Statistical Analyses

The relationships among PARP1/2 expression, clinicopathological features, molecular features and genomic features were analyzed using SPSS version 29. Fractional ranking and the normalization of continuous data were also accomplished using SPSS. The Chi square (or Fisher) test was used to probe for significant associations between categorical variables, while bivariate correlative analysis was utilized to test the correlations between continuous variables. The one-way ANOVA test was used to measure the mean differences of continuous variables between discrete groups, while the multivariate analysis was investigated with regression analyses. A p value of <0.05 was taken as the threshold for significant association or correlation. The Benjamini–Hochberg correction was applied for multiple testing using a false discovery rate (FDR) of 0.05. GSEA was performed with a default threshold nominal rate of 0.05 and an FDR of 0.25. The permutation number was maintained as 1000, while permutation type was set as either “gene set” or “phenotype”, as appropriate. Figure 1 and Figure 4 were produced on the SR Plots website (https://www.bioinformatics.com.cn/; accessed on 2 May 2025) [59].

5. Conclusions

In conclusion, this study investigated potential PARPi response biomarkers in CRC. The highlights of the investigation include a demonstration of biological relevancies for PARP1 and PARP2 expression in CRC; the association of low LST status with PARPi response in CRC, in contrast to the established relationship between LST and PARPi response in prostate, pancreatic, ovarian and breast cancers; and the identification of potential, alternative PARPi response biomarkers with non-inferior performances relative to LST status.

Supplementary Materials

The following supporting information can be downloaded at https://www.mdpi.com/article/10.3390/ph18060905/s1.

Funding

This study is supported via funding from Prince Sattam bin Abdulaziz University project number (PSAU/2025/R/1446).

Institutional Review Board Statement

Not applicable.

Informed Consent Statement

Not applicable.

Data Availability Statement

All the genomic and clinicopathological data utilized for this study are freely available in the cBioPortal for the Cancer Genomics website (https://www.cbioportal.org/, accessed on 25 April 2025), and the Genome Data Commons repository (https://portal.gdc.cancer.gov/, accessed on 25 April 2025).

Acknowledgments

The author gratefully acknowledges the financial support provided by Prince Sattam Bin Abdulaziz University under project number (PSAU/2025/R/1446). The author also extends sincere thanks to The Cancer Genome Atlas (TCGA) and the cBioPortal for Cancer Genomics for providing access to the publicly available datasets used in this study.

Conflicts of Interest

The author declares no conflicts of interest.

Abbreviations

The following abbreviations are used in this manuscript:
TCGAThe cancer genome atlas
Sidra-LUMCSidra-Leiden University Medical Center’s Atlas and Compass of Immune–Cancer–Microbiome
GDCGenome Data Commons
GSEAGene set enrichment analysis
DOEADrug ontology enrichment analysis

References

  1. Bray, F.; Laversanne, M.; Sung, H.; Ferlay, J.; Siegel, R.L.; Soerjomataram, I.; Jemal, A. Global Cancer Statistics 2022: GLOBOCAN Estimates of Incidence and Mortality Worldwide for 36 Cancers in 185 Countries. CA Cancer J. Clin. 2024, 74, 229–263. [Google Scholar] [CrossRef] [PubMed]
  2. Pierantoni, C.; Cosentino, L.; Ricciardiello, L. Molecular Pathways of Colorectal Cancer Development: Mechanisms of Action and Evolution of Main Systemic Therapy Compounds. Dig. Dis. 2024, 42, 319–324. [Google Scholar] [CrossRef] [PubMed]
  3. Cotan, H.T.; Emilescu, R.A.; Iaciu, C.I.; Orlov-Slavu, C.M.; Olaru, M.C.; Popa, A.M.; Jinga, M.; Nitipir, C.; Schreiner, O.D.; Ciobanu, R.C. Prognostic and Predictive Determinants of Colorectal Cancer: A Comprehensive Review. Cancers 2024, 16, 3928. [Google Scholar] [CrossRef] [PubMed]
  4. Koncina, E.; Haan, S.; Rauh, S.; Letellier, E. Prognostic and Predictive Molecular Biomarkers for Colorectal Cancer: Updates and Challenges. Cancers 2020, 12, 319. [Google Scholar] [CrossRef]
  5. Zheng, F.; Zhang, Y.; Chen, S.; Weng, X.; Rao, Y.; Fang, H. Mechanism and Current Progress of Poly ADP-Ribose Polymerase (PARP) Inhibitors in the Treatment of Ovarian Cancer. Biomed. Pharmacother. 2019, 123, 109661. [Google Scholar] [CrossRef]
  6. Bondar, D.; Karpichev, Y. Poly(ADP-Ribose) Polymerase (PARP) Inhibitors for Cancer Therapy: Advances, Challenges, and Future Directions. Biomolecules 2024, 14, 1269. [Google Scholar] [CrossRef]
  7. Zhou, P.; Wang, J.; Mishail, D.; Wang, C.-Y. Recent Advancements in PARP Inhibitors-Based Targeted Cancer Therapy. Precis. Clin. Med. 2020, 3, 187–201. [Google Scholar] [CrossRef]
  8. Smeby, J.; Kryeziu, K.; Berg, K.C.G.; Eilertsen, I.A.; Eide, P.W.; Johannessen, B.; Guren, M.G.; Nesbakken, A.; Bruun, J.; Lothe, R.A.; et al. Molecular Correlates of Sensitivity to PARP Inhibition Beyond Homologous Recombination Deficiency in Pre-Clinical Models of Colorectal Cancer Point to Wild-Type TP53 Activity. EBioMedicine 2020, 59, 102923. [Google Scholar] [CrossRef]
  9. Jarrar, A.; Lotti, F.; DeVecchio, J.; Ferrandon, S.; Gantt, G.; Mace, A.; Karagkounis, G.; Orloff, M.; Venere, M.; Hitomi, M.; et al. Poly(ADP-Ribose) Polymerase Inhibition Sensitizes Colorectal Cancer-Initiating Cells to Chemotherapy. Stem Cells 2019, 37, 42–53. [Google Scholar] [CrossRef]
  10. Genther Williams, S.M.; Kuznicki, A.M.; Andrade, P.; Dolinski, B.M.; Elbi, C.; O’Hagan, R.C.; Toniatti, C. Treatment with the PARP Inhibitor, Niraparib, Sensitizes Colorectal Cancer Cell Lines to Irinotecan Regardless of MSI/MSS Status. Cancer Cell Int. 2015, 15, 14. [Google Scholar] [CrossRef]
  11. Incorvaia, L.; Perez, A.; Marchetti, C.; Brando, C.; Gristina, V.; Cancelliere, D.; Pivetti, A.; Contino, S.; Di Giovanni, E.; Barraco, N.; et al. Theranostic Biomarkers and PARP-Inhibitors Effectiveness in Patients with Non-BRCA Associated Homologous Recombination Deficient Tumors: Still Looking Through a Dirty Glass Window? Cancer Treat. Rev. 2023, 121, 102650. [Google Scholar] [CrossRef] [PubMed]
  12. Phan, Z.; Ford, C.E.; Caldon, C.E. DNA Repair Biomarkers to Guide Usage of Combined PARP Inhibitors and Chemotherapy: A Meta-Analysis and Systematic Review. Pharmacol. Res. 2023, 196, 106927. [Google Scholar] [CrossRef]
  13. Dibitetto, D.; Widmer, C.A.; Rottenberg, S. PARPi, BRCA, and Gaps: Controversies and Future Research. Trends Cancer 2024, 10, 857–869. [Google Scholar] [CrossRef]
  14. Kupfer, S.S.; Gupta, S.; Weitzel, J.N.; Samadder, J. AGA Clinical Practice Update on Colorectal and Pancreatic Cancer Risk and Screening in BRCA1 and BRCA2 Carriers: Commentary. Gastroenterology 2020, 159, 760–764. [Google Scholar] [CrossRef]
  15. Yaeger, R.; Chatila, W.K.; Lipsyc, M.D.; Hechtman, J.F.; Cercek, A.; Sanchez-Vega, F.; Jayakumaran, G.; Middha, S.; Zehir, A.; Donoghue, M.T.A.; et al. Clinical Sequencing Defines the Genomic Landscape of Metastatic Colorectal Cancer. Cancer Cell 2018, 33, 125–136.e3. [Google Scholar] [CrossRef]
  16. Yurgelun, M.B.; Kulke, M.H.; Fuchs, C.S.; Allen, B.A.; Uno, H.; Hornick, J.L.; Ukaegbu, C.I.; Brais, L.K.; McNamara, P.G.; Mayer, R.J.; et al. Cancer Susceptibility Gene Mutations in Individuals with Colorectal Cancer. J. Clin. Oncol. 2017, 35, 1086–1095. [Google Scholar] [CrossRef]
  17. Miller, R.E.; Leary, A.; Scott, C.L.; Serra, V.; Lord, C.J.; Bowtell, D.; Chang, D.K.; Garsed, D.W.; Jonkers, J.; Ledermann, J.A.; et al. ESMO Recommendations on Predictive Biomarker Testing for Homologous Recombination Deficiency and PARP Inhibitor Benefit in Ovarian Cancer. Ann. Oncol. 2020, 31, 1606–1622. [Google Scholar] [CrossRef] [PubMed]
  18. Wang, C.; Jette, N.; Moussienko, D.; Bebb, D.G.; Lees-Miller, S.P. ATM-Deficient Colorectal Cancer Cells Are Sensitive to the PARP Inhibitor Olaparib. Transl. Oncol. 2017, 10, 190–196. [Google Scholar] [CrossRef] [PubMed]
  19. Streel, S.; Salmon, A.; Dheur, A.; Bours, V.; Leroi, N.; Habran, L.; Delbecque, K.; Goffin, F.; Pleyers, C.; Kakkos, A.; et al. Diagnostic Performance of Immunohistochemistry Compared to Molecular Techniques for Microsatellite Instability and p53 Mutation Detection in Endometrial Cancer. Int. J. Mol. Sci. 2023, 24, 4866. [Google Scholar] [CrossRef]
  20. Binch, A.; Snuggs, J.; Le Maitre, C.L. Immunohistochemical Analysis of Protein Expression in Formalin Fixed Paraffin Embedded Human Intervertebral Disc Tissues. JOR Spine 2020, 3, e1098. [Google Scholar] [CrossRef]
  21. Gresham, D.; Dunham, M.J.; Botstein, D. Comparing Whole Genomes Using DNA Microarrays. Nat. Rev. Genet. 2008, 9, 291–302. [Google Scholar] [CrossRef] [PubMed]
  22. Schrock, A.B.; Ouyang, C.; Sandhu, J.; Sokol, E.; Jin, D.; Ross, J.S.; Miller, V.A.; Lim, D.; Amanam, I.; Chao, J.; et al. Tumor Mutational Burden Is Predictive of Response to Immune Checkpoint Inhibitors in MSI-High Metastatic Colorectal Cancer. Ann. Oncol. 2019, 30, 1096–1103. [Google Scholar] [CrossRef] [PubMed]
  23. Chang, L.; Chang, M.; Chang, H.M.; Chang, F. Microsatellite Instability: A Predictive Biomarker for Cancer Immunotherapy. Appl. Immunohistochem. Mol. Morphol. 2018, 26, e15–e21. [Google Scholar] [CrossRef]
  24. Kennedy, M.C.; Lowe, S.W. Mutant p53: It’s Not All One and the Same. Cell Death Differ. 2022, 29, 983–987. [Google Scholar] [CrossRef]
  25. Koppensteiner, R.; Samartzis, E.P.; Noske, A.; von Teichman, A.; Dedes, I.; Gwerder, M.; Imesch, P.; Ikenberg, K.; Moch, H.; Fink, D.; et al. Effect of MRE11 Loss on PARP-Inhibitor Sensitivity in Endometrial Cancer In Vitro. PLoS ONE 2014, 9, e100041. [Google Scholar] [CrossRef] [PubMed]
  26. Miquel, C.; Jacob, S.; Grandjouan, S.; Aimé, A.; Viguier, J.; Sabourin, J.C.; Sarasin, A.; Duval, A.; Praz, F. Frequent Alteration of DNA Damage Signalling and Repair Pathways in Human Colorectal Cancers with Microsatellite Instability. Oncogene 2007, 26, 5919–5926. [Google Scholar] [CrossRef]
  27. Jank, P.; Leichsenring, J.; Kolb, S.; Hoffmann, I.; Bischoff, P.; Kunze, C.A.; Dragomir, M.P.; Gleitsmann, M.; Jesinghaus, M.; Schmitt, W.D.; et al. High EVI1 and PARP1 Expression as Favourable Prognostic Markers in High-Grade Serous Ovarian Carcinoma. J. Ovarian Res. 2023, 16, 150. [Google Scholar] [CrossRef] [PubMed]
  28. Ossovskaya, V.; Koo, I.C.; Kaldjian, E.P.; Alvares, C.; Sherman, B.M. Upregulation of Poly (ADP-Ribose) Polymerase-1 (PARP1) in Triple-Negative Breast Cancer and Other Primary Human Tumor Types. Genes Cancer 2010, 1, 812–821. [Google Scholar] [CrossRef]
  29. Dehdashti, F.; Reimers, M.A.; Shoghi, K.I.; Chen, D.L.; Luo, J.; Rogers, B.; Pachynski, R.K.; Sreekumar, S.; Weimholt, C.; Zhou, D. Pilot Study: PARP1 Imaging in Advanced Prostate Cancer. Mol. Imaging Biol. 2022, 24, 853–861. [Google Scholar] [CrossRef]
  30. O’Connor, K.W.; Dejsuphong, D.; Park, E.; Nicolae, C.M.; Kimmelman, A.C.; D’Andrea, A.D.; Moldovan, G.L. PARI Overexpression Promotes Genomic Instability and Pancreatic Tumorigenesis. Cancer Res. 2013, 73, 2529–2539. [Google Scholar] [CrossRef]
  31. Li, L.Y.; Guan, Y.D.; Chen, X.S.; Yang, J.M.; Cheng, Y. DNA Repair Pathways in Cancer Therapy and Resistance. Front. Pharmacol. 2021, 11, 629266. [Google Scholar] [CrossRef] [PubMed]
  32. Schonhoft, J.D.; Zhao, J.L.; Jendrisak, A.; Carbone, E.A.; Barnett, E.S.; Hullings, M.A.; Gill, A.; Sutton, R.; Lee, J.; Dago, A.E.; et al. Morphology-Predicted Large-Scale Transition Number in Circulating Tumor Cells Identifies a Chromosomal Instability Biomarker Associated with Poor Outcome in Castration-Resistant Prostate Cancer. Cancer Res. 2020, 80, 4892–4903. [Google Scholar] [CrossRef] [PubMed]
  33. Manié, E.; Popova, T.; Battistella, A.; Tarabeux, J.; Caux-Moncoutier, V.; Golmard, L.; Smith, N.K.; Mueller, C.R.; Mariani, O.; Sigal-Zafrani, B.; et al. Genomic Hallmarks of Homologous Recombination Deficiency in Invasive Breast Carcinomas. Int. J. Cancer 2016, 138, 891–900. [Google Scholar] [CrossRef]
  34. Wagener-Ryczek, S.; Merkelbach-Bruse, S.; Siemanowski, J. Biomarkers for Homologous Recombination Deficiency in Cancer. J. Pers. Med. 2021, 11, 612. [Google Scholar] [CrossRef] [PubMed]
  35. Rouillard, A.D.; Gundersen, G.W.; Fernandez, N.F.; Wang, Z.; Monteiro, C.D.; McDermott, M.G.; Ma’ayan, A. The Harmonizome: A Collection of Processed Datasets Gathered to Serve and Mine Knowledge about Genes and Proteins. Database 2016, 2016, baw100. [Google Scholar] [CrossRef]
  36. Mitchell, D.C.; Kuljanin, M.; Li, J.; Van Vranken, J.G.; Bulloch, N.; Schweppe, D.K.; Huttlin, E.L.; Gygi, S.P. A Proteome-Wide Atlas of Drug Mechanism of Action. Nat. Biotechnol. 2023, 41, 845–857. [Google Scholar] [CrossRef]
  37. Qi, X.; Zhao, L.; Tian, C.; Li, Y.; Chen, Z.L.; Huo, P.; Chen, R.; Liu, X.; Wan, B.; Yang, S.; et al. Predicting Transcriptional Responses to Novel Chemical Perturbations Using Deep Generative Model for Drug Discovery. Nat. Commun. 2024, 15, 9256. [Google Scholar] [CrossRef]
  38. Subramanian, A.; Tamayo, P.; Mootha, V.K.; Mukherjee, S.; Ebert, B.L.; Gillette, M.A.; Paulovich, A.; Pomeroy, S.L.; Golub, T.R.; Lander, E.S.; et al. Gene Set Enrichment Analysis: A Knowledge-Based Approach for Interpreting Genome-Wide Expression Profiles. Proc. Natl. Acad. Sci. USA 2005, 102, 15545–15550. [Google Scholar] [CrossRef]
  39. Garana, B.B.; Joly, J.H.; Delfarah, A.; Hong, H.; Graham, N.A. Drug Mechanism Enrichment Analysis Improves Prioritization of Therapeutics for Repurposing. BMC Bioinf. 2023, 24, 215. [Google Scholar] [CrossRef]
  40. Thomas, P.D.; Hill, D.P.; Mi, H.; Osumi-Sutherland, D.; Van Auken, K.; Carbon, S.; Balhoff, J.P.; Albou, L.P.; Good, B.; Gaudet, P.; et al. Gene Ontology Causal Activity Modeling (GO-CAM) Moves Beyond GO Annotations to Structured Descriptions of Biological Functions and Systems. Nat. Genet. 2019, 51, 1429–1433. [Google Scholar] [CrossRef]
  41. Gene Ontology Consortium; Aleksander, S.A.; Balhoff, J.; Carbon, S.; Cherry, J.M.; Drabkin, H.J.; Ebert, D.; Feuermann, M.; Gaudet, P.; Harris, N.L.; et al. The Gene Ontology Knowledgebase in 2023. Genetics 2023, 224, iyad031. [Google Scholar] [CrossRef] [PubMed]
  42. Liu, J.; Lichtenberg, T.; Hoadley, K.A.; Poisson, L.M.; Lazar, A.J.; Cherniack, A.D.; Kovatich, A.J.; Benz, C.C.; Levine, D.A.; Lee, A.V.; et al. An Integrated TCGA Pan-Cancer Clinical Data Resource to Drive High-Quality Survival Outcome Analytics. Cell 2018, 173, 400–416. [Google Scholar] [CrossRef] [PubMed]
  43. Roelands, J.; Kuppen, P.J.K.; Ahmed, E.I.; Mall, R.; Masoodi, T.; Singh, P.; Monaco, G.; Raynaud, C.; de Miranda, N.F.C.C.; Ferraro, L.; et al. An Integrated Tumor, Immune and Microbiome Atlas of Colon Cancer. Nat. Med. 2023, 29, 1273–1286. [Google Scholar] [CrossRef] [PubMed]
  44. Gao, J.; Aksoy, B.A.; Dogrusoz, U.; Dresdner, G.; Gross, B.; Sumer, S.O.; Sun, Y.; Jacobsen, A.; Sinha, R.; Larsson, E.; et al. Integrative Analysis of Complex Cancer Genomics and Clinical Profiles Using the cBioPortal. Sci. Signal. 2013, 6, pl1. [Google Scholar] [CrossRef]
  45. Cerami, E.; Gao, J.; Dogrusoz, U.; Gross, B.E.; Sumer, S.O.; Aksoy, B.A.; Jacobsen, A.; Byrne, C.J.; Heuer, M.L.; Larsson, E.; et al. The cBio Cancer Genomics Portal: An Open Platform for Exploring Multidimensional Cancer Genomics Data. Cancer Discov. 2012, 2, 401–404. [Google Scholar] [CrossRef]
  46. Templeton, G.F. A Two-Step Approach for Transforming Continuous Variables to Normal: Implications and Recommendations for IS Research. Commun. Assoc. Inf. Syst. 2011, 28, 4. [Google Scholar] [CrossRef]
  47. Tsang, E.S.; Csizmok, V.; Williamson, L.M.; Pleasance, E.; Topham, J.T.; Karasinska, J.M.; Titmuss, E.; Schrader, I.; Yip, S.; Tessier-Cloutier, B.; et al. Homologous Recombination Deficiency Signatures in Gastrointestinal and Thoracic Cancers Correlate with Platinum Therapy Duration. npj Precis. Oncol. 2023, 7, 31. [Google Scholar] [CrossRef]
  48. Ebili, H.O.; Omenai, S.; Ezenkwa, U.S. Insights into the Molecular and Clinical Significances of NEIL2 Expression in Colorectal Cancer. NJGH 2025, accepted. [Google Scholar]
  49. Mouillet-Richard, S.; Cazelles, A.; Sroussi, M.; Gallois, C.; Taieb, J.; Laurent-Puig, P. Clinical Challenges of Consensus Molecular Subtype CMS4 Colon Cancer in the Era of Precision Medicine. Clin. Cancer Res. 2024, 30, 2351–2358. [Google Scholar] [CrossRef]
  50. Roepman, P.; Schlicker, A.; Tabernero, J.; Majewski, I.; Tian, S.; Moreno, V.; Snel, M.H.; Chresta, C.M.; Rosenberg, R.; Nitsche, U.; et al. Colorectal Cancer Intrinsic Subtypes Predict Chemotherapy Benefit, Deficient Mismatch Repair and Epithelial-to-Mesenchymal Transition. Int. J. Cancer 2014, 134, 552–562. [Google Scholar] [CrossRef]
  51. Diamant, I.; Clarke, D.J.B.; Evangelista, J.E.; Lingam, N.; Ma’ayan, A. Harmonizome 3.0: Integrated Knowledge about Genes and Proteins from Diverse Multi-Omics Resources. Nucleic Acids Res. 2025, 53, D1016–D1028. [Google Scholar] [CrossRef] [PubMed]
  52. Liberzon, A.; Birger, C.; Thorvaldsdóttir, H.; Ghandi, M.; Mesirov, J.P.; Tamayo, P. The Molecular Signatures Database (MSigDB) Hallmark Gene Set Collection. Cell Syst. 2015, 1, 417–425. [Google Scholar] [CrossRef]
  53. Maleki, F.; Ovens, K.; Hogan, D.J.; Kusalik, A.J. Gene Set Analysis: Challenges, Opportunities, and Future Research. Front. Genet. 2020, 11, 654. [Google Scholar] [CrossRef]
  54. VassarStats: Website for Statistical Computation. Available online: http://vassarstats.net/rdiff.html (accessed on 2 May 2025).
  55. Free Statistics Calculator Version 4.0. Available online: https://www.danielsoper.com/statcalc/calculator.aspx?id=104 (accessed on 2 May 2025).
  56. Roder, J.; Linstid, B.; Oliveira, C. Improving the Power of Gene Set Enrichment Analyses. BMC Bioinf. 2019, 20, 257. [Google Scholar] [CrossRef] [PubMed]
  57. Welz, T.; Doebler, P.; Pauly, M. Fisher Transformation Based Confidence Intervals of Correlations in Fixed- and Random-Effects Meta-Analysis. Br. J. Math. Stat. Psychol. 2022, 75, 1–22. [Google Scholar] [CrossRef]
  58. Bishara, A.J.; Hittner, J.B. Confidence Intervals for Correlations When Data Are Not Normal. Behav. Res. Methods 2017, 49, 294–309. [Google Scholar] [CrossRef] [PubMed]
  59. Tang, D.; Chen, M.; Huang, X.; Zhang, G.; Zeng, L.; Zhang, G.; Wu, S.; Wang, Y. SRplot: A free online platform for data visualization and graphing. PLoS ONE 2023, 18, e0294236. [Google Scholar] [CrossRef]
Figure 1. Violin plots showing the correlation of the molecular subtypes, mutation count, Aneuploidy and BRAF mutation status with PARP1 and PARP2 expression in CRC. Microsatellite instability-positive, low Aneuploidy score, high mutation count and mutant BRAF CRC cases have a significantly higher mean expression of PARP1 and PARP2. Sub-figures: upper panel = PARP1 expression; and lower panel = PARP2 expression.
Pharmaceuticals 18 00905 g001
Figure 2. Enrichment plots from the gene set enrichment analyses of the Harmonizome PARPi response gene set in the BC cohort, showing an enrichment of the PARPi response in the high LST, TAI and LOH subsets of BC at nominal p values and an FDR of <0.001. The LST-low, TAI-low and LOH-low subsets of BC did not show any enrichment. The results validate the gene set as a surrogate for PARPi response.
Pharmaceuticals 18 00905 g002
Figure 3. Error plots showing the inverse relationship between a PARPi response signature and the CIN indices, FGA and aneuploidy, in the TCGA (upper panel) and Sidra-LUMC (lower panel) CRC cohorts. The results confirmed the observed relationship between PARPi response and the HRD surrogate, LST. CIN = chromosomal instability; Aneu = aneuploidy; FGA = fraction genome altered; LST = large-scale state transition; HRD = homologous repair defect.
Pharmaceuticals 18 00905 g003
Figure 4. Box plots showing the GSEF analyses for the biomarkers PARP1 expression, PARP2 expression, MSI status and TP53 mutation status in comparison with LST in the enrichment of PARPi response ontology terms in the Sidra-LUMC (upper panel) and TCGA (lower panel) CRC cohorts. No significant enrichment was observed between LST and each of the other biomarkers. GSEF = gene set enrichment fraction; the displayed p values are FDR values.
Pharmaceuticals 18 00905 g004
Table 1. PARPi response enrichment analyses in TCGA CRC cohort.
BiomarkersGene Set SizeESNESNominal p ValueFDR q Value
LST8490.5912.908<0.001<0.001
MSI status8490.5502.582<0.001<0.001
TP53 mutation status8490.3441.781<0.001<0.001
PARP1 Expression8490.6652.438<0.001<0.001
PARP2 Expression8490.6532.334<0.001<0.001
TP53 Expression849−0.262−1.0120.4230.423
ATM Expression8490.1720.5120.9820.982
FGA8490.5452.683<0.001<0.001
Aneuploidy8490.5982.731<0.001<0.001
Table 2. PARPi response enrichment analyses in Sidra-LUMC CRC cohort.
BiomarkersGene Set SizeESNESNominal p ValueFDR q Value
LST6670.4191.595<0.001<0.001
MSI status6670.5361.975<0.001<0.001
TP53 mutation status6670.3901.851<0.001<0.001
PARP1 Expression6670.4072.182<0.001<0.001
PARP2 Expression6670.3551.758<0.001<0.001
TP53 Expression6670.3841.5410.0530.053
ATM Expression6670.2621.0520.4060.406
FGA6670.4901.812<0.001<0.001
Aneuploidy6670.4941.851<0.001<0.001
Table 3. Differential enrichment score analysis for the TCGA cohort.
Biomarker PairsN (LST vs. Other)LST ESOther ES∆ ES z-ScoreAdjusted p Value
LST vs. MSI527 vs. 3970.5910.5500.9050.439
LST vs. TP53 mutation status527 vs. 4910.5910.3435.1031.98 × 10−6
LST vs. PARP2 expression527 vs. 5370.5910.653−1.6460.199
LST vs. PARP1 expression527 vs. 5370.5910.665−1.9850.141
LST vs. FGA527 vs. 5220.5910.5451.0970.409
LST vs. Aneuploidy527 vs. 5240.5910.598−0.1610.872
Table 4. Differential enrichment score analysis for the Sidra-LUMC cohort.
Biomarker PairsN (LST vs. Other)LST ESOther ES∆ ES z-ScoreAdjusted p Value
LST vs. MSI281 vs. 3480.4190.536−1.8870.354
LST vs. TP53 mutation status 281 vs. 2810.4190.3900.2970.858
LST vs. PARP2 expression281 vs. 3480.4190.3550.9350.525
LST vs. PARP1 expression281 vs. 3480.4190.4070.1800.858
LST vs. FGA281 vs. 2800.4190.490−1.0550.525
LST vs. Aneuploidy281 vs. 2810.4190.494−1.1180.525
Disclaimer/Publisher’s Note: The statements, opinions and data contained in all publications are solely those of the individual author(s) and contributor(s) and not of MDPI and/or the editor(s). MDPI and/or the editor(s) disclaim responsibility for any injury to people or property resulting from any ideas, methods, instructions or products referred to in the content.

