Article

Investigation of the ABCB1 Gene Polymorphism and Food Effects on the Avatrombopag Pharmacokinetics in Chinese Individuals: A Population Pharmacokinetic/Pharmacodynamic Analysis

1
Department of Clinical Pharmacy and Pharmacy Administration, School of Pharmacy, Fudan University, Shanghai 200437, China
2
Changsha Phamark Data Co., Ltd., Changsha 410013, China
3
Hunan Key Laboratory for Bioanalysis of Complex Matrix Samples, Changsha Duxact Biotech Co., Ltd., Changsha 410013, China
4
Department of Pharmacy, The Affiliated Hospital, Xiangnan University, Chenzhou 423043, China
5
Department of Clinical Pharmacology, Xiangya Hospital, Central South University, Changsha 410017, China
6
Changsha Duxact Clinical Laboratory Co., Ltd., Changsha 410013, China
*
Authors to whom correspondence should be addressed.
These authors contributed equally to this work.
Pharmaceuticals 2025, 18(6), 903; https://doi.org/10.3390/ph18060903
Submission received: 28 April 2025 / Revised: 30 May 2025 / Accepted: 12 June 2025 / Published: 16 June 2025
(This article belongs to the Special Issue Mathematical Modeling in Drug Metabolism and Pharmacokinetics)

Abstract

:
Background/Objectives: Avatrombopag (AVA), a thrombopoietin receptor agonist used to treat thrombocytopenia in patients with chronic liver disease, exhibits significant pharmacokinetic (PK) variability, particularly under fasting conditions. This study investigates the combined influence of food intake and genetic polymorphisms in CYP2C9 and ABCB1 on the PK and pharmacodynamics (PD) of AVA, with the goal of informing individualized dosing strategies. Methods: A pharmacogenetic analysis was conducted in 92 healthy participants, who received 20 mg of AVA under both fasting and fed conditions. A population PK/PD model was developed to evaluate the covariates effects on the PK variability. Monte Carlo simulations were used to predict AVA exposure and platelet count profiles under diverse dosing scenarios. Results: Food intake significantly reduced PK variability, with approximately 50% reductions in clearance (CL/F) and volume of distribution (Vd/F) compared to fasting conditions. Under fed conditions, CYP2C9 intermediate metabolizers showed a 1.70-fold increase in exposure compared to normal metabolizers, but this difference was not observed under fasting conditions. ABCB1 polymorphisms showed minimal impact, with the exception of ABCB1 (C1236T) heterozygotes, which exhibited 1.37-fold increased exposure. Despite the observed PK variability, simulations demonstrated a consistent platelet count response across dosing regimens. Conclusions: While food intake and genetic polymorphisms in CYP2C9 and ABCB1 influenced AVA PK, these factors may not require dose adjustments, as platelet count responses remained consistent across genotypes and dosing conditions in the Chinese participants. These findings support simplified dosing strategies without the need for pharmacogenetic testing in Chinese individuals and may contribute to more individualized thrombocytopenia management.

Graphical Abstract

1. Introduction

Thrombocytopenia is a hematologic disorder characterized by abnormally low platelet counts, often associated with inherited factors or drug-induced immunologic destruction [1]. Globally, the estimated incidence of thrombocytopenia in adults ranges from 1.6 to 3.9 cases per 100,000 person-years [2,3,4,5]. Despite the relatively low incidence of fatal bleeding events, which is approximately 0.13 per person-year, managing and preventing bleeding remains a significant challenge. Pharmacologic therapy is the primary approach due to its safety and convenience compared with the platelet transfusion [2,3]. Thrombopoietin receptor agonists (TPO-RAs) are commonly used as second-line treatments for immune thrombocytopenia (ITP). These agents mimic endogenous thrombopoietin to stimulate megakaryocyte proliferation and differentiation in the bone marrow [4,5,6].
Avatrombopag (AVA), a second-generation TPO-RA, is approved for the treatment of thrombocytopenia, particularly in patients with chronic liver disease (CLD) [7]. It is increasingly used in ITP patients due to its superior efficacy and favorable benefit–risk profile compared to other TPO-RAs [8]. Although AVA was widely used in clinical practice, the variability of its PK has raised concerns among clinicians. Previous studies have shown that food intake significantly impacts both the inter- and intra-individual variability of AVA exposure. Notably, between-subject variability (BSV) is up to two-fold higher in the fasting state compared to the fed state [9,10,11,12]. Thus, oral administration with food is recommended in clinical practice to reduce the variability and ensure consistent therapeutic effects.
Cytochrome P450 (CYP) 2C9 genetic polymorphisms were identified as other key contributors to AVA variability, as it is the primary metabolized enzyme [1,13] of AVA. The genetic polymorphisms significantly influence AVA exposure [1,9,10], with CYP2C9 *2, *3 alleles associated with higher exposure compared to *1 carriers. However, despite the AVA exposure caused by CYP2C9 polymorphism, it had limited impact on the platelet count changes [1]. Beyond the metabolic factors, transporters also play a significant role in the AVA PK process. P-glycoprotein (P-gp) [7,14], encoded by the ABCB1 gene, is primarily responsible for AVA disposition. Over 8000 single nucleotide polymorphisms (SNPs) [15] in ABCB1 have been identified, influencing over 50% of the pharmacokinetic processes of various drugs [16]. Additionally, P-gp plays an important role in TPO-RAs transport, with polymorphisms impacting both drug exposure and efficacy [17,18]. However, the effect of P-gp polymorphisms on AVA remains underexplored. Therefore, this study focused on CYP2C9 and ABCB1 due to their primary roles in AVA metabolism and transport. Other genes, such as CYP3A4, were not included due to their limited contribution [9] and lack of consistent evidence in AVA disposition.
Therefore, this study aims to investigate the underlying causes of AVA PK variability, with a particular focus on the influence of CYP2C9 and ABCB1 gene polymorphisms. Given that the average lifespan of platelets in circulation is 7–10 days [19], a population pharmacokinetic-pharmacodynamic (PPK-PD) method was employed to evaluate whether differences in AVA exposure across subpopulations translate into meaningful changes in platelet count profiles under various dosing regimens.

2. Results

2.1. Demographic Characteristics

This analysis included 5923 AVA concentration data points from 92 healthy participants. Among these individuals, 83 were male and 9 were female. The median age was 28, with a range from 18 to 45. Four major gene polymorphisms were analyzed in this study; one in CYP2C9 and three in ABCB1. For CYP2C9 polymorphisms, 90% of participants were homozygous for the wild-type allele (*1/*1), while 10% were heterozygous (*1/*3). No individuals were identified as homozygous for the variant allele (*3/*3). The genotype frequencies for the three ABCB1 variants were as follows:
For ABCB1 (C1236T), 14% of participants were homozygous wild-type, 51% were heterozygous, and 35% were homozygous variant.
For ABCB1 (C3435T), 40% were homozygous wild-type, 47% were heterozygous, and 13% were homozygous variant.
For ABCB1 (G2677T/A), 20% were homozygous wild-type, 67% were heterozygous, and 13% were homozygous variant.
The details of the demographic information of the participants in this study are summarized in Table 1.

2.2. PK Assessment

2.2.1. Food and Sex Effects on PK

The primary PK parameters of AVA under different food intake conditions and across sexes are summarized in Table 2. The Cmax was significantly higher in the fed state compared to the fasting state, with a geometric least-squares mean ratio of 121.87% (95% CI: 105.45–140.85, p = 0.008), while AUC was minimally affected (Table S1). This suggests that food intake influences the PK profile of AVA in the Chinese population. Regarding sex differences, no statistically significant variation in AVA exposure was observed between males and females (Table S2).

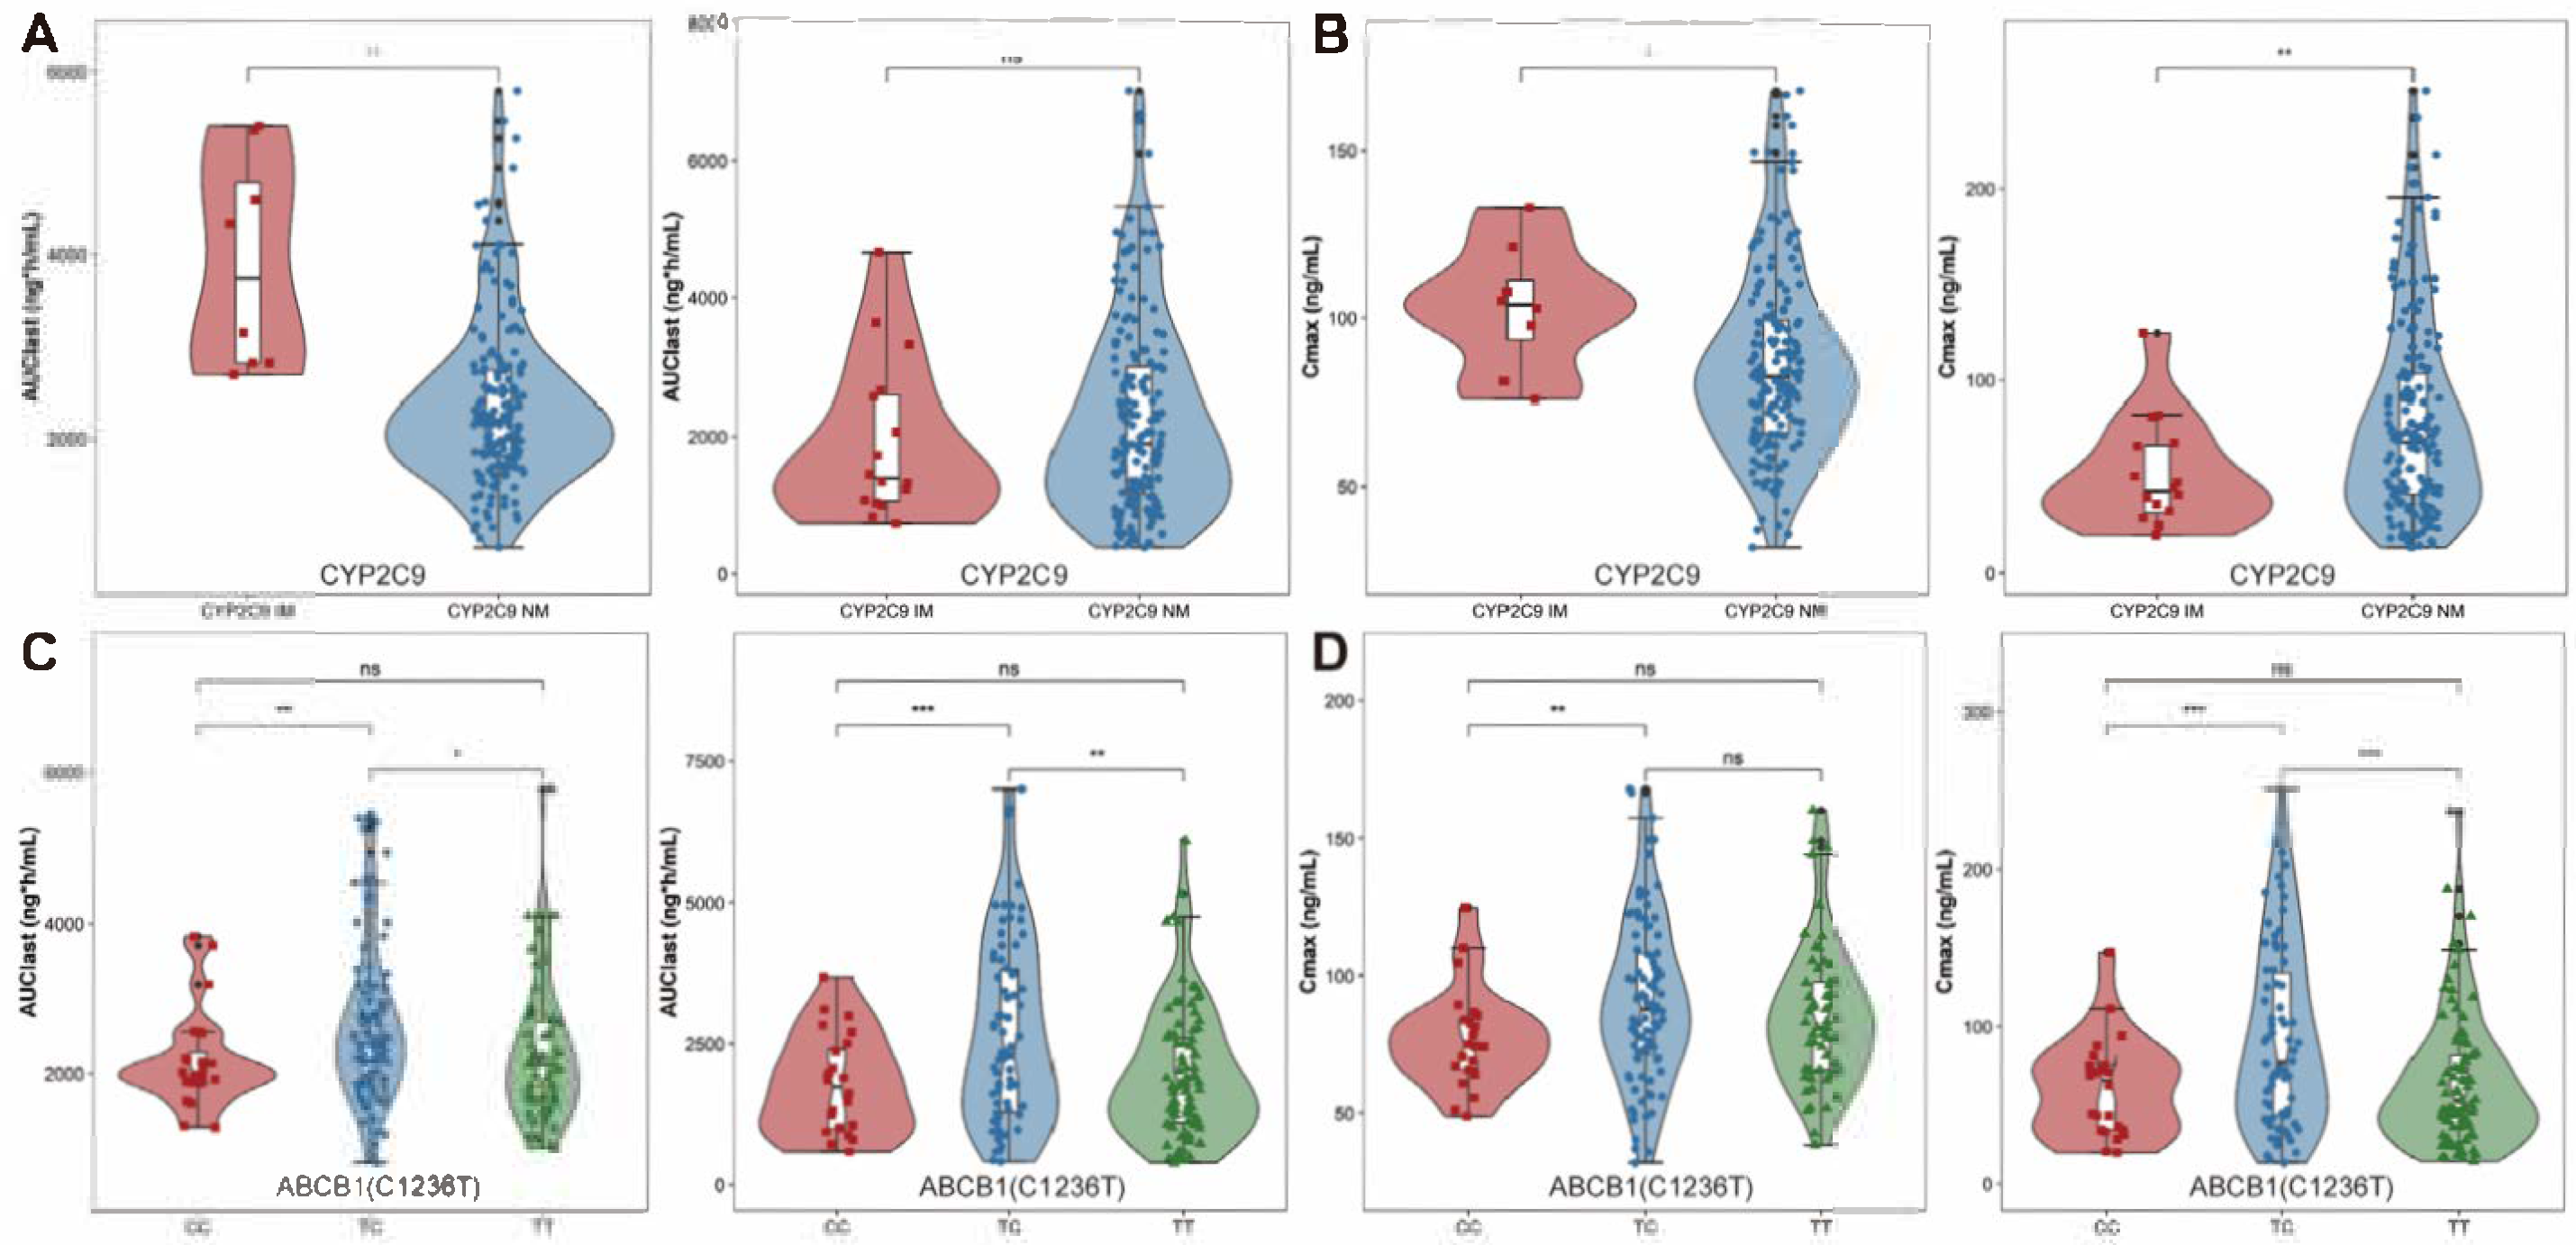
2.2.2. Genotypes Effects on PK

All genetic variants were in Hardy–Weinberg equilibrium. The PK parameters across different CYP2C9 phenotypes and ABCB1 genotypes are summarized in Table S3. For CYP2C9 phenotypes, IMs exhibited significantly higher values for both t1/2 (25.68 vs. 17.72 h) and AUC0-t (3704.04 vs. 2180.36 ng×h/mL) compared to NMs in the fed state, while Cmax was not significantly affected by CYP2C9 status (Table S4). In the fasting state, similar results were observed, with t1/2 substantially increased in the IM group relative to the NM group (p < 0.001). However, exposure parameters such as Cmax and AUC0-t displayed an unexpected trend, with the NM group showing slightly higher values than the IM group, though these differences were not statistically significant (Table S4; Figure 1A,B and Figure S1).
Regarding the effects of ABCB1 genotypes on AVA pharmacokinetics, no significant differences were observed in Cmax and AUC values across the ABCB1 (C3435T) genotypes (Table S5, Figure S2A,B). Similarly, no significant associations were found between the ABCB1 (G2677T/A) polymorphism and Cmax or AUC parameters (Figure S2C,D). However, for ABCB1 (C1236T), a significant difference in AVA exposure was detected between heterozygous and homozygous genotypes for both AUC and Cmax (Figure 1C,D). In both fasting and fed states, individuals with homozygous wild-type and homozygous mutant genotypes displayed similar exposure levels, with Cmax ratios of 102.43% in the fasting state and 113.67% in the fed state, and AUC0-t ratios of 108.67% (fasting) and 108.38% (fed). In contrast, the exposure differences between heterozygous and homozygous genotypes were notable (Table S7, Figure 1). The Cmax ratio of TT/TC was approximately 70.96% in the fasting state and 93.27% in the fed state. For TC/CC, the Cmax and AUC0-t ratios in the fasting state were 144.35% and 144.04%, respectively; similar trends were observed in the fed state, with Cmax and AUC values of 121.87% and 120.93%, respectively. These findings suggest that the ABCB1 (C1236T) polymorphism significantly influences AVA exposure. It warrants further investigation to explain its impact on drug response.

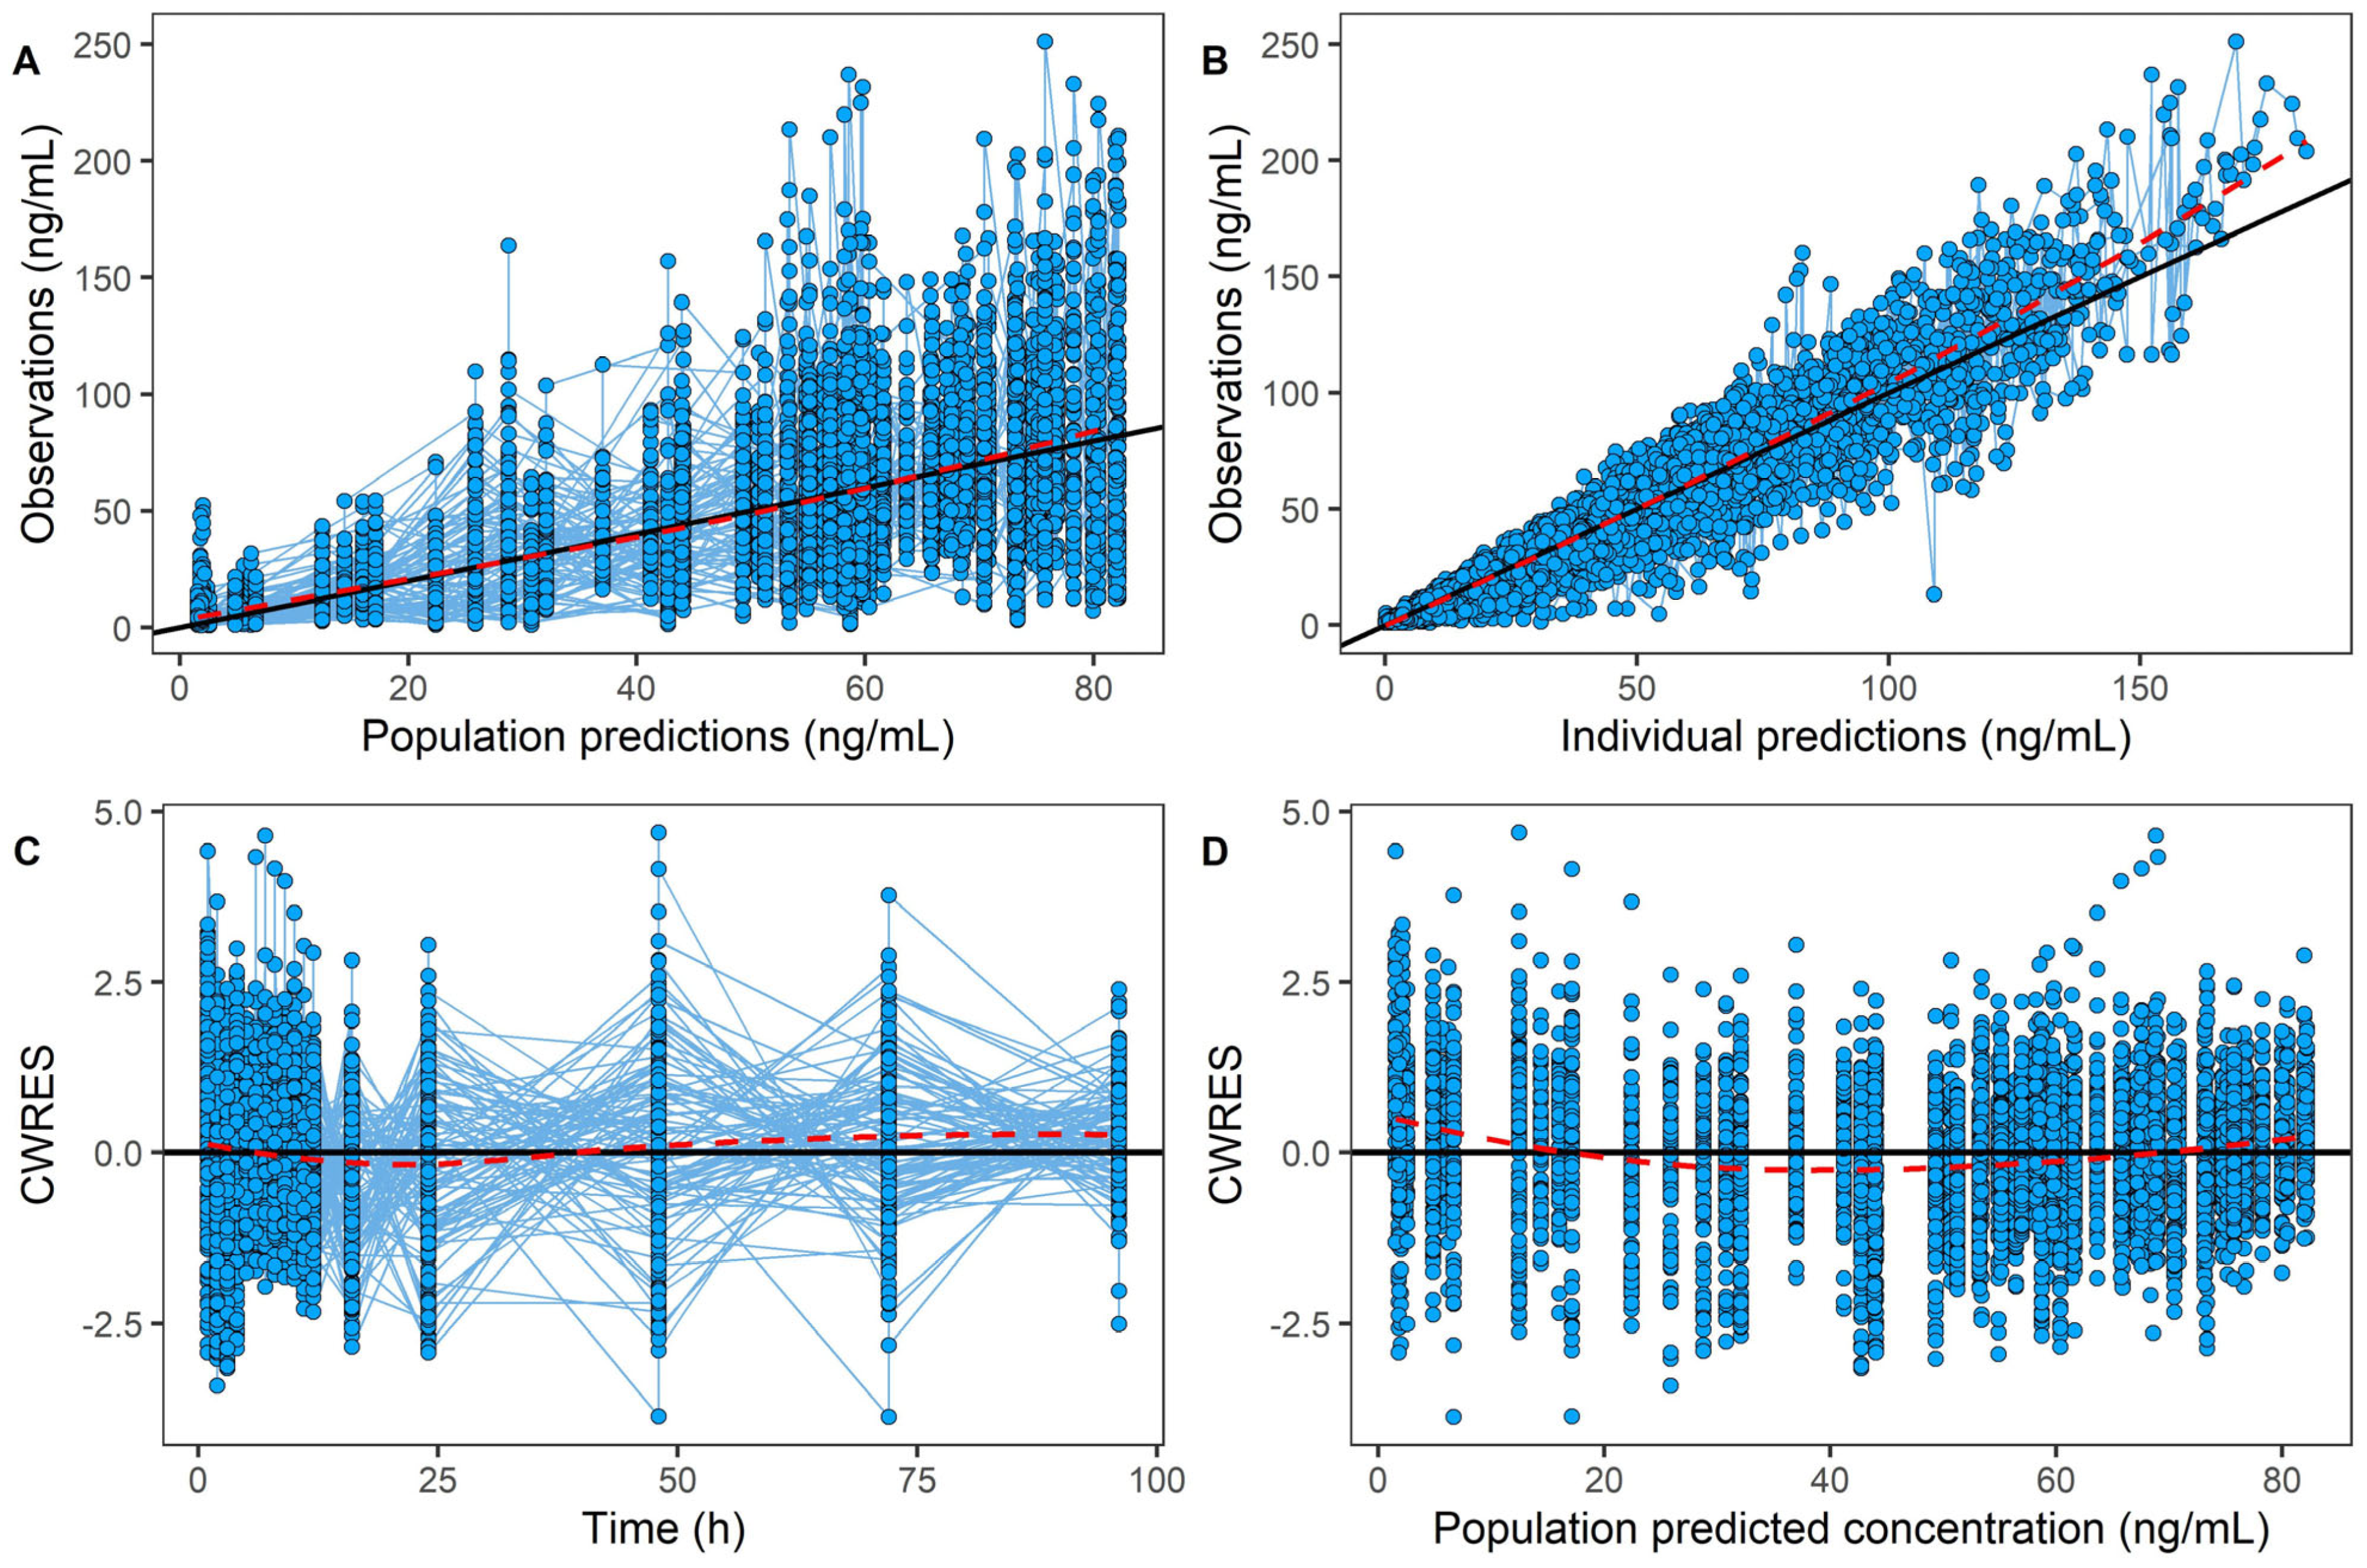
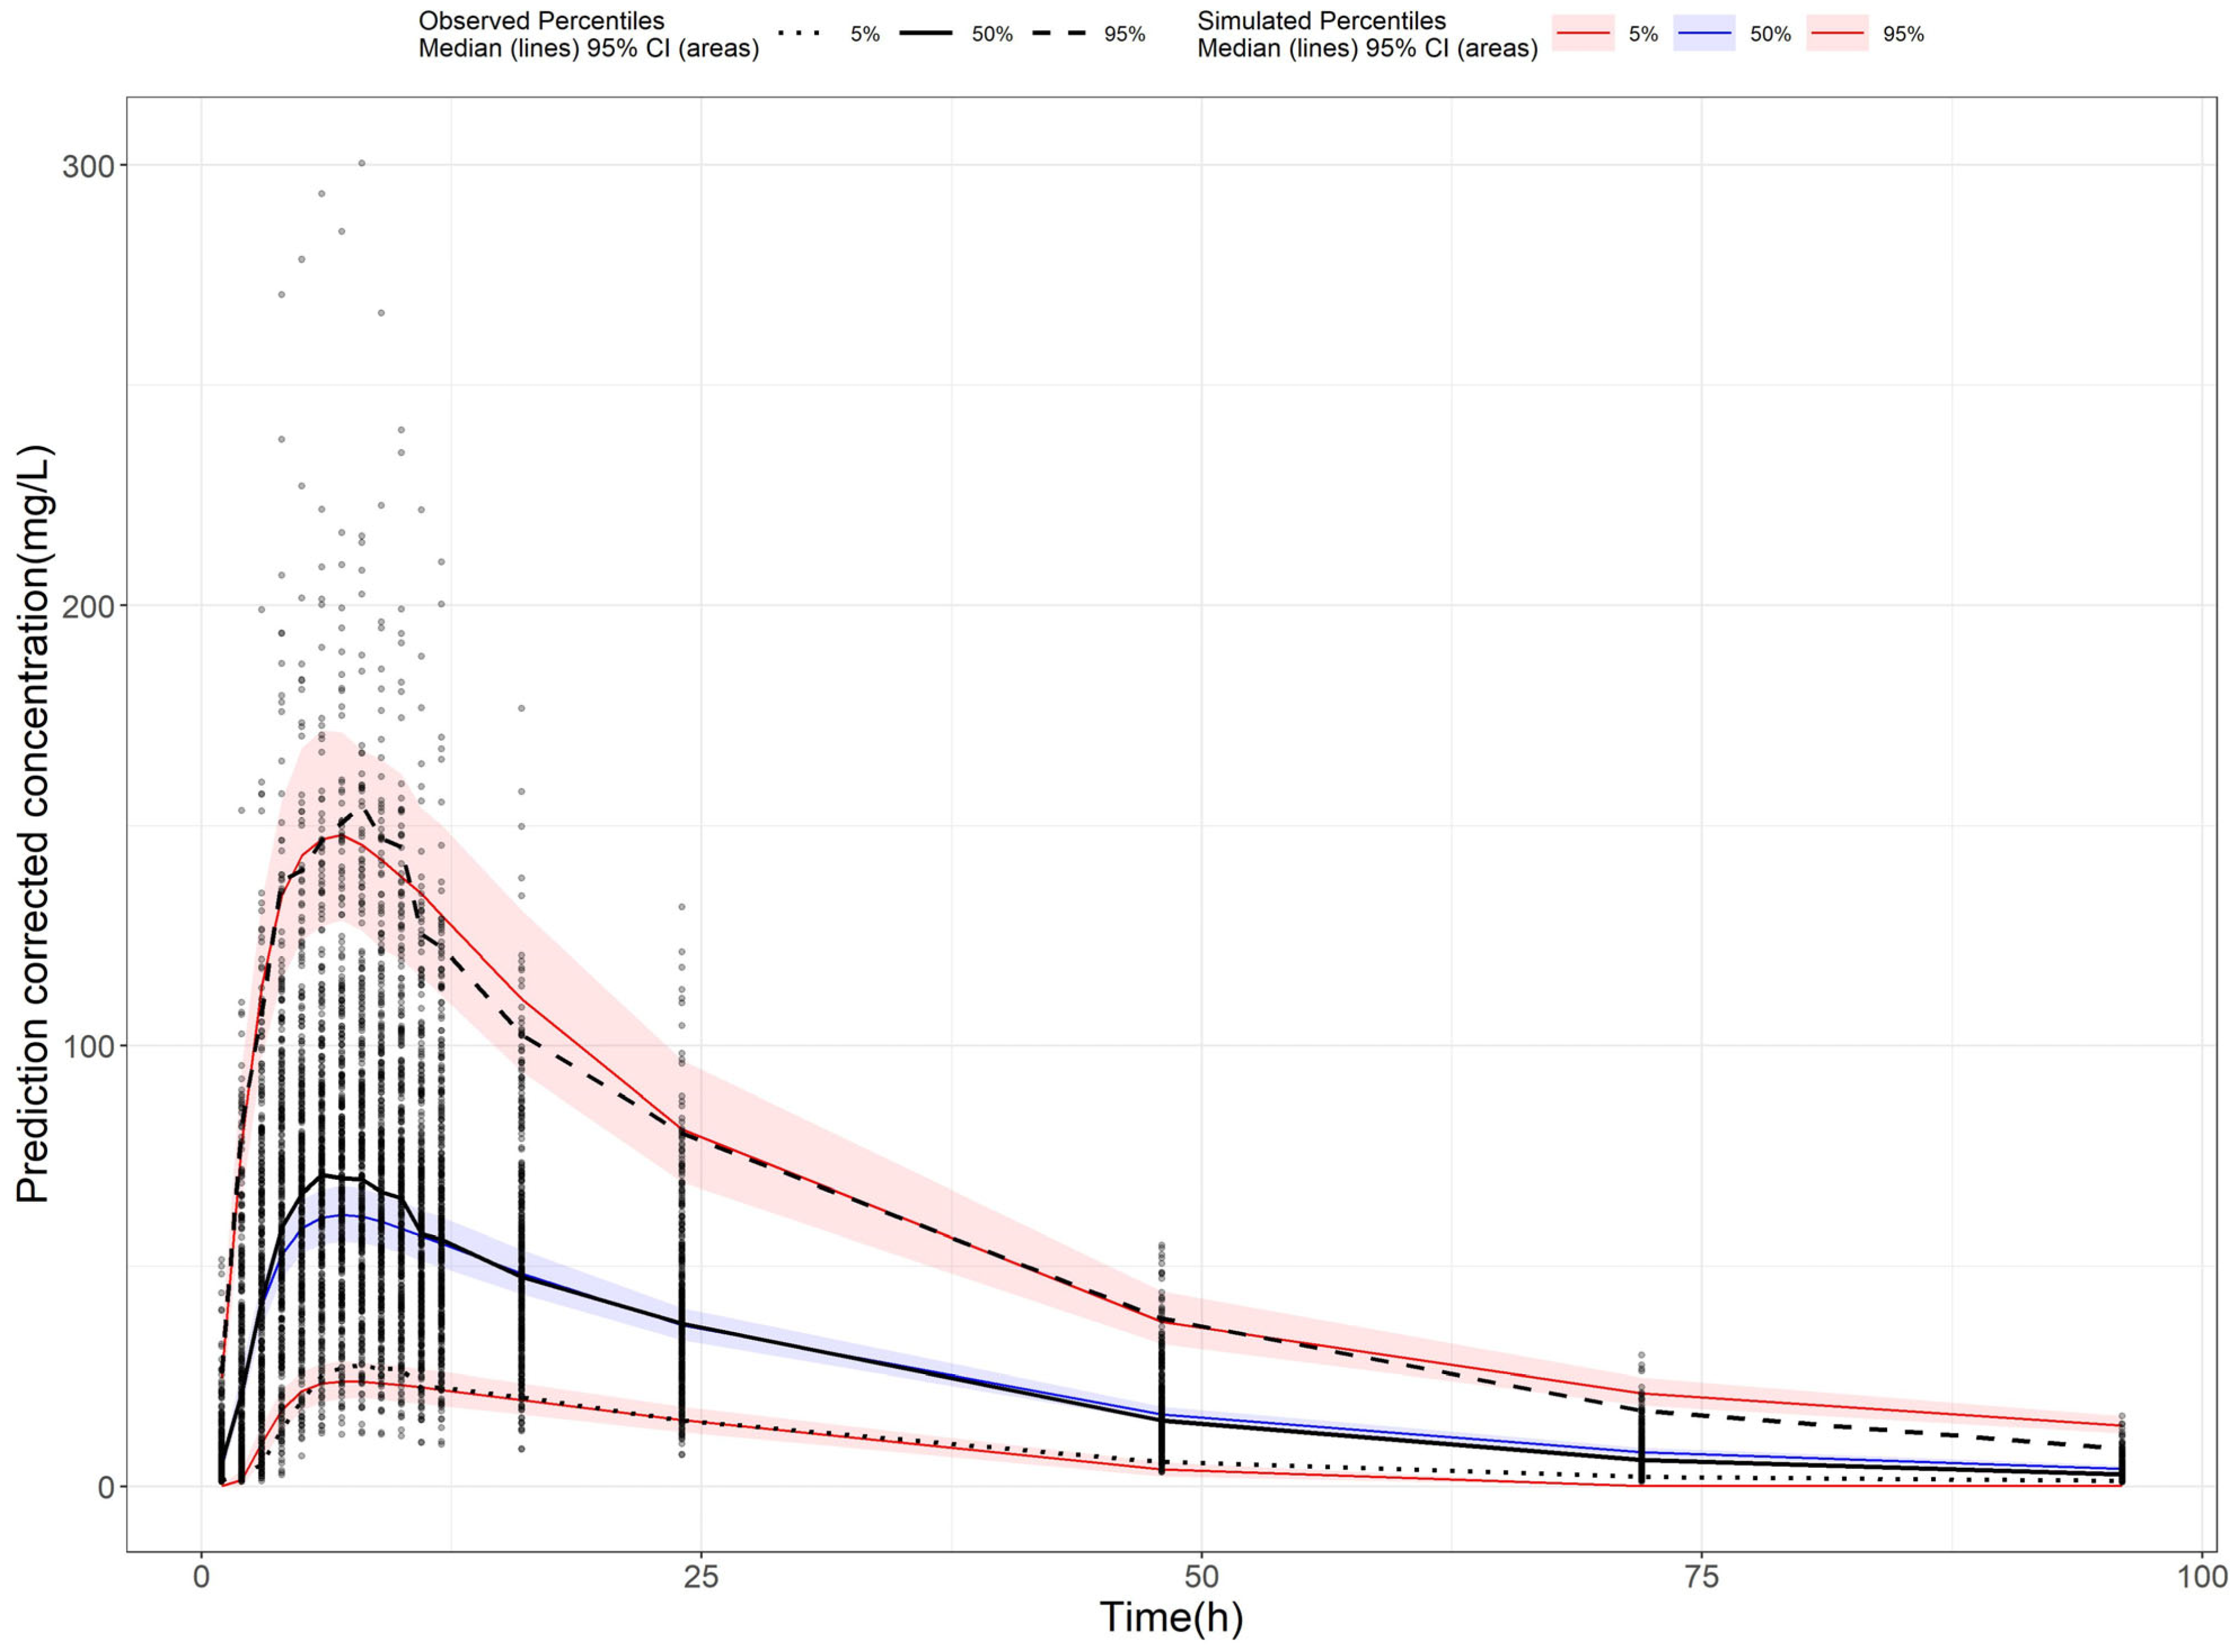
2.3. Population Pharmacokinetic Model of AVA

To further investigate the effects of food intake and genetic polymorphisms on AVA exposure, a PPK model was developed. A one-compartment model with nine transit compartments, along with first-order absorption and elimination, was selected as the final model. The final model provided precise parameter estimates, with an apparent clearance (CL/F) of 7.85 L/h, an apparent volume of distribution (Vd/F) of 199 L, and an absorption constant (Ka) of 0.582/h. Most relative standard errors were below 30% (Table 3), demonstrating the model’s reliability. Incorporating the food–genotype co-effect on the absorption fraction (Fa) reduced the OFV by 15.96, indicating that both food and genotype co-effects significantly impact AVA absorption extent. The bootstrap analysis showed the parameter estimates from the final model closely matching the median values and falling within the 95% confidence interval (Table 3). This alignment confirms the stability and reproducibility of the model. Goodness-of-fit (GOF) diagnostic plots (Figure 2) showed unbiased model predictions and successful convergence. Additionally, the visual predictive check (VPC, Figure 3) demonstrated that most observed values were within the 95% prediction interval, confirming that the final model had strong predictive performance.

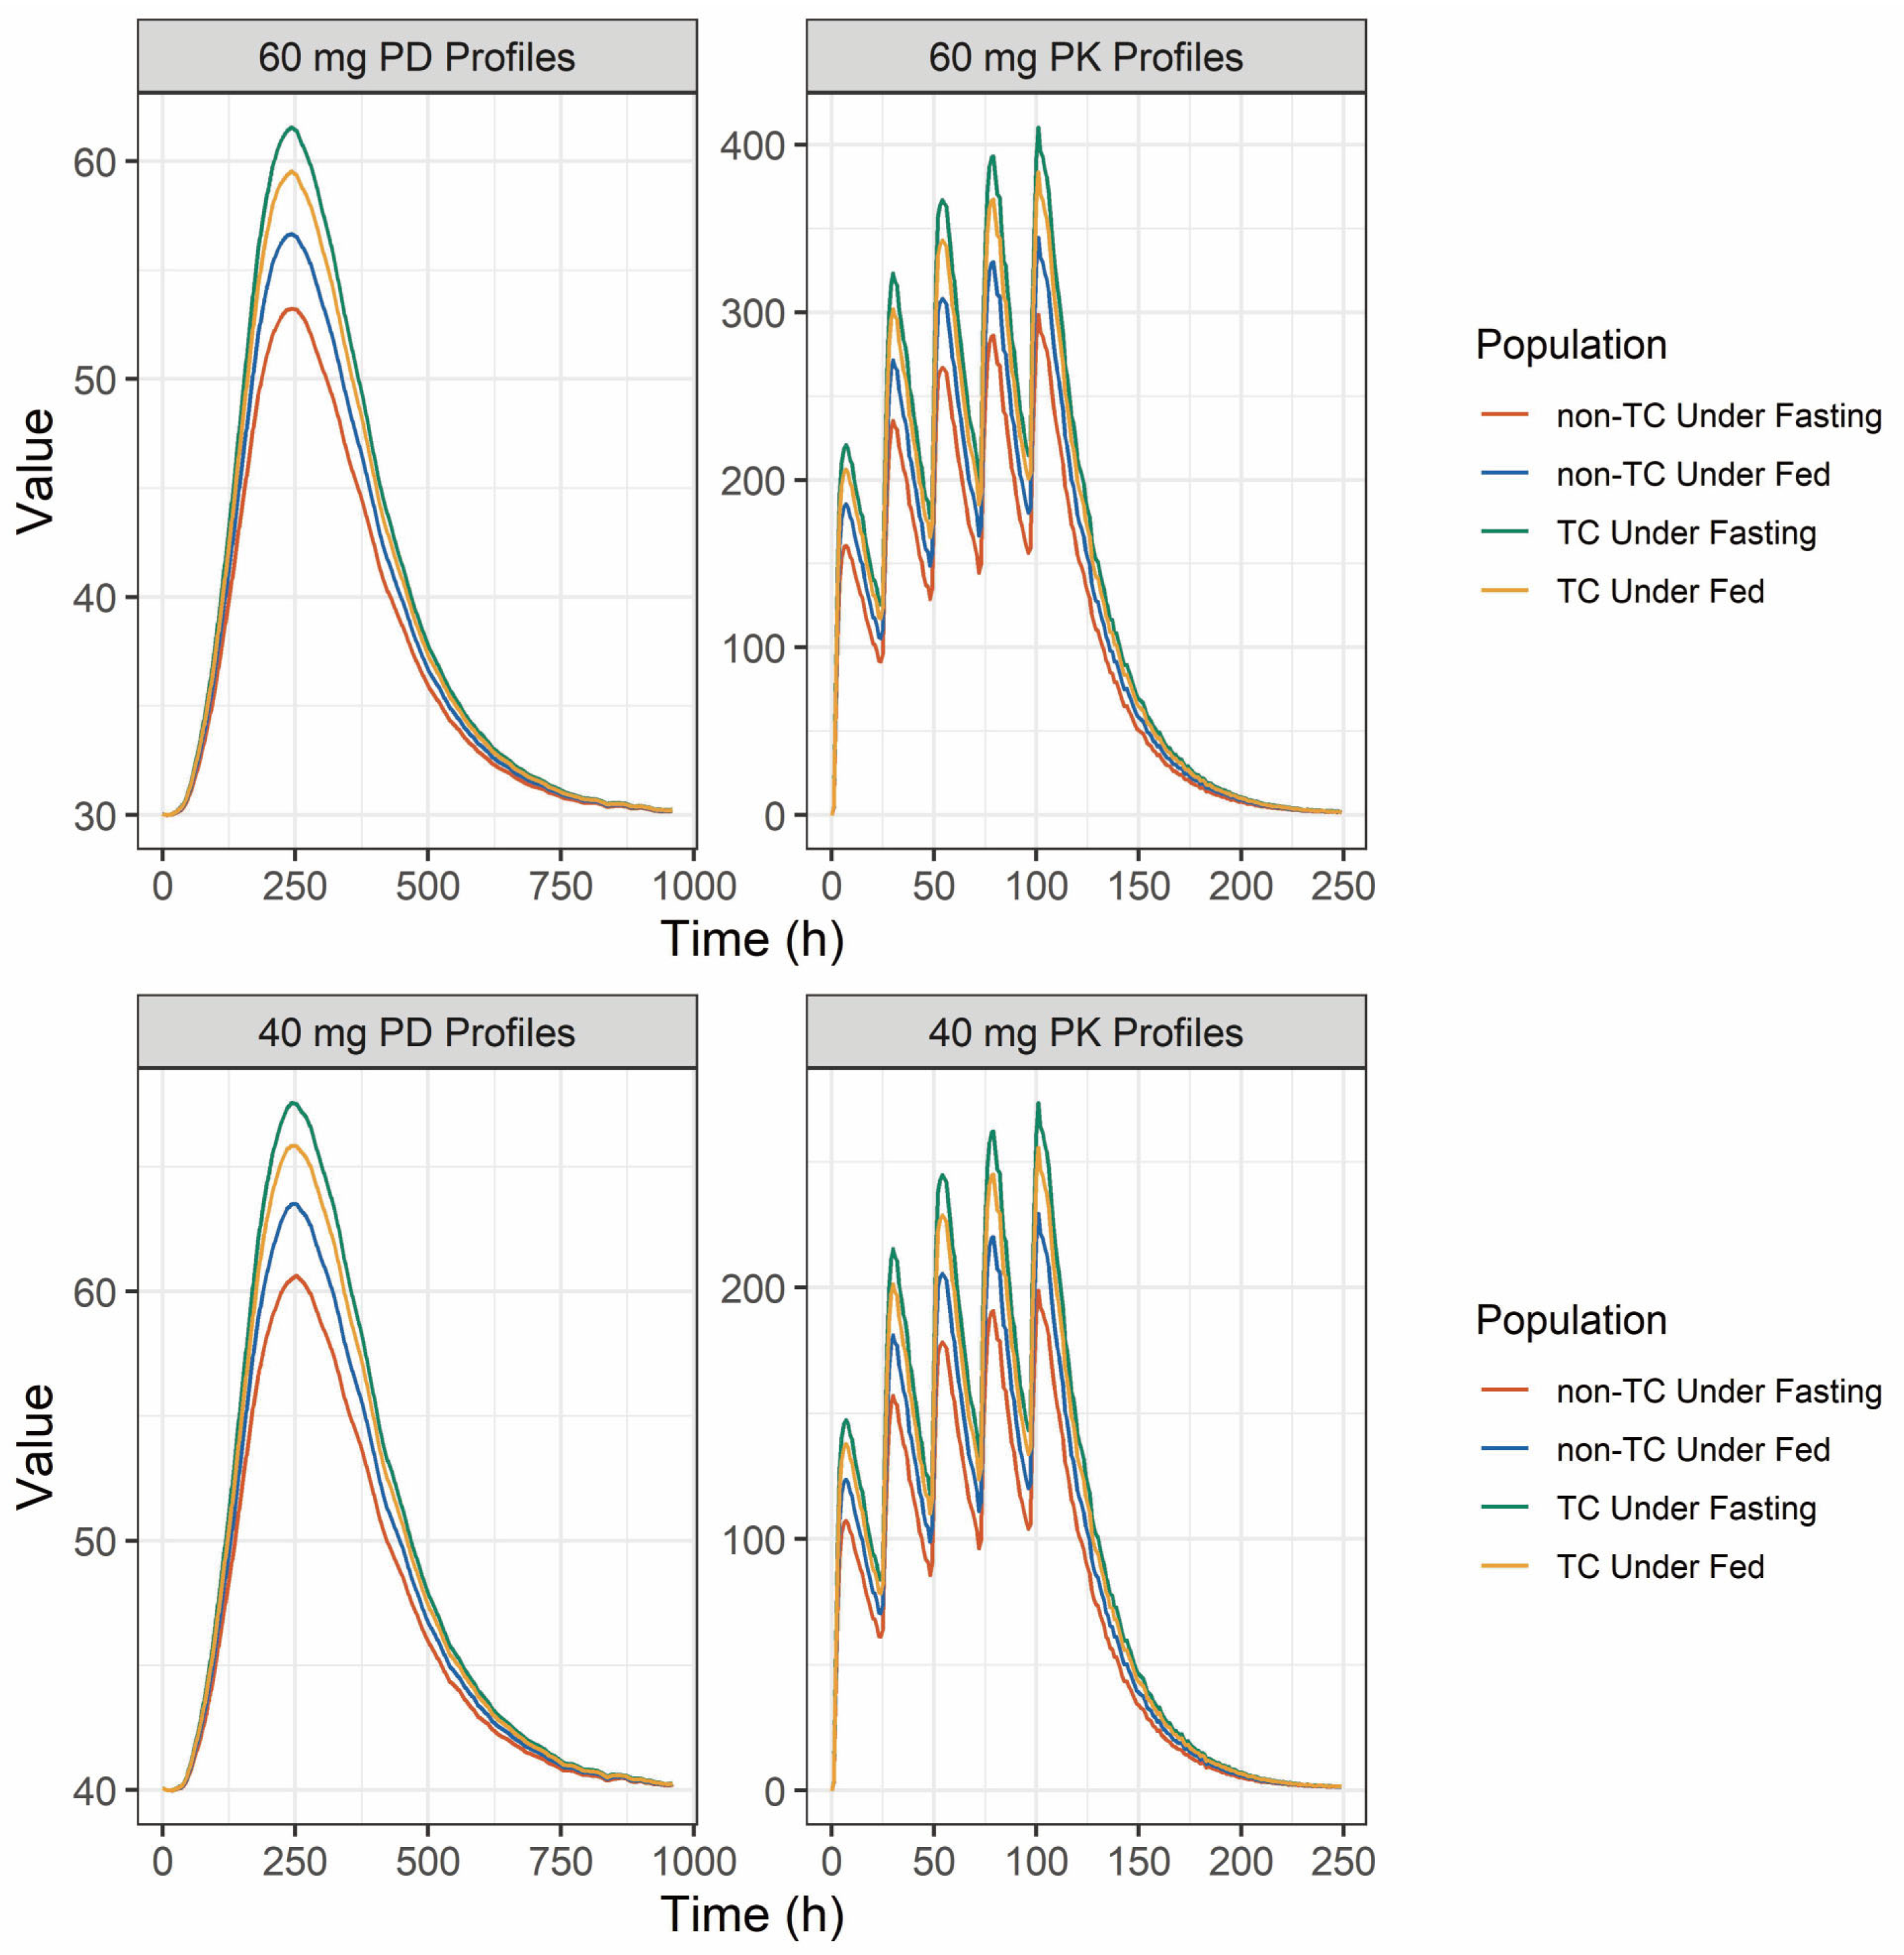
2.4. Population Pharmacokinetic and Pharmacodynamic Simulation

Given that platelets have a short lifespan of 7–10 days in the circulation [19], it is important to investigate how different AVA exposure levels affect platelet counts in various groups with distinct exposure patterns. Simulation results for different AVA dosing regimens are summarized in Table 4 and illustrated in Figure 4. When dosed at 60 mg for five consecutive days, the maximum exposure difference between subpopulations was a 1.37-fold increase in Cmax and AUCτ (the comparison between the TC and non-TC under fasting state). Despite this, platelet counts showed no significant variation (61.56 × 10⁹ vs. 53.23 × 10⁹ for Cmax, 38,331.20 × 109 vs. 35,907.80 × 109 for AUC), indicating that dose adjustments based on ABCB1 (C1236T) genotype or fasting state are unnecessary. Similar results were observed with a 40 mg dose for five consecutive days, where the PK exposure difference remained 1.37-fold, and platelet counts were nearly identical in these two subpopulations. Taken together, these results indicate that, although AVA exposure differed significantly by genotype and food condition, the resulting platelet count responses were only minimally affected.

3. Discussion

AVA, a thrombopoietin receptor agonist, is widely prescribed as a second-line treatment for thrombocytopenia in patients with CLD [20,21]. In this study, a single dose of 20mg AVA was administrated to healthy Chinese participants; a large variability was found in the fasting state. The pharmacogenetic analysis found a difference in Cmax and AUC across ABCB1 (C1236T) and CYP2C9 genotypes in both the fasting and fed state. To further quantify the effects of the food and genotype, a PPK-PD model was developed. The results showed that, although a 1.37-fold exposure difference was observed between ABCB1 (C1236T) homozygote and heterozygote in the fasting state, the resulting difference in platelet counts was minimal.
Food intake was found to significantly affect the variability of AVA’s PK parameters, especially Cmax, without altering the extent of absorption (Table S1). This aligns with findings from Nomoto et al. [1,9,10], who reported similar effects in a White population. The food intake influenced Cmax but not mean PK values. The BSV for CL/F and Vd/F was notably higher in the fasting conditions compared to the fed states (62.4% vs. 36.6% for CL/F and 64.5% vs. 31.1% for Vd/F, respectively). Similar findings were also reported in the label of AVA, which directly supports the recommendation of taking medicine with meals. Since AVA is a Biopharmaceutical Classification System (BCS) Class II compound with low solubility [9], food may reduce PK variability by slowing gastrointestinal transit, thereby enhancing uniformity in AVA absorption and solubility. This mechanism explains the lower variability in the fed state [1].
AVA undergoes extensive metabolism primarily via CYP2C9, which accounts for approximately 44% of the administered dose [13]. Although in vitro studies suggest both CYP2C9 and CYP3A4 enzymes contribute equally, in vivo data indicate that CYP2C9 plays a more dominant role [9]. Previous pharmacogenetic studies showed that CYP3A polymorphisms had no significant impact on AVA PK, while CYP2C9 variants correlated with higher exposure in IMs than in NMs [1]. The allele frequency for CYP2C9*3 was 3.26%, while CYP2C9*1 accounted for 96.74% in this study, consistent with a previous report among Asian participants [22], which reported CYP2C9*3 had almost a 3% frequency in Asian population. CYP2C9 IMs demonstrated higher exposure than NMs under fed conditions (Figure 2). However, in the fasting state, IMs exhibited lower exposure than NMs, likely due to high variability and the small sample size of IMs. Therefore, large numbers of clinical studies are needed to confirm these findings (Figure 1 and Table S4).
In addition to investigating CYP2C9 polymorphism effects on the AVA exposure, this was the first study to evaluate the effects of ABCB1 polymorphisms on AVA’s PK and PD characteristics. The ABCB1 polymorphism is known to influence the bioavailability of oral drugs [23,24], potentially affecting clinical outcomes [25,26]. For ABCB1 polymorphisms, three common variants were examined: C1236T, G2677T/A, and C3435T. The frequencies observed for each were similar to those reported in other Asian populations [27,28,29]. Specifically, for ABCB1 (C1236T), 46.74% were heterozygous (TC), 40.22% were homozygous variant (TT), and 13.04% were homozygous wild-type (CC). When comparing single-dose PK parameters across ABCB1 genotypes, the largest exposure difference was observed between the TC and CC genotypes in ABCB1 (C1236T), with a 1.44-fold difference (Table S7). While there was no significant difference in exposure parameters detected between the different genotypes of G2677T/A, and C3435T.
Although our findings suggest a potential impact of the C1236T variant on AVA exposure, the underlying mechanisms remain unclear. This effect may be attributable to educed P-gp activity in TC carriers, resulting in decreased efflux and increased systemic concentrations. However, existing evidence on the functional impact of ABCB1 polymorphisms is conflicting [26,30]. Studies have reported both increased [31,32,33] and decreased [34,35] ABCB1 mRNA or protein expression in relation to 3435T or 2677T alleles, depending on the population and tissue examined. The functional consequences of C1236T are even less consistent, with limited data suggesting possible effects on drug clearance for certain substrates [36]. Overall, the genotype–function relationship for ABCB1 remains poorly defined [16], and our findings warrant cautious interpretation and further mechanistic validation.
Given that AVA-induced platelet increases are evident 3–5 days after administration [1], with peak changes at 6–10 days, it is essential to assess how PK change translates into PD effects, especially in steady-state conditions. A PPK-PD model was developed to characterize the differences in PK and PD across genotypes. However, food intake had a substantial impact on the PK variability, and the effects of genetic polymorphisms differed between fasting and fed state. This indicated that food may play a more important role in AVA’s exposure and between-subjects variability. Thus, to better characterize the gene-food co-effects on AVA’s exposure, a more mechanistic model was developed. Although the PK data were obtained from healthy volunteers, the PD model was based on CLD patients, providing a clinically relevant PK-PD framework. We acknowledge that disease-related physiological changes may alter PK profiles; however, the primary objective of our analysis was not to predict absolute platelet counts in patients but to explore the relative influence of PK variability (e.g., due to genotype or food intake) on PD outcomes. This approach provides mechanistic insight into the robustness of platelet count outcomes despite inter-individual PK differences. The model not only considered the genotypes and food effects but also took the interaction between food and genotype into consideration. The results showed that, despite the significant exposure differences between ABCB1 (C1236T) heterozygotes and homozygotes, platelet counts did not differ significantly between these groups, suggesting that dosage adjustments are not necessary based on ABCB1 genotype alone.
This study has several limitations. First, the analysis population was derived from a bioequivalence study involving relatively homogeneous participants, which may limit the ability to identify certain covariates, such as body weight, that were identified in another study [10]. Second, the sample size for CYP2C9*3 carriers was quite low (n = 6), which may have affected the reliability of the results regarding CYP2C9 IMs in the fasting state. While our study provides novel insights into the interplay between genotype, food intake, and AVA pharmacokinetics, the clinical implications of these findings require further validation. Future work should incorporate larger, more genetically diverse patient cohorts to assess whether PK variability may translate into PD alterations in real-world settings.

4. Materials and Methods

4.1. Study Population

This study included healthy volunteers enrolled from a single-center, two-sequence, four-period bioequivalence trial conducted at the Clinical Trials Unit of Hunan Province People’s Hospital (Changsha, Hunan). All trials were performed in compliance with the principles outlined in the Declaration of Helsinki for biomedical research involving human subjects. Informed consent was obtained from all participants for both clinical trial participation and pharmacogenetic analysis. Participants were free to withdraw from the study at any time. This study was approved by the Institutional Review Board (IRB) in the Hunan Province People’s Hospital (approval number: [2023]-32.1).

4.2. Study Design and Pharmacokinetic Assessments

Participants received a single 20 mg dose of AVA with 200 mL of water under both fasting and fed conditions. In the fed condition, subjects consumed a high-fat, high-calorie meal approximately 30 min prior to dosing, providing a total of 800–1000 kcal, approximately 150 kcal from protein, 250 kcal from carbohydrates, and 500–600 kcal from fat. This open-label, crossover study consisted of four periods with two sequences, separated by a 14-day washout. Blood samples were collected at pre-specified times: pre-dose (0 h) and at 1, 2, 3, 4, 5, 6, 7, 8, 9, 10, 11, 12, 16, 24, 48, 72, and 96 h post-dose. Samples were centrifuged at 3500 rpm for 10 min at 4 °C and stored at −70 °C until analysis.
AVA concentrations were quantified using ultra-performance liquid chromatography-tandem mass spectrometry (UPLC-MS/MS) with an AVA-D8 internal standard (UPLC I-Class and Xevo TQ-S, Waters Corporation, Milford, MA, USA). The analysis was performed on a Waters ACQUITY UPLC-BEH C18 column (1.7 μm, 2.1 mm × 50 mm) with a mobile phase of 2 mM ammonium acetate (0.1% formic acid) and acetonitrile as phase A and B, respectively, using isocratic elution at a flow rate of 0.4 mL/min. Detection employed an electrospray ionization source (ESI) in positive ion mode. The ion pairs monitored were m/z 649.44→266.95 for AVA and m/z 659.10→267.00 for AVA-D8, with a linear range of 1.000–400.000 ng/mL. The retention time for both the analyte and internal standard was 0.63 ± 0.1 min. Following current US FDA bioanalytical validation guidelines, this modified method for AVA quantification in plasma was validated and deemed reliable for pharmacokinetic studies.

4.3. Genotyping of CYP2C9 and ABCB1

CYP2C9 and ABCB1 DNA was extracted from blood samples using the Universal Genomic DNA Extraction Kit provided by GenMagBio (Beijing, China) and quantified using an Ultra-micro spectrophotometer-Nano Drop One provided by Thermofisher (Waltham, MA, USA). Genotyping was performed by Duxact Inc. (Changsha, China), focusing on CYP2C9*1, *3 (rs1057910), ABCB1 (C1236T) (rs1128503), ABCB1 (G2677T/A) (rs2032582), and ABCB1 (C3435T) (rs1045642) variants. The TaqMan MGB Probe Method on a qPCR platform was used to identify SNPs. Volunteers were grouped based on their genotype; samples without a clear amplification profile were excluded from analysis. For CYP2C9, the *1/*1 carriers were classified into the normal metabolizer (NM) group, the individuals carrying the *1/*3 variant were classified into the intermediate metabolizer (IM) group, and the *3/*3 were assigned to the poor metabolizer (PM) group.

4.4. Population Pharmacokinetic Model

Non-linear mixed-effects modeling was conducted using NONMEM (version 7.5, ICON Development Solutions, San Antonio, TX, USA) with the first-order conditional estimation with interaction (FOCE-I) algorithm. Inter-individual variability (IIV) was modeled using an exponential approach, while residual variability was tested using proportional, additive, and combined error models, and the best performing one was selected. Covariate analysis included demographic data (e.g., age, weight, sex), lab test results (e.g., ALT, AST), clinical trial conditions (e.g., food intake), and genotype information. A stepwise covariate modeling strategy was used (forward selection: p < 0.05; backward elimination: p < 0.01). Covariates were selected based on statistical significance and clinical relevance.
Model evaluation was performed using successful convergence, objective function value (OFV), Akaike information criterion (AIC), parameter precision, goodness-of-fit (GOF) plots, visual predictive checks (VPCs), and non-parametric bootstrap analysis to confirm model robustness.

4.5. Simulations of PPK-PD

To investigate the potential impact of PK variability on the PD response of AVA, a previously published PD model developed in chronic liver disease (CLD) patients [10] was adopted and linked to our PK model derived from healthy Chinese participants. Ethnic sensitivity was accounted for by applying a 32% slope reduction for East Asians. This enabled simulation of platelet count trajectories under different PK profiles, stratified by food intake and ABCB1 genotype. Simulations were performed using a typical virtual patient, in which key covariates (e.g., genotype, food status) were varied to assess their impact.
Model simulations were conducted under two dosing scenarios (60 mg QD for platelet count <40 × 109/L; 40 mg QD for 40–50 × 109/L; both for 5 consecutive days) [7] to evaluate the impact of the genotypes (TC vs. non-TC) and food conditions on drug exposure and platelet count profiles. The key exposure parameters (PK: Cmax, AUCτ in the last dose; PD: platelet Cmax, AUC0-t from day 1 to day 40) were compared to reveal the exposure and response difference in different populations.

4.6. Statistical Analysis

Non-compartmental analysis was conducted using WinNonLin (Version 6.3, Certara, Pennsylvania, PA, USA) to calculate PK parameters, including terminal half-life (t1/2), maximum plasma concentration (Cmax), time to reach Cmax (tmax), area under the plasma concentration–time curve up to the last measurable concentration (AUC0–t), and AUC extrapolated to infinity (AUC0–∞). ANOVA, following natural log-transformation of major PK parameters, was used to evaluate the effects of food intake, sex, and genotype on AVA pharmacokinetics.

5. Conclusions

This study provides important insights into the PK and PD of AVA, particularly in relation to food intake and genetic variability in CYP2C9 and ABCB1. Our findings confirmed that food significantly reduces PK variability. Additionally, although CYP2C9 or ABCB1 gene polymorphism had statistically significant effects on AVA’s exposure, they had no clinically significant impact on AVA’s PD response in the Chinese participants. There was no need to adjust the doses according to the genotypes of CYP2C9 or ABCB1 for the Chinese participants.

Supplementary Materials

The following supporting information can be downloaded at: https://www.mdpi.com/article/10.3390/ph18060903/s1.

Author Contributions

D.O., L.C., X.W. and X.Z. designed the research. X.L., G.J., B.L., Q.H. and C.L. analyzed the data. X.L., X.Z. and G.J. wrote the manuscript. Y.F. and Y.G. analyzed the blood samples and performed blood drug concentration measurements and genetic testing. All the authors approved the final manuscript, take responsibility for the content, and agree to submit it for publication. All authors have read and agreed to the published version of the manuscript.

Funding

This work was supported by the Hunan Science and Technology Youth Talent Support Program (2023TJ-N20), the science and technology innovation Program of Hunan Province (2023RC3232), and the Hunan Provincial Natural Science Foundation (2023JJ50406).

Institutional Review Board Statement

The study was conducted in accordance with the Declaration of Helsinki and approved by the Institutional Review Board (IRB) in the Hunan Province People’s Hospital (protocol code [2023]-32.1 and 5 June 2023 date of approval).

Informed Consent Statement

Informed consent was obtained from all subjects involved in the study. Written informed consent has been obtained from the patient(s) to publish this paper.

Data Availability Statement

The data that support the findings of this study are available from the corresponding author upon reasonable request.

Acknowledgments

The authors want to thank Certara for providing the Pirana license.

Conflicts of Interest

Xin Liu, Gehang Ju, Chao Li, Yunzhou Fei, Xintong Wang, Yang Gao, Dongsheng Ouyang, and Lulu Chen are employed by corporate entities. However, all of the authors declare no conflicts of interest in relation to this work.

References

  1. Nomoto, M.; Pastino, G.; Rege, B.; Aluri, J.; Ferry, J.; Han, D. Pharmacokinetics, Pharmacodynamics, Pharmacogenomics, Safety, and Tolerability of Avatrombopag in Healthy Japanese and White Subjects. Clin. Pharmacol. Drug Dev. 2018, 7, 188–195. [Google Scholar] [CrossRef] [PubMed]
  2. McFadyen, J.D.; Kaplan, Z.S. Platelets Are Not Just for Clots. Transfus. Med. Rev. 2015, 29, 110–119. [Google Scholar] [CrossRef] [PubMed]
  3. Fustolo-Gunnink, S.F.; Roehr, C.C.; Lieberman, L.; Christensen, R.D.; Van Der Bom, J.G.; Dame, C.; Del Vecchio, A.; Keir, A.K.; Curley, A.; Stanworth, S.J.; et al. Platelet and Red Cell Transfusions for Neonates: Lifesavers or Trojan Horses? Expert. Rev. Hematol. 2019, 12, 797–800. [Google Scholar] [CrossRef] [PubMed]
  4. Hitchcock, I.S.; Hafer, M.; Sangkhae, V.; Tucker, J.A. The Thrombopoietin Receptor: Revisiting the Master Regulator of Platelet Production. Platelets 2021, 32, 770–778. [Google Scholar] [CrossRef]
  5. Erickson-Miller, C.L.; Delorme, E.; Tian, S.-S.; Hopson, C.B.; Landis, A.J.; Valoret, E.I.; Sellers, T.S.; Rosen, J.; Miller, S.G.; Luengo, J.I.; et al. Preclinical Activity of Eltrombopag (SB-497115), an Oral, Nonpeptide Thrombopoietin Receptor Agonist. Stem Cells 2009, 27, 424–430. [Google Scholar] [CrossRef]
  6. Broudy, V.C.; Lin, N.L. AMG531 Stimulates Megakaryopoiesis in Vitro by Binding to Mpl. Cytokine 2004, 25, 52–60. [Google Scholar] [CrossRef]
  7. DOPTELET® (Avatrombopag) Tablets, for Oral Use. Available online: https://www.accessdata.fda.gov/drugsatfda_docs/label/2024/210238s009lbl.pdf (accessed on 26 May 2025).
  8. Deng, J.; Hu, H.; Huang, F.; Huang, C.; Huang, Q.; Wang, L.; Wu, A.; Yang, J.; Qin, D.; Zou, W.; et al. Comparative Efficacy and Safety of Thrombopoietin Receptor Agonists in Adults With Thrombocytopenia: A Systematic Review and Network Meta-Analysis of Randomized Controlled Trial. Front. Pharmacol. 2021, 12, 704093. [Google Scholar] [CrossRef]
  9. Nomoto, M.; Zamora, C.A.; Schuck, E.; Boyd, P.; Chang, M.-K.; Aluri, J.; Siu, Y.A.; Lai, W.G.; Yasuda, S.; Ferry, J.; et al. Pharmacokinetic/Pharmacodynamic Drug-Drug Interactions of Avatrombopag When Coadministered with Dual or Selective CYP2C9 and CYP3A Interacting Drugs. Br. J. Clin. Pharmacol. 2018, 84, 952–960. [Google Scholar] [CrossRef]
  10. Nomoto, M.; Ferry, J.; Hussein, Z. Population Pharmacokinetic/Pharmacodynamic Analyses of Avatrombopag in Patients With Chronic Liver Disease and Optimal Dose Adjustment Guide With Concomitantly Administered CYP3A and CYP2C9 Inhibitors. J. Clin. Pharmacol. 2018, 58, 1629–1638. [Google Scholar] [CrossRef]
  11. Kuter, D.J.; Allen, L.F. Avatrombopag, an Oral Thrombopoietin Receptor Agonist: Results of Two Double-Blind, Dose-Rising, Placebo-Controlled Phase 1 Studies. Br. J. Haematol. 2018, 183, 466–478. [Google Scholar] [CrossRef]
  12. Jurczak, W.; Chojnowski, K.; Mayer, J.; Krawczyk, K.; Jamieson, B.D.; Tian, W.; Allen, L.F. Phase 3 Randomised Study of Avatrombopag, a Novel Thrombopoietin Receptor Agonist for the Treatment of Chronic Immune Thrombocytopenia. Br. J. Haematol. 2018, 183, 479–490. [Google Scholar] [CrossRef] [PubMed]
  13. Uttamsingh, V.; Lu, C.; Miwa, G.; Gan, L.-S. Relative Contributions of the Five Major Human Cytochromes P450, 1A2, 2C9, 2C19, 2D6, and 3A4, to the Hepatic Metabolism of the Proteasome Inhibitor Bortezomib. Drug Metab. Dispos. 2005, 33, 1723–1728. [Google Scholar] [CrossRef] [PubMed]
  14. McCafferty, E.H.; Lyseng-Williamson, K.A. Avatrombopag in the Treatment of Thrombocytopenia in Adults with Chronic Liver Disease Scheduled to Undergo a Procedure: A Profile of Its Use in the USA. Drugs Ther. Perspect. 2019, 35, 1–6. [Google Scholar] [CrossRef]
  15. Skinner, K.T.; Palkar, A.M.; Hong, A.L. Genetics of ABCB1 in Cancer. Cancers 2023, 15, 4236. [Google Scholar] [CrossRef] [PubMed]
  16. Wolking, S.; Schaeffeler, E.; Lerche, H.; Schwab, M.; Nies, A.T. Impact of Genetic Polymorphisms of ABCB1 (MDR1, P-Glycoprotein) on Drug Disposition and Potential Clinical Implications: Update of the Literature. Clin. Pharmacokinet. 2015, 54, 709–735. [Google Scholar] [CrossRef]
  17. Clemons Bankston, P.; Al-Horani, R.A. New Small Molecule Drugs for Thrombocytopenia: Chemical, Pharmacological, and Therapeutic Use Considerations. Int. J. Mol. Sci. 2019, 20, 3013. [Google Scholar] [CrossRef]
  18. Zuo, W.; Liu, B.; Chen, M.; Zhang, B.; Han, B. Relationship between CYP2C8, UGT1A1, and ABCG2 Gene Polymorphisms and the Exposure, Efficacy, and Toxicity of Eltrombopag in the Treatment of Refractory Aplastic Anemia. Eur. J. Clin. Pharmacol. 2022, 78, 1657–1666. [Google Scholar] [CrossRef]
  19. Liu, Z.-J.; Hoffmeister, K.M.; Hu, Z.; Mager, D.E.; Ait-Oudhia, S.; Debrincat, M.A.; Pleines, I.; Josefsson, E.C.; Kile, B.T.; Italiano, J.; et al. Expansion of the Neonatal Platelet Mass Is Achieved via an Extension of Platelet Lifespan. Blood 2014, 123, 3381–3389. [Google Scholar] [CrossRef]
  20. Markham, A. Avatrombopag: A Review in Thrombocytopenia. Drugs 2021, 81, 1905–1913. [Google Scholar] [CrossRef]
  21. Kuter, D.J. The Structure, Function, and Clinical Use of the Thrombopoietin Receptor Agonist Avatrombopag. Blood Rev. 2022, 53, 100909. [Google Scholar] [CrossRef]
  22. Kirchheiner, J.; Brockmöller, J. Clinical Consequences of Cytochrome P450 2C9 Polymorphisms. Clin. Pharmacol. Ther. 2005, 77, 1–16. [Google Scholar] [CrossRef] [PubMed]
  23. Kurata, Y.; Ieiri, I.; Kimura, M.; Morita, T.; Irie, S.; Urae, A.; Ohdo, S.; Ohtani, H.; Sawada, Y.; Higuchi, S.; et al. Role of Human MDR1 Gene Polymorphism in Bioavailability and Interaction of Digoxin, a Substrate of P-Glycoprotein. Clin. Pharmacol. Ther. 2002, 72, 209–219. [Google Scholar] [CrossRef] [PubMed]
  24. Lown, K.S.; Mayo, R.R.; Leichtman, A.B.; Hsiao, H.L.; Turgeon, D.K.; Schmiedlin-Ren, P.; Brown, M.B.; Guo, W.; Rossi, S.J.; Benet, L.Z.; et al. Role of Intestinal P-Glycoprotein (Mdr1) in Interpatient Variation in the Oral Bioavailability of Cyclosporine. Clin. Pharmacol. Ther. 1997, 62, 248–260. [Google Scholar] [CrossRef] [PubMed]
  25. Ieiri, I.; Takane, H.; Otsubo, K. The MDR1 (ABCB1) Gene Polymorphism and Its Clinical Implications. Clin. Pharmacokinet. 2004, 43, 553–576. [Google Scholar] [CrossRef]
  26. Fellay, J.; Marzolini, C.; Meaden, E.R.; Back, D.J.; Buclin, T.; Chave, J.P.; Decosterd, L.A.; Furrer, H.; Opravil, M.; Pantaleo, G.; et al. Response to Antiretroviral Treatment in HIV-1-Infected Individuals with Allelic Variants of the Multidrug Resistance Transporter 1: A Pharmacogenetics Study. Lancet 2002, 359, 30–36. [Google Scholar] [CrossRef]
  27. Barusrux, S.; Koomdee, N.; Sukprasong, R.; Manosuthi, W.; Chamnanphon, M.; Puangpetch, A.; Sukasem, C.; Nissapatorn, V.; Pereira, M. Effect of ABCB1 3435C>T Transporter Gene Polymorphism on Plasma Efavirenz Concentration in HIV-1 Infected Thai Adults. Asian Pac. J. Trop. Med. 2020, 13, 266–271. [Google Scholar] [CrossRef]
  28. Balram, C.; Sharma, A.; Sivathasan, C.; Lee, E.J.D. Frequency of C3435T Single Nucleotide MDR1 Genetic Polymorphism in an Asian Population: Phenotypic-Genotypic Correlates. Br. J. Clin. Pharmacol. 2003, 56, 78–83. [Google Scholar] [CrossRef]
  29. Sai, K.; Kaniwa, N.; Itoda, M.; Saito, Y.; Hasegawa, R.; Komamura, K.; Ueno, K.; Kamakura, S.; Kitakaze, M.; Shirao, K.; et al. Haplotype Analysis of ABCB1/MDR1 Blocks in a Japanese Population Reveals Genotype-Dependent Renal Clearance of Irinotecan. Pharmacogenetics 2003, 13, 741–757. [Google Scholar] [CrossRef]
  30. Nakamura, T.; Sakaeda, T.; Horinouchi, M.; Tamura, T.; Aoyama, N.; Shirakawa, T.; Matsuo, M.; Kasuga, M.; Okumura, K. Effect of the Mutation (C3435T) at Exon 26 of the MDR1 Gene on Expression Level of MDR1 Messenger Ribonucleic Acid in Duodenal Enterocytes of Healthy Japanese Subjects. Clin. Pharmacol. Ther. 2002, 71, 297–303. [Google Scholar] [CrossRef]
  31. Prasad, B.; Evers, R.; Gupta, A.; Hop, C.E.C.A.; Salphati, L.; Shukla, S.; Ambudkar, S.V.; Unadkat, J.D. Interindividual Variability in Hepatic Organic Anion-Transporting Polypeptides and P-Glycoprotein (ABCB1) Protein Expression: Quantification by Liquid Chromatography Tandem Mass Spectroscopy and Influence of Genotype, Age, and Sex. Drug Metab. Dispos. 2014, 42, 78–88. [Google Scholar] [CrossRef]
  32. Siegmund, W.; Ludwig, K.; Giessmann, T.; Dazert, P.; Schroeder, E.; Sperker, B.; Warzok, R.; Kroemer, H.K.; Cascorbi, I. The Effects of the Human MDR1 Genotype on the Expression of Duodenal P-Glycoprotein and Disposition of the Probe Drug Talinolol. Clin. Pharmacol. Ther. 2002, 72, 572–583. [Google Scholar] [CrossRef] [PubMed]
  33. Owen, A.; Goldring, C.; Morgan, P.; Chadwick, D.; Park, B.K.; Pirmohamed, M. Relationship between the C3435T and G2677T(A) Polymorphisms in the ABCB1 Gene and P-Glycoprotein Expression in Human Liver. Br. J. Clin. Pharmacol. 2005, 59, 365–370. [Google Scholar] [CrossRef] [PubMed]
  34. Hoffmeyer, S.; Burk, O.; von Richter, O.; Arnold, H.P.; Brockmöller, J.; Johne, A.; Cascorbi, I.; Gerloff, T.; Roots, I.; Eichelbaum, M.; et al. Functional Polymorphisms of the Human Multidrug-Resistance Gene: Multiple Sequence Variations and Correlation of One Allele with P-Glycoprotein Expression and Activity in Vivo. Proc. Natl. Acad. Sci. USA 2000, 97, 3473–3478. [Google Scholar] [CrossRef] [PubMed]
  35. Han, J.-Y.; Lim, H.-S.; Yoo, Y.-K.; Shin, E.S.; Park, Y.H.; Lee, S.Y.; Lee, J.-E.; Lee, D.H.; Kim, H.T.; Lee, J.S. Associations of ABCB1, ABCC2, and ABCG2 Polymorphisms with Irinotecan-Pharmacokinetics and Clinical Outcome in Patients with Advanced Non-Small Cell Lung Cancer. Cancer 2007, 110, 138–147. [Google Scholar] [CrossRef]
  36. Puranik, Y.G.; Birnbaum, A.K.; Marino, S.E.; Ahmed, G.; Cloyd, J.C.; Remmel, R.P.; Leppik, I.E.; Lamba, J.K. Association of Carbamazepine Major Metabolism and Transport Pathway Gene Polymorphisms and Pharmacokinetics in Patients with Epilepsy. Pharmacogenomics 2013, 14, 35–45. [Google Scholar] [CrossRef]
Figure 1. Comparison of the exposure parameters in different CYP2C9 phenotypes and ABCB1(C1236T) genotypes in fasting (left) and fed state (right). (A): The AUC comparison between CYP2C9 IM and NM phenotype; (B): The Cmax comparison between CYP2C9 IM and NM phenotype; (C): The AUC comparison between ABCB1 (C1236T) CC, TC and TT genotype; (D): The Cmax comparison between ABCB1 (C1236T) CC, TC and TT genotype. Notes: ns, no significant difference; *, p-value < 0.05; **, p-value < 0.01; ***, p-value < 0.001. The colors represent distinct genotypes or phenotypes.
Pharmaceuticals 18 00903 g001
Figure 2. The goodness-of-fit plot for the final pharmacokinetic model of avatrombopag. Notes: CWRES, conditional weight residuals; the red dashed line indicates the linear regression trendline and the black solid line means the reference line. Blue circles represent observed data. (A) Observations vs. population predictions. (B) Observation vs. individual predictions. (C) Conditional weight residuals vs. time. (D) Conditional weight residuals vs. population predictions.
Pharmaceuticals 18 00903 g002
Figure 3. Visual predictive check plot of the final AVA population pharmacokinetic model. Notes: The circles represent observed data. Black lines represent the 5% (dashed), 50% (solid), and 95% (dashed) percentiles of the observed data. Shaded areas represent 95% confidence intervals of the median 5% (red), 50% (blue), and 95% (red) percentiles of the predicted concentrations.
Pharmaceuticals 18 00903 g003
Figure 4. The PK/PD simulation profiles of AVA under 40 and 60 mg dosage regimen. Notes: the line represents the median value–time profiles of each ABCB1 (C1236T) genotype and food intake state.
Pharmaceuticals 18 00903 g004
Table 1. Demographic characteristics of this study.
CharacteristicFasting (n = 47)Fed (n = 45)
Mean ± SDMean ± SD
Age (years)28.98 ± 6.2728.48 ± 7.55
Body weight (kg)63.22 ± 7.8860.95 ± 6.32
Height (cm)167.62 ± 6.82167.16 ± 5.67
Sex (Male/Female)41/642/3
Alanine Aminotransferase (U/L)23.04 ± 12.3519.46 ± 12.31
Aspartate Aminotransferase (U/L)21.2 ± 4.7118.97 ± 4.5
Albumin (g/L)47.06 ± 2.2547.19 ± 2.07
Total Protein (g/L)74.6 ± 4.1874.26 ± 3.54
Total Bilirubin (µmol/L)14.76 ± 4.4214.38 ± 6.92
Direct Bilirubin (µmol/L)3.89 ± 1.273.63 ± 1.77
Prothrombin Time (s)13.65 ± 0.7312.4 ± 0.74
Activated Partial Thromboplastin Time (s)30.36 ± 3.3535.8 ± 3.39
International Normalized Ratio1.12 ± 0.071.03 ± 0.06
Fasting Blood Glucose (mmol/L)2.7 ± 0.492.41 ± 0.34
Creatinine (µmol/L)76.26 ± 11.0376.79 ± 10.56
Blood Urea Nitrogen (mmol/L)4.06 ± 0.694.33 ± 0.83
Uric Acid (µmol/L)387.44 ± 79.85360.76 ± 76.24
CYP2C9 (NM/IM)43/443/2
ABCB1 (C1236T) (CC/TC/TT)7/28/126/19/20
ABCB1 (C3435T) (CC/TC/TT)22/19/615/24/6
ABCB1 (G2677T/A) (GA/GG/TA/TG/TT)3/9/4/23/810/9/5/17/4
Table 2. Summary statistics for the main pharmacokinetic parameters of males and females under fasting and fed conditions.
PK ParametersFastingFed
ALL (N = 47)Male (N = 41)Female (N = 6)ALL (N = 45)Male (N = 42)Female (N = 3)
t1/2
(h)
18.92 ± 3.5619.27 ± 3.6016.55 ± 2.0918.18 ± 2.9118.14 ± 3.0219.51 ± 1.69
tmax
(h)
7.02(3.00~16.00)7.02(3.00~10.02)6.51(4.00~16.00)6.00(2.00~12.00)5.00(2.00~12.00)5.01(4.00~10.02)
Cmax
(ng/mL)
80.44 ± 52.7077.22 ± 49.15101.90 ± 71.0285.06 ± 27.9986.00 ± 28.5173.92 ± 25.77
AUC0-t
(h×ng/mL)
2335.67 ± 1456.902302.61 ± 1430.752556.05 ± 1672.362389.39 ± 933.232415.02 ± 970.482018.66 ± 615.38
AUC0-∞
(h×ng/mL)
2428.42 ± 1502.162399.72 ± 1479.642619.79 ± 1702.322478.66 ± 1014.602506.96 ± 1058.142095.01 ± 625.05
Note: tmax expressed as median for range. Other values are presented as mean ± standard deviation.
Table 3. The final parameters estimate of avatrombopag and bootstrap results.
ParametersFinal ModelBootstrap
EstimatesRSE%Median [2.5th–97.5th]
CL/F (L/h)7.8514%7.81 [5.92–10.62]
Vd/F (L)19913%198.01 [149.77–267.64]
ka (/h)0.58213%0.581 [0.4723–0.785]
MTT (h)1.335%1.33 [1.22–1.45]
COV1 *−0.0653111%−0.0702 [−0.3069–0.2698]
COV2 *−0.27215%−0.28 [−0.47–0.01]
COV3 *0.17756%0.186 [−0.216–0.431]
Between-subject variability
CL/F0.18235%0.174 [0.126–0.235]
Vd/F0.15932%0.153 [0.106–0.204]
KA0.50435%0.48 [0.29–0.78]
MTT0.13123%0.128 [0.093–0.169]
OCC [KA]0.91312%0.922 [0.681–1.346]
Residual unexplained variability
σprop (%)23.90%4%23.79% [22.28–25.74%]
σadd (ng/mL)1.183.00%1.17 [0.86–1.48]
Notes: CL/F: the apparent plasma clearance; Vd/F: the apparent volume distribution; Ka: the absorption rate constant; MTT: the mean transit time; RSE: relative standard error; OCC: occasional variability; σprop: proportional error; σadd: additional error; COV1: the effect of fed state and TC genotype on Fa; COV2: the effect of fast state and non-TC genotype on Fa; COV3: the effect of fed state and non-TC genotype on Fa. * Fa = 1 × (1 + COV1 × FOOD + COV2 × ABCB1 + COV3 × FOOD × ABCB1). If in the fed state, FOOD is 1; fasting state is 0. If the genotype is heterozygote, ABCB1 is 0; homozygote is 1.
Table 4. The simulated PK/PD results of different ABCB1 (C1236T) genotypes under different food intake states.
Dosage
Regimen
GroupPKPD
Cmax
(ng/mL)
AUC
(ng × h/mL)
Cmax
(×109)
AUC
(×109)
60 mgNon-TC under Fasting State160.92 5480.2153.23 35,907.80
Non-TC under Fed State185.54 6321.1856.67 36,911.66
TC under Fasting State220.88 7527.4161.56 38,331.20
TC under Fed State206.50 7035.8459.55 37,750.24
40 mgNon-TC under Fasting State107.24 3653.1260.64 44,904.43
Non-TC under Fed State123.76 4214.0163.51 45,807.92
TC under Fasting State147.41 5018.6167.58 47,086.80
TC under Fed State137.80 4691.0465.85 46,569.38
Note: Simulated using typical individual parameters. For PK, AUC represents the 24 h area under the curve after the last dose, and Cmax represents the maximum concentration after the last dose. For PD, AUC represents the area under the curve from 0 to 960 h, and Cmax means the maximum platelet count from 0 to 960 h.
Disclaimer/Publisher’s Note: The statements, opinions and data contained in all publications are solely those of the individual author(s) and contributor(s) and not of MDPI and/or the editor(s). MDPI and/or the editor(s) disclaim responsibility for any injury to people or property resulting from any ideas, methods, instructions or products referred to in the content.

