
Beyond-Rule-of-Five Compounds Are Not Different: In Vitro–In Vivo Extrapolation of Female CD-1 Mouse Clearance Based on Merck Healthcare KGaA Compound Set


Abstract
1. Introduction
2. Results
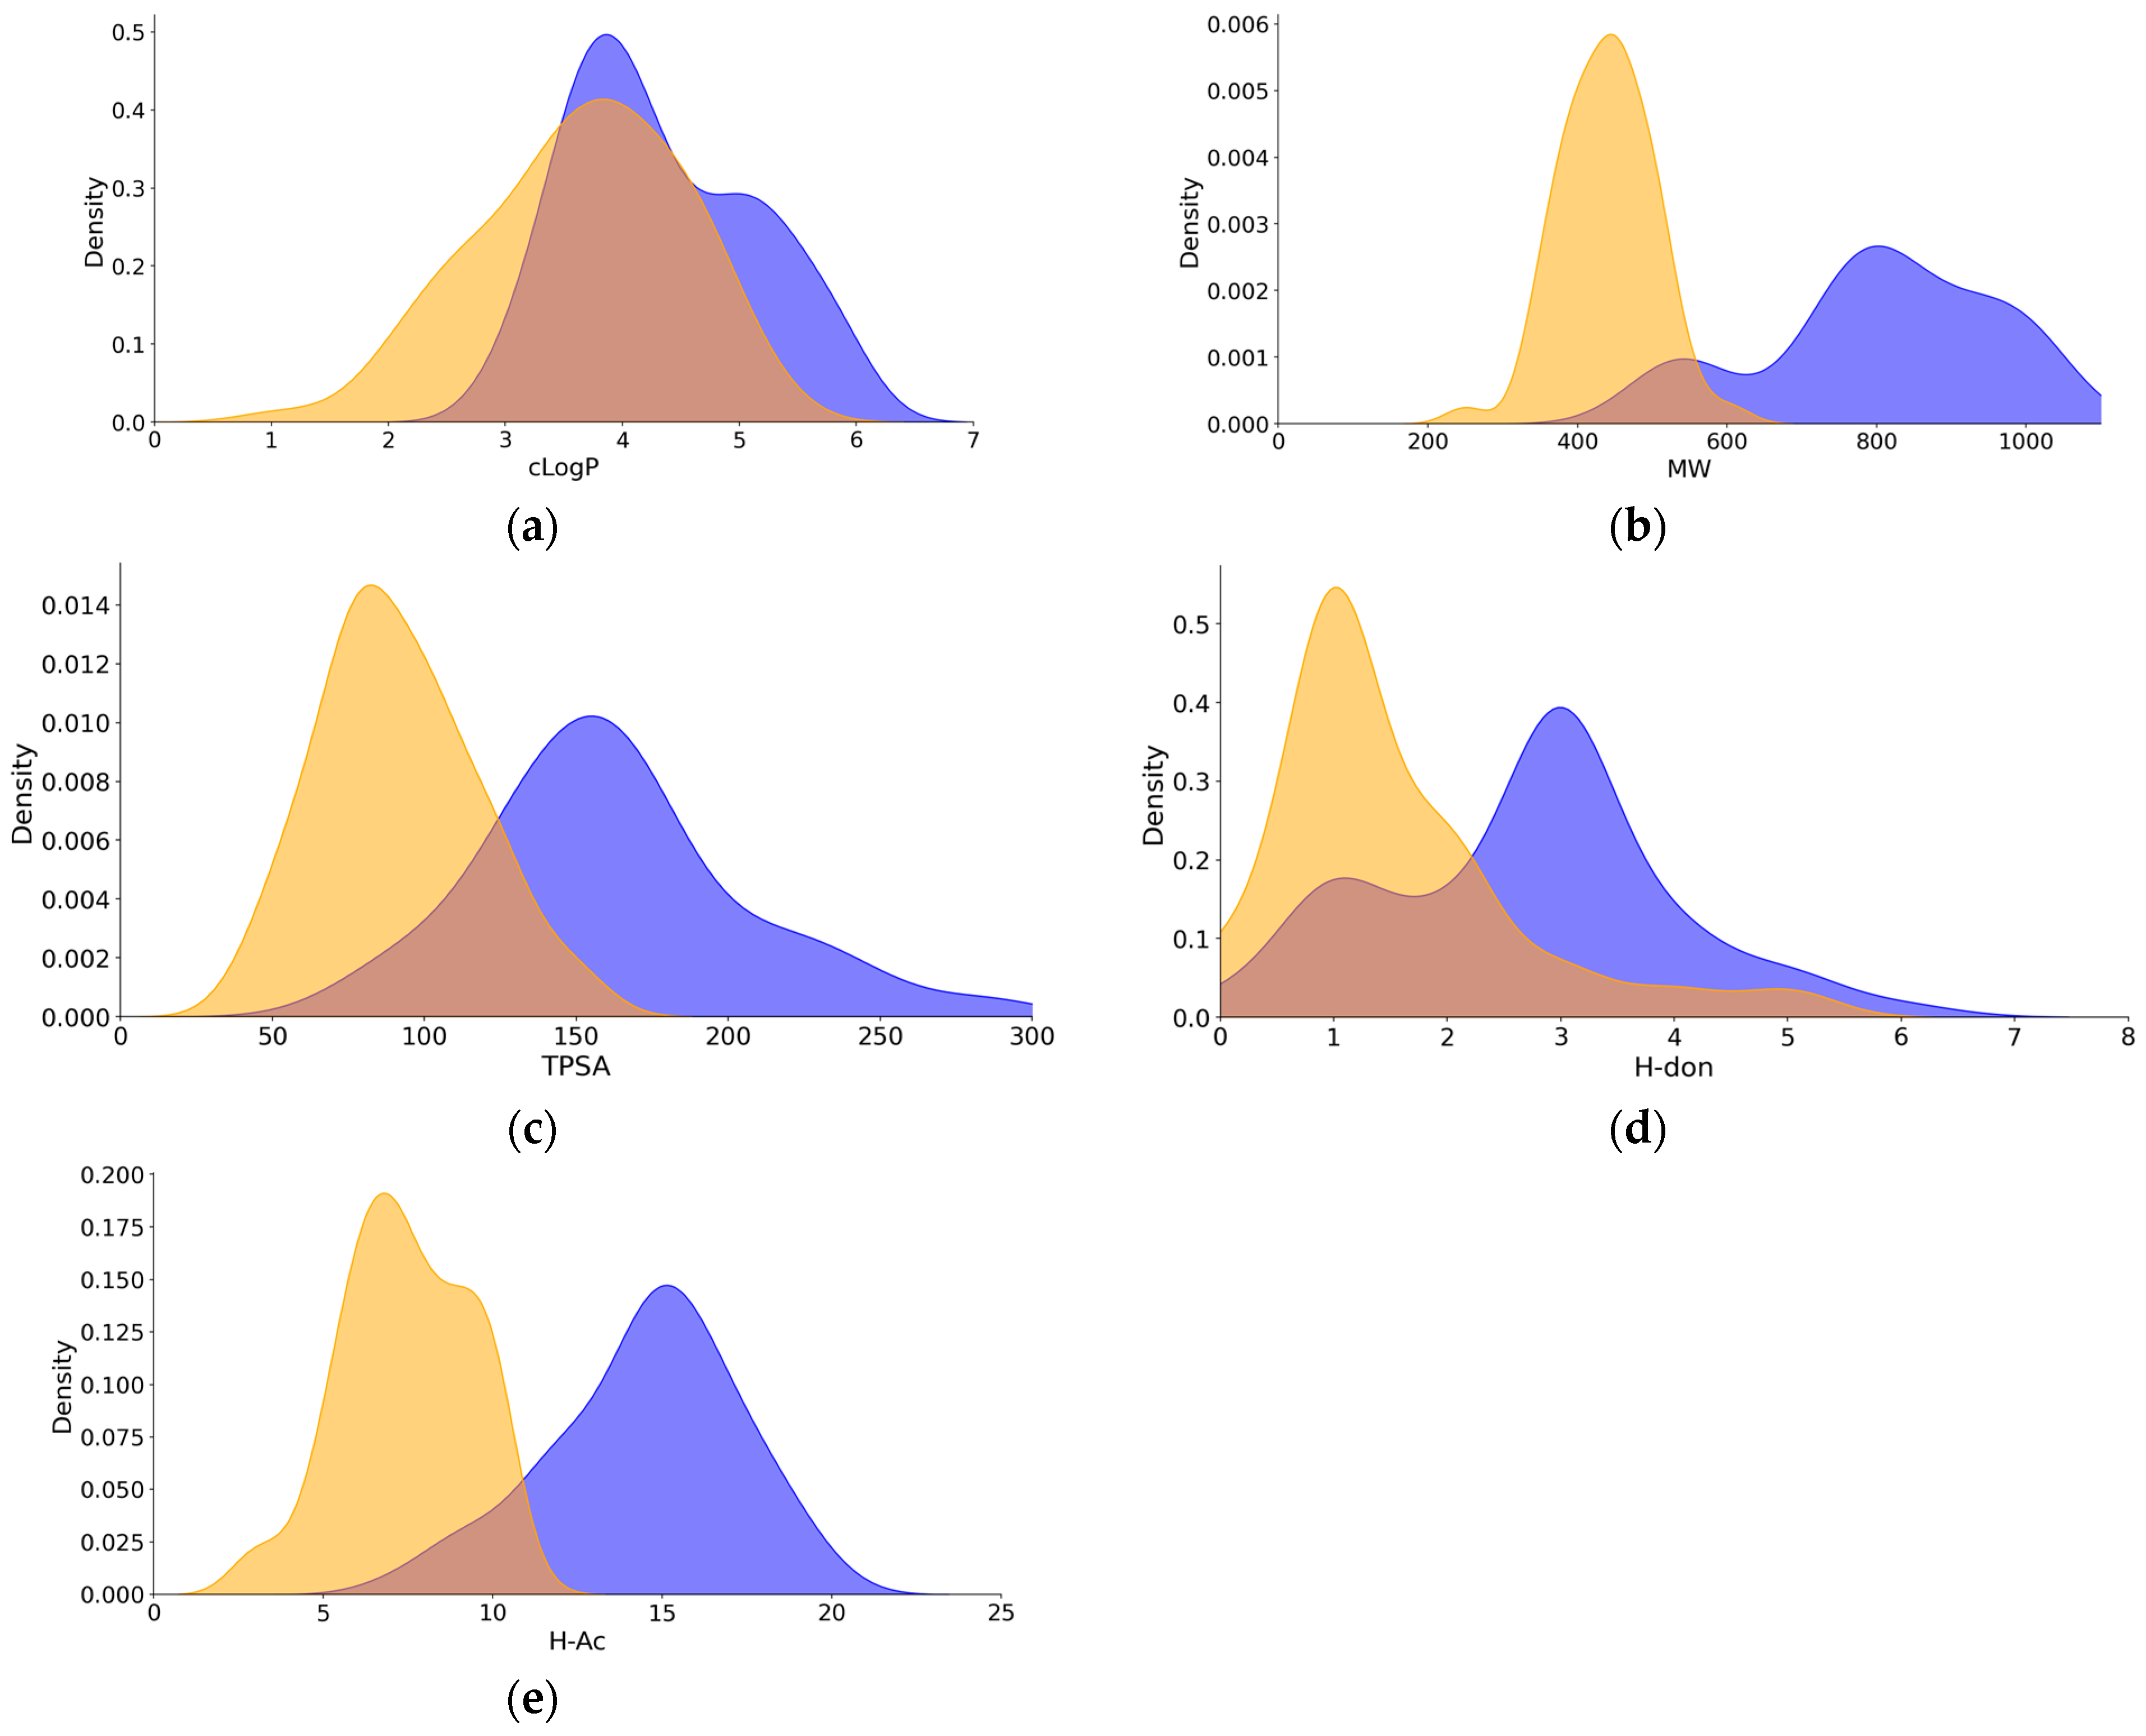
2.1. Data Set
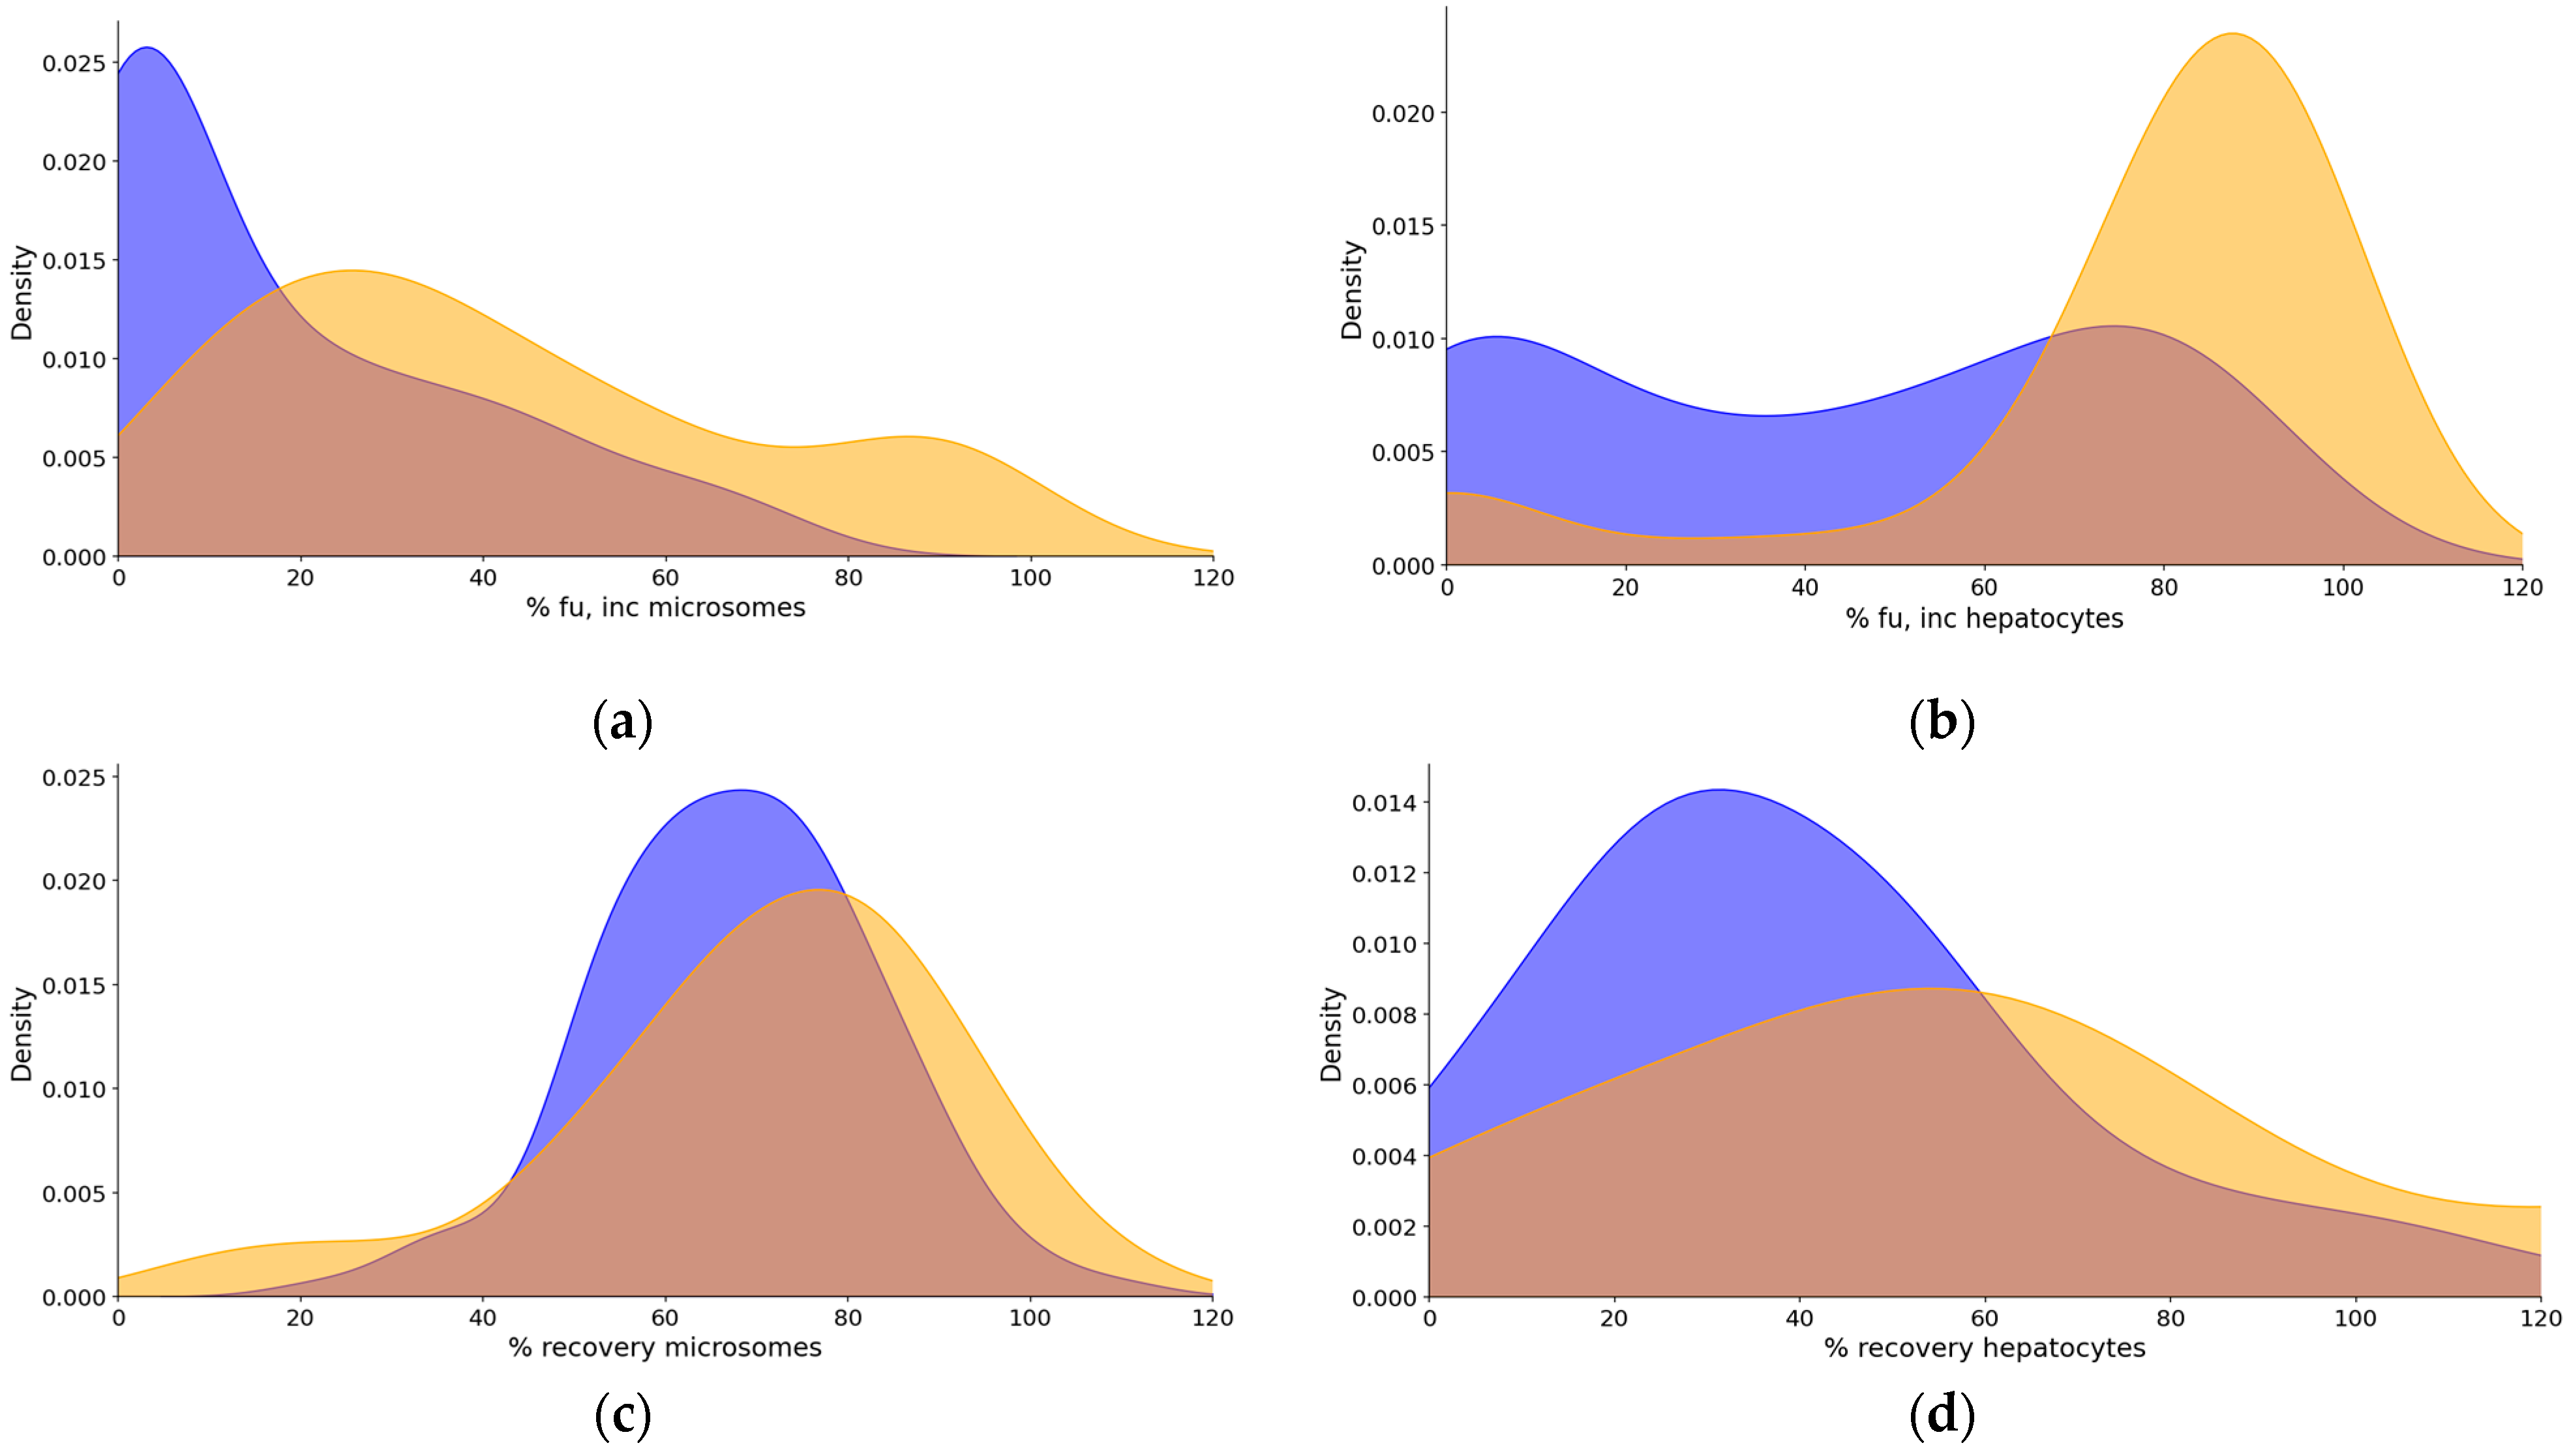
2.2. Binding to In Vitro Systems
2.3. Extrapolation of Mouse Clearance from In Vitro Systems
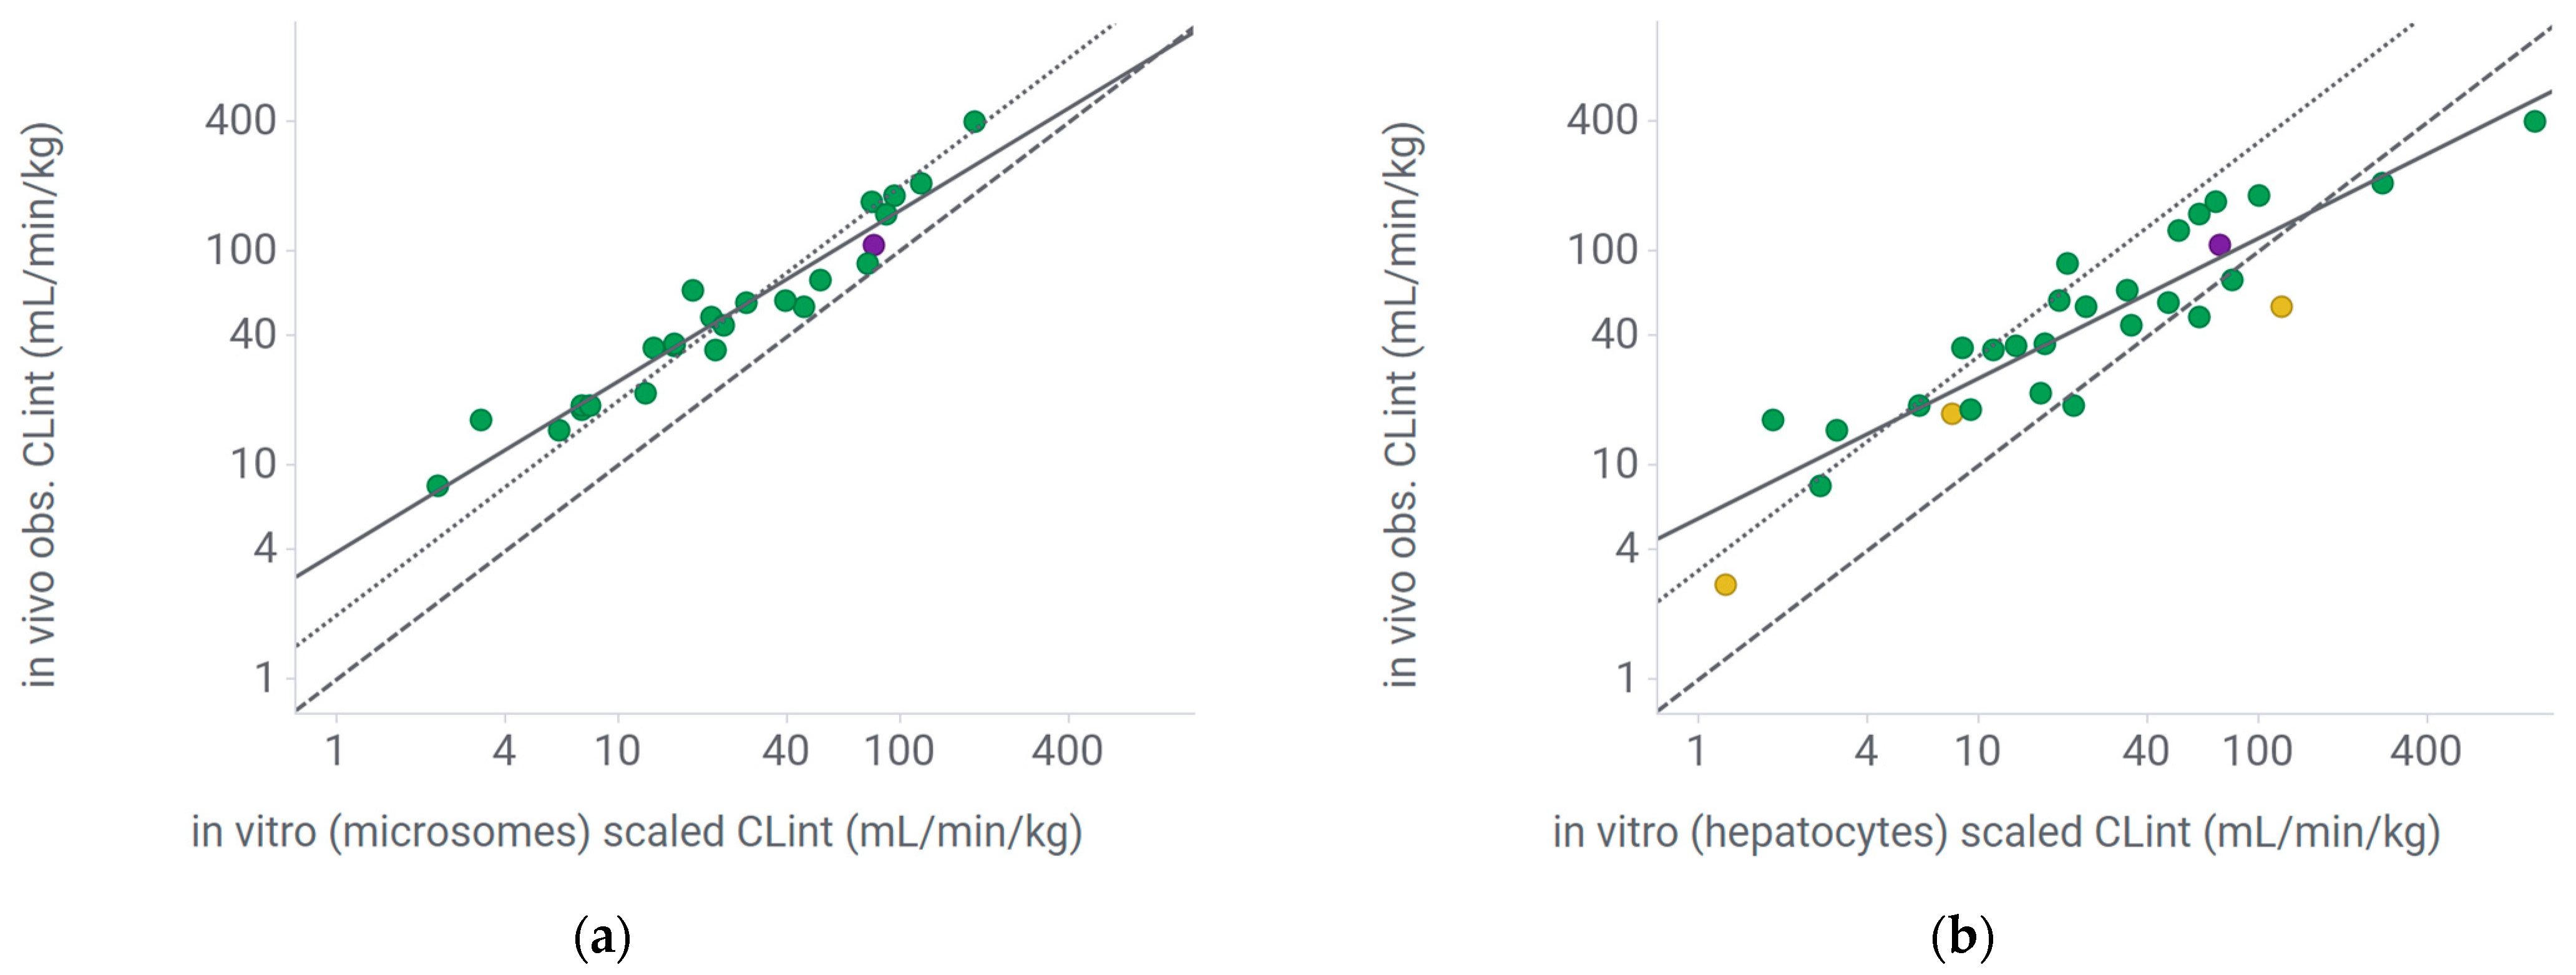
2.3.1. Regression Correction
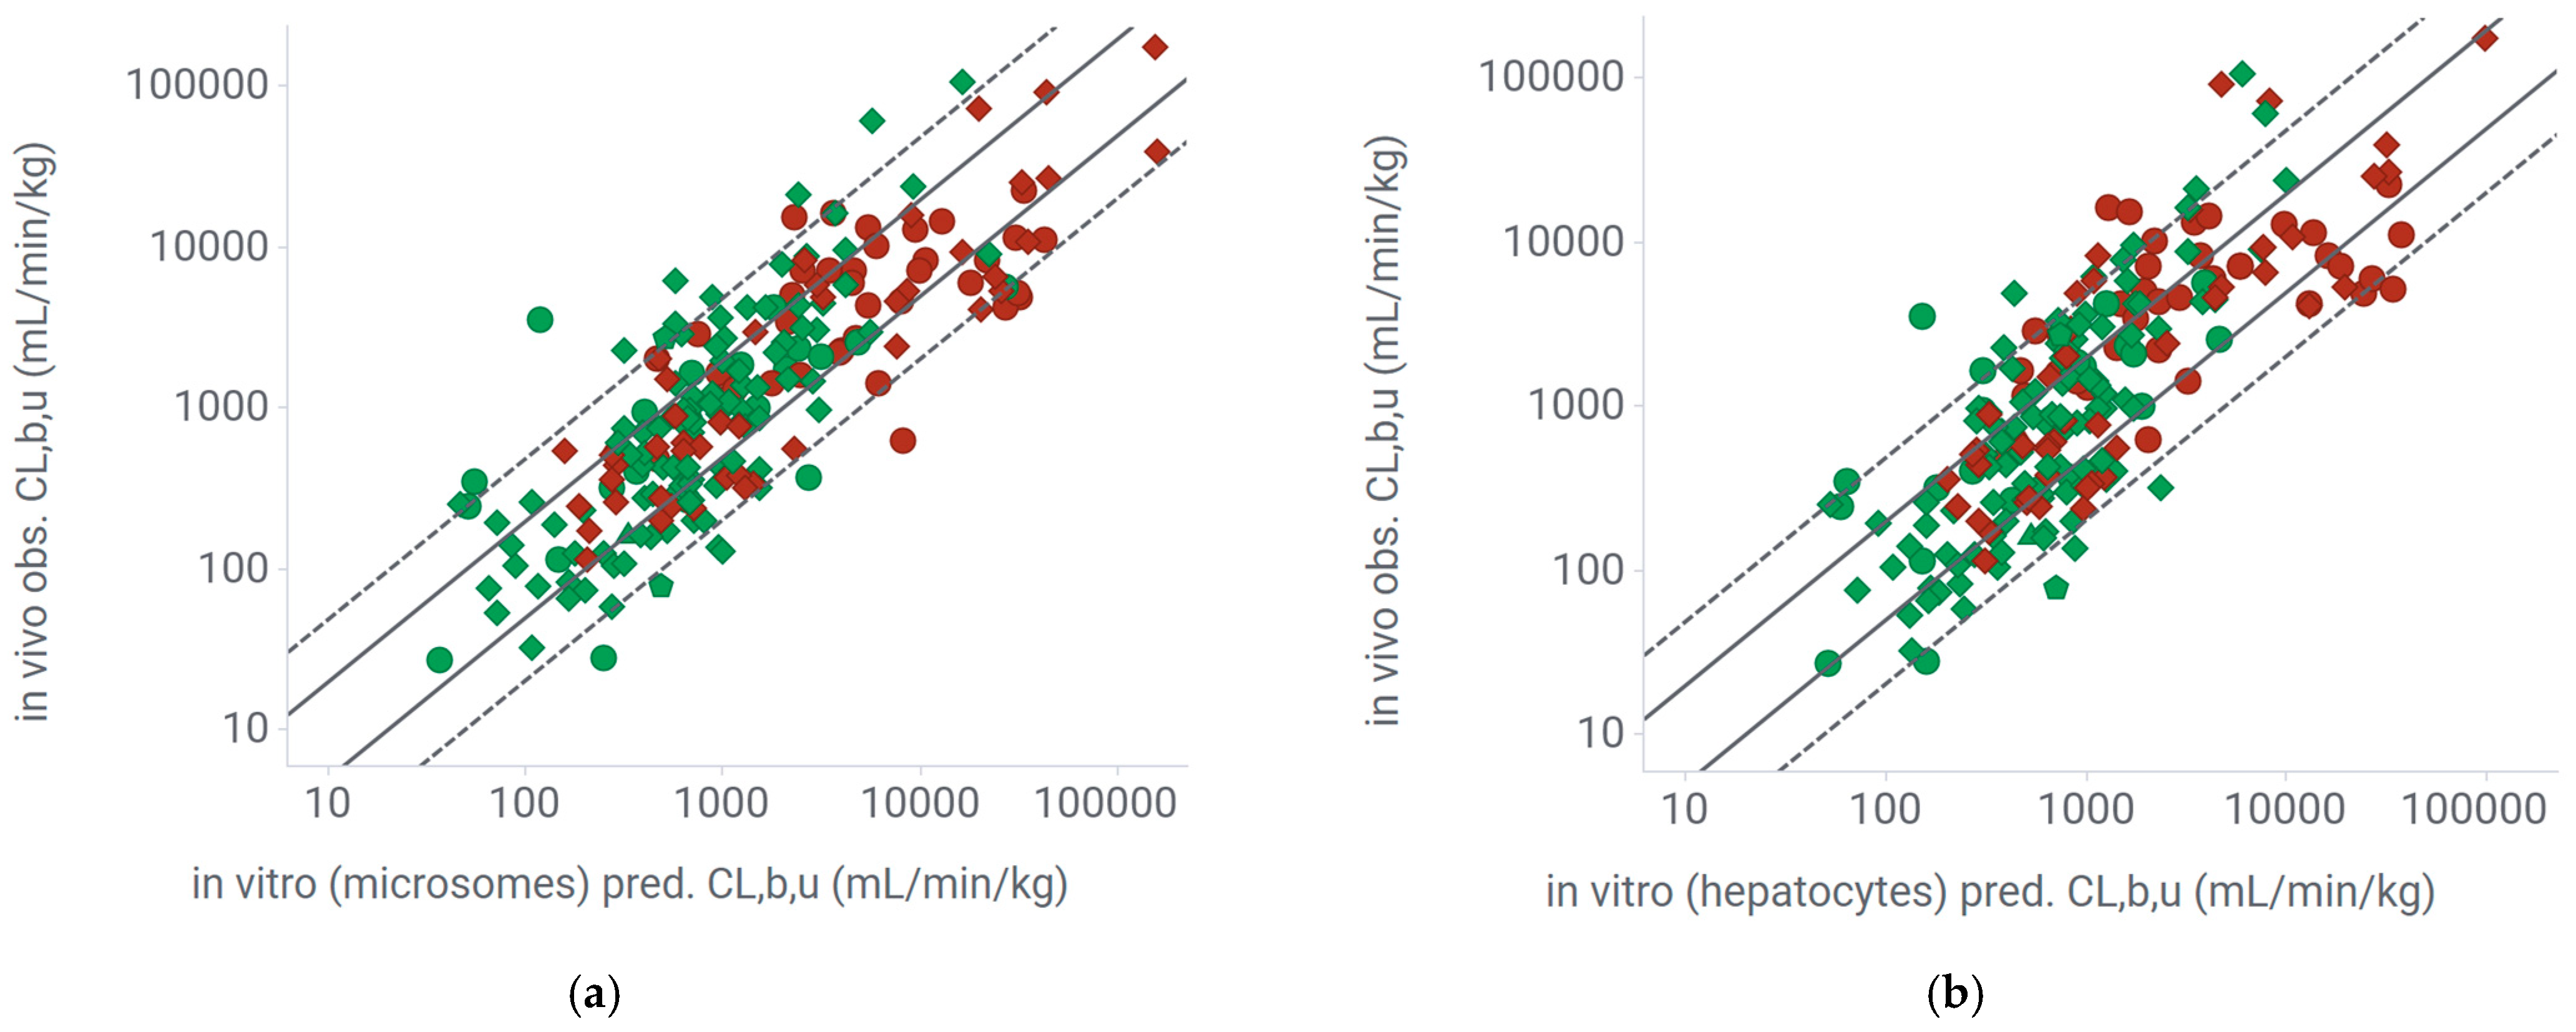
2.3.2. Extrapolation of Mouse Clearance from In Vitro Systems Using Experimental Unbound Fraction in the Incubation
2.3.3. Extrapolation of Mouse Clearance from In Vitro Systems Using Predicted Unbound Fraction in the Incubation
3. Discussion
4. Materials and Methods
4.1. Data Set
4.2. Determination of CLint in Mouse Microsomes
4.3. Determination of CLint in Mouse Hepatocytes
4.4. Prediction of fu,mic and fu,hep by the Kilford Equations
4.5. Determination of Unbound Fraction in Plasma (fu,p), in the Microsome Incubation (fu,mic), and in the Hepatocyte Incubation (fu,hep)
4.6. Pharmacokinetic Studies in Mice
4.7. IVIVE of Mouse CLint from In Vitro Systems
4.8. Statistics
Supplementary Materials
Author Contributions
Funding
Institutional Review Board Statement
Informed Consent Statement
Data Availability Statement
Acknowledgments
Conflicts of Interest
Abbreviations
| AAFE | Average absolute fold error |
| ACN | Acetonitrile |
| ADME | Absorption, distribution, metabolism, excretion |
| AFE | Average fold error |
| AUC | Area under the curve |
| B | Base |
| CLint | Intrinsic clearance |
| CLb,u | Unbound blood clearance |
| clogD 7.4 | Calculated logD at pH 7.4 |
| clogP | Calculated logP |
| DMPK | Drug metabolism and pharmacokinetics |
| DMSO | Dimethyl sulfoxide |
| ECCS | Extended clearance classification system |
| fu,hep | Unbound fraction in the hepatocyte incubation |
| fu,mic | Unbound fraction in the microsome incubation |
| fu,p | Unbound fraction in plasma |
| HAc | H-bond acceptor |
| HDon | H-bond donor |
| Hep | Hepatocytes |
| HPGL | Hepatocytes per gram of liver |
| IV | Intravenous |
| IVIVE | In vitro–in vivo extrapolation |
| kel | Elimination rate constant |
| Mic | Microsomes |
| MPPGL | Microsomal protein per gram of liver |
| MW | Molecular weight |
| N | Neutral |
| NADPH | Nicotinamide adenine dinucleotide phosphate hydrogen |
| PROTAC© | Proteolysis-targeting chimera |
| PK | Pharmacokinetics |
| QH | Hepatic blood flow |
| Rb | Blood-to-plasma partition coefficient |
| RED | Rapid equilibrium dialysis |
| TPSA | Total polar surface area |
| UHPLC-MS/MS | Ultra-high-performance liquid chromatography–tandem mass spectrometry |
| VHL | Von Hippel–Lindau |
References
- Smith, D.A.; Beaumont, K.; Maurer, T.S.; Di, L. Clearance in Drug Design. J. Med. Chem. 2019, 62, 2245–2255. [Google Scholar] [CrossRef]
- Smith, D.A.; Beaumont, K.; Maurer, T.S.; Di, L. Relevance of Half-Life in Drug Design. J. Med. Chem. 2018, 61, 4273–4282. [Google Scholar] [CrossRef]
- Benet, L.Z.; Zia-Amirhosseini, P. Basic principles of pharmacokinetics. Toxicol. Pathol. 1995, 23, 115–123. [Google Scholar] [CrossRef] [PubMed]
- Obach, R.S. Prediction of human clearance of twenty-nine drugs from hepatic microsomal intrinsic clearance data: An examination of in vitro half-life approach and nonspecific binding to microsomes. Drug Metab. Dispos. 1999, 27, 1350–1359. [Google Scholar] [CrossRef] [PubMed]
- Riley, R.J.; McGinnity, D.F.; Austin, R.P. A unified model for predicting human hepatic, metabolic clearance from in vitro intrinsic clearance data in hepatocytes and microsomes. Drug Metab. Dispos. 2005, 33, 1304–1311. [Google Scholar] [CrossRef] [PubMed]
- Sohlenius-Sternbeck, A.-K.; Jones, C.; Ferguson, D.; Middleton, B.J.; Projean, D.; Floby, E.; Bylund, J.; Afzelius, L. Practical use of the regression offset approach for the prediction of in vivo intrinsic clearance from hepatocytes. Xenobiotica 2012, 42, 841–853. [Google Scholar] [CrossRef]
- Poulin, P.; Haddad, S. Toward a new paradigm for the efficient in vitro-in vivo extrapolation of metabolic clearance in humans from hepatocyte data. J. Pharm. Sci. 2013, 102, 3239–3251. [Google Scholar] [CrossRef]
- Tess, D.; Chang, G.C.; Keefer, C.; Carlo, A.; Jones, R.; Di, L. In Vitro-In Vivo Extrapolation and Scaling Factors for Clearance of Human and Preclinical Species with Liver Microsomes and Hepatocytes. AAPS J. 2023, 25, 40. [Google Scholar] [CrossRef]
- Hallifax, D.; Houston, J.B. Use of Segregated Hepatocyte Scaling Factors and Cross-Species Relationships to Resolve Clearance Dependence in the Prediction of Human Hepatic Clearance. Drug Metab. Dispos. 2019, 47, 320–327. [Google Scholar] [CrossRef]
- Yan, Z.; Ma, L.; Huang, J.; Carione, P.; Kenny, J.R.; Hop, C.E.C.A.; Wright, M. New Methodology for Determining Plasma Protein Binding Kinetics Using an Enzyme Reporter Assay Coupling with High-Resolution Mass Spectrometry. Anal. Chem. 2023, 95, 4086–4094. [Google Scholar] [CrossRef]
- Lipinski, C.A.; Lombardo, F.; Dominy, B.W.; Feeney, P.J. Experimental and computational approaches to estimate solubility and permeability in drug discovery and development settings. Adv. Drug Deliv. Rev. 1997, 23, 3–25. [Google Scholar] [CrossRef]
- Maurer, C.K.; Fang, Z.; Schindler, C.; Pohl, G.; Machrouhi-Porcher, F.; Lecomte, M.; Petersson, C.; Duevel, H.M. In vitro and in vivo ADME of heterobifunctional degraders: A tailored approach to optimize DMPK properties of PROTACs©. RSC Med. Chem. 2025. [Google Scholar] [CrossRef] [PubMed]
- Pike, A.; Williamson, B.; Harlfinger, S.; Martin, S.; McGinnity, D.F. Optimising proteolysis-targeting chimeras (PROTACs) for oral drug delivery: A drug metabolism and pharmacokinetics perspective. Drug Discov. Today 2020, 25, 1793–1800. [Google Scholar] [CrossRef]
- Volak, L.P.; Duevel, H.M.; Humphreys, S.; Nettleton, D.; Phipps, C.; Pike, A.; Rynn, C.; Scott-Stevens, P.; Zhang, D.; Zientek, M. Industry Perspective on the Pharmacokinetic and Absorption, Distribution, Metabolism, and Excretion Characterization of Heterobifunctional Protein Degraders. Drug Metab. Dispos. 2023, 51, 792–803. [Google Scholar] [CrossRef] [PubMed]
- Apprato, G.; Caron, G.; Deshmukh, G.; Garcia-Jimenez, D.; Haid, R.T.U.; Pike, A.; Reichel, A.; Rynn, C.; Donglu, Z.; Wittwer, M.B. Finding a needle in the haystack: ADME and pharmacokinetics/pharmacodynamics characterization and optimization toward orally available bifunctional protein degraders. Expert Opin. Drug Discov. 2025, 20, 373–389. [Google Scholar] [CrossRef]
- Kilford, P.J.; Gertz, M.; Houston, J.B.; Galetin, A. Hepatocellular binding of drugs: Correction for unbound fraction in hepatocyte incubations using microsomal binding or drug lipophilicity data. Drug Metab. Dispos. 2008, 36, 1194–1197. [Google Scholar] [CrossRef]
- Paine, S.W.; Barton, P.; Bird, J.; Denton, R.; Menochet, K.; Smith, A.; Tomkinson, N.P.; Chohan, K.K. A rapid computational filter for predicting the rate of human renal clearance. J. Mol. Graph. Model. 2010, 29, 529–537. [Google Scholar] [CrossRef]
- Varma, M.V.S.; Feng, B.; Obach, R.S.; Troutman, M.D.; Chupka, J.; Miller, H.R.; El-Kattan, A. Physicochemical determinants of human renal clearance. J. Med. Chem. 2009, 52, 4844–4852. [Google Scholar] [CrossRef]
- Yang, X.; Gandhi, Y.A.; Duignan, D.B.; Morris, M.E. Prediction of biliary excretion in rats and humans using molecular weight and quantitative structure-pharmacokinetic relationships. AAPS J. 2009, 11, 511–525. [Google Scholar] [CrossRef]
- Manevski, N.; Umehara, K.; Parrott, N. Drug Design and Success of Prospective Mouse In Vitro-In Vivo Extrapolation (IVIVE) for Predictions of Plasma Clearance (CLp) from Hepatocyte Intrinsic Clearance (CLint). Mol. Pharm. 2023, 20, 3438–3459. [Google Scholar] [CrossRef]
- Löfgren, S.; Hagbjörk, A.L.; Ekman, S.; Fransson-Steen, R.; Terelius, Y. Metabolism of human cytochrome P450 marker substrates in mouse: A strain and gender comparison. Xenobiotica 2004, 34, 811–834. [Google Scholar] [CrossRef]
- Davies, B.; Morris, T. Physiological parameters in laboratory animals and humans. Pharm. Res. 1993, 10, 1093–1095. [Google Scholar] [CrossRef] [PubMed]
- Gibson, C.R.; Gleason, A.; Messina, E. Measurement of total liver blood flow in intact anesthetized rats using ultrasound imaging. Pharmacol. Res. Perspect. 2021, 9, e00731. [Google Scholar] [CrossRef]
- Gleeson, M.P. Generation of a set of simple, interpretable ADMET rules of thumb. J. Med. Chem. 2008, 51, 817–834. [Google Scholar] [CrossRef] [PubMed]
- Winiwarter, S.; Chang, G.; Desai, P.; Menzel, K.; Faller, B.; Arimoto, R.; Keefer, C.; Broccatell, F. Prediction of Fraction Unbound in Microsomal and Hepatocyte Incubations: A Comparison of Methods across Industry Datasets. Mol. Pharm. 2019, 16, 4077–4085. [Google Scholar] [CrossRef] [PubMed]
- Summerfield, S.G.; Yates, J.W.T.; Fairman, D.A. Free Drug Theory—No Longer Just a Hypothesis? Pharm. Res. 2022, 39, 213–222. [Google Scholar] [CrossRef]
- Obach, R.S. Nonspecific binding to microsomes: Impact on scale-up of in vitro intrinsic clearance to hepatic clearance as assessed through examination of warfarin, imipramine, and propranolol. Drug Metab. Dispos. 1997, 25, 1359–1369. [Google Scholar]
- Tang, H.; Hussain, A.; Leal, M.; Mayersohn, M.; Fluhler, E. Interspecies prediction of human drug clearance based on scaling data from one or two animal species. Drug Metab. Dispos. 2007, 35, 1886–1893. [Google Scholar] [CrossRef]


| Ion Class 1/Ro5 | No. | fu,mic | Microsomes Recovery (%) | Kilford fu,mic | fu,hep | Hepatocytes Recovery (%) | Kilford fu,hep |
|---|---|---|---|---|---|---|---|
| All Ro5 | 127 | 0.42 ± 0.30 | 74 ± 20 | 0.90 ± 0.03 | 0.85 ± 0.16 | 82 ± 48 | 0.97 ± 0.01 |
| All bRo5 | 84 | 0.18 ± 0.21 | 61 ± 12 | 0.87 ± 0.03 | 0.47 ± 0.32 | 46 ± 30 | 0.96 ± 0.01 |
| N Ro5 | 103 | 0.42 ± 0.30 | 74 ± 20 | 0.89 ± 0.02 | 0.86 ± 0.14 | 81 ± 45 | 0.97 ± 0.01 |
| N bRo5 | 45 | 0.26 ± 0.23 | 62 ± 9 | 0.88 ± 0.02 | 0.56 ± 0.31 | 50 ± 27 | 0.97 ± 0.01 |
| B Ro5 | 21 | 0.37 ± 0.28 | 68 ± 21 | 0.89 ± 0.03 | 0.79 ± 0.22 | 77 ± 55 | 0.97 ± 0.01 |
| B bRo5 | 38 | 0.07 ± 0.10 | 59 ± 14 | 0.86 ± 0.03 | 0.35 ± 0.29 | 37 ± 25 | 0.96 ± 0.01 |
| Ion Class 1/System/Ro5 | No. | AFE | AAFE | % 2-Fold | % 5-Fold |
|---|---|---|---|---|---|
| All Mic | 211 | 1.0 | 2.2 | 53 | 90 |
| All Hep | 211 | 1.2 | 2.3 | 46 | 88 |
| All Mic Ro5 | 127 | 1.1 | 2.3 | 53 | 87 |
| All Mic bRo5 | 84 | 0.9 | 2.2 | 54 | 94 |
| All Hep Ro5 | 127 | 1.2 | 2.4 | 44 | 87 |
| All Hep bRo5 | 84 | 1.3 | 2.3 | 50 | 89 |
| N Mic Ro5 | 103 | 1.1 | 2.2 | 53 | 90 |
| N Mic bRo5 | 45 | 0.8 | 2.1 | 53 | 100 |
| N Hep Ro5 | 103 | 1.2 | 2.3 | 43 | 89 |
| N Hep bRo5 | 45 | 1.1 | 2.2 | 58 | 89 |
| B Mic Ro5 | 21 | 1.1 | 2.5 | 52 | 81 |
| B Mic bRo5 | 38 | 0.9 | 2.3 | 55 | 87 |
| B Hep Ro5 | 21 | 1.5 | 2.5 | 57 | 81 |
| B Hep bRo5 | 38 | 1.4 | 2.5 | 39 | 89 |
| Ion Class 1/System/Ro5 | No. | AFE | AAFE | % 2-Fold | % 5-Fold |
|---|---|---|---|---|---|
| All Mic | 211 | 3.4 | 4.3 | 35 | 61 |
| All Hep | 211 | 1.8 | 2.8 | 38 | 80 |
| All Mic Ro5 | 127 | 2.3 | 3.3 | 40 | 69 |
| All Mic bRo5 | 84 | 6.0 | 6.5 | 26 | 50 |
| All Hep Ro5 | 127 | 1.3 | 2.5 | 43 | 86 |
| All Hep bRo5 | 84 | 2.7 | 3.5 | 32 | 71 |
| N Mic Ro5 | 103 | 2.3 | 3.2 | 42 | 72 |
| N Mic bRo5 | 45 | 3.5 | 4.1 | 40 | 67 |
| N Hep Ro5 | 103 | 1.3 | 2.4 | 43 | 88 |
| N Hep bRo5 | 45 | 2.1 | 3.4 | 47 | 73 |
| B Mic Ro5 | 21 | 2.8 | 3.7 | 33 | 57 |
| B Mic bRo5 | 38 | 11.2 | 11.5 | 11 | 29 |
| B Hep Ro5 | 21 | 1.7 | 2.6 | 48 | 76 |
| B Hep bRo5 | 38 | 3.9 | 4.2 | 13 | 68 |
Disclaimer/Publisher’s Note: The statements, opinions and data contained in all publications are solely those of the individual author(s) and contributor(s) and not of MDPI and/or the editor(s). MDPI and/or the editor(s) disclaim responsibility for any injury to people or property resulting from any ideas, methods, instructions or products referred to in the content. |
© 2025 by the authors. Licensee MDPI, Basel, Switzerland. This article is an open access article distributed under the terms and conditions of the Creative Commons Attribution (CC BY) license (https://creativecommons.org/licenses/by/4.0/).
Share and Cite
Maurer, C.K.; Fang, Z.; Duevel, H.M.; Harlfinger, S.; Petersson, C. Beyond-Rule-of-Five Compounds Are Not Different: In Vitro–In Vivo Extrapolation of Female CD-1 Mouse Clearance Based on Merck Healthcare KGaA Compound Set. Pharmaceuticals 2025, 18, 568. https://doi.org/10.3390/ph18040568
Maurer CK, Fang Z, Duevel HM, Harlfinger S, Petersson C. Beyond-Rule-of-Five Compounds Are Not Different: In Vitro–In Vivo Extrapolation of Female CD-1 Mouse Clearance Based on Merck Healthcare KGaA Compound Set. Pharmaceuticals. 2025; 18(4):568. https://doi.org/10.3390/ph18040568
Chicago/Turabian StyleMaurer, Christine K., Zhizhou Fang, Heide M. Duevel, Stephanie Harlfinger, and Carl Petersson. 2025. "Beyond-Rule-of-Five Compounds Are Not Different: In Vitro–In Vivo Extrapolation of Female CD-1 Mouse Clearance Based on Merck Healthcare KGaA Compound Set" Pharmaceuticals 18, no. 4: 568. https://doi.org/10.3390/ph18040568
APA StyleMaurer, C. K., Fang, Z., Duevel, H. M., Harlfinger, S., & Petersson, C. (2025). Beyond-Rule-of-Five Compounds Are Not Different: In Vitro–In Vivo Extrapolation of Female CD-1 Mouse Clearance Based on Merck Healthcare KGaA Compound Set. Pharmaceuticals, 18(4), 568. https://doi.org/10.3390/ph18040568