Article

Novel Histone Deacetylase (HDAC) Inhibitor Induces Apoptosis and Suppresses Invasion via E-Cadherin Upregulation in Pancreatic Ductal Adenocarcinoma (PDAC)

1
Institute of Pharmaceutical Biology and Biotechnology, Heinrich-Heine-University Düsseldorf, Universitätsstr. 1, 40225 Düsseldorf, Germany
2
Institute of Pharmaceutical and Medicinal Chemistry, Heinrich-Heine-University Düsseldorf, Universitätsstr. 1, 40225 Düsseldorf, Germany
*
Authors to whom correspondence should be addressed.
These authors contributed equally to this work.
Pharmaceuticals 2024, 17(6), 752; https://doi.org/10.3390/ph17060752
Submission received: 22 March 2024 / Revised: 31 May 2024 / Accepted: 4 June 2024 / Published: 7 June 2024

Abstract

:
Pancreatic ductal adenocarcinoma (PDAC) is the most lethal form of pancreatic cancer characterized by therapy resistance and early metastasis, resulting in a low survival rate. Histone deacetylase (HDAC) inhibitors showed potential for the treatment of hematological malignancies. In PDAC, the overexpression of HDAC 2 is associated with the epithelial–mesenchymal transition (EMT), principally accompanied by the downregulation of the epithelial marker E-cadherin and increased metastatic capacity. The effector cytokine transforming growth factor-β (TGF β) is known to be a major inducer of the EMT in PDAC, leading to high metastatic and invasive potential. In addition, the overexpression of HDAC 6 in PDAC is associated with reduced apoptosis. Here, we have demonstrated that a novel HDAC 2/6 inhibitor not only significantly increased E-cadherin expression in PANC-1 cells (5.5-fold) and in 3D PDAC co-culture spheroids (2.5-fold) but was also able to reverse the TGF-β-induced downregulation of E-cadherin expression. Moreover, our study indicates that the HDAC inhibitor mediated re-differentiation resulting in a significant inhibition of tumor cell invasion by approximately 60% compared to control. In particular, we have shown that the HDAC inhibitor induces both apoptosis (2-fold) and cell cycle arrest. In conclusion, the HDAC 2/6 inhibitor acts by suppressing invasion via upregulating E-cadherin mediated by HDAC 2 blockade and by inducing cell cycle arrest leading to apoptosis via HDAC 6 inhibition. These results suggest that the HDAC 2/6 inhibitor might represent a novel therapeutic strategy for the treatment of PDAC tumorigenesis and metastasis.

1. Introduction

Pancreatic ductal adenocarcinoma (PDAC) is the most common subtype of pancreatic cancer representing one of the most lethal cancers with a 5-year survival rate of less than 11% [1,2]. PDAC displays a large cellular heterogeneity including a highly fibrotic and immunosuppressive tumor microenvironment (TME) [3]. The PDAC tumor microenvironment, which is characterized by the presence of a heterogenous stroma including pancreatic stellate cells (PSCs), tumor endothelial cells, and a variety of immune cells, is mainly responsible for disease progression [3].
During tumorigenesis, pancreatic stellate cells acquire a myofibroblast-like phenotype referred to as cancer-associated fibroblasts (CAFs), which constitute up to 90% of the TME. CAFs excessively secrete extracellular matrix (ECM) proteins, such as collagens, fibronectins, and hyaluronic acid, culminating in the typical desmoplastic environment. Furthermore, the expression of pro-angiogenic factors such as VEGF and PDGF results in the initiation of angiogenesis [4]. Consequently, the creation of atypical multibranched vessels which collapse under the high interstitial pressure of the desmoplastic environment leads to a hypovascular, hypoxic phenotype [5]. Immune cells, including macrophages, T cells, mast cells, and neutrophil granulocytes, infiltrate the desmoplastic stroma and play opposing roles in tumor progression [6]. Inflammatory immune cells, particularly cytotoxic CD8+ T cells, foster tumor cell elimination, whereas tumor-associated macrophages and regulatory T cells (Treg) suppress the activation and proliferation of cytotoxic CD8+ T cells and of natural killer (NK) cells, thereby contributing to an immunosuppressive tumor microenvironment [7]. Hypoxia promotes the suppression of immune cells by inhibiting the proliferation of anti-tumor immune cells such as cytotoxic T cells or NK cells and increasing the polarization of T cells to Treg cells as well as the polarization of macrophages to an immunosuppressive M2 phenotype [8].
Histone deacetylases (HDACs) are enzymes that deacetylate lysine on histones as well as on many other cellular proteins. Histone deacetylation in general results in the blockage of DNA transcription and the subsequent downregulation of distinct target genes. For example, the HDAC-related suppression of genes encoding for pro-apoptotic proteins like Nur77 or BH3-only protein NOXA leads to an increased cell proliferation [9]. In addition to gene transcription regulation via histone modification, HDACs control many cellular processes including cell cycle progression and cell survival by deacetylating a variety of proteins [10]. As one example, p53 was the first target protein discovered whose deacetylation leads to cell cycle progression and resistance to apoptosis. [11].
To date, the 18 known human histone deacetylases can be divided into four distinct groups. Class I HDACs, which include HDAC 1, 2, 3, and 8, are exclusively located within the nucleus except for HDAC8, while class IIa HDACs (comprising HDAC 4, 5, 7, 9) display nuclear and cytoplasmic localization. HDACs 6 and 10 encompass class IIb HDACs, which are exclusively found in the cytoplasm. In contrast, class IV (currently only consisting of HDAC 11) is predominantly located in the nucleus and subdivided from class I based on the large C-terminus. HDACs require Zn2+ for their function. Finally, sirtuins belong to class III HDACs, which require NAD+ [12,13].
Aberrant HDACs appear in many different cancer types including PDAC. Recent studies indicate that HDAC class I, HDAC 6, and HDAC 7 tend to be overexpressed in PDAC tissue. Moreover, a high expression of HDAC 1, 7, and 8 is linked to a negative prognosis [14,15]. Different functions of HDACs in PDAC have been reported. For example, class I HDACs promote the epithelial–mesenchymal transition (EMT), leading to a high metastatic capacity, a hallmark in PDAC. Data in mice and in PDAC patients showed a clear correlation between the expression levels of HDAC1 and HDAC2 and the prevalence for metastasis [16]. Furthermore, class IIa HDACs promote angiogenesis by increasing the transcription of hypoxia-inducible factor 1α (HIF-1α) under hypoxic conditions. Moreover, the overexpression of HDAC6 in PDAC results in the upregulation of c-myc which is directly linked to cell proliferation [17]. However, despite the important role of HDAC in cancer progression, further studies are needed to fully understand the involvement of distinct HDACs in PDAC tumorigenesis.
Pancreatic tumor cells undergo the process of the EMT early in their tumorigenic development, transforming from their original epithelial and immobile state to a mesenchymal, fibroblastoid, and mobilized phenotype, an essential step for tumor invasion, dissemination, and metastasis [18]. One key activator of the EMT is the effector cytokine TGF-β which leads to the increased invasion of tumor cells through the downregulation of the epithelial marker E-cadherin [19]. The downregulation of E-cadherin in PDAC is thought to be associated with the increased activity of HDAC 1 and HDAC 2 [20]. Subsequently, low levels of the E-cadherin protein correlate with an invasive and metastatic phenotype [18]. Specifically, a high expression of HDAC 2 is associated with high metastatic capacity resulting from the downregulation of E-cadherin. Moreover, a high expression of HDAC 6 is linked to resistance against apoptosis [14,16].
The latest European Society of Medical Oncology (ESMO) guidelines recommend primary resection followed by adjuvant chemotherapy with either FOLFIRINOX (leucovorin, 5-FU, irinotecan, and oxaliplatin) or, if not eligible for this treatment, gemcitabine/capecitabine for resectable pancreatic cancer as first-line treatment. In metastatic disease, the standard options for first-line chemotherapy are either FOLFIRINOX or gemcitabine/nab (nanoalbumin)-linked paclitaxel [21,22]. However, due to the limited efficacy of the available non-specific cytotoxic drugs and the advanced stage of the disease at the time of diagnosis, with more than 80% of patients already diagnosed with an unresectable or metastatic stage, there is a high unmet medical need for new PDAC treatment strategies [23,24].
HDAC inhibition has lately gained significant attention in cancer drug discovery and development. For instance, the inaugural FDA-approved HDAC inhibitor vorinostat, also known as suberoylanilide hydroxamic acid (SAHA) [19,25], is employed in cutaneous T-cell lymphoma treatment [26]. Although HDAC inhibitors such as vorinostat and panbinostat and class I-specific HDAC entinostat have been investigated for PDAC treatment, they have failed in the latest phase 2 trials due to missing efficacies as monotherapies [20,27]. Additionally, unfavorable side effect profiles of pan-inhibitors arise from HDAC isoenzymes possessing toxic effects on non-tumor cells, mainly through the inhibition of HDAC 1, 2, and 3 leading to the dose limitation of pan-HDAC inhibitors [9].
In contrast to the first generation pan-HDACi-like panobiostat, KSK64 (1i) exhibits a refined HDAC isozyme profile with a preference towards class I HDACs (especially HDAC 1, 2) and HDAC6 [28]. This HDAC class I/HDAC6 isozyme profile is presumably the result of the large substituted quinoline Cap group in connection with the novel alkoxyurea moiety (Figure 1).
However, the N-O bond of the alkoxyurea structure in KSK64 (1i) could represent a metabolic weak point. Therefore, we decided to synthesize and investigate its carba analogue MPK544 (Scheme 1). This involved the development of a synthetic strategy for MPK544 exhibiting a urea connecting unit (CU) and its anticancer property evaluation towards PANC-1 cells.
We here describe the new HDAC inhibitor MPK544 which was designed based on a pharmacophore model of HDAC class I and IIb inhibitors. The inhibitor contains a substituted quinoline cap group, a urea connecting unit, an alkyl linker, and a hydroxamic acid ZBG. HDAC class I and IIb inhibitors not only target histone proteins within their nuclear complexes by inhibiting HDACs 1–3 but also modulate various cytosolic cancer targets through the inhibition of HDAC 6.
In summary, we demonstrate that our novel HDAC inhibitor MPK544 exhibits slightly higher cytotoxicity in PANC-1 cells compared to the HDAC 1, 2, 3, and 6 inhibitor vorinostat and comparable efficacy in 3D PDAC spheroid models [29]. Notably, MPK544 shows a significant reduction in invading a matrigel matrix through the upregulation of the epithelial marker E-cadherin in both PANC-1 cells alone as well as in 3D co-culture spheroids. Overall, our findings provide evidence that HDAC 2/6 inhibitors warrant further investigation as possible novel therapeutic strategies for PDAC treatment.

2. Results

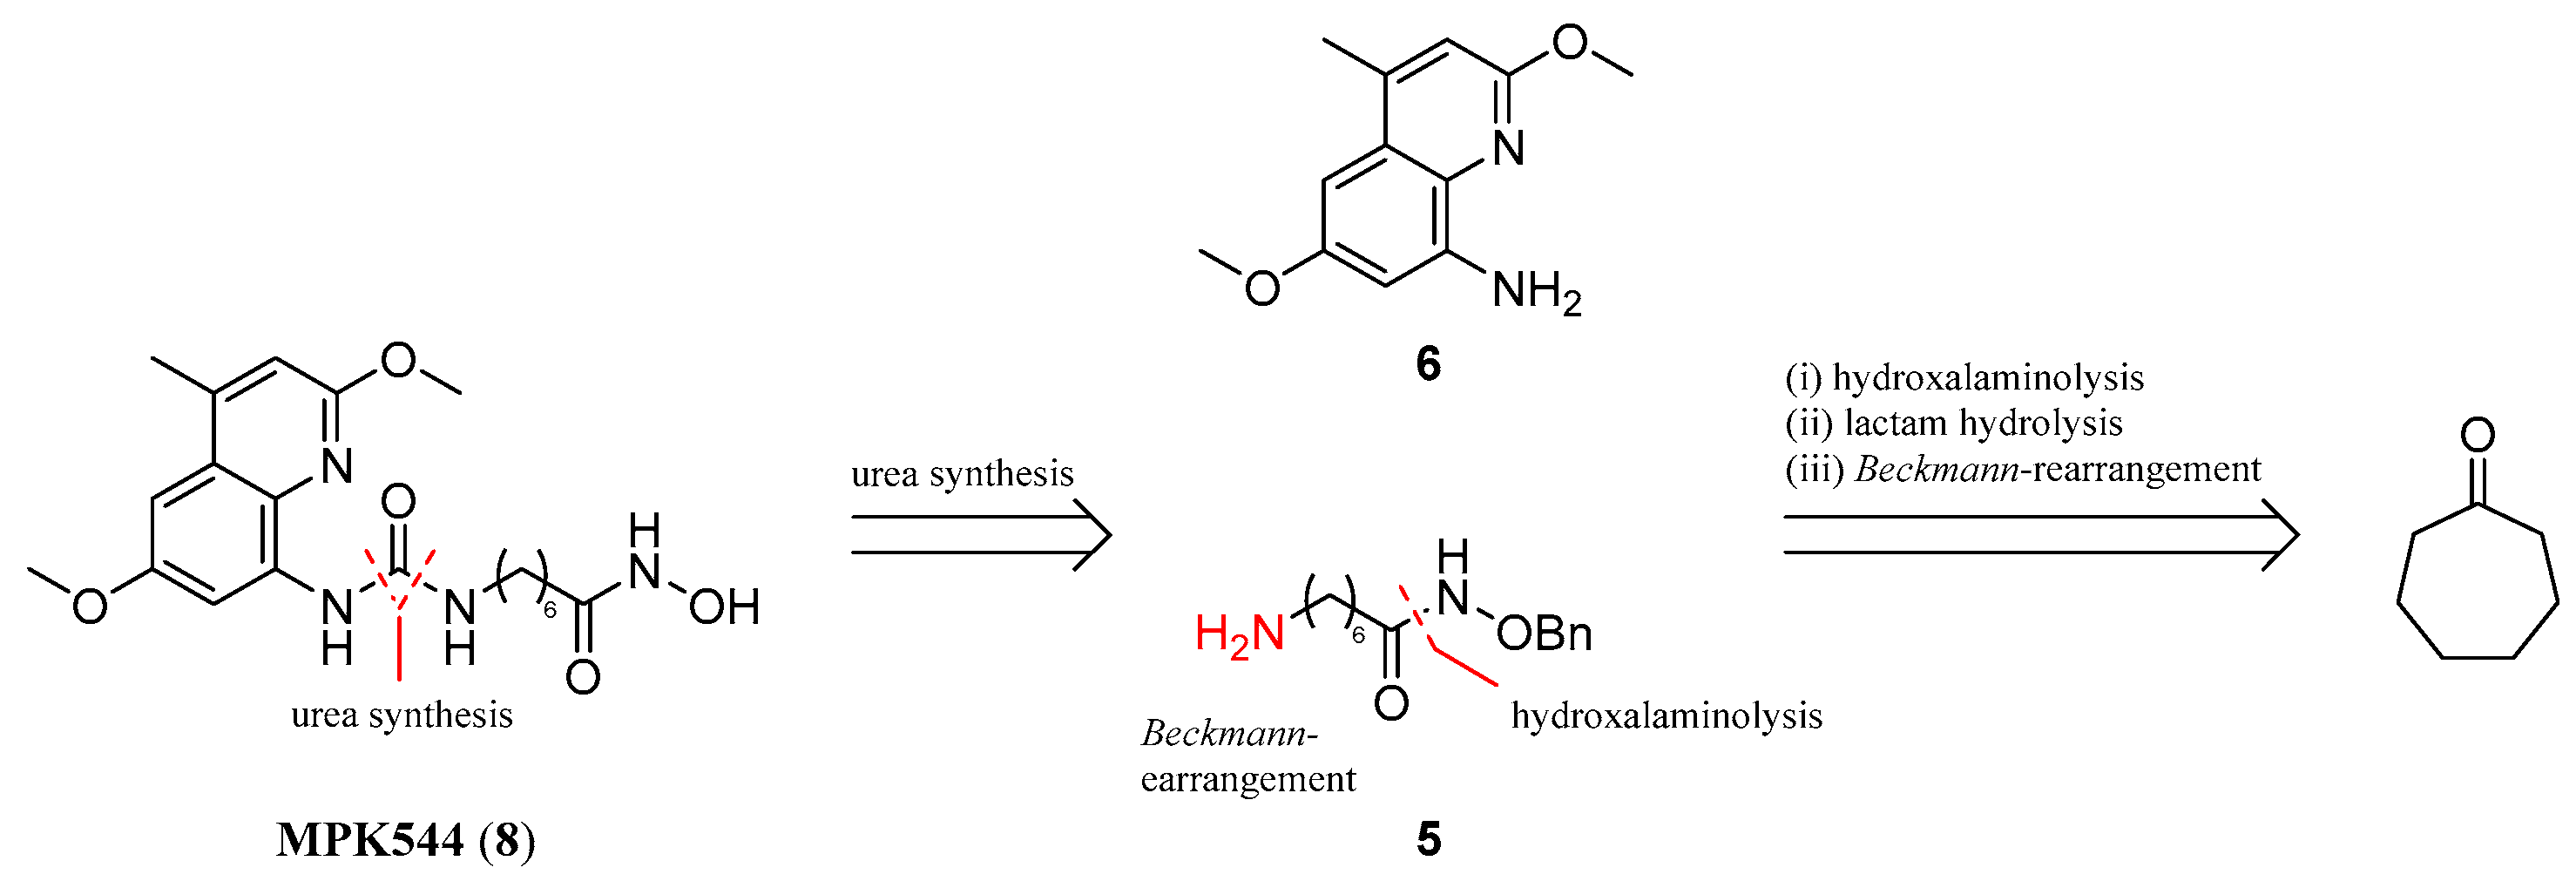
In this study, we have synthesized a novel carba analogue of KSK64 featuring a urea component as the CU, which resulted in the discovery of MPK544. The synthetic approach was guided by a detailed retrosynthetic analysis, breaking down the target molecule into readily commercially available synthetic precursors (Scheme 2). The urea derivative was disconnected into the amino-quinoline 7 and the 7-aminoheptanoic alkoxyamide derivative 8. Our focus was on the efficient synthesis of the latter, which is a key building block for the target molecule. Our retrosynthetic strategy identified a critical path involving the synthesis of 7-amino-N-(benzyloxy)heptanamide 5. This compound can be further derived from cycloheptanone by a Beckmann rearrangement. Our approach provides a reliable route to the alkoxyamide precursor, which is essential for the synthesis of the targeted urea derivative.
The successful implementation of this synthetic pathway, along with a detailed retrosynthetic analysis, underscores the viability of the synthetic method for producing novel KSK64 derivatives with potent anticancer activity.
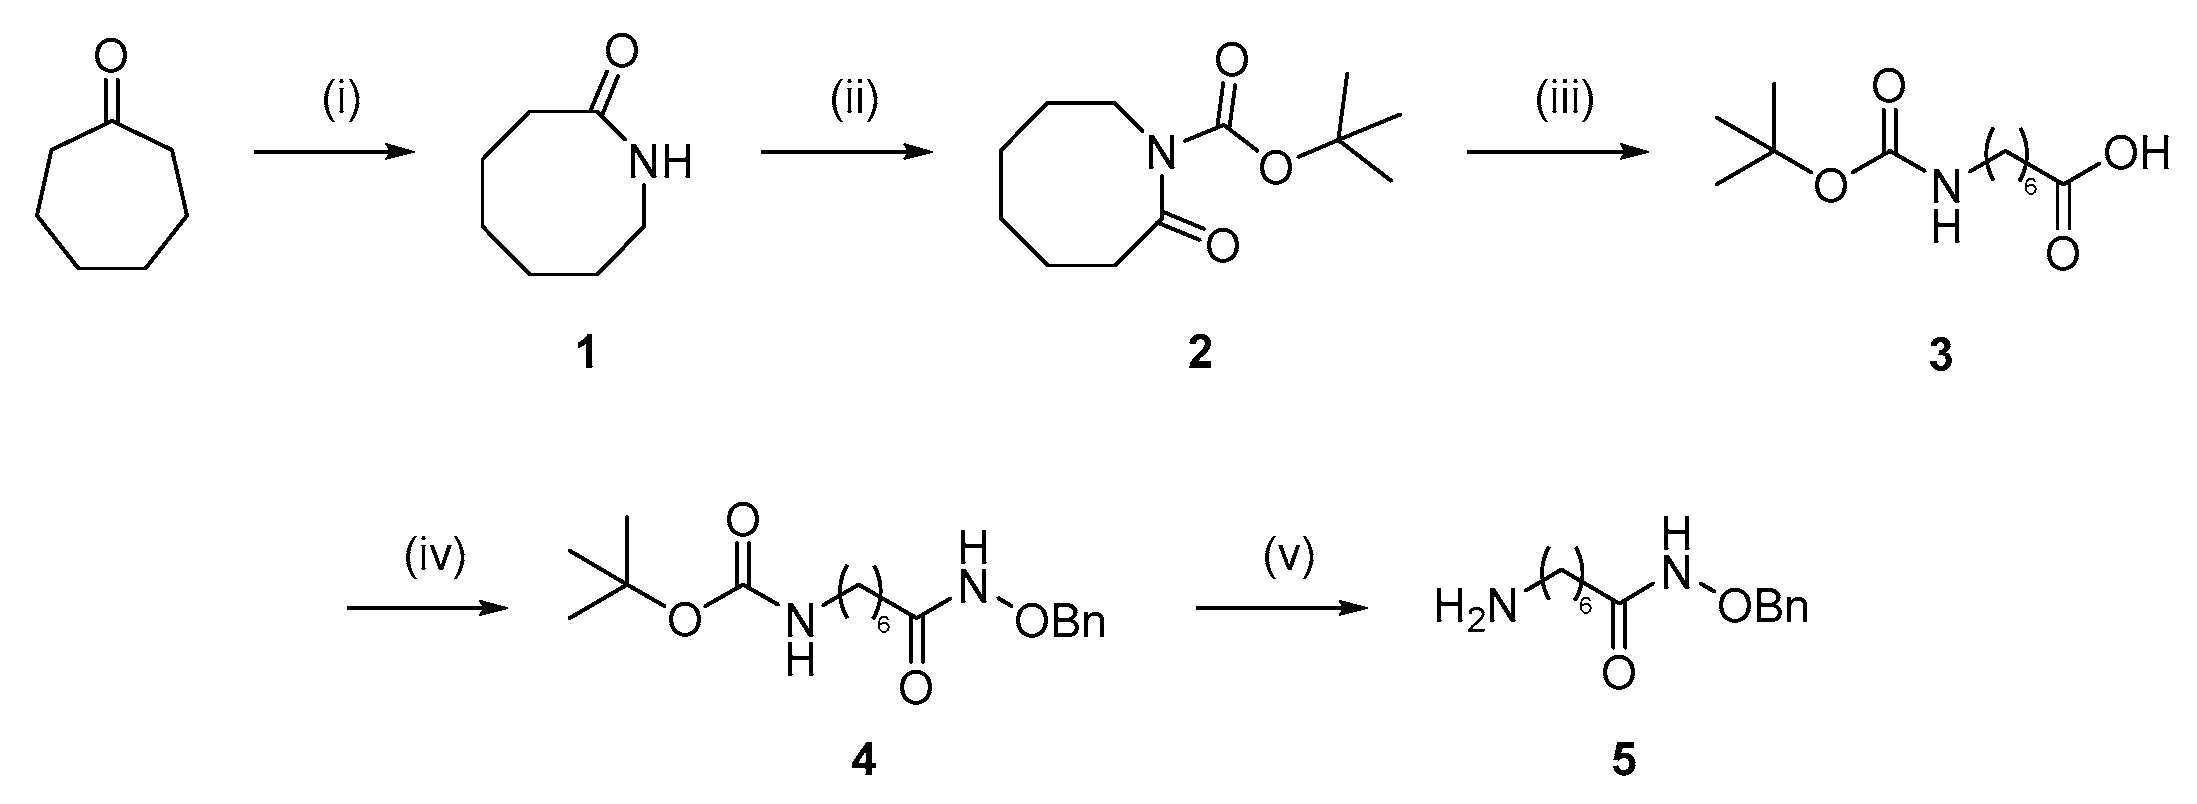
Starting from cycloheptanone, a ring expansion was realized by a Beckmann rearrangement (Scheme 3), followed by an N-Boc protection of the resulting lactam 2. The N-Boc-protected lactam 2 was, subsequently, hydrolyzed under basic conditions to obtain the N-Boc-protected amino acid 3. Via a HATU-mediated acylation, 3 was coupled to O-benzyl hydroxylamine to obtain 4. The synthesis of the linker was completed by the Boc deprotection of 4, yielding 5.
Afterwards, 5 and the 8-aminoquinoline derivative 6 were used for the synthesis of the urea 7, in the presence of triphosgene (Scheme 4). Finally, the O-benzyl-protected hydroxamic acid precursor 7 was deprotected by catalytic hydrogenation to obtain the hydroxamic acid MPK544 (8).
A cytotoxicity screen of a library of 30 novel HDAC inhibitors against the PDAC cell line PANC-1 revealed MPK544 as the most potent candidate. The cytotoxic efficacy of MPK544 was evaluated after 72 h in both primary pancreatic stellate cells (PSCs) and in PANC-1 cells, as well as in 3D co-culture spheroids composed of PANC-1 cells and PSCs. In PANC-1 (IC50 2.95 µM) and PSC cells (IC50 0.68 µM), MPK544 was more cytotoxic than SAHA (Table 1). In the co-culture spheroids (IC50 0.90 µM), the IC50 values of MPK544 and SAHA were comparable (Table 1). In contrast, the specific HDAC 6 inhibitor tubastatin A did not display any cytotoxicity in these models (Table 1). Noteworthily, MPK544 was even more cytotoxic in the reported models than the current PDAC standard therapeutic gemcitabine [30]. With respect to enzyme selectivity, MPK544 showed inhibitory activity against HDAC class I and HDAC 6 (Table 2). In comparison, SAHA was described to inhibit HDAC 1, 2, 3, and 6 [29].
The process of the epithelial–mesenchymal transition (EMT) is a critical step for tumor invasion and metastasis [18]. The characteristic suppression of the epithelial marker protein E-cadherin, controlled through HDAC 2 and HDAC 1 activity, is accompanied with a highly metastatic and invasive phenotype in PDAC [31,32]. The analysis of E-cadherin expression in PANC-1 cells via qPCR (Figure 2A) and Western blot (Figure 2B,C) after treatment with MPK544, SAHA, or tubastatin A revealed that MPK544 increased E-cadherin mRNA levels by 3-fold at a concentration of 1 µM and by 5-fold at 4 µM after 24 h (Figure 2A). After 72 h, compared to SAHA (2-fold), 1 µM MPK544 induced a 3-fold induction of E-cadherin mRNA levels, whereas treatment with 10 µM tubastatin A did not significantly change E-cadherin mRNA levels in PANC-1 cells (Supplementary Figure S1A). Furthermore, in terms of protein levels, a 5-fold increase in E-cadherin protein expression was observed in the presence of 4 µM MPK544 after 24 h of incubation (Figure 2B,C). After 72 h treatment with 1 µM MPK544 (2.2-fold) or SAHA (4-fold) and 4 µM MPK544 (2.4-fold) or SAHA (6.9-fold), it resulted in a significant protein upregulation of E-cadherin, respectively (Supplementary Figure S1B,C). Again, tubastatin A did not influence E-cadherin protein expression up to a concentration of 10 µM.
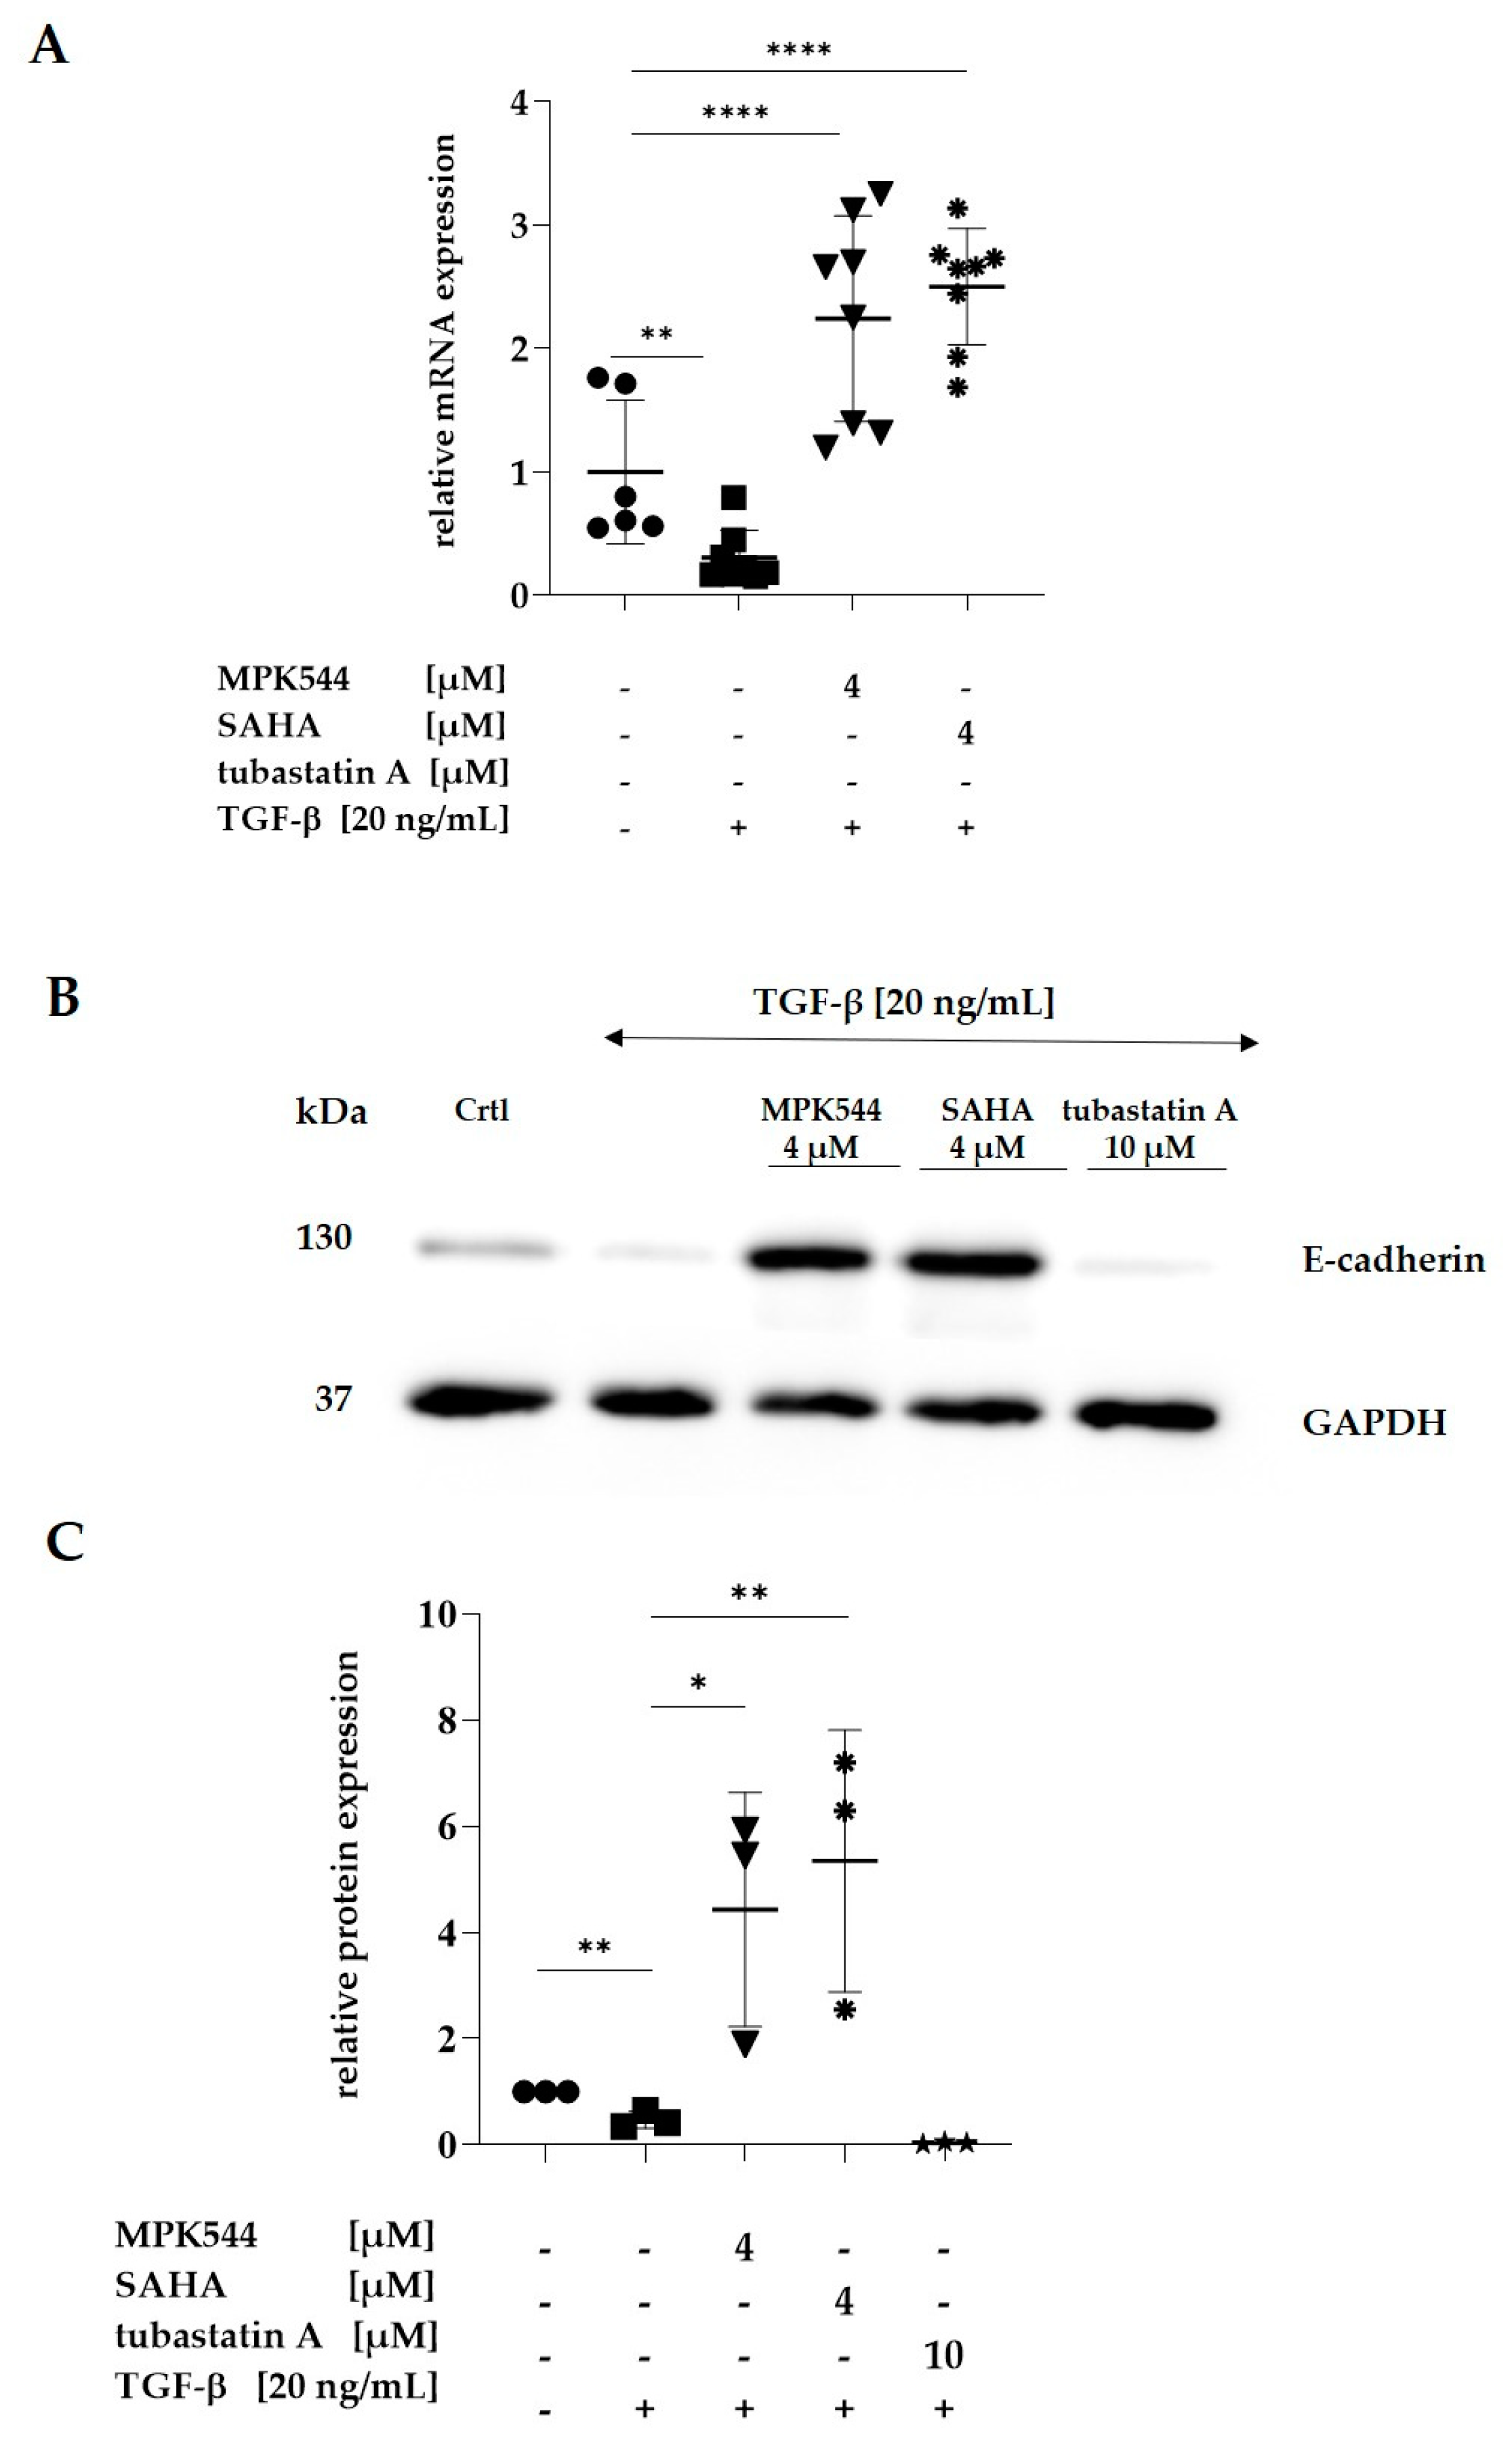
The effector cytokine TGF-β has been identified as a key inducer of the EMT [33]. The TGF-β-induced EMT results in enhanced migratory and invasive properties of PDAC tumor cells, leading to a lower survival rate in patients [34,35,36]. Thus, PANC-1 cells were incubated with TGF-β in combination with MPK544, SAHA, or tubastatin A for 72 h, respectively. As expected, TGF-β significantly lowered both E-cadherin mRNA levels as well as E-cadherin protein expression compared to control (Figure 3). Co-treatment with 4 µM MPK544 resulted in a significant increase in E-cadherin mRNA levels of 7.3-fold (Figure 3A) and of 8.6-fold in the protein level (Figure 3B,C). Co-treatment with 4 µM SAHA resulted in an 8.3-fold upregulation of E-cadherin mRNA levels (Figure 3A), as well as a 10.6-fold increase in the protein level (Figure 3B,C). In line with our previous results, treatment with tubastatin A was not able to reverse the TGF-ß-induced downregulation of E-cadherin (Figure 3A–C).
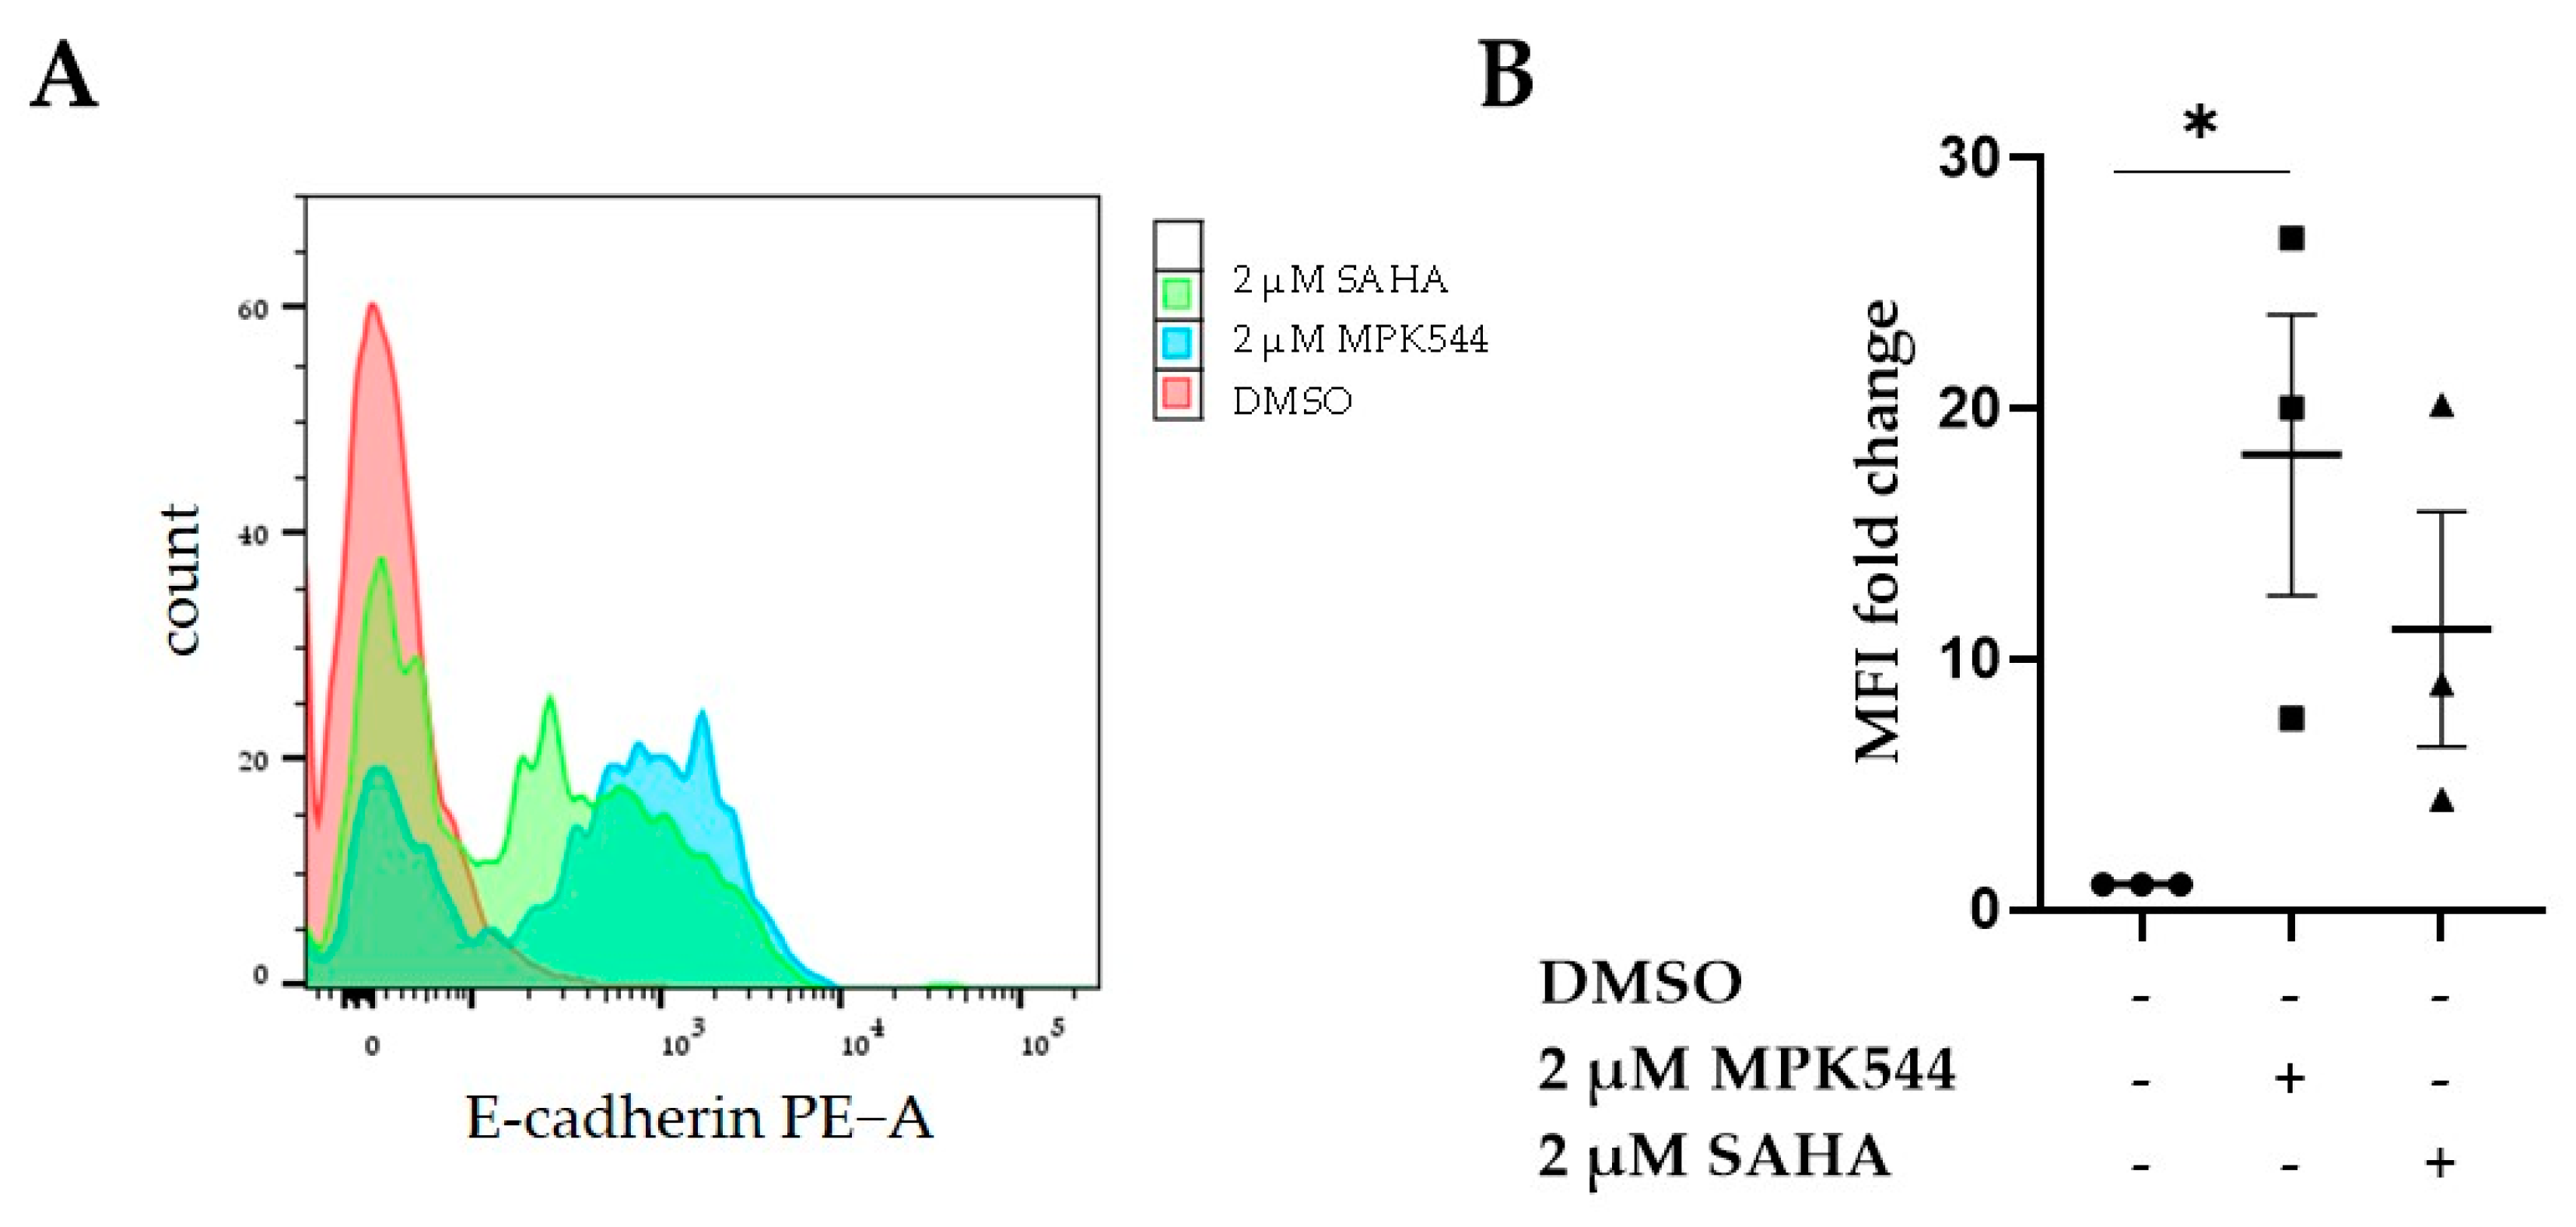
To additionally analyze E-cadherin protein expression in 3D co-culture spheroids, the spheroids were digested after 72 h of treatment with 2 µM SAHA or MPK544. E-cadherin expression was subsequently quantified via flow cytometry. MPK544 treatment significantly upregulated E-cadherin expression in co-culture spheroids (Figure 4A,B). In co-culture spheroids, MPK544 treatment increased E-cadherin expression approximately by 20-fold with 2 µM after 72 h. SAHA treatment increased E-cadherin expression in spheroids, with an 11-fold increase with the 2 µM treatment (Figure 4A,B). Additionally, we also confirmed E-cadherin upregulation by the immunofluorescence staining of whole spheroids after treatment with MPK544 and SAHA compared to the DMSO control (Supplementary Figure S2).
In PDAC, HDAC 2 has been shown to suppress the expression of the epithelial marker E-cadherin, thereby promoting the EMT and migration [14,32]. To study the effect of MPK544 on tumor cell invasion, PANC-1 cells were seeded in a matrigel drop which was surrounded by a second matrigel layer based on a method adapted from Hurley et al. (2017) [37]. The spherical invasion assay enables the chemotaxis-independent observation of cancer cell invasion in contrast to conventional transwell assays. The quantification of the number of cells invading the second matrigel layer revealed that 72 h of treatment with TGF-β increased the number of invading cells by 1.6-fold, while treatment with the subtoxic concentration of 2 µM MPK544 reduced the number of invading cells by 3-fold compared to control (Figure 5).
High expression levels of HDAC 6 have been shown to correlate with resistance to apoptosis [17]. HDAC 2 activity on the other hand regulates cell cycle progression [38]. The commercially available HDAC inhibitors, SAHA and tubastatin A, have been shown to induce apoptosis, as well as cell cycle arrest in the G2/M phase, in different cancer cells, including PANC-1 [39,40,41]. A 48 h treatment with 1 µM MPK544 significantly increased the amount of early apoptotic and dead cells by 2-fold in comparison to 1% DMSO-treated PANC-1 cells (Figure 6B).
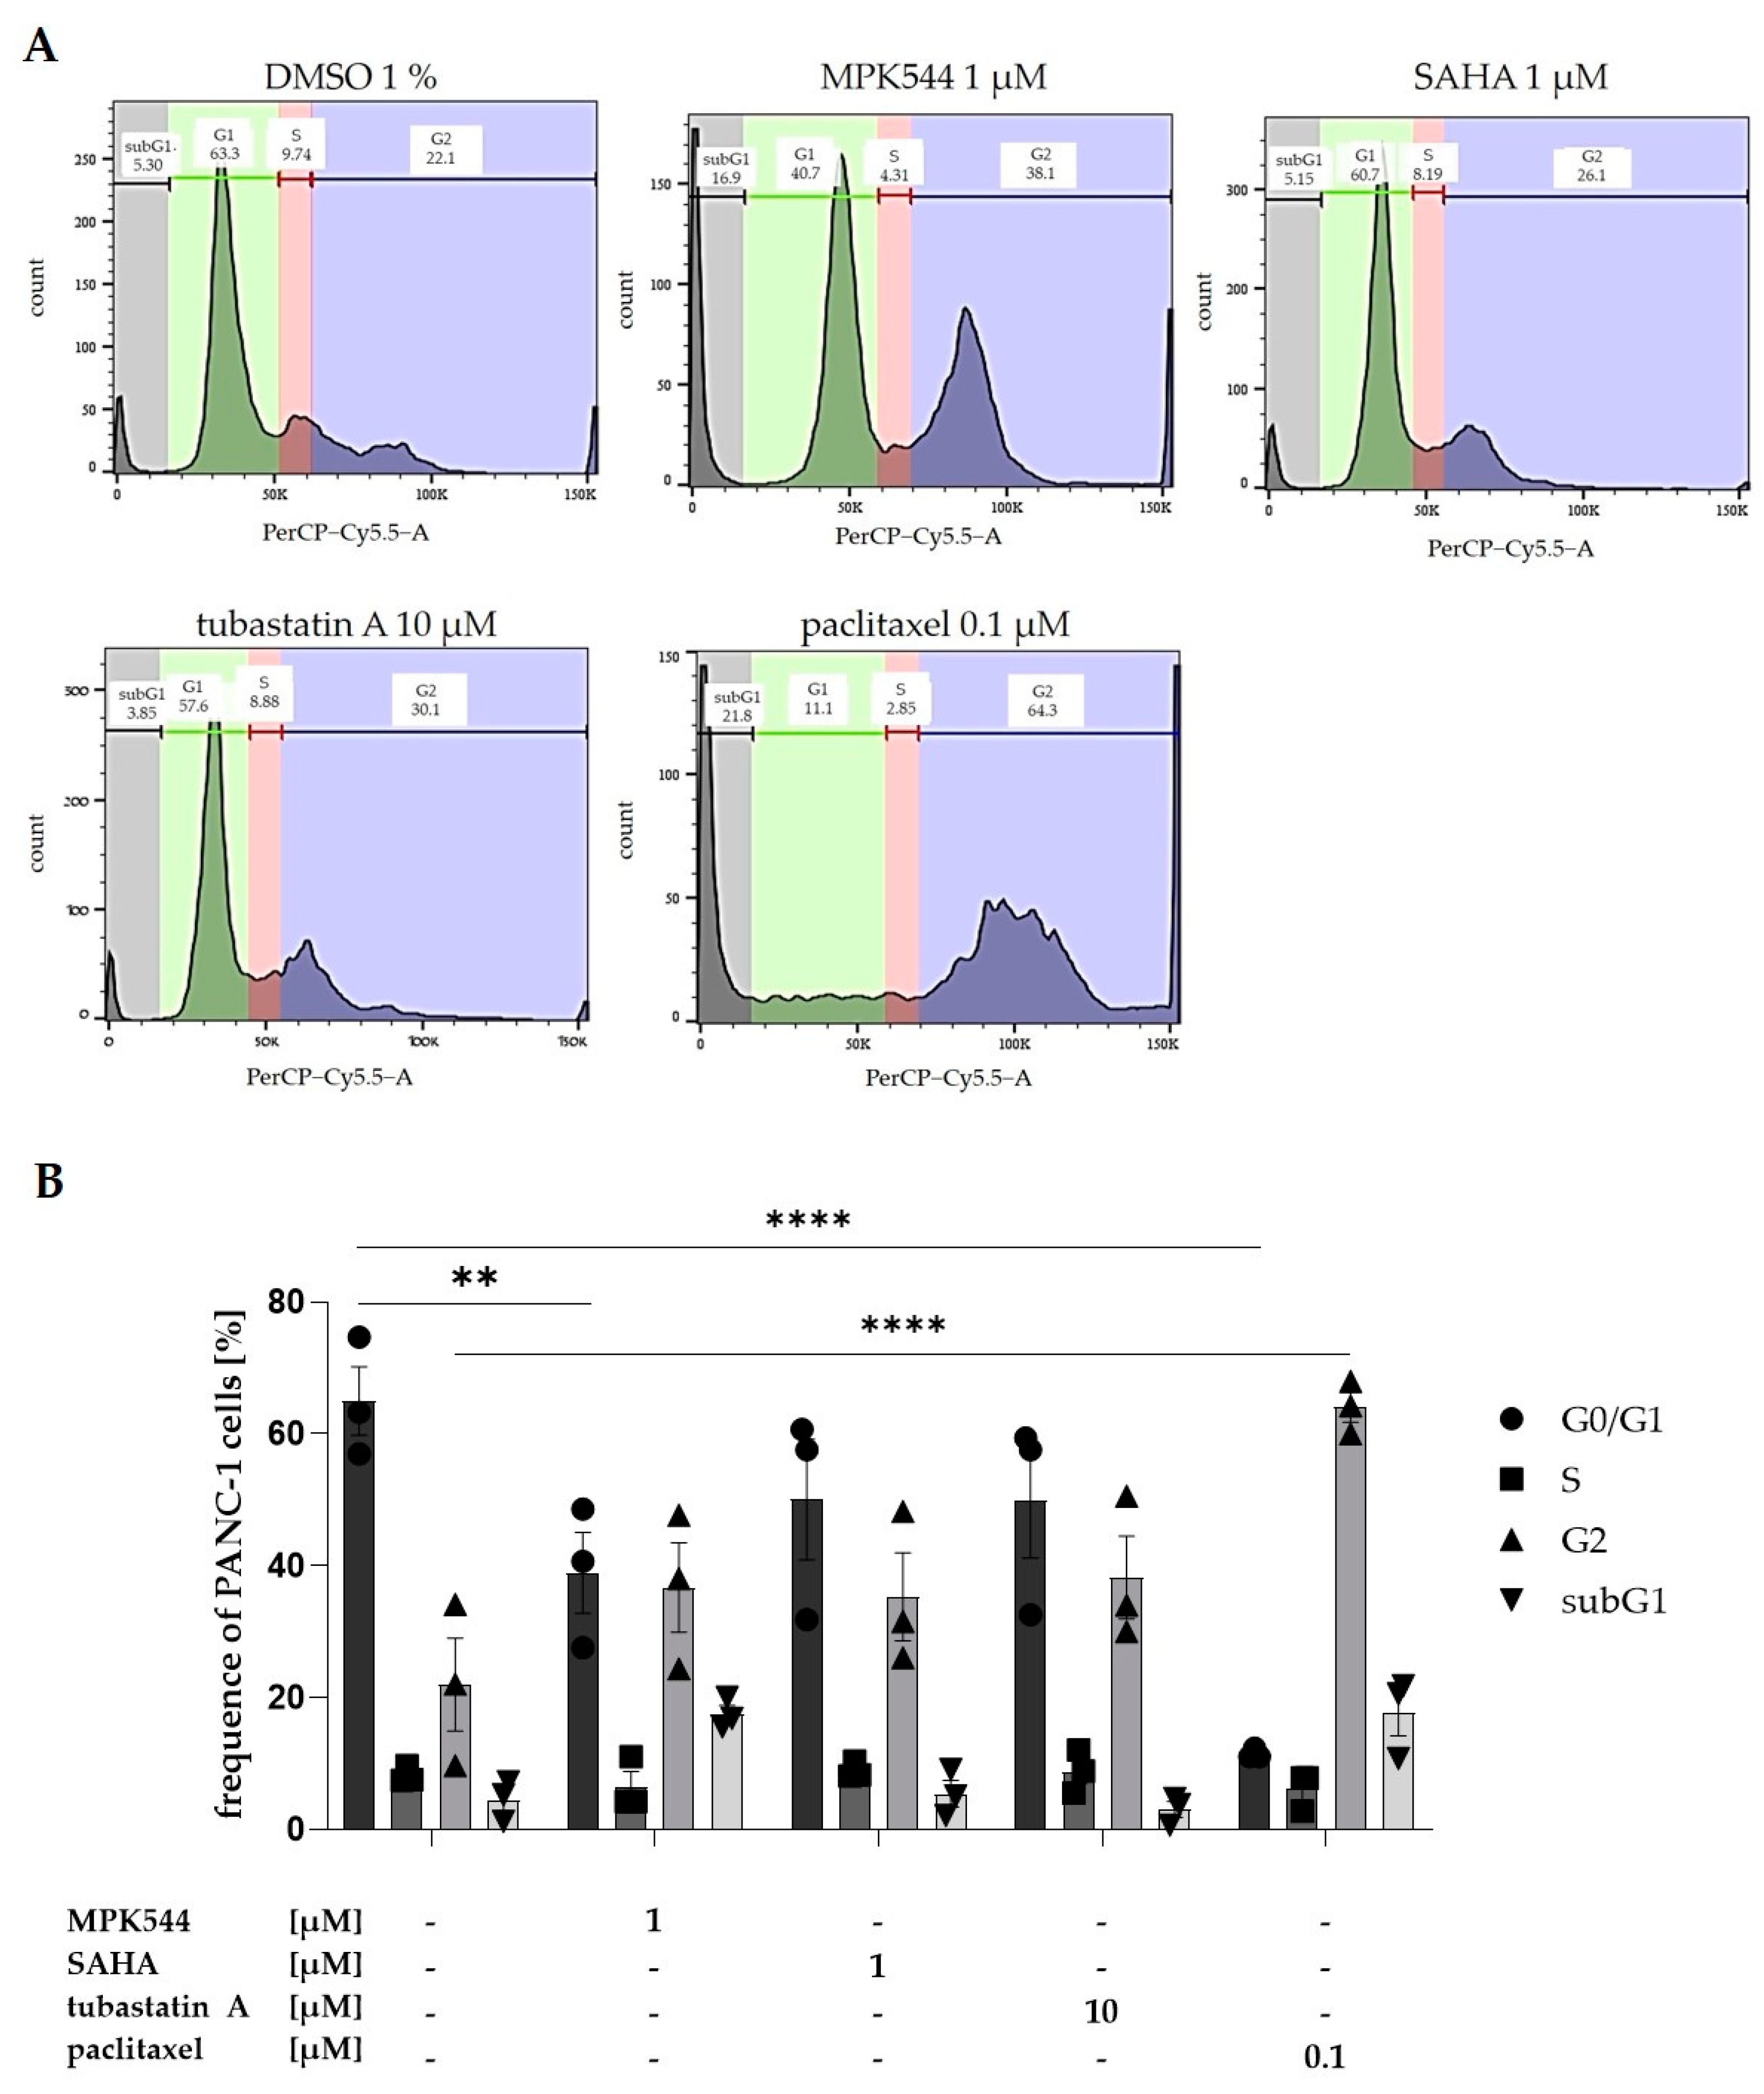
Besides the induction of apoptosis, the influence on the cell cycle of PANC-1 cells after 48 h treatment with 1 µM MPK544, 1µM SAHA, 10 µM tubastatin A, or 0.1 µM paclitaxel was analyzed. MPK544 treatment led to a 1.7-fold reduction in the G1 phase and a 1.6-fold increase in the G2 phase (Figure 7B). Comparable observations were made for the pan-HDAC inhibitor SAHA and the HDAC6 inhibitor tubastatin A, however without achieving significance (Figure 7). Treatment with the tubulin inhibitor paclitaxel induced, as expected, cell cycle arrest in the G2/M phase (Figure 7).
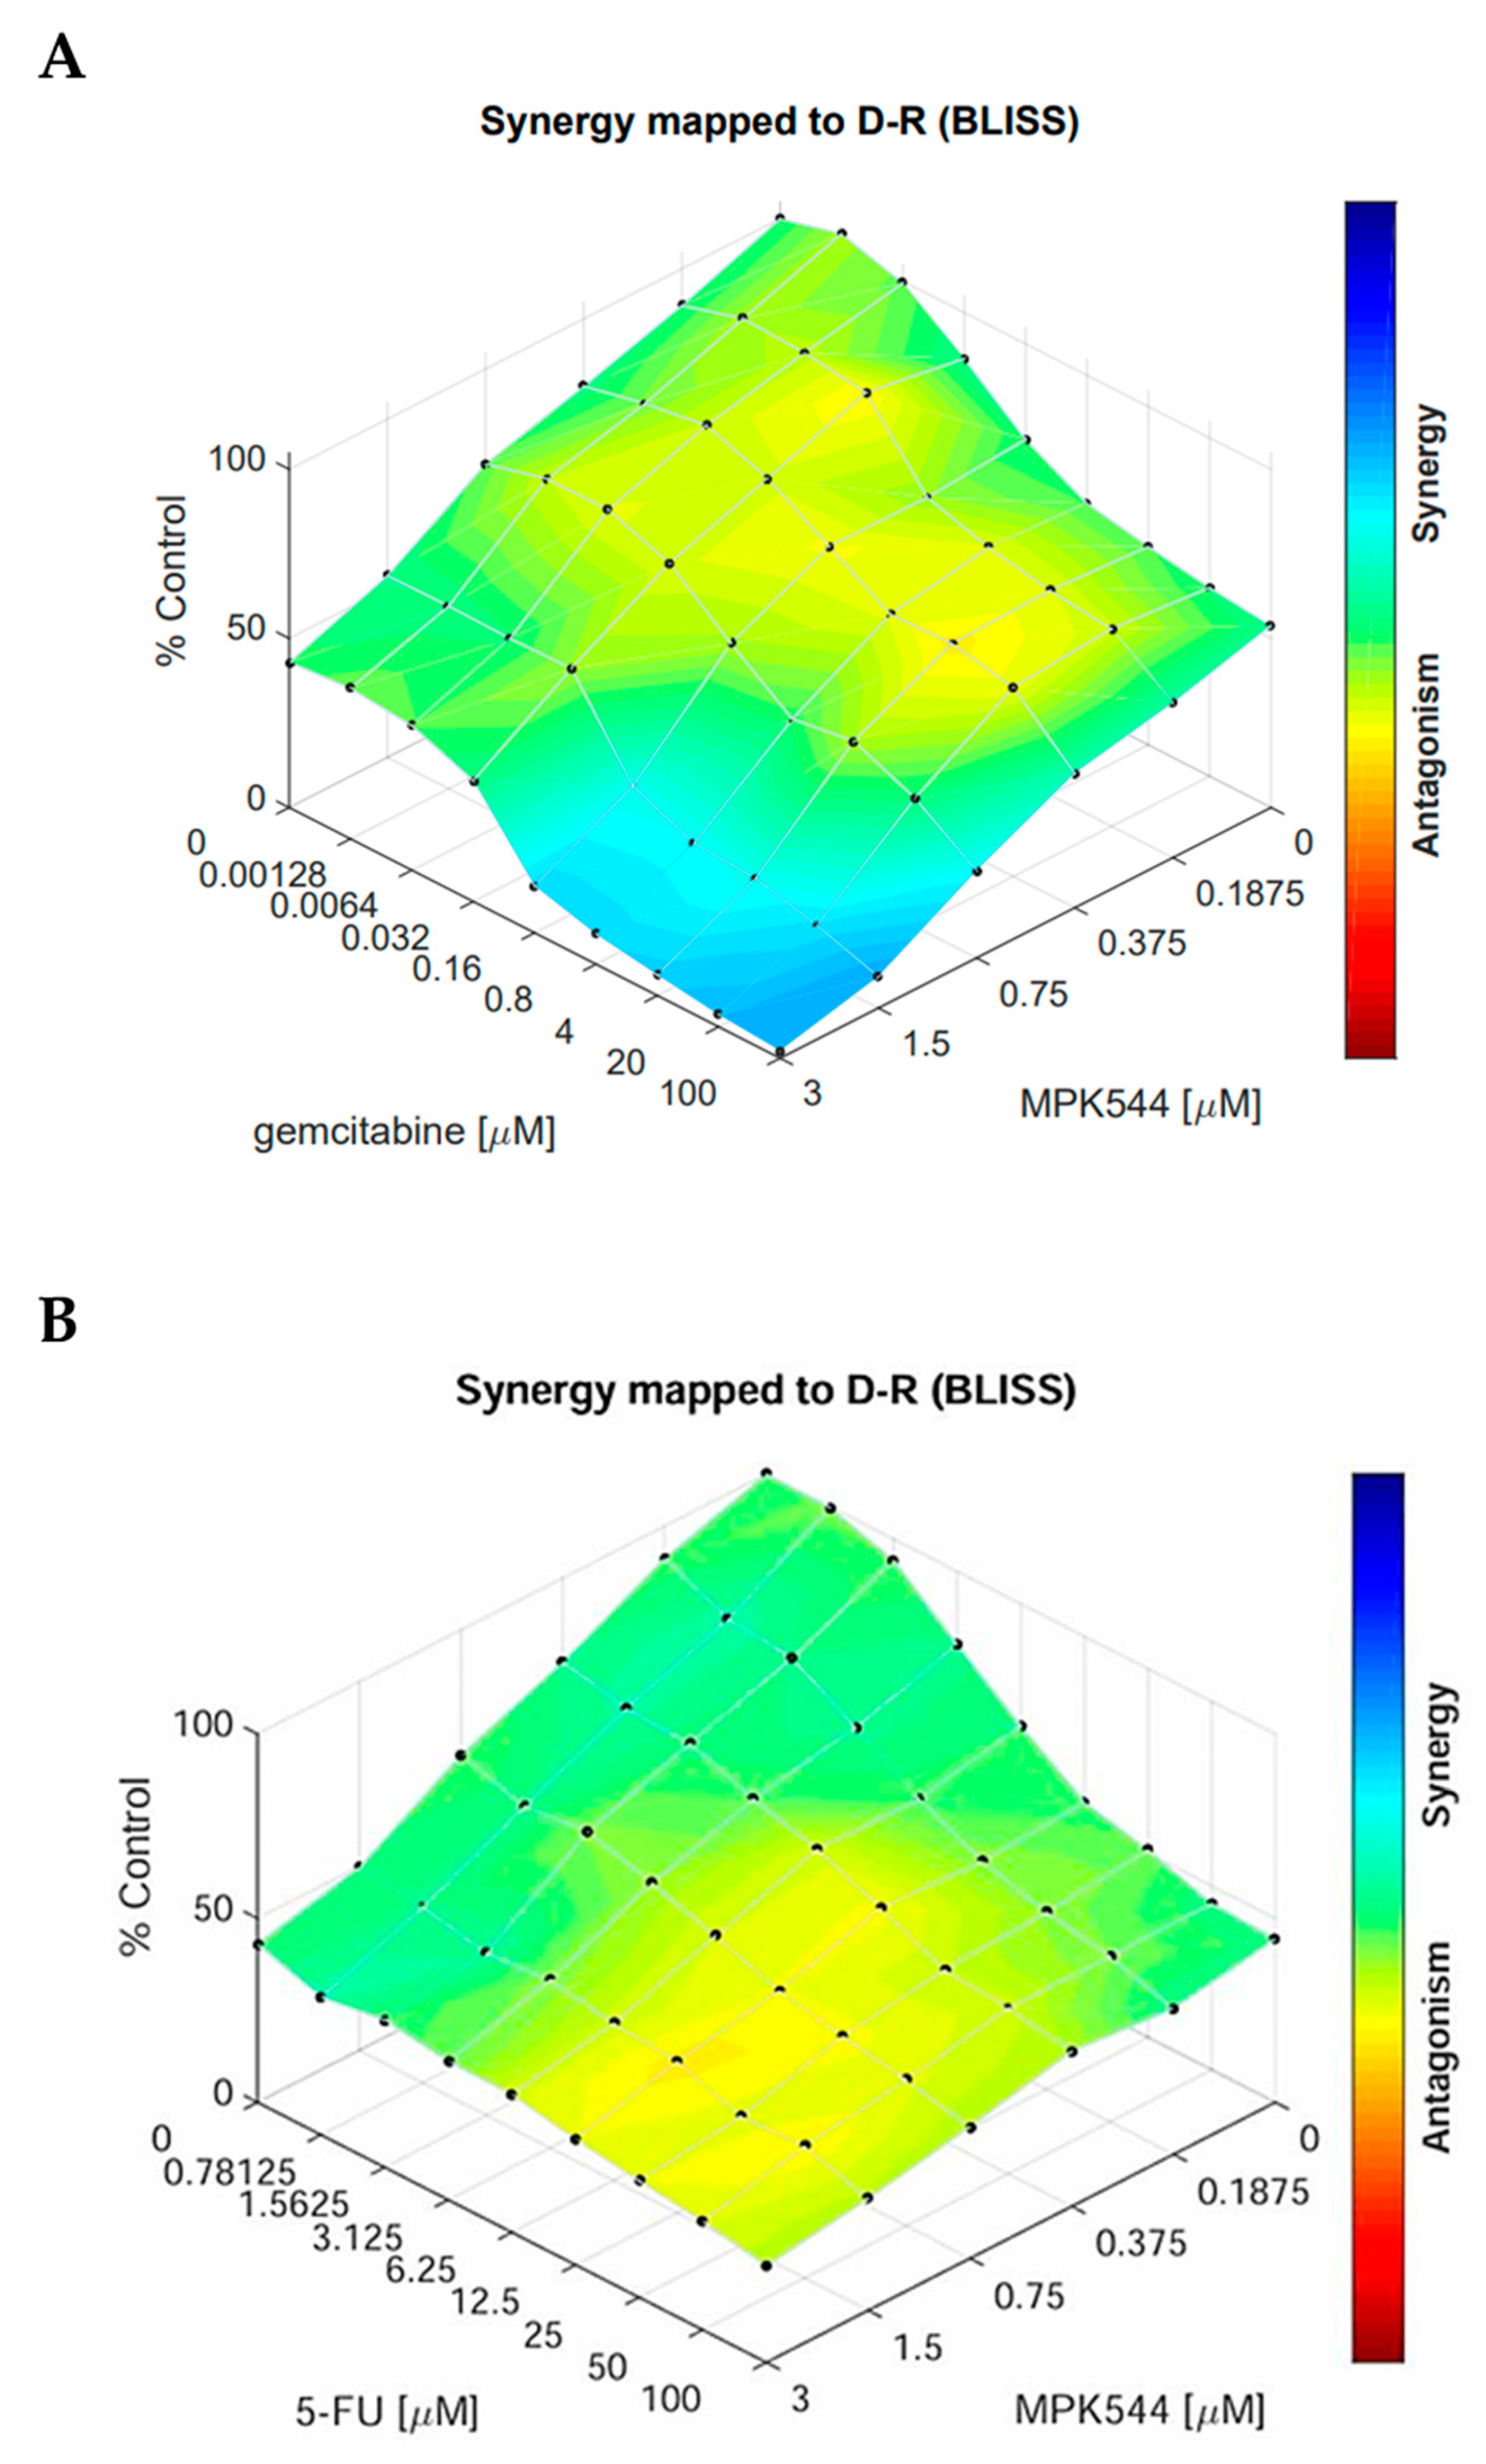
So far, HDACis have failed as monotherapies for solid tumors but have shown the first promising results in combination with chemotherapeutics [42,43]. Therefore, we explored the potential synergism of MPK544 with the chemotherapeutic drugs gemcitabine and 5-fluorouracil (5-FU) in PANC-1 cells. As shown in Figure 8, we screened MPK544 against increasing concentrations of gemcitabine or 5-FU, respectively. Indeed, MPK544 demonstrates a synergistic interaction at concentrations above the IC50 value of gemcitabine (0.17 µM) (Figure 8A). However, for 5-FU, no synergistic interaction with MPK544 could be detected (Figure 8B). Data were generated using the Bliss synergy analysis [44].

3. Discussion

HDAC inhibition has gained a lot of attention in the discovery and development of novel anticancer drugs. For example, the HDACi SAHA has been FDA-approved for the treatment of cutaneous T-cell lymphoma [45,46]. In the treatment of PDAC, multiple HDAC inhibitors have demonstrated anti-tumor efficacy in vivo as well as in mouse models but failed in clinical trials [20,42], presumably indicating that HDACis might not be suitable for monotherapy. For PDAC, HDACis are currently investigated in clinical trials as combination therapies with cytotoxic chemotherapeutics such as gemcitabine [43]. We showed that MPK544 demonstrates a synergistic interaction with gemcitabine in PANC-1 cells. For 5-FU, however, no synergistic interaction with MPK544 was detected. Whether this result can be explained with the selected tumor type or the HDAC inhibitor, selectivity needs to be further explored. In this context, it is worth to mention that a recent study showed a synergistic interaction of 5-FU with the pan-HDACi panobinostat in gastric cancer cell types [47].
Furthermore, we investigated the potential of MPK544 to reverse the mesenchymal phenotype and reduce invasive properties and cell proliferation in PDAC tumor cells. The cytotoxic effect of MPK544 was characterized in comparison to SAHA and the specific HDAC 6 inhibitor tubastatin A. In 2D, MPK544 cytotoxic efficacy was superior to SAHA and tubastatin A. Interestingly, the strongest cytotoxic effect of MPK544 was observed in co-culture spheroids consisting of PSCs and PANC-1 cells. In PDAC, 90% of the solid tumor is composed of PSCs, generating a desmoplastic microenvironment and leading to an increase in stiffness [3]. As shown by Kim et al. (2018), particularly class I HDACs are overexpressed in CAFs, which explains the remarkably robust cytotoxic efficacy of MPK544 [48]. This must be taken into account with regard to possible toxic side effects that may occur due to the inhibition of class I HDACs.
To generate specific HDAC inhibitors, it is crucial to understand the critical HDAC targets responsible for the therapeutic effect in a particular cancer type. Studies have shown that class I HDACs and HDAC 6 are the most important targets for cytotoxic anti-cancer effects in PDAC [14,49,50]. Specifically, HDAC 2 is associated with high metastatic capacity resulting from the downregulation of E-cadherin [14]. Thus, HDAC 2 inhibition might be associated with a reversion of the mesenchymal phenotype of PDAC tumor cells into an epithelial phenotype, thereby reducing metastatic capacity and increasing sensitivity to chemotherapeutics [43,51]. We were able to confirm this potential by showing a significant upregulation of E-cadherin at both mRNA and protein levels after treatment with MPK544. Furthermore, MPK544 showed a concentration-dependent effect that was superior to SAHA at a concentration of 1 µM after 24 h. Furthermore, in co-culture spheroids, treatment with MPK544 led to a significant increase in E-cadherin expression. In contrast, tubastatin A did not induce a significant increase in E-cadherin expression in 2D and 3D models, confirming the hypothesis that HDAC 6 is not involved in the regulation of E-cadherin expression. A key activator of the EMT is the effector cytokine TGF-β which leads to the increased invasion of tumor cells through the downregulation of the epithelial marker E-cadherin [36,52]. Krauß et al. (2022) were able to show that HDAC 2 deactivates the tumor suppressor pathways of TGF-β in PDAC [38]. TGF-β is known to be a potent inducer of the EMT and chemoresistance in PDAC. The most aggressive form of PDAC is classified as a basal-like PDAC which exhibits a TGF-β signature and is enriched in the EMT. Therefore, we investigated whether MPK544 could reverse the TGF-β-induced EMT. MPK544 was able to reverse the TGF-β-induced EMT in PANC-1 cells, indicated by the significant upregulation of E-cadherin at the mRNA and protein level. These results are consistent with the findings of Mishra et al. (2017b) showing that the specific class I HDACis domatinostat (4SC-202), entinostat, and mocetinostat were able to reverse the TGF-β-induced EMT [49].
E-cadherin is a calcium-dependent cell adhesion molecule responsible for cell contraction in epithelial tissues. The upregulation of E-cadherin has been shown to be associated with a reduced metastasis rate and invasion of pancreatic cancer cells mediated by the inhibition of HDAC 2. To investigate the invasion capacity, we established a spherical invasion assay adopted from Hurley et al. (2017) [37]. MPK544 treatment significantly reduced the invasive potential of PANC-1 cells. However, recent studies have revealed that partial EMT (p-EMT) enables the metastasis of circulating tumor cells and is associated with shorter progression-free survival [53,54]. p-EMT may be regulated independently of TGF-β and is therefore fundamentally different from the classical EMT process. In contrast to fully mesenchymal cells, which migrate as individual cells, cells in the p-EMT state migrate in clusters through the vasculature. In future studies, the mechanism by which HDACs regulate p-EMT in PDAC needs to be further investigated.
HDAC inhibition has been shown to affect the cell cycle and induce apoptosis in cancer cells [55]. Our results showed that the inhibition of HDAC 2/6 by MPK544 resulted in a significant induction of apoptosis and cell cycle shift in the G2/M phase. In agreement with the results of Wang et al. (2012), treatment with the HDAC 6-specific inhibitor tubastatin A showed minimal effects on the cell cycle and the induction of apoptosis [50]. These results support the findings of Krauß et al. (2022) who showed that the depletion of HDAC 2 led to cell cycle arrest at the G2/M phase in murine PDAC [38]. HDAC 6 is a unique member of the HDAC family due to its functionality and localization. It is primarily localized in the cytoplasm and has two catalytic deacetylase domains [56]. In addition, HDAC 6 has been reported to interact with a wide range of different proteins such as α-tubulin, heat shock protein 90 (Hsp90), ERK1, and many others [57,58]. Through these interactions, HDAC 6 regulates various cellular processes such as proliferation and apoptosis [59]. However, studies have shown that targeting HDAC 6 alone has not led to any significant benefit in solid tumors. Interestingly, several studies have shown that HDAC 6 inhibitors in combination therapy with chemotherapeutics increased the cytotoxic efficacy of the latter [60].
In conclusion, MPK544 acts by suppressing invasion via upregulating E-cadherin mediated by HDAC 2 blockade and by inducing cell cycle arrest leading to apoptosis via HDAC 6 inhibition. Furthermore, a synergistic interaction of MPK544 with the chemotherapeutic agent gemcitabine could be demonstrated. Overall, these results suggest that HDAC 2/6 inhibitors might represent a novel therapeutic strategy for the treatment for PDAC.

4. Materials and Methods

4.1. Cell Culture

The PANC-1 cell line, acquired from the American Type Culture Collection (ATCC), was cultured in Dulbecco’s Modified Eagle’s Medium (DMEM) (#41965039, Gibco, Grand Island, NY, USA) supplemented with 10% fetal bovine serum (FBS) (#10270-106, Gibco), as well as 1% penicillin–streptomycin (#15140122, Gibco, Grand Island, NY, USA). Pancreatic stellate cells (PSCs) were provided by Dr. Erkan of Koç University Hospital in Turkey. The ethics committee for the biomedical sciences at KOÇ University granted ethical approval, and all patients consented in writing. Pancreatic stellate cells were obtained from patients diagnosed with ductal adenocarcinoma and cultured in DMEM/F12 (#11320074, Gibco, Grand Island, NY, USA) with 20% fetal bovine serum (FBS) and 1% pen-strep under aseptic conditions. Both cell types were incubated at 37 °C in a humidified atmosphere supplemented with 5% CO2.

4.2. Spheroid Formation

PANC-1 spheroids were formed by adding 5000 PANC-1 cells per well into an ultra-low attachment (ULA)-coated surface plate (#650970, Greiner Bio-One, Kremsmünster, Austria) in DMEM. Co-culture spheroids were generated according to our previous study [30]. The compound treatment of PANC-1 spheroids and co-culture spheroids was initiated on day 4 following cell seeding.

4.3. Cell Viability Assays

Cell viability in both PANC-1 and PSC cells was assessed using the PrestoBlue HS Cell Viability Assay (#P50201, Thermo Scientific, Waltham, MA, USA) in 96-well plates (#655090, Greiner Bio-One, Kremsmünster, Austria), seeding 5000 cells per well for PANC-1 and 2000 cells per well for PSCs. Compounds were incubated for 72 h. Fluorescence values were recorded using the Tecan SPARK instrument (Tecan Group, Männedorf, Switzerland). The cell viability of 3D spheroids was analyzed with the CellTiter-Glo® 3D Cell Viability Assay (#G9681, Promega, Madison, WI, USA) according to the manufacturer’s protocol. Luminescence values were measured with the Tecan SPARK instrument (Tecan Group, Männedorf, Switzerland).

4.4. Western Blot Analysis

PANC-1 was seeded onto 6-well plates (#657180, Greiner Bio-One, Kremsmünster, Austria) containing 1.8 mL DMEM supplemented with 10% FBS and 1% pen-strep. Cells were treated either with MPK544, SAHA, or tubastatin A for 72 h. Cells were lysed with 500 µL of radioimmunoprecipitation assay (RIPA) buffer, along with a protease inhibitor (#11836170001, Roche, Basel, Switzerland) and phosphatase inhibitor (#04906845001, Roche). The BCA protein assay kit (#23227, Thermo Scientific, Waltham, MA, USA) was used to determine protein concentration. After denaturation at 95 °C for 10 min, the proteins were loaded onto a 10% SDS gel and separated using the Biometra Eco-Mini Buffer Tank system (Analytik Jena, Jena, Germany, #846-017-103/017-170). Protein transfer onto a PVDF membrane (BioRad Laboratories, Inc., Hercules, CA, USA, #1620177) was facilitated using the Biometra Fastblot system (#846-015-299 Analytik Jena, Jena, Germany). The membrane was incubated overnight at 4 °C with the following antibodies: E-cadherin (BD Bioscience, Heidelberg, Germany, #610182) and GAPDH (Cell signaling, Danvers, MA, USA, #2118). After three washes with 1x TBS-T, the corresponding secondary antibody labeled with horseradish peroxidase was incubated at room temperature for one hour (Goat anti-rabbit, #31460, Goat anti-mouse #31432, Thermo Fisher Scientific, Waltham, MA, USA). Antibody binding was detected using the SuperSignal West Pico Plus substrate kit (#34577, Thermo Fisher Scientific, Waltham, MA, USA) and visualized using the ChemStudio 159 imager (#849-97-0928-04, Analytik Jena, Jena, Germany).

4.5. Quantitative Real-Time PCR (qRT-PCR)

To determine E-cadherin mRNA levels after treatment with MKP544, the following primers from Eurofins were utilized (Ebersberg, Germany): E-cadherin (forward, 5′ CGAGAGCTACACGTTCACGG-3′, reverse 5′-GGGTGTCGAGGGAAAAATAGG-3′) (Anzai et al. 2017) and GAPDH (forward, 5′-TGCACCACCAACTGCTTAGC-3′; reverse, 5′-GGCATGGACTGTGGTCATGAG-3′). PANC-1 cells were incubated with MPK544, SAHA, or tubastatin A for 24 or 72 h. The total RNA was extracted using the RNeasy MiniKit (#74104, Qiagen, Hilden, Germany) as described in the manufacturer’s instructions. The determination of the RNA concentration was performed using the Tecan Spark NanoQuant plate (Tecan Group, Männedorf, Switzerland). The cDNA synthesis was conducted with 1 µg of isolated mRNA using the QuantiTect Reverse Transcription Kit (#205311, Qiagen, Hilden, Germany). The qRT-PCR was carried out with 50 ng cDNA using the Luna® Universal qPCR Master Mix (# M3003L, New England BioLabs® Inc., Ipswich, MA, USA). Ct values were calculated with the ΔΔCT method. Sample values were normalized to the housekeeping gene GAPDH (glyceraldehyde 3-phosphate dehydrogenase). Analytical evaluation was performed with the qPCRsoft 4.1 software (Analytic Jena, Jena, Germany).

4.6. Spherical Invasion Assay

The invasion assay was adapted from Hurley et al. (2017) [37]. In summary, PANC-1 cells were diluted 1:1 with matrigel (#356230, Corning, Corning, NY, USA). Compounds were applied to the cell suspension in a 24-well plate. The matrigel was allowed to polymerize for 30 min at 37 °C. After a 24 h incubation period, a second matrigel layer was added on top of the first. The invasion of the PANC-1 cells into the second layer of matrigel was studied for 72 h with the CQ1 Confocal Imaging Cytometer (#90ZA00673, Yokogawa, Tokyo, Japan). The invaded number of cells was quantified at 0 h and after 72 h with the CellPathFinder software (version 3.06.06.06, Yokogawa). Machine learning was used to automatically identify and count each invasive cell in the brightfield mode. To capture all cells invaded in the second matrigel layer, the analysis radius was set to 1500 µm.

4.7. Immunofluorescence of Whole Spheroids

Spheroids were cultivated for 4 days, followed by 72 h of treatment. The protocol was adapted from Xie et al. (2020), and the spheroids were fixed with 4% paraformaldehyde for 1 h at room temperature [30]. The primary antibody staining process involved permeabilization using 0.25% Triton X-100, followed by blocking with a solution of 0.1% BSA and 0.01% Tween 20 in PBS. Spheroids were incubated with 100 µL of primary antibody solution (Human Ki67/MKI67 (#MAB7617, R&DSystems, Minneapolis, MN, USA), E-cadherin (#610182, BD Biosciences, Franklin Lakes, NJ, USA) for 24 h at 4 °C. The secondary antibody solution (Alexa Flour 647 donkey (H+L) anti-mouse (#A-31571, Invitrogen, Waltham, MA, USA), Alexa Flour 488 donkey (H+L) anti-rabbit (#A-21206, Invitrogen)) including 2 µg/mL DAPI (#D9542, Sigma-Aldrich, Saint Louis, MI, USA) was incubated at 4 °C for 24 h. The clearing process was performed by sequential incubation in six ethanol solutions with an increasing concentration (30%, 50%, 70%, 90%, 96%, and 100%), each for 30 min. A final clearing step involved a benzyl alcohol/benzyl benzoate solution with a 1:2 ratio for 1 h. Afterwards, the spheroids were transferred to an imaging plate (# 89626, ibidi GmbH, Gräfelfing, Germany) and imaged with the CQ1 Confocal Imaging Cytometer (Part Number 90ZA00673, Yokogawa). Z-stacks were obtained with 100 stacks per spheroid (1 slice/µm) and analyzed using the CellPathFinder software.

4.8. Flow Cytometry

Co-culture spheroids were generated as described above. Then, 4 days after seeding, spheroids were treated with drug candidates and harvested after 72 h of incubation. After washing with PBS, spheroids were digested into single cell suspension using 500 µL Accumax Cell Dissociation Solution (#ACM-1F, Capricorn Scientific GmbH, Ebsdorfergrund, Germany). The single cell suspensions were transferred onto a 96 V bottom plate (#83.3926, Sarstedt, Nümbrecht, Germany) and stained in Automacs Running Buffer with REA Control (S)-PE (#130-113-438, Miltenyi, Bergisch Gladbach, Germany), E-cadherin-PE (#130-111-992, Miltenyi) antibodies according to manufacture introductions for 10 min at 4 °C. For the analysis of apoptosis and the cell cycle, PANC-1 cells were cultured in 6-well plates. After treatment for 48 h, cells were harvested and washed with PBS. Staining was performed using the Annexin V-FITC/propidium iodide (PI) Apoptosis Detection Kit from Elabscience (#E-CK-A211, Housten, TX, USA) according to the manufacturer’s instructions. For cell cycle analysis, cells were washed with PBS and suspended in 100 µL of hypotonic buffer (0.1% Triton X-100, 1% sodium citrate, and 0.05 mg/mL PI in double-distilled water). The cells were incubated for 10 min at room temperature. Flow cytometry was performed with the BD FACSLyric flow cytometer (#87135, BD Bioscience, Franklin Lakes, NJ, USA) and analyzed with the FlowJo software (version 10.8.1).

4.9. Combinatorial Drug Testing

PANC-1 cells were seeded onto 96-well plates (#655090, Greiner Bio-One, Kremsmünster, Austria). Then, 24 h after seeding, the cells were treated with increasing concentrations in 9 × 6 dose–response matrices. For MPK544, the concentration range was 0.1875 µM up to 3 µM, for gemcitabine from 1.28 nM up to 100 μM, and for 5-fluorouracil (5-FU) from 0.78125 µM up to 100 µM, treated at 1:2, 1:5, and 1:2 dilutions, respectively. Cell viability was monitored after 72 h using the PrestoBlue HS Cell Viability Assay (as described in 4.3.). Bliss synergy scores were determined using the Combenefit synergy analysis software (version 2.021) [44].

4.10. Statistical Analysis

GraphPad Prism 8.4.3 software (GraphPad Software, Boston, MA, USA) was utilized for statistical and graphical analysis. The IC50 values were acquired for assessing cell viability through non-linear regression. A one-way analysis of variance (ANOVA, New Providence, NJ, USA) and unpaired t-test were employed to scrutinize statistical data, with p-values < 0.05 considered statistically significant.

Supplementary Materials

The following supporting information can be downloaded at https://www.mdpi.com/article/10.3390/ph17060752/s1. References [61,62,63] are cited in Supplementary Material.

Author Contributions

N.E.T., T.K., K.S., and A.D. designed and conceived the experiments. K.S, A.D., J.H. and M.P. conducted the experiments. K.S. and A.D. analyzed the results. Enzyme selectivity data were provided by A.H. and M.U.K. The original manuscript draft was written by K.S. and A.D. The manuscript was edited by K.S. and A.D. and revised by N.E.T., M.U.K., and T.K. Supervision and project conceptual design were conducted by N.E.T. and T.K. All authors have read and agreed to the published version of the manuscript.

Funding

This work was funded by the Deutsche Forschungsgemeinschaft (DFG, German Research Foundation) 270650915 (Research Training Group GRK 2158 to T.K. and N.E.T., M.U.K. acknowledges financial support from the Deutsche Forschungsgemeinschaft (DFG, German Research Foundation) KA 1942/2-1.

Institutional Review Board Statement

Not applicable.

Informed Consent Statement

Not applicable.

Data Availability Statement

Data is contained within the article and Supplementary Materials.

Acknowledgments

We would like to thank Karin Peter and Nadine Horstick for their excellent technical support throughout this work. Furthermore, we express our gratitude to Michael Schell for his invaluable assistance in devising the CellPathFinder image analysis. We would like to thank the working group of Christoph Suschek, especially Vera Grotheer, for providing the BD FACSLyric flow cytometer.

Conflicts of Interest

The authors declare no conflicts of interest.

References

  1. Elrakaybi, A.; Ruess, D.A.; Lübbert, M.; Quante, M.; Becker, H. Epigenetics in Pancreatic Ductal Adenocarcinoma: Impact on Biology and Utilization in Diagnostics and Treatment. Cancers 2022, 14, 5926. [Google Scholar] [CrossRef] [PubMed]
  2. Siegel, R.L.; Miller, K.D.; Fuchs, H.E.; Jemal, A. Cancer statistics, 2022. CA Cancer J. Clin. 2022, 72, 7–33. [Google Scholar] [CrossRef] [PubMed]
  3. Hosein, A.N.; Brekken, R.A.; Maitra, A. Pancreatic cancer stroma: An update on therapeutic targeting strategies. Nat. Rev. Gastroenterol. Hepatol. 2020, 17, 487–505. [Google Scholar] [CrossRef]
  4. Nielsen, M.F.B.; Mortensen, M.B.; Detlefsen, S. Key players in pancreatic cancer-stroma interaction: Cancer-associated fibroblasts, endothelial and inflammatory cells. World J. Gastroenterol. 2016, 22, 2678–2700. [Google Scholar] [CrossRef]
  5. Bulle, A.; Lim, K.-H. Beyond just a tight fortress: Contribution of stroma to epithelial-mesenchymal transition in pancreatic cancer. Signal Transduct. Target. Ther. 2020, 5, 249. [Google Scholar] [CrossRef] [PubMed]
  6. Guo, J.; Wang, S.; Gao, Q. An integrated overview of the immunosuppression features in the tumor microenvironment of pancreatic cancer. Front. Immunol. 2023, 14, 1258538. [Google Scholar] [CrossRef]
  7. Muller, M.; Haghnejad, V.; Schaefer, M.; Gauchotte, G.; Caron, B.; Peyrin-Biroulet, L.; Bronowicki, J.-P.; Neuzillet, C.; Lopez, A. The Immune Landscape of Human Pancreatic Ductal Carcinoma: Key Players, Clinical Implications, and Challenges. Cancers 2022, 14, 995. [Google Scholar] [CrossRef]
  8. Chen, G.; Wu, K.; Li, H.; Xia, D.; He, T. Role of hypoxia in the tumor microenvironment and targeted therapy. Front. Oncol. 2022, 12, 961637. [Google Scholar] [CrossRef]
  9. Xiang, X.-S.; Li, P.-C.; Wang, W.-Q.; Liu, L. Histone deacetylases: A novel class of therapeutic targets for pancreatic cancer. Biochim. Biophys. Acta Rev. Cancer 2022, 1877, 188676. [Google Scholar] [CrossRef]
  10. Singh, T.; Kaur, P.; Singh, P.; Singh, S.; Munshi, A. Differential molecular mechanistic behavior of HDACs in cancer progression. Med. Oncol. 2022, 39, 171. [Google Scholar] [CrossRef]
  11. Kulka, L.A.M.; Fangmann, P.-V.; Panfilova, D.; Olzscha, H. Impact of HDAC Inhibitors on Protein Quality Control Systems: Consequences for Precision Medicine in Malignant Disease. Front. Cell Dev. Biol. 2020, 8, 425. [Google Scholar] [CrossRef] [PubMed]
  12. Barneda-Zahonero, B.; Parra, M. Histone deacetylases and cancer. Mol. Oncol. 2012, 6, 579–589. [Google Scholar] [CrossRef] [PubMed]
  13. Seto, E.; Yoshida, M. Erasers of histone acetylation: The histone deacetylase enzymes. Cold Spring Harb. Perspect. Biol. 2014, 6, a018713. [Google Scholar] [CrossRef] [PubMed]
  14. Laschanzky, R.S.; Humphrey, L.E.; Ma, J.; Smith, L.M.; Enke, T.J.; Shukla, S.K.; Dasgupta, A.; Singh, P.K.; Howell, G.M.; Brattain, M.G.; et al. Selective Inhibition of Histone Deacetylases 1/2/6 in Combination with Gemcitabine: A Promising Combination for Pancreatic Cancer Therapy. Cancers 2019, 11, 1327. [Google Scholar] [CrossRef] [PubMed]
  15. Wawruszak, A.; Kalafut, J.; Okon, E.; Czapinski, J.; Halasa, M.; Przybyszewska, A.; Miziak, P.; Okla, K.; Rivero-Muller, A.; Stepulak, A. Histone Deacetylase Inhibitors and Phenotypical Transformation of Cancer Cells. Cancers 2019, 11, 148. [Google Scholar] [CrossRef] [PubMed]
  16. Krauß, L.; Schneider, C.; Hessmann, E.; Saur, D.; Schneider, G. Epigenetic control of pancreatic cancer metastasis. Cancer Metastasis Rev. 2023, 42, 1113–1131. [Google Scholar] [CrossRef] [PubMed]
  17. Fu, X.-H.; Zhang, X.; Yang, H.; Xu, X.-W.; Hu, Z.-L.; Yan, J.; Zheng, X.-L.; Wei, R.-R.; Zhang, Z.-Q.; Tang, S.-R.; et al. CUDC-907 displays potent antitumor activity against human pancreatic adenocarcinoma in vitro and in vivo through inhibition of HDAC6 to downregulate c-Myc expression. Acta Pharmacol. Sin. 2019, 40, 677–688. [Google Scholar] [CrossRef] [PubMed]
  18. Luu, T. Epithelial-Mesenchymal Transition and its Regulation Mechanisms in Pancreatic Cancer. Front. Oncol. 2021, 11, 646399. [Google Scholar] [CrossRef] [PubMed]
  19. Park, S.J.; Kim, S.-M.; Moon, J.-H.; Kim, J.H.; Shin, J.-S.; Hong, S.-W.; Shin, Y.J.; Lee, D.-H.; Lee, E.Y.; Hwang, I.-Y.; et al. SAHA, an HDAC inhibitor, overcomes erlotinib resistance in human pancreatic cancer cells by modulating E-cadherin. Tumour Biol. 2016, 37, 4323–4330. [Google Scholar] [CrossRef]
  20. Knoche, S.M.; Brumfield, G.L.; Goetz, B.T.; Sliker, B.H.; Larson, A.C.; Olson, M.T.; Poelaert, B.J.; Bavari, A.; Yan, Y.; Black, J.D.; et al. The histone deacetylase inhibitor M344 as a multifaceted therapy for pancreatic cancer. PLoS ONE 2022, 17, e0273518. [Google Scholar] [CrossRef]
  21. Conroy, T.; Pfeiffer, P.; Vilgrain, V.; Lamarca, A.; Seufferlein, T.; O’Reilly, E.M.; Hackert, T.; Golan, T.; Prager, G.; Haustermans, K.; et al. Pancreatic cancer: ESMO Clinical Practice Guideline for diagnosis, treatment and follow-up. Ann. Oncol. 2023, 34, 987–1002. [Google Scholar] [CrossRef]
  22. Pusceddu, S.; Ghidini, M.; Torchio, M.; Corti, F.; Tomasello, G.; Niger, M.; Prinzi, N.; Nichetti, F.; Coinu, A.; Di Bartolomeo, M.; et al. Comparative Effectiveness of Gemcitabine plus Nab-Paclitaxel and FOLFIRINOX in the First-Line Setting of Metastatic Pancreatic Cancer: A Systematic Review and Meta-Analysis. Cancers 2019, 11, 484. [Google Scholar] [CrossRef] [PubMed]
  23. Thomas, D.; Radhakrishnan, P. Pancreatic Stellate Cells: The Key Orchestrator of The Pancreatic Tumor Microenvironment. Adv. Exp. Med. Biol. 2020, 1234, 57–70. [Google Scholar] [CrossRef]
  24. Cave, D.D.; Di Guida, M.; Costa, V.; Sevillano, M.; Ferrante, L.; Heeschen, C.; Corona, M.; Cucciardi, A.; Lonardo, E. TGF-β1 secreted by pancreatic stellate cells promotes stemness and tumourigenicity in pancreatic cancer cells through L1CAM downregulation. Oncogene 2020, 39, 4271–4285. [Google Scholar] [CrossRef]
  25. Marks, P.A.; Breslow, R. Dimethyl sulfoxide to vorinostat: Development of this histone deacetylase inhibitor as an anticancer drug. Nat. Biotechnol. 2007, 25, 84–90. [Google Scholar] [CrossRef] [PubMed]
  26. Marks, P.A. Discovery and development of SAHA as an anticancer agent. Oncogene 2007, 26, 1351–1356. [Google Scholar] [CrossRef]
  27. McClure, J.J.; Li, X.; Chou, C.J. Advances and Challenges of HDAC Inhibitors in Cancer Therapeutics. Adv. Cancer Res. 2018, 138, 183–211. [Google Scholar] [CrossRef]
  28. Stenzel, K.; Hamacher, A.; Hansen, F.K.; Gertzen, C.G.W.; Senger, J.; Marquardt, V.; Marek, L.; Marek, M.; Romier, C.; Remke, M.; et al. Alkoxyurea-Based Histone Deacetylase Inhibitors Increase Cisplatin Potency in Chemoresistant Cancer Cell Lines. J. Med. Chem. 2017, 60, 5334–5348. [Google Scholar] [CrossRef] [PubMed]
  29. Negmeldin, A.T.; Pflum, M.K.H. The structural requirements of histone deacetylase inhibitors: SAHA analogs modified at the C5 position display dual HDAC6/8 selectivity. Bioorg. Med. Chem. Lett. 2017, 27, 3254–3258. [Google Scholar] [CrossRef]
  30. Xie, B.; Hänsel, J.; Mundorf, V.; Betz, J.; Reimche, I.; Erkan, M.; Büdeyri, I.; Gesell, A.; Kerr, R.G.; Ariantari, N.P.; et al. Pseudopterosin and O-Methyltylophorinidine Suppress Cell Growth in a 3D Spheroid Co-Culture Model of Pancreatic Ductal Adenocarcinoma. Bioengineering 2020, 7, 57. [Google Scholar] [CrossRef]
  31. Aghdassi, A.; Sendler, M.; Guenther, A.; Mayerle, J.; Behn, C.-O.; Heidecke, C.-D.; Friess, H.; Büchler, M.; Evert, M.; Lerch, M.M.; et al. Recruitment of histone deacetylases HDAC1 and HDAC2 by the transcriptional repressor ZEB1 downregulates E-cadherin expression in pancreatic cancer. Gut 2012, 61, 439–448. [Google Scholar] [CrossRef]
  32. Kaneta, Y.; Sato, T.; Hikiba, Y.; Sugimori, M.; Sue, S.; Kaneko, H.; Irie, K.; Sasaki, T.; Kondo, M.; Chuma, M.; et al. Loss of Pancreatic E-Cadherin Causes Pancreatitis-Like Changes and Contributes to Carcinogenesis. Cell. Mol. Gastroenterol. Hepatol. 2020, 9, 105–119. [Google Scholar] [CrossRef] [PubMed]
  33. Mishra, V.K.; Subramaniam, M.; Kari, V.; Pitel, K.S.; Baumgart, S.J.; Naylor, R.M.; Nagarajan, S.; Wegwitz, F.; Ellenrieder, V.; Hawse, J.R.; et al. Krüppel-like Transcription Factor KLF10 Suppresses TGFβ-Induced Epithelial-to-Mesenchymal Transition via a Negative Feedback Mechanism. Cancer Res. 2017, 77, 2387–2400. [Google Scholar] [CrossRef]
  34. Garajová, I.; Cavazzoni, A.; Verze, M.; Minari, R.; Pedrazzi, G.; Balsano, R.; Gelsomino, F.; Valle, R.D.; Digiacomo, G.; Giovannetti, E.; et al. It Takes Two to Tango: Potential Prognostic Impact of Circulating TGF-Beta and PD-L1 in Pancreatic Cancer. Life 2022, 12, 960. [Google Scholar] [CrossRef]
  35. Principe, D.R.; Timbers, K.E.; Atia, L.G.; Koch, R.M.; Rana, A. TGFβ Signaling in the Pancreatic Tumor Microenvironment. Cancers 2021, 13, 5086. [Google Scholar] [CrossRef]
  36. Alvarez, M.A.; Freitas, J.P.; Mazher Hussain, S.; Glazer, E.S. TGF-β Inhibitors in Metastatic Pancreatic Ductal Adenocarcinoma. J. Gastrointest. Cancer 2019, 50, 207–213. [Google Scholar] [CrossRef] [PubMed]
  37. Hurley, J.D.; Akers, A.T.; Friedman, J.R.; Nolan, N.A.; Brown, K.C.; Dasgupta, P. Non-pungent long chain capsaicin-analogs arvanil and olvanil display better anti-invasive activity than capsaicin in human small cell lung cancers. Cell Adhes. Migr. 2017, 11, 80–97. [Google Scholar] [CrossRef]
  38. Krauß, L.; Urban, B.C.; Hastreiter, S.; Schneider, C.; Wenzel, P.; Hassan, Z.; Wirth, M.; Lankes, K.; Terrasi, A.; Klement, C.; et al. HDAC2 Facilitates Pancreatic Cancer Metastasis. Cancer Res. 2022, 82, 695–707. [Google Scholar] [CrossRef] [PubMed]
  39. Alqosaibi, A.I.; Abdel-Ghany, S. Vorinostat induces G2/M cell cycle arrest in breast cancer cells via upregulation of PTEN. Eur. Rev. Med. Pharmacol. Sci. 2023, 27, 1503–1511. [Google Scholar] [CrossRef]
  40. Niu, J.; Wang, X.; Qu, J.; Mager, D.E.; Straubinger, R.M. Pharmacodynamic modeling of synergistic birinapant/paclitaxel interactions in pancreatic cancer cells. BMC Cancer 2020, 20, 1024. [Google Scholar] [CrossRef]
  41. Urdiciain, A.; Erausquin, E.; Meléndez, B.; Rey, J.A.; Idoate, M.A.; Castresana, J.S. Tubastatin A, an inhibitor of HDAC6, enhances temozolomide–induced apoptosis and reverses the malignant phenotype of glioblastoma cells. Int. J. Oncol. 2019, 54, 1797–1808. [Google Scholar] [CrossRef] [PubMed]
  42. Arnold, N.B.; Arkus, N.; Gunn, J.; Korc, M. The histone deacetylase inhibitor suberoylanilide hydroxamic acid induces growth inhibition and enhances gemcitabine-induced cell death in pancreatic cancer. Clin. Cancer Res. 2007, 13, 18–26. [Google Scholar] [CrossRef] [PubMed]
  43. Roca, M.S.; Moccia, T.; Iannelli, F.; Testa, C.; Vitagliano, C.; Minopoli, M.; Camerlingo, R.; de Riso, G.; de Cecio, R.; Bruzzese, F.; et al. HDAC class I inhibitor domatinostat sensitizes pancreatic cancer to chemotherapy by targeting cancer stem cell compartment via FOXM1 modulation. J. Exp. Clin. Cancer Res. 2022, 41, 83. [Google Scholar] [CrossRef] [PubMed]
  44. Di Veroli, G.Y.; Fornari, C.; Wang, D.; Mollard, S.; Bramhall, J.L.; Richards, F.M.; Jodrell, D.I. Combenefit: An interactive platform for the analysis and visualization of drug combinations. Bioinformatics 2016, 32, 2866–2868. [Google Scholar] [CrossRef] [PubMed]
  45. Shustov, A.; Coiffier, B.; Horwitz, S.; Sokol, L.; Pro, B.; Wolfson, J.; Balser, B.; Eisch, R.; Popplewell, L.; Prince, H.M.; et al. Romidepsin is effective and well tolerated in older patients with peripheral T-cell lymphoma: Analysis of two phase II trials. Leuk. Lymphoma 2017, 58, 2335–2341. [Google Scholar] [CrossRef] [PubMed]
  46. O’Connor, O.A.; Horwitz, S.; Masszi, T.; van Hoof, A.; Brown, P.; Doorduijn, J.; Hess, G.; Jurczak, W.; Knoblauch, P.; Chawla, S.; et al. Belinostat in Patients with Relapsed or Refractory Peripheral T-Cell Lymphoma: Results of the Pivotal Phase II BELIEF (CLN-19) Study. J. Clin. Oncol. 2015, 33, 2492–2499. [Google Scholar] [CrossRef] [PubMed]
  47. Wu, Y.; Li, C.S.; Meng, R.Y.; Jin, H.; Chai, O.H.; Kim, S.M. Regulation of Hippo-YAP/CTGF signaling by combining an HDAC inhibitor and 5-fluorouracil in gastric cancer cells. Toxicol. Appl. Pharmacol. 2024, 482, 116786. [Google Scholar] [CrossRef] [PubMed]
  48. Kim, D.J.; Dunleavey, J.M.; Xiao, L.; Ollila, D.W.; Troester, M.A.; Otey, C.A.; Li, W.; Barker, T.H.; Dudley, A.C. Suppression of TGFβ-mediated conversion of endothelial cells and fibroblasts into cancer associated (myo)fibroblasts via HDAC inhibition. Br. J. Cancer 2018, 118, 1359–1368. [Google Scholar] [CrossRef]
  49. Mishra, V.K.; Wegwitz, F.; Kosinsky, R.L.; Sen, M.; Baumgartner, R.; Wulff, T.; Siveke, J.T.; Schildhaus, H.-U.; Najafova, Z.; Kari, V.; et al. Histone deacetylase class-I inhibition promotes epithelial gene expression in pancreatic cancer cells in a BRD4- and MYC-dependent manner. Nucleic Acids Res. 2017, 45, 6334–6349. [Google Scholar] [CrossRef] [PubMed]
  50. Wang, G.; He, J.; Zhao, J.; Yun, W.; Xie, C.; Taub, J.W.; Azmi, A.; Mohammad, R.M.; Dong, Y.; Kong, W.; et al. Class I and class II histone deacetylases are potential therapeutic targets for treating pancreatic cancer. PLoS ONE 2012, 7, e52095. [Google Scholar] [CrossRef]
  51. Gruber, W.; Peer, E.; Elmer, D.P.; Sternberg, C.; Tesanovic, S.; Del Burgo, P.; Coni, S.; Canettieri, G.; Neureiter, D.; Bartz, R.; et al. Targeting class I histone deacetylases by the novel small molecule inhibitor 4SC-202 blocks oncogenic hedgehog-GLI signaling and overcomes smoothened inhibitor resistance. Int. J. Cancer 2018, 142, 968–975. [Google Scholar] [CrossRef] [PubMed]
  52. Hahn, S.; Oh, B.J.; Kim, H.; Han, I.W.; Shin, S.H.; Kim, G.; Jin, S.-M.; Kim, J.H. Anti-cancer effects of metformin in a 3D co-culture model of pancreatic ductal adenocarcinoma. Am. J. Cancer Res. 2023, 13, 1806–1825. [Google Scholar] [PubMed]
  53. Semaan, A.; Bernard, V.; Kim, D.U.; Lee, J.J.; Huang, J.; Kamyabi, N.; Stephens, B.M.; Qiao, W.; Varadhachary, G.R.; Katz, M.H.; et al. Characterisation of circulating tumour cell phenotypes identifies a partial-EMT sub-population for clinical stratification of pancreatic cancer. Br. J. Cancer 2021, 124, 1970–1977. [Google Scholar] [CrossRef] [PubMed]
  54. Aiello, N.M.; Kang, Y. Context-dependent EMT programs in cancer metastasis. J. Exp. Med. 2019, 216, 1016–1026. [Google Scholar] [CrossRef] [PubMed]
  55. Hoffmann, M.J.; Meneceur, S.; Hommel, K.; Schulz, W.A.; Niegisch, G. Downregulation of Cell Cycle and Checkpoint Genes by Class I HDAC Inhibitors Limits Synergism with G2/M Checkpoint Inhibitor MK-1775 in Bladder Cancer Cells. Genes 2021, 12, 260. [Google Scholar] [CrossRef] [PubMed]
  56. Kaur, S.; Rajoria, P.; Chopra, M. HDAC6: A unique HDAC family member as a cancer target. Cell. Oncol. 2022, 45, 779–829. [Google Scholar] [CrossRef]
  57. Kutil, Z.; Skultetyova, L.; Rauh, D.; Meleshin, M.; Snajdr, I.; Novakova, Z.; Mikesova, J.; Pavlicek, J.; Hadzima, M.; Baranova, P.; et al. The unraveling of substrate specificity of histone deacetylase 6 domains using acetylome peptide microarrays and peptide libraries. FASEB J. 2019, 33, 4035–4045. [Google Scholar] [CrossRef]
  58. Wu, J.-Y.; Xiang, S.; Zhang, M.; Fang, B.; Huang, H.; Kwon, O.K.; Zhao, Y.; Yang, Z.; Bai, W.; Bepler, G.; et al. Histone deacetylase 6 (HDAC6) deacetylates extracellular signal-regulated kinase 1 (ERK1) and thereby stimulates ERK1 activity. J. Biol. Chem. 2018, 293, 1976–1993. [Google Scholar] [CrossRef]
  59. Zheng, Y.; Yang, X.; Wang, C.; Zhang, S.; Wang, Z.; Li, M.; Wang, Y.; Wang, X.; Yang, X. HDAC6, modulated by miR-206, promotes endometrial cancer progression through the PTEN/AKT/mTOR pathway. Sci. Rep. 2020, 10, 3576. [Google Scholar] [CrossRef]
  60. Yoo, J.; Jeon, Y.H.; Lee, D.H.; Kim, G.W.; Lee, S.W.; Kim, S.Y.; Park, J.; Kwon, S.H. HDAC6-selective inhibitors enhance anticancer effects of paclitaxel in ovarian cancer cells. Oncol. Lett. 2021, 21, 201. [Google Scholar] [CrossRef]
  61. Olah, G.A.; Fung, A.P. Hexahydro-2-(1H)-Azocinone. Org. Synth. 2003, 63, 188. [Google Scholar]
  62. Giovannini, A.; Savoia, D.; Umani-Ronchi, A. Organometallic ring-opening reactions of N-acyl and N-alkoxycarbonyl lactams. Synthesis of cyclic imines. J. Org. Chem. 1989, 54, 228–234. [Google Scholar] [CrossRef]
  63. Ugwuegbulam, C.O.; Foy, J.E. Process for the Preparation of Anti-Malarial Drugs. U.S. Patent 6,479,660, 12 November 2002. [Google Scholar]
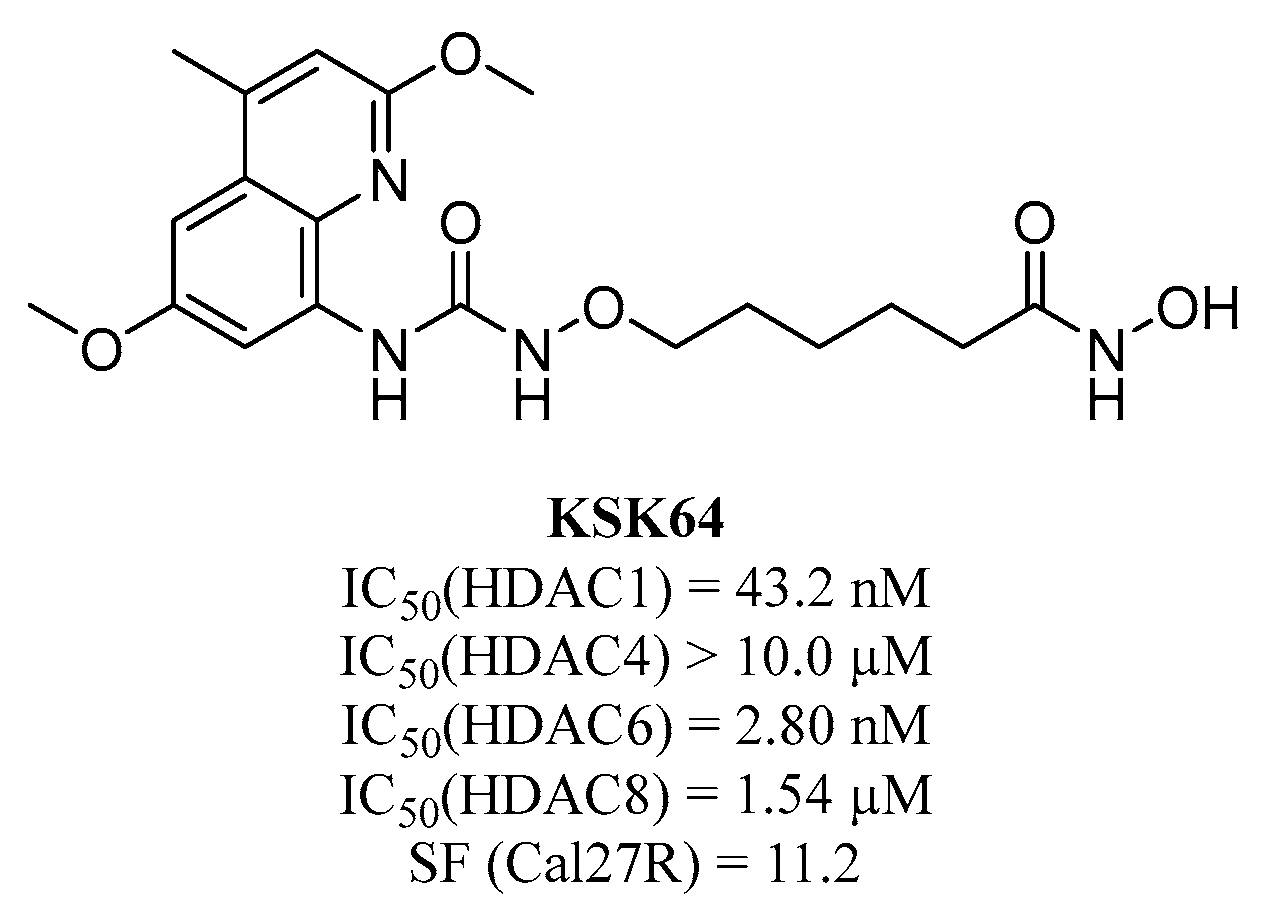
Figure 1. Structure and isozyme profile of KSK64 [28].
Pharmaceuticals 17 00752 g001
Scheme 1. Derivatization of KSK64.
Pharmaceuticals 17 00752 sch001
Scheme 2. Retrosynthetic analysis of MPK544.
Pharmaceuticals 17 00752 sch002
Scheme 3. Synthesis of 7-amino-N-(benzyloxy)heptanamide 5. (i) A total of 1.50 eq hydroxylamine-O-sulfonic acid, HCO2H; (ii) 1.00 eq nBuLi, 1.00 eq Boc2O, THF; (iii) 10.0 eq LiOH, THF/H2O; (iv) 1.00 eq HATU O-benzylhydroxylamine, 2.00 eq DIPEA, DMF; (v) 20.0 eq HCl in Dioxane, DCM.
Pharmaceuticals 17 00752 sch003
Scheme 4. Synthesis of MPK544 (8). (i) A total of 0.330 eq triphosgene, 1.00 eq DIPEA, DCM; (ii) H2, Pd/C, MeOH.
Pharmaceuticals 17 00752 sch004
Figure 2. Upregulation of E-cadherin in PANC-1 cells after 24 h. PANC-1 cells were treated with MPK544, SAHA, and tubastatin A for 24 h. mRNA levels of E-cadherin in PANC-1 cells were analyzed by qRT-PCR (A) and at protein level by Western blot (B,C) (control ●; 1 µM MPK544 ▪; 4 µM MPK544 Pharmaceuticals 17 00752 i001; 7 µM MPK544 Pharmaceuticals 17 00752 i002). Representative Western blots are shown (B). Error bars indicate standard errors of mean (of at least three independent experiments, with; ** = p ≤ 0.01; and **** = p ≤ 0.0001).
Pharmaceuticals 17 00752 g002
Figure 3. Upregulation of E-cadherin expression in PANC-1 cells. PANC-1 cells were treated with MPK544, SAHA, and tubastatin A or with 20 ng/mL TGF-β, for 72 h. mRNA levels of E-cadherin in PANC-1 cells were analyzed by qRT-PCR (A) and at protein level by Western blot (B,C). Representative Western blots are shown (B). Control ●; 20 ng/mL TGF-β ▪; 20 ng/mL TGF-β with 4 µM MPK544 Pharmaceuticals 17 00752 i002; 20 ng/mL TGF-β with 4 µM SAHA Pharmaceuticals 17 00752 i003; 20 ng/mL TGF-β with 10 µM tubastatin *). Error bars indicate standard errors of mean (of at least three independent experiments, with * = p ≤ 0.05; ** = p ≤ 0.01; and **** = p ≤ 0.0001).
Pharmaceuticals 17 00752 g003
Figure 4. Expression of E-cadherin in 3D co-culture spheroids after treatment with MPK544 and SAHA. Co-culture spheroids were treated with 2 µM MPK544 or SAHA for 72 h, respectively. Expression of E-cadherin was quantified via flow cytometry. (A) Exemplary overlay histograms for E-cadherin expression after different treatments. (B) Quantification of MFI fold change in E-cadherin expression in co-culture spheroids after treatment with 2 µM MPK544 or SAHA for 72 (control ●; 2 µM MPK544 ▪; 2 µM SAHA Pharmaceuticals 17 00752 i001). E-cadherin expression was measured in at least 3000 cells. Error bars indicate standard errors of mean (n = 3 independent experiments with * = p ≤ 0.05.
Pharmaceuticals 17 00752 g004
Figure 5. The invasion of PANC-1 cells into a 3D matrix. (A) PANC-1 cells were mixed in a ratio of 1:1 with matrigel and seeded into a 24-well plate. After 24 h, a second layer of matrigel was applied, and the cells were incubated for 72 h at 37 °C. The invasion of the PANC-1 cells into the second matrigel layer was studied by phase contrast microscopy (control in red; 20 ng/mL TGF-β in purple; 2 µM MPK544 in pink). The invasion assay ran for 72 h, and the area of invaded cells into the surrounding matrigel was visualized (control in red; 20 ng/mL TGF-β in purple; 2 µM MPK544 in pink) and calculated. (B) The quantification of the area of invaded cells upon treatment with 2 µM MPK544 in PANC-1 cells (control ●; 20 ng/mL TGF- β ▪; 2 µM MPK544 Pharmaceuticals 17 00752 i001). Error bars indicate the standard errors of the mean (n = 3 independent experiments with **** = p ≤ 0.0001).
Pharmaceuticals 17 00752 g005
Figure 6. Induction of apoptosis in PANC-1 cells. Cells were treated with 1 µM MKP544, 1 µM SAHA, 10 µM tubastatin A, or 0.1 µM paclitaxel for 48 h. For detection of apoptosis, cells were stained with Annexin V and PI and analyzed by flow cytometry. (A) Percentage of apoptotic cells treated with MPK544, SAHA, tubastatin A, or paclitaxel are shown in exemplary dot plots. (B) Quantification of apoptotic cells after 48 h of treatment. Apoptosis of at least 10,000 cells was analyzed via flow cytometry. Error bars indicate standard errors of mean (n = 3 independent experiments with ** = p ≤ 0.01).
Pharmaceuticals 17 00752 g006
Figure 7. Cell cycle analysis of PANC-1 cells. Cells were treated with 1 µM MPK544, 1 µM SAHA, 10 µM tubastatin A, or 0.1 µM paclitaxel for 48 h hours. Cell cycle analysis was performed according to Nicoletti method. (A) Percentage of cells in different cell cycles after treatment with MPK544, SAHA, tubastatin A, or paclitaxel for 48 h is shown in exemplary histograms. (B) Quantification of cell cycle phases. Cell cycles of at least 10,000 cells were analyzed via flow cytometry. Error bars indicate standard errors of mean (n = 3 independent experiments with ** = p ≤ 0.01; and **** = p ≤ 0.0001).
Pharmaceuticals 17 00752 g007
Figure 8. MPK544 demonstrates a synergistic interaction with the chemotherapeutic drug gemcitabine and no synergistic interaction with 5-fluorouracil (5-FU). A representative Bliss synergy plot of MPK544 with gemcitabine (A) and 5-FU (B) in PANC-1 cells (n = 3) is depicted. The Bliss synergy was analyzed and visualized with the Combenefit software (version 2.021) [44].
Pharmaceuticals 17 00752 g008
Table 1. The cytotoxic efficacy of HDAC inhibitors represented by the respective IC50 values [µM] in 2D PANC-1 and pancreatic stellate cell (PSC) cultures as well as in 3D co-culture spheroids after 72 h incubation. The arithmetic means and their respective standard deviations of three independent experiments are depicted.
HDAC Inhibitors PANC-1 PSC Co-Culture Spheroid
IC50 in µM
MPK544 2.95 ± 0.450.68 ± 0.480.90 ± 0.15
KSK64 7.04 ± 0.58 14.87 ± 4.55 3.30 ± 0.58
SAHA 3.65 ± 0.433.50 ± 0.990.85 ± 0.25
tubastatin A >100 >100 >100
Table 2. HDAC 2, HDAC 4, and HDAC 6 inhibition assay of MPK544.
HDAC 2 HDAC 4 HDAC 6
IC50 in µM
0.058 ± 0.02 >1000.097 ± 0.062
Disclaimer/Publisher’s Note: The statements, opinions and data contained in all publications are solely those of the individual author(s) and contributor(s) and not of MDPI and/or the editor(s). MDPI and/or the editor(s) disclaim responsibility for any injury to people or property resulting from any ideas, methods, instructions or products referred to in the content.