

A Common Neuronal Ensemble in the Lateral Habenula Regulates Ciprofol Anesthesia in Mice

 , and
, and 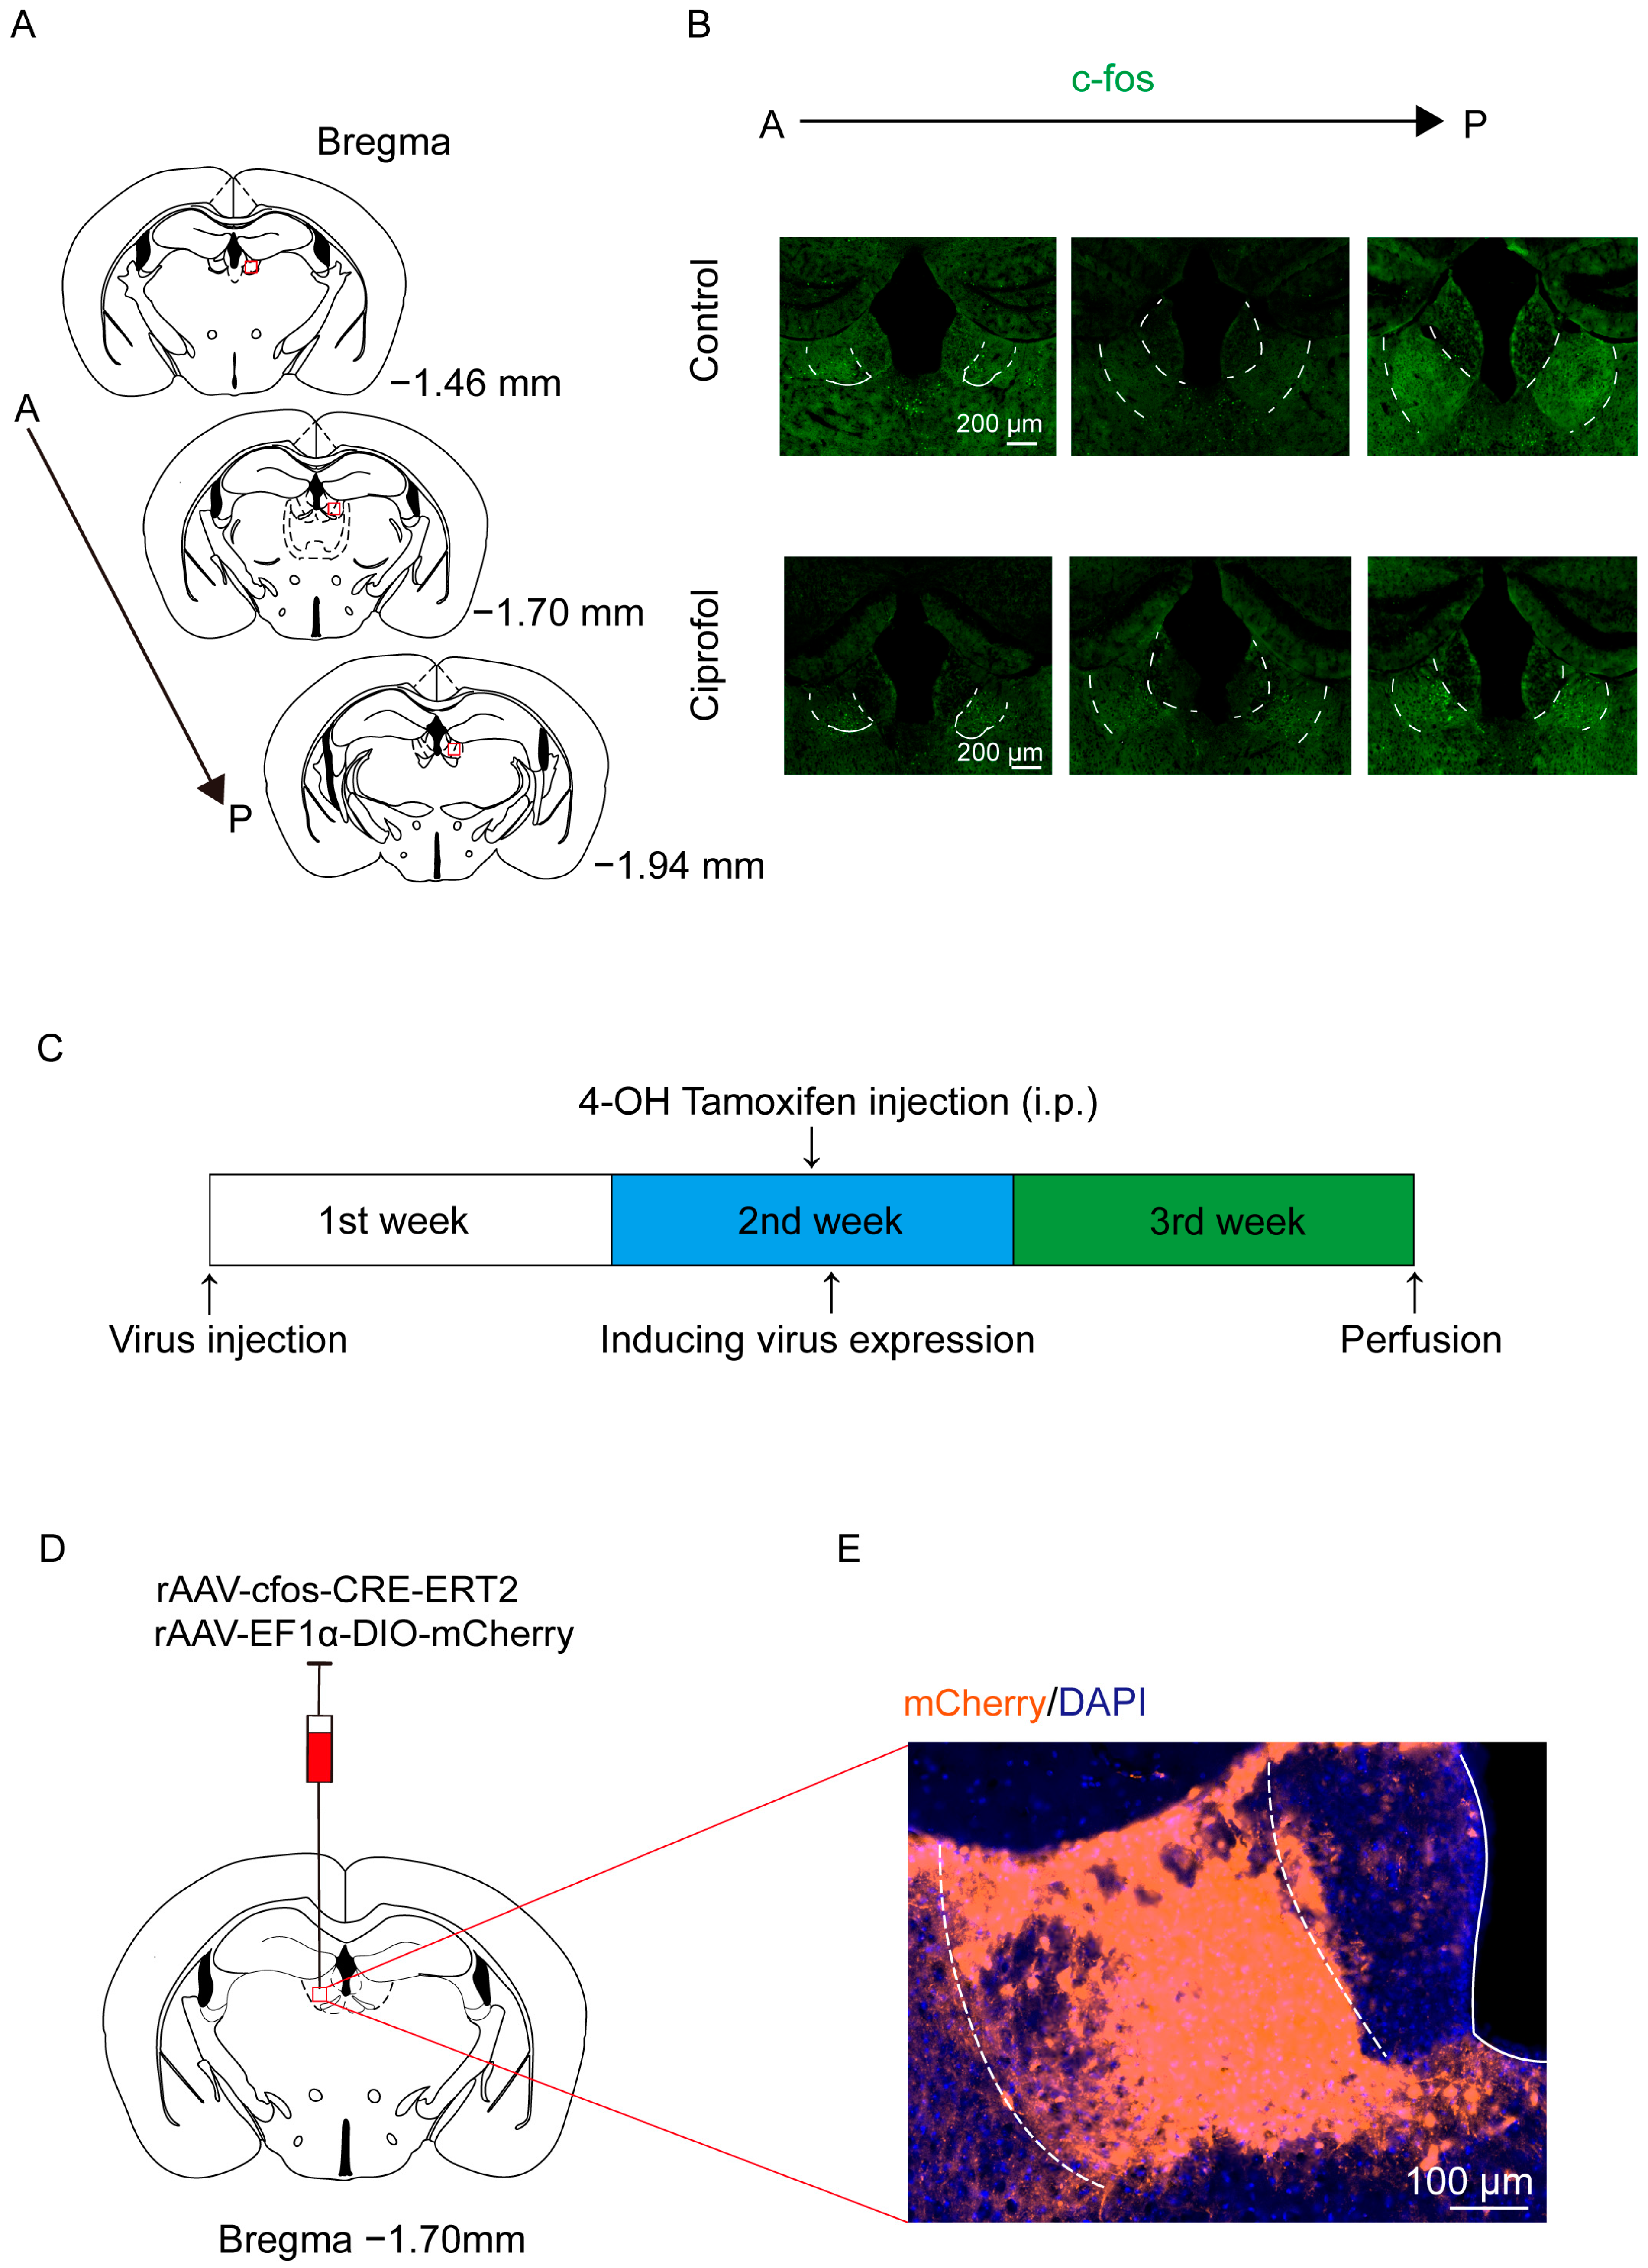
Abstract
1. Introduction
2. Results
2.1. Ciprofol Increases c-Fos Expression in the LHb
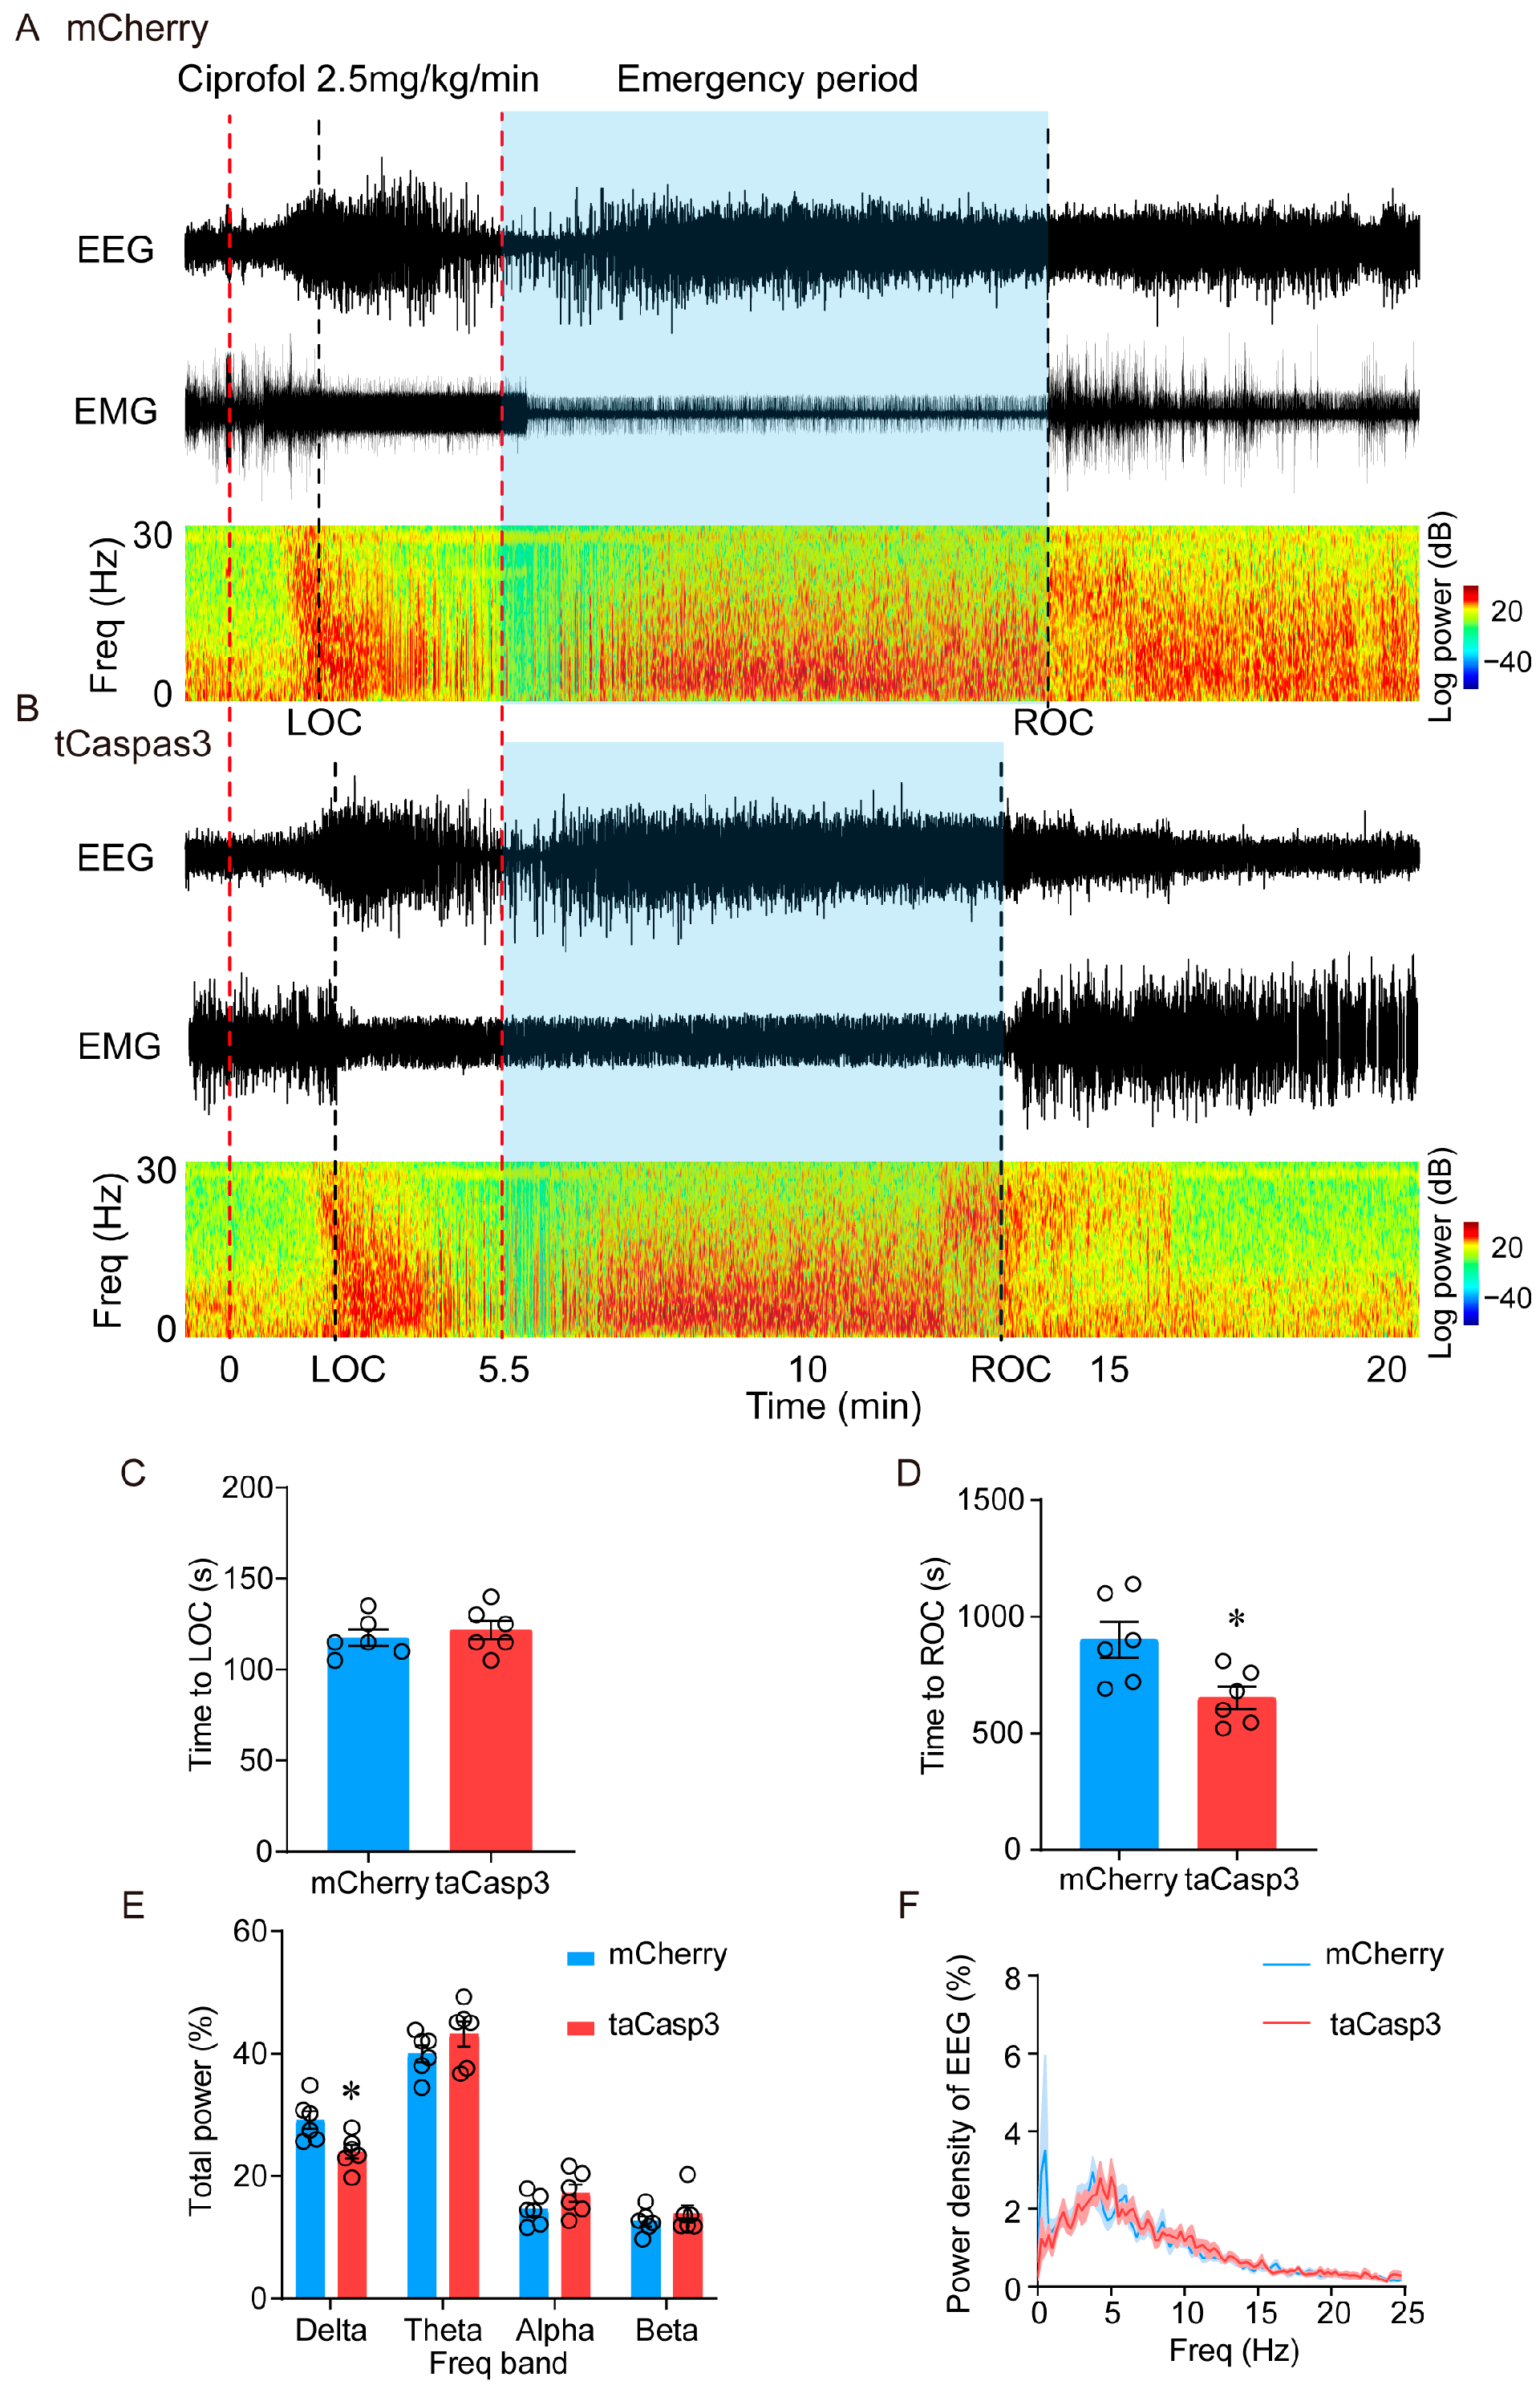
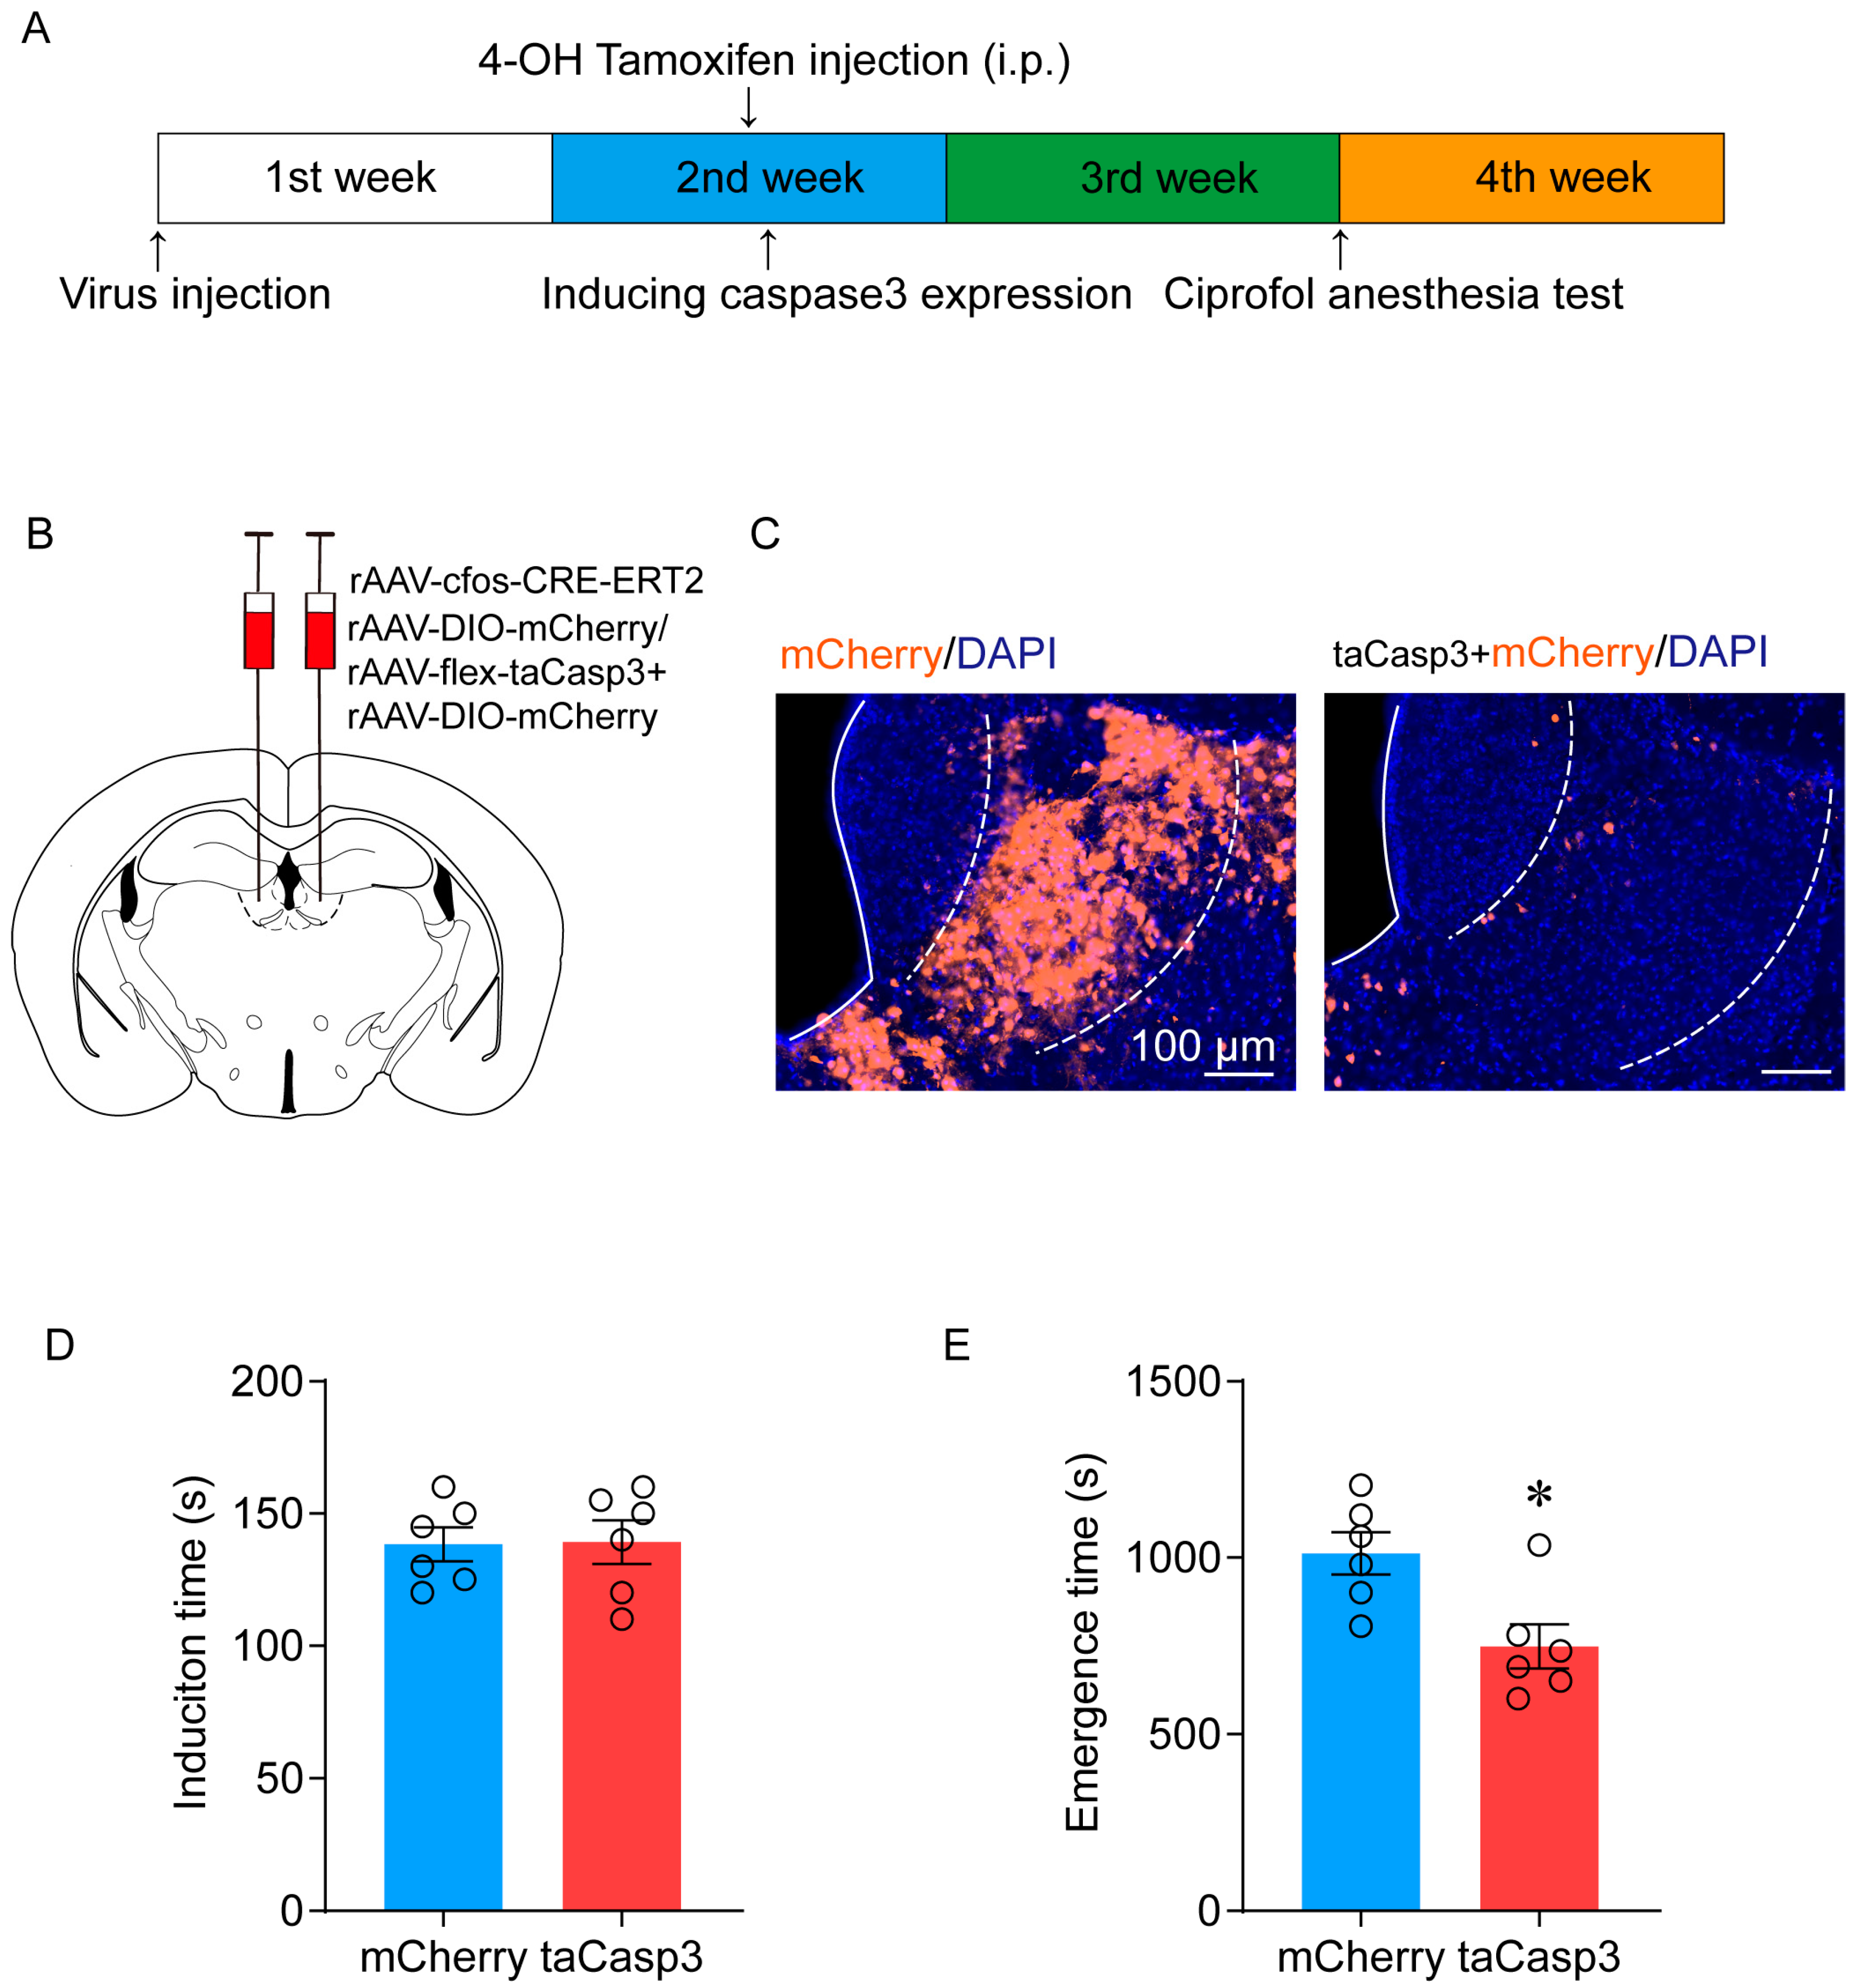
2.2. Ablation of LHb Neurons Facilitates the Emergence of Ciprofol-Induced Anesthesia
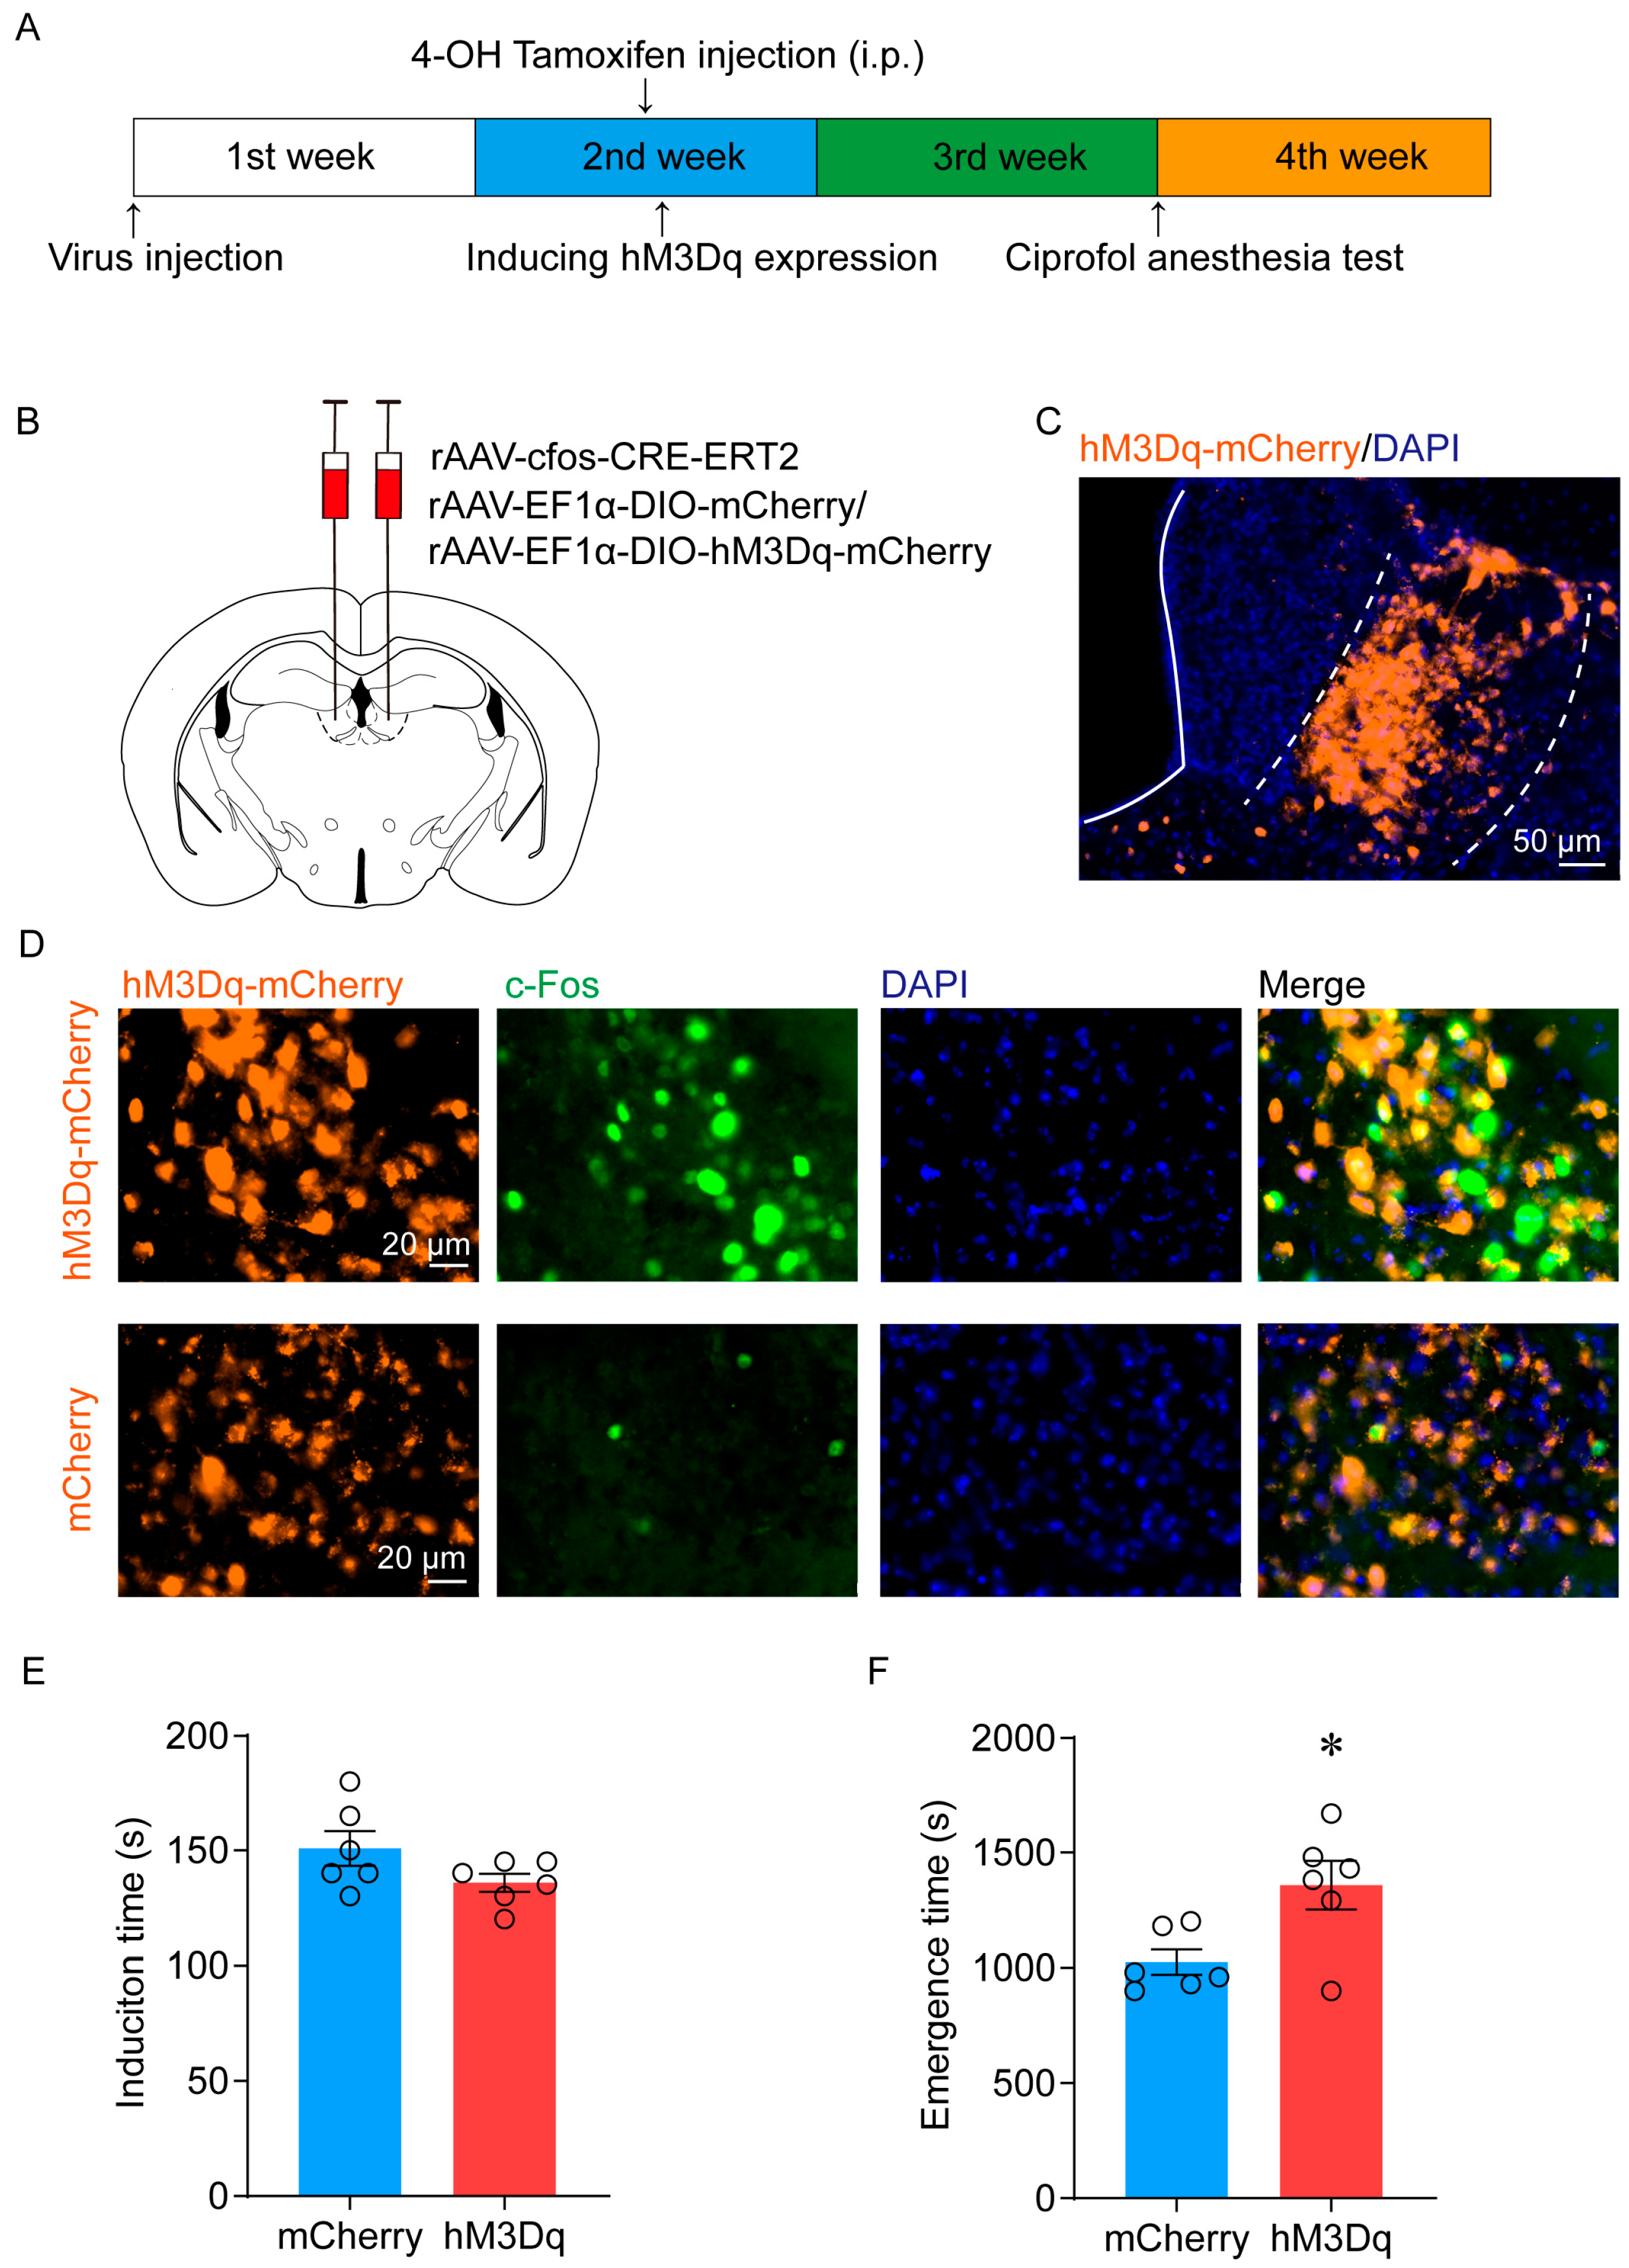
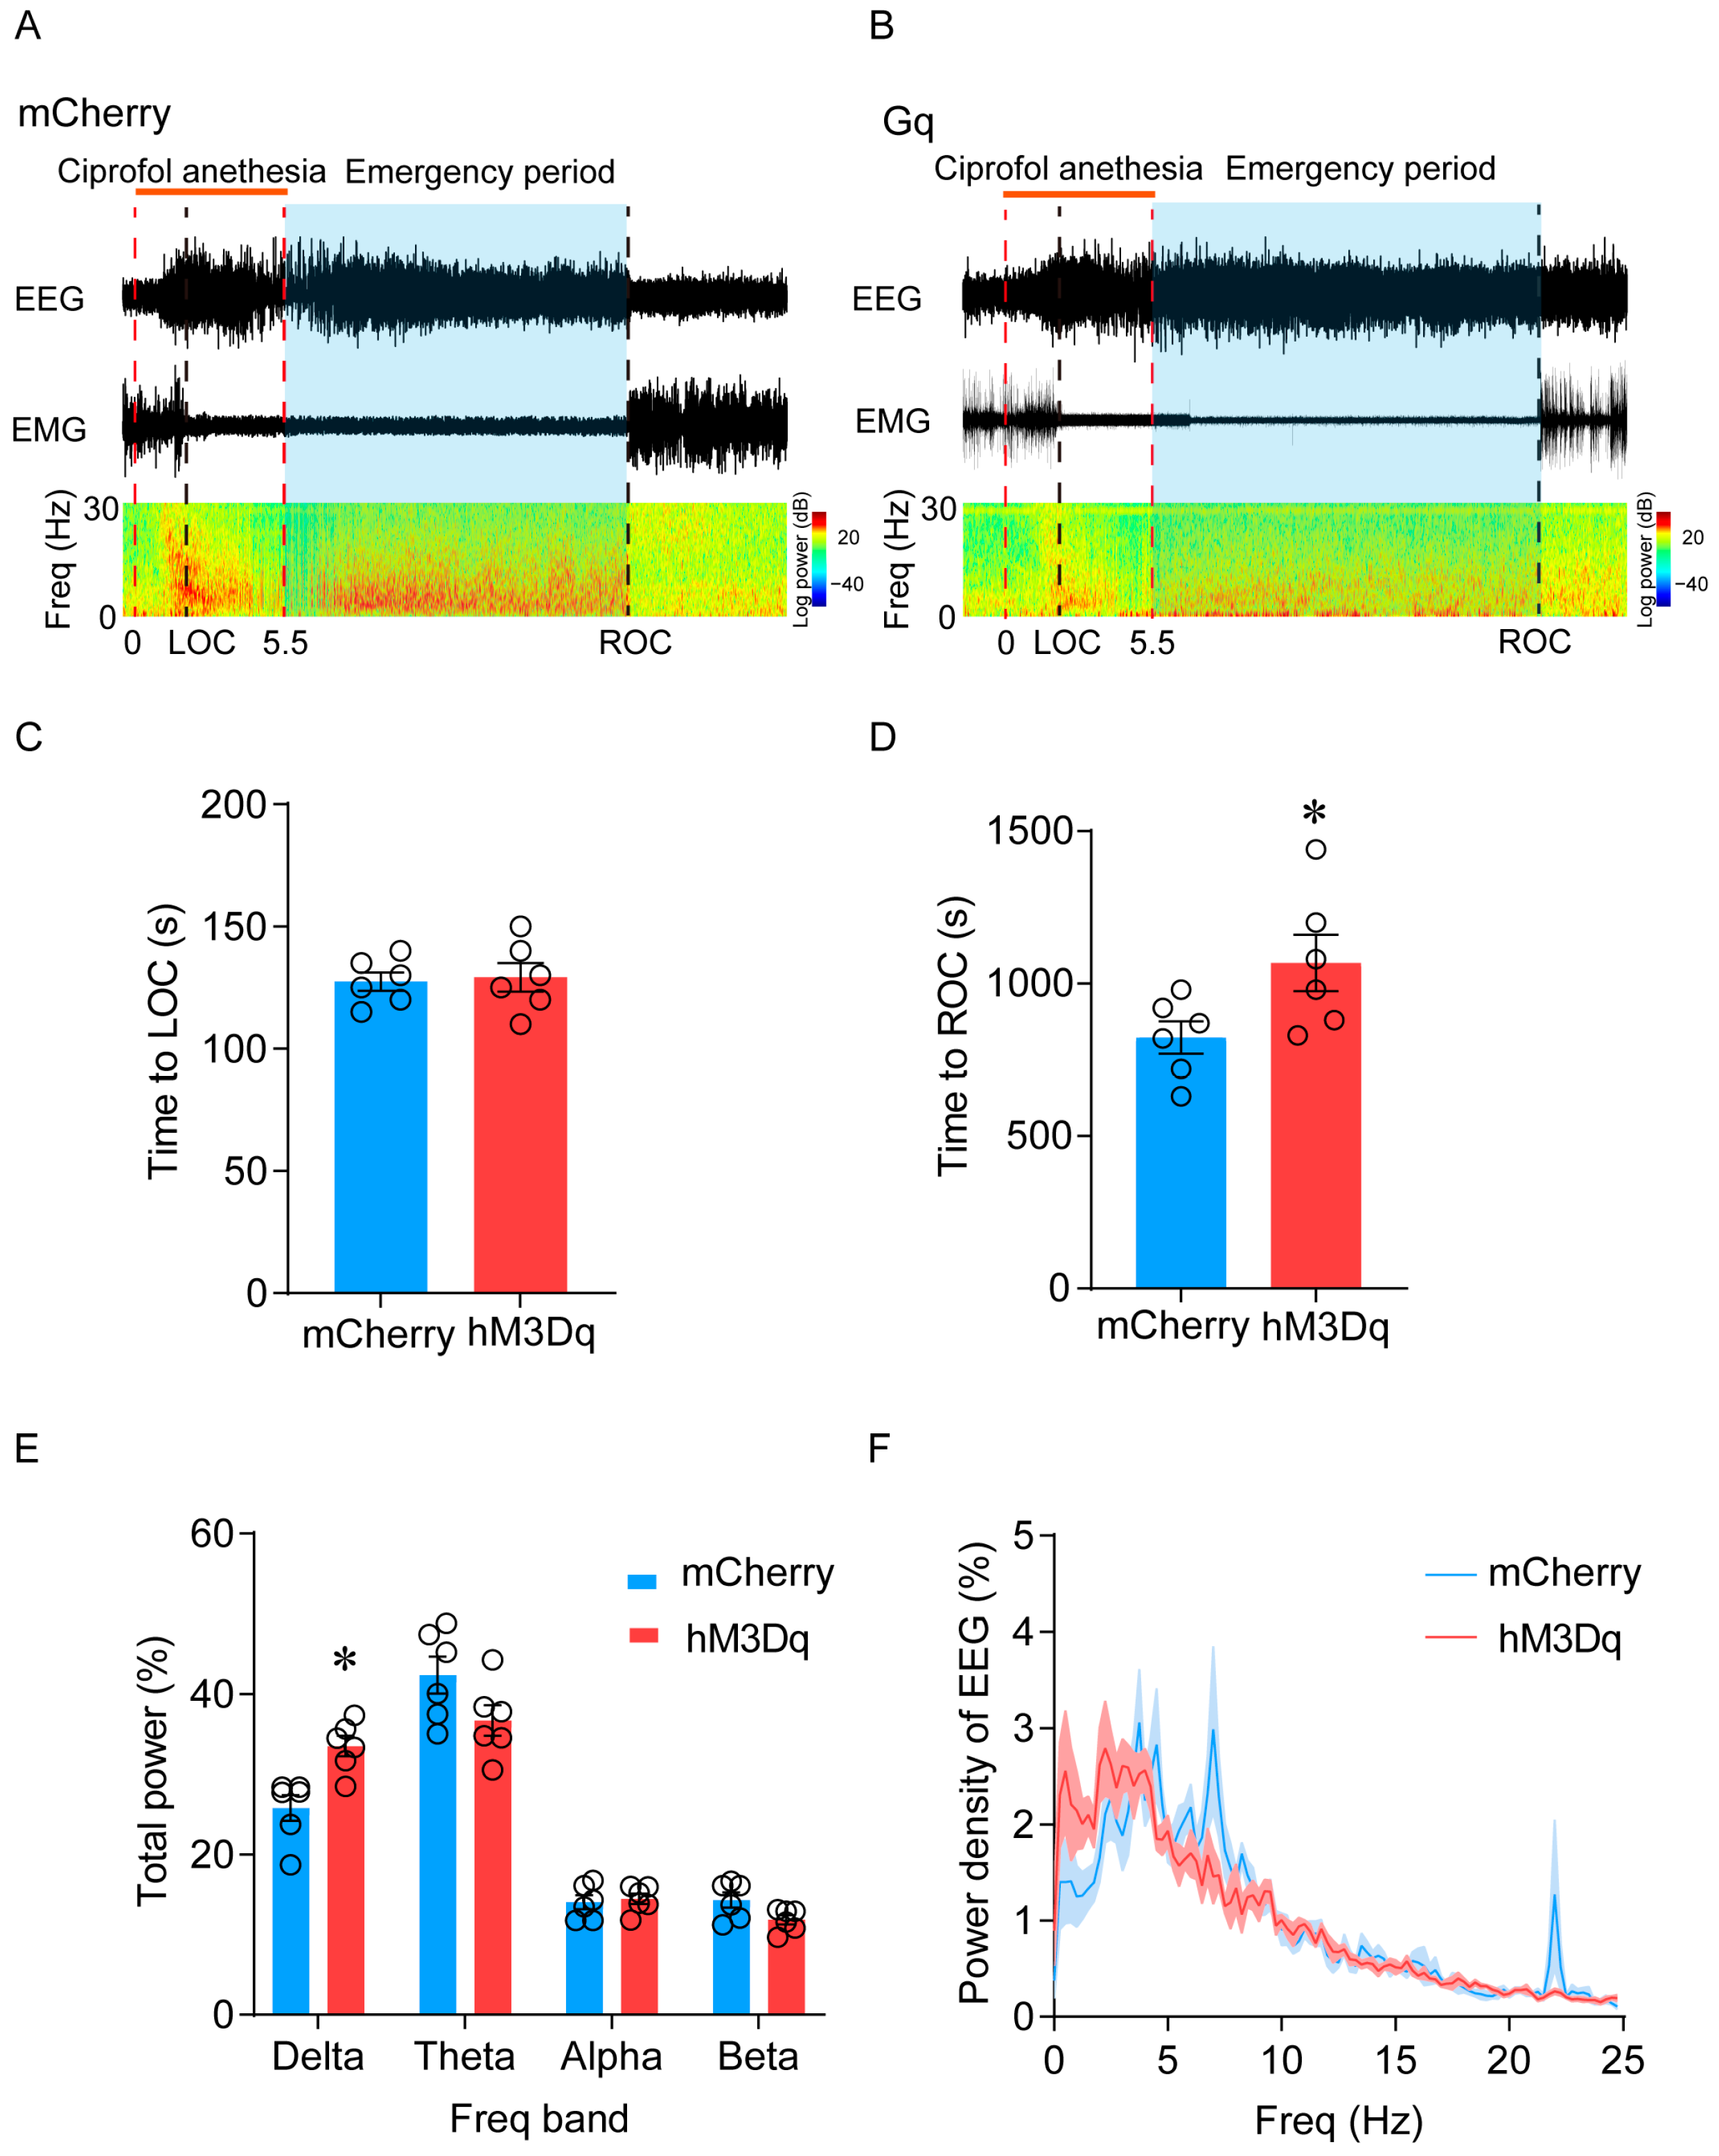
2.3. Activation of LHb Ciprofol-Activated Neurons Delays the Emergence of Anesthesia
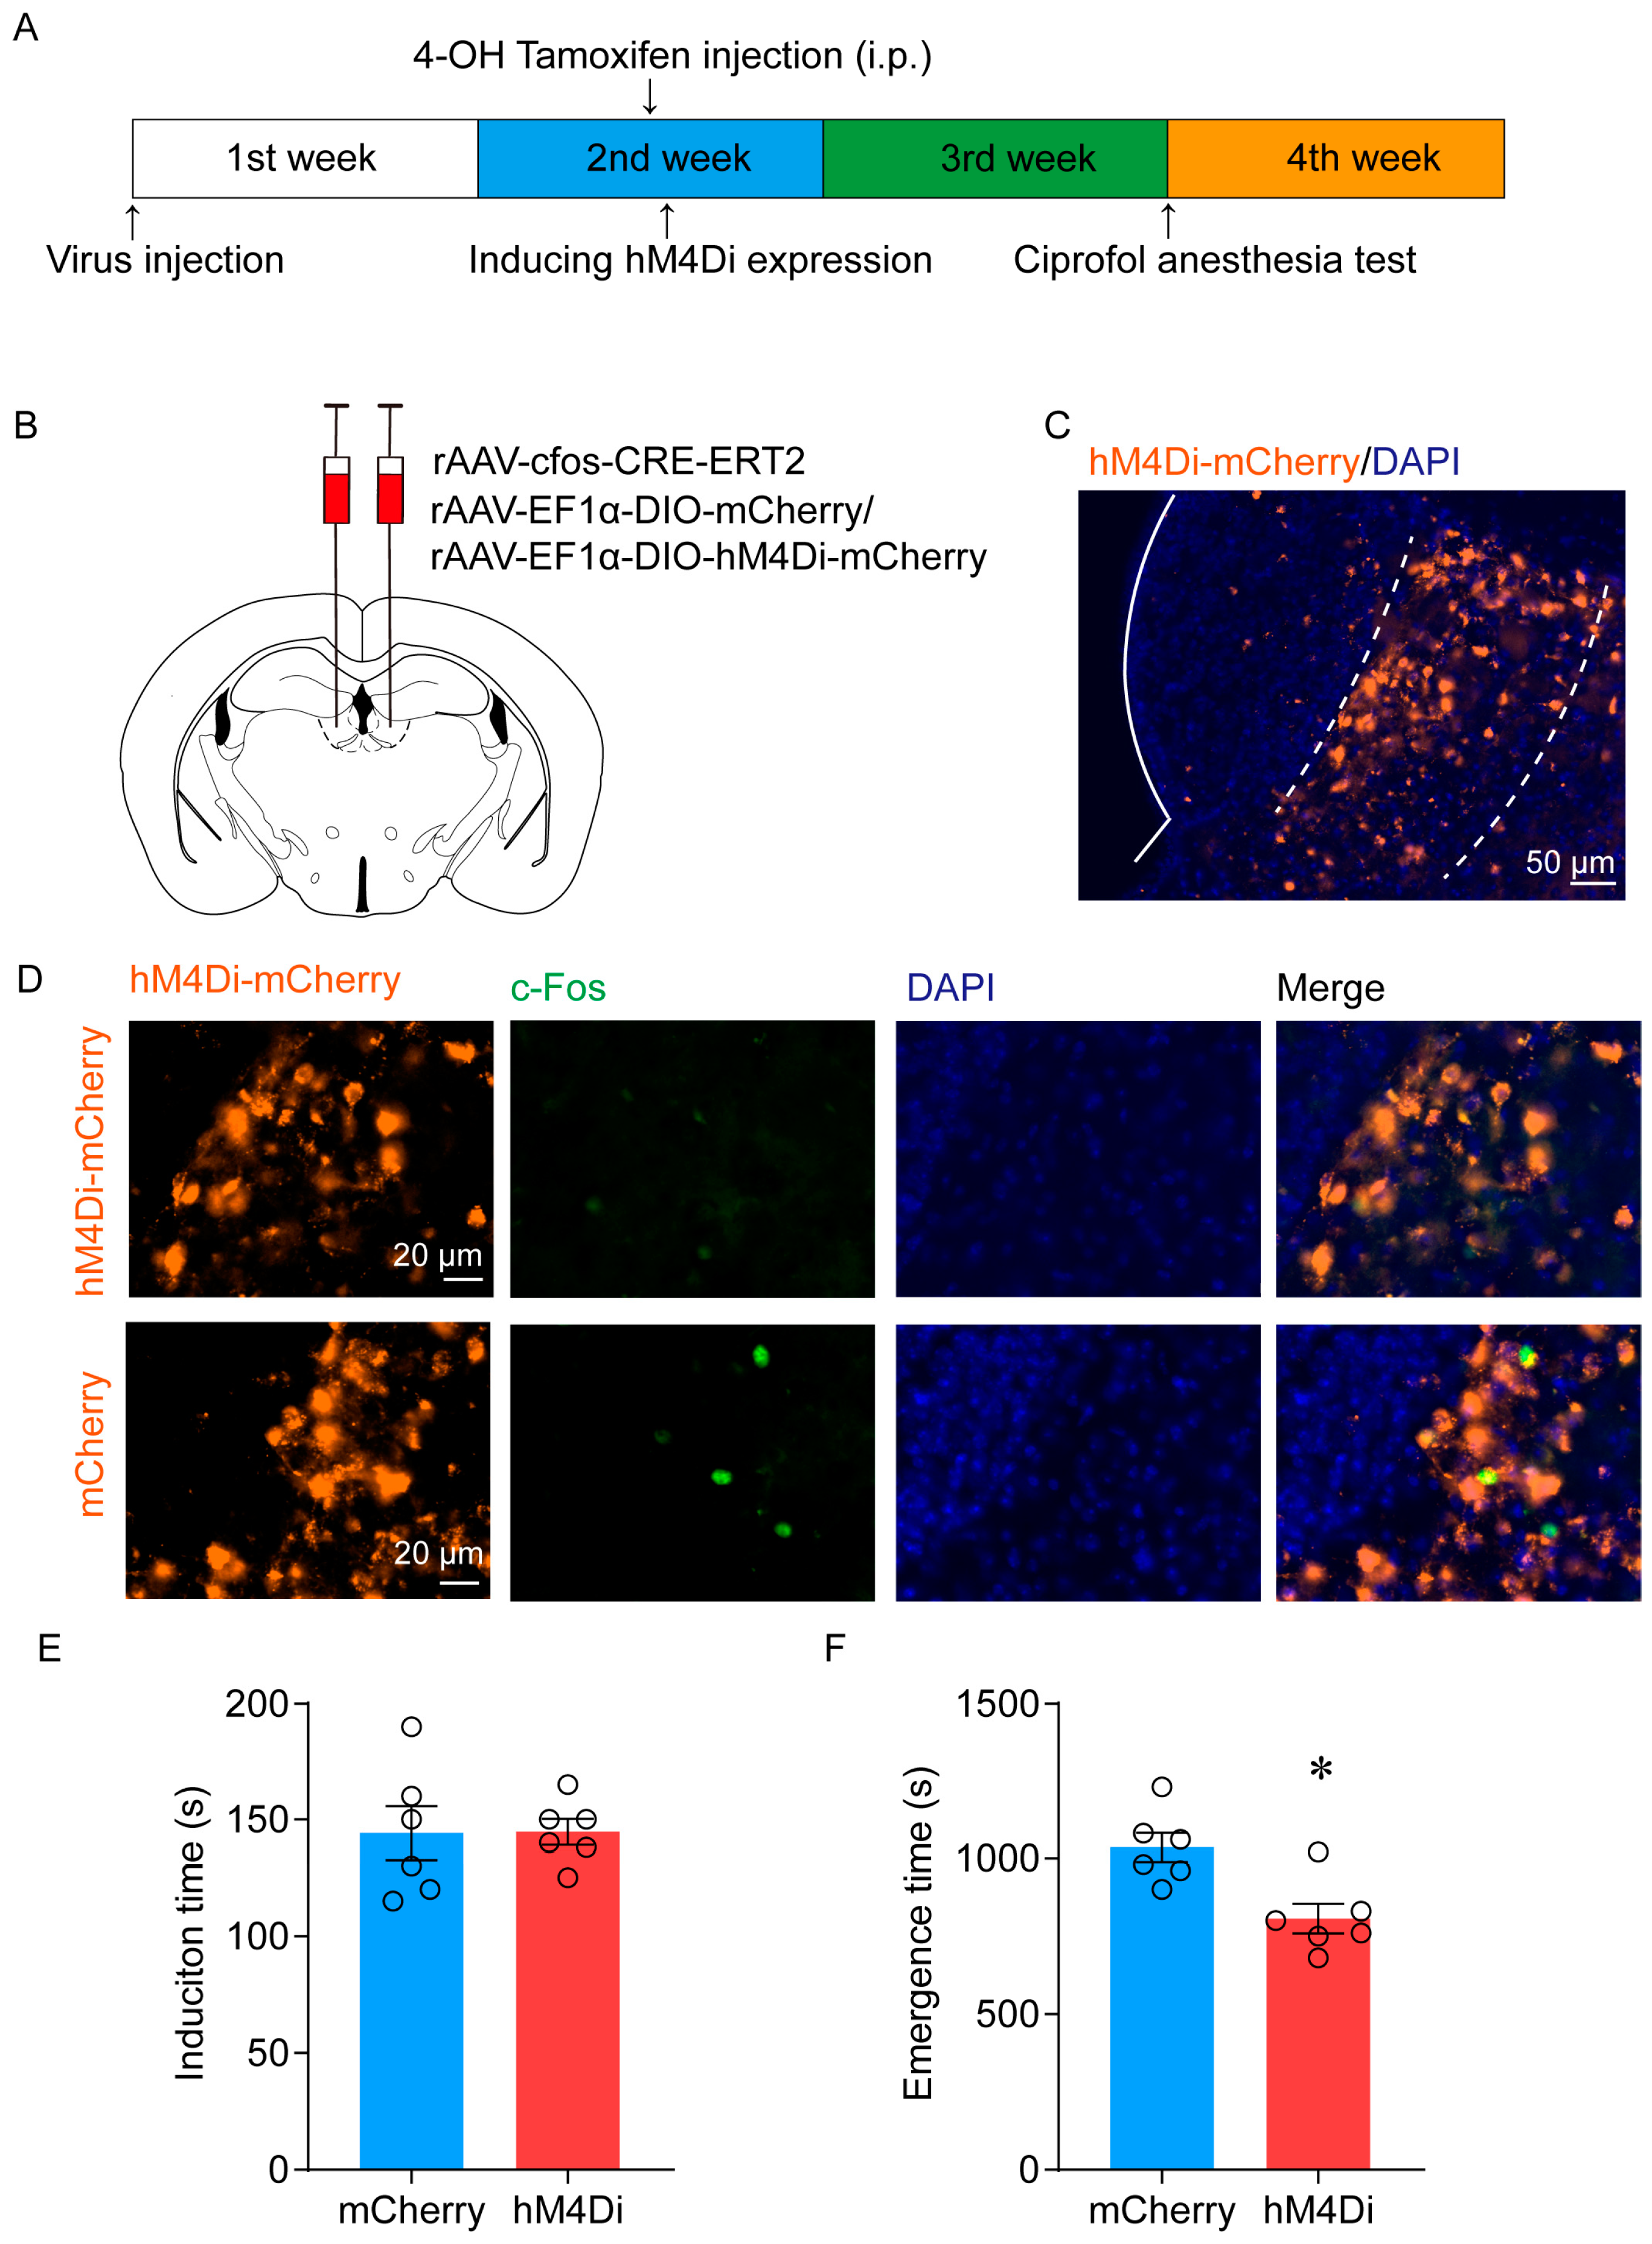
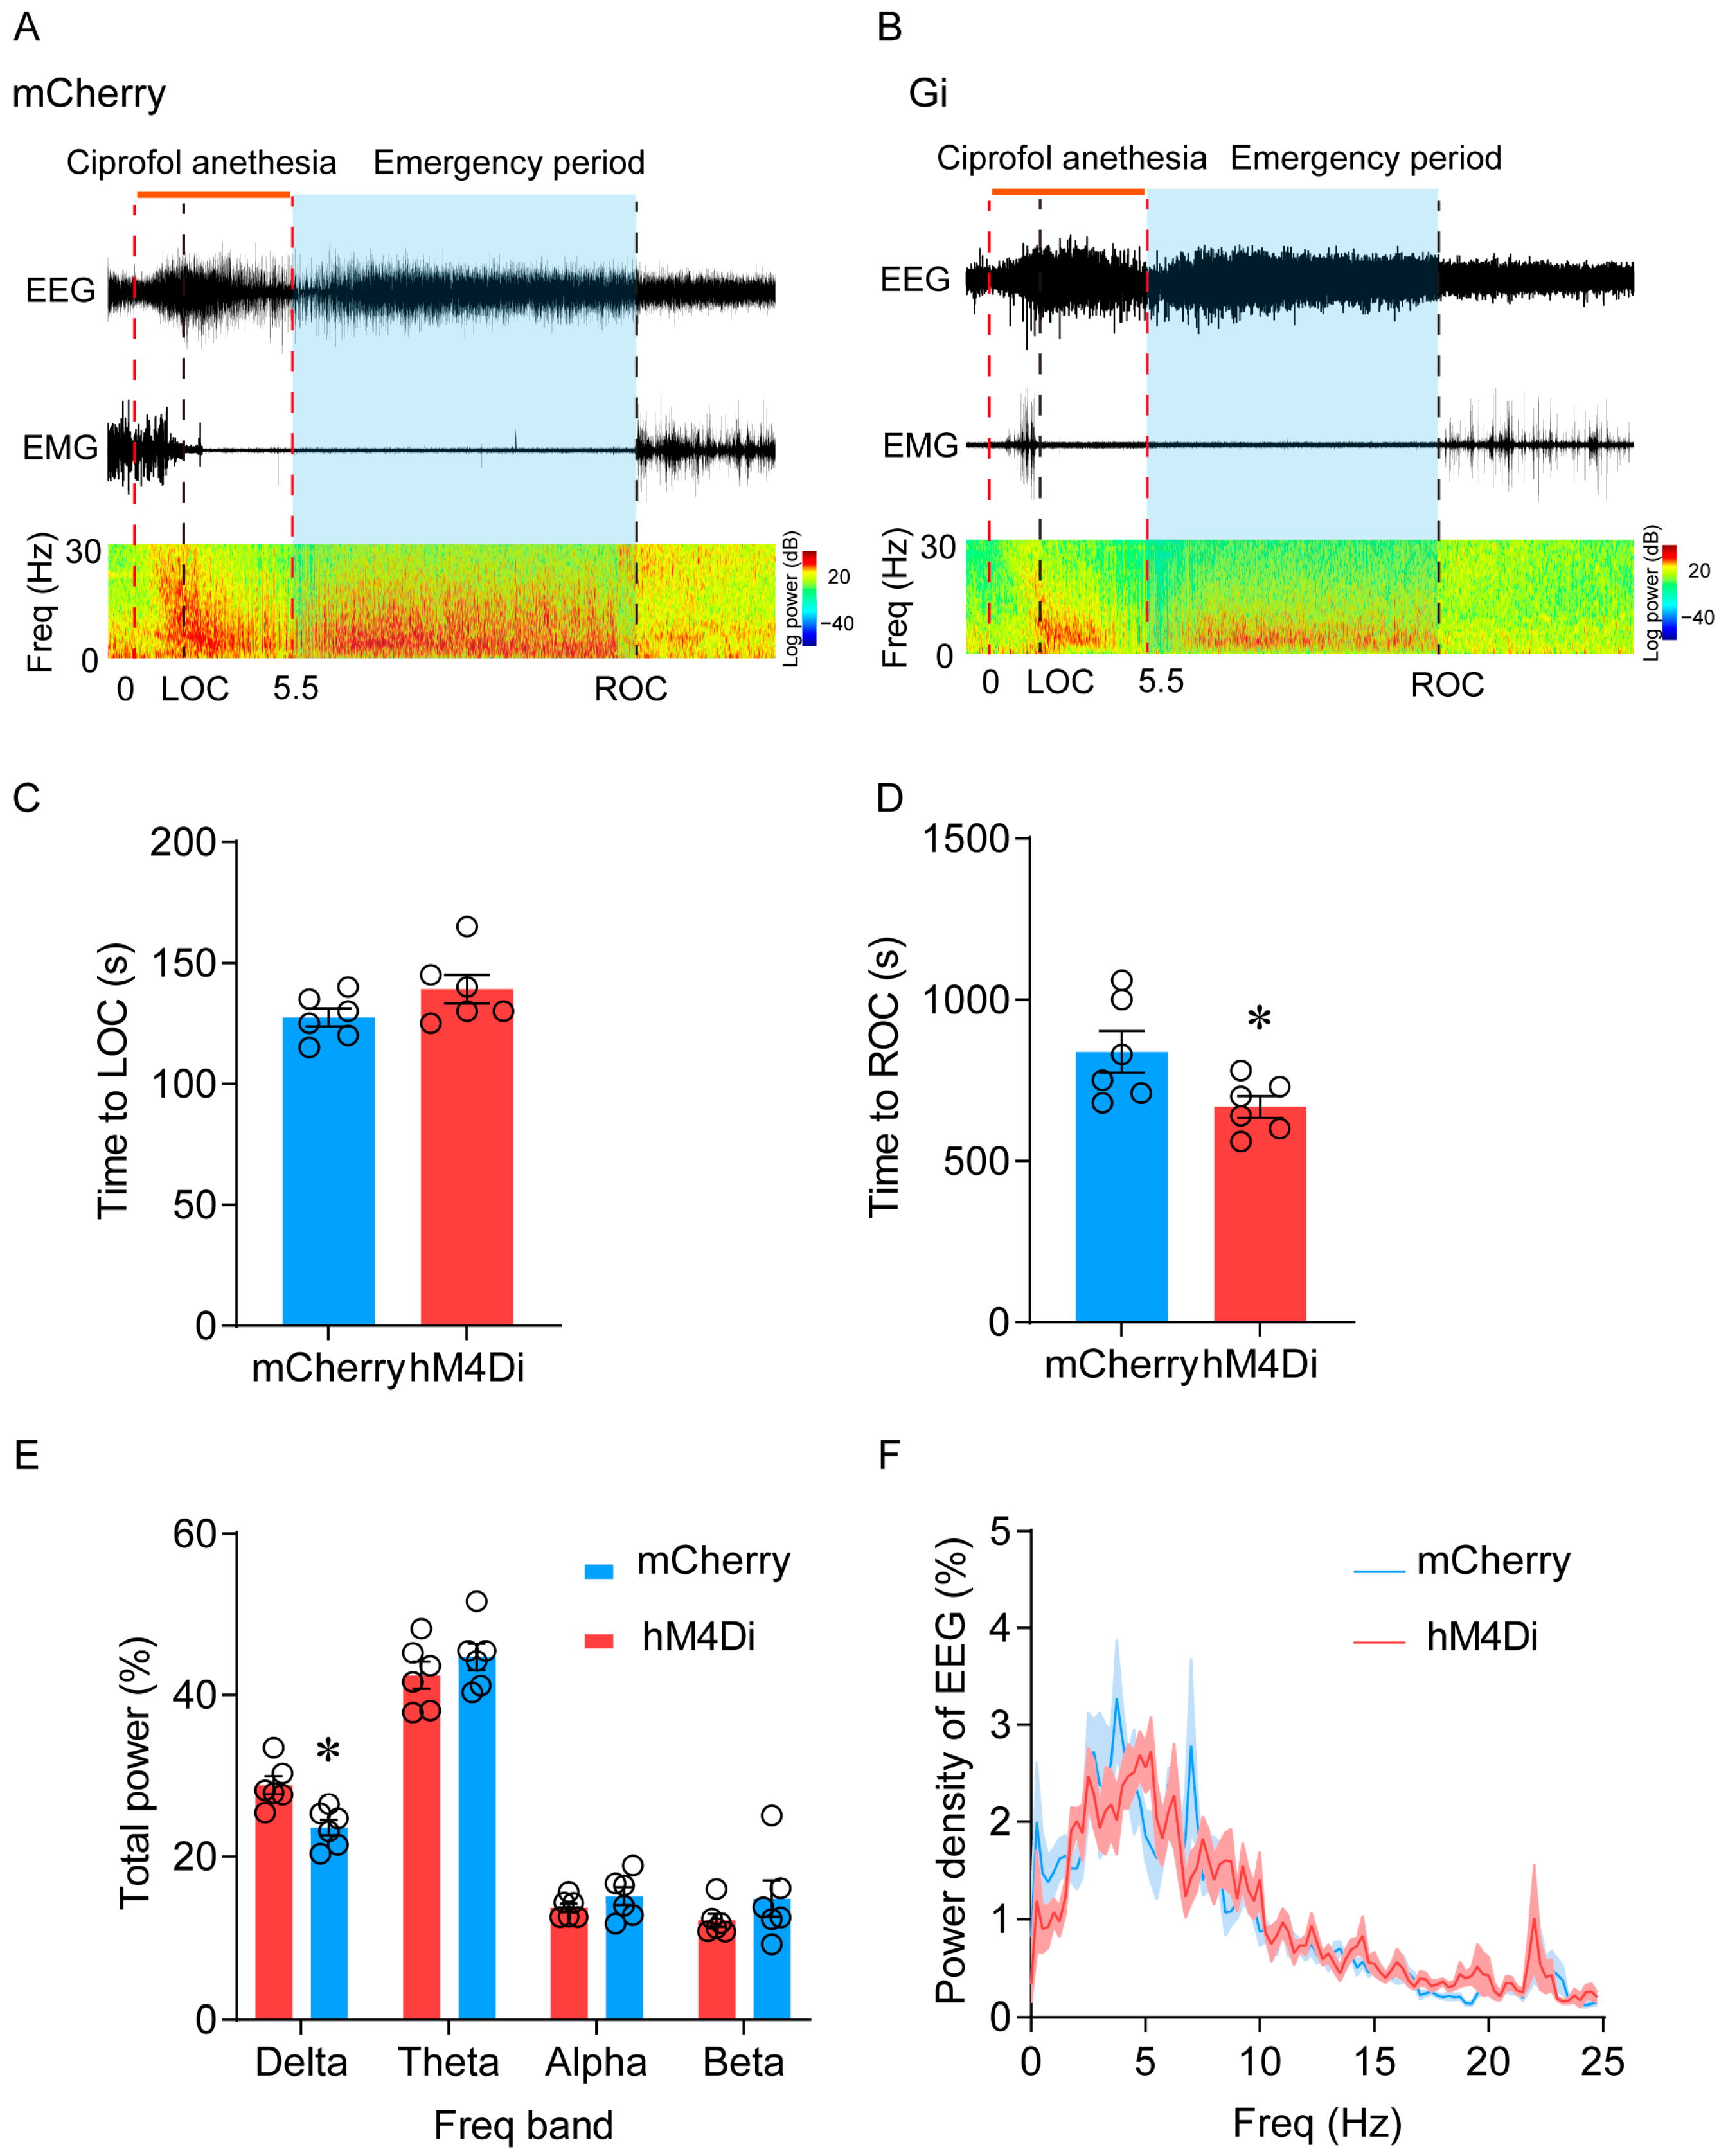
2.4. Inhibition of LHb Ciprofol-Activated Neurons Facilitates the Emergence of Anesthesia
3. Discussion
4. Materials and Methods
4.1. Mice
4.2. Stereotaxic Surgery
4.3. Labeling-Activated Ensembles
4.4. Ciprofol Anesthesia in Mice
4.5. Behavioral Test
4.6. EEG/EMG Recording and Analysis
4.7. Immunohistochemistry
4.8. Data Analysis and Statistics
5. Conclusions
Supplementary Materials
Author Contributions
Funding
Institutional Review Board Statement
Informed Consent Statement
Data Availability Statement
Conflicts of Interest
References
- Barends, C.R.M.; Absalom, A.R.; Struys, M. Drug selection for ambulatory procedural sedation. Curr. Opin. Anaesthesiol. 2018, 31, 673–678. [Google Scholar] [CrossRef] [PubMed]
- Qin, L.; Ren, L.; Wan, S.; Liu, G.; Luo, X.; Liu, Z.; Li, F.; Yu, Y.; Liu, J.; Wei, Y. Design, Synthesis, and Evaluation of Novel 2,6-Disubstituted Phenol Derivatives as General Anesthetics. J. Med. Chem. 2017, 60, 3606–3617. [Google Scholar] [CrossRef]
- Wei, Y.; Qiu, G.; Lei, B.; Qin, L.; Chu, H.; Lu, Y.; Zhu, G.; Gao, Q.; Huang, Q.; Qian, G.; et al. Oral Delivery of Propofol with Methoxymethyl phosphonic Acid as the Delivery Vehicle. J. Med. Chem. 2017, 60, 8580–8590. [Google Scholar] [CrossRef]
- Chen, B.Z.; Yin, X.Y.; Jiang, L.H.; Liu, J.H.; Shi, Y.Y.; Yuan, B.Y. The efficacy and safety of ciprofol use for the induction of general anesthesia in patients undergoing gynecological surgery: A prospective randomized controlled study. BMC Anesthesiol. 2022, 22, 245. [Google Scholar] [CrossRef] [PubMed]
- Zhong, J.; Zhang, J.; Fan, Y.; Zhu, M.; Zhao, X.; Zuo, Z.; Zhou, X.; Miao, C. Efficacy and safety of Ciprofol for procedural sedation and anesthesia in non-operating room settings. J. Clin. Anesth. 2023, 85, 111047. [Google Scholar] [CrossRef] [PubMed]
- Wu, X.; Liao, M.; Lin, X.; Hu, J.; Zhao, T.; Sun, H. Effective doses of ciprofol combined with alfentanil in inhibiting responses to gastroscope insertion, a prospective, single-arm, single-center study. BMC Anesthesiol. 2024, 24, 2. [Google Scholar] [CrossRef] [PubMed]
- Kelz, M.B.; García, P.S.; Mashour, G.A.; Solt, K. Escape from Oblivion: Neural Mechanisms of Emergence from General Anesthesia. Anesth. Analg. 2019, 128, 726–736. [Google Scholar] [CrossRef]
- Bao, W.W.; Jiang, S.; Qu, W.M.; Li, W.X.; Miao, C.H.; Huang, Z.L. Understanding the Neural Mechanisms of General Anesthesia from Interaction with Sleep-Wake State: A Decade of Discovery. Pharmacol. Rev. 2023, 75, 532–553. [Google Scholar] [CrossRef]
- Du, W.J.; Zhang, R.W.; Li, J.; Zhang, B.B.; Peng, X.L.; Cao, S.; Yuan, J.; Yuan, C.D.; Yu, T.; Du, J.L. The Locus Coeruleus Modulates Intravenous General Anesthesia of Zebrafish via a Cooperative Mechanism. Cell Rep. 2018, 24, 3146–3155.e3. [Google Scholar] [CrossRef]
- Cai, S.; Tang, A.C.; Luo, T.Y.; Yang, S.C.; Yang, H.; Liu, C.X.; Shu, Y.; Pan, Y.C.; Zhang, Y.; Zhou, L.; et al. Effect of basal forebrain somatostatin and parvalbumin neurons in propofol and isoflurane anesthesia. CNS Neurosci. Ther. 2021, 27, 792–804. [Google Scholar] [CrossRef]
- Luo, T.Y.; Cai, S.; Qin, Z.X.; Yang, S.C.; Shu, Y.; Liu, C.X.; Zhang, Y.; Zhang, L.; Zhou, L.; Yu, T.; et al. Basal Forebrain Cholinergic Activity Modulates Isoflurane and Propofol Anesthesia. Front. Neurosci. 2020, 14, 559077. [Google Scholar] [CrossRef] [PubMed]
- Liu, Y.; Chen, B.; Cai, Y.; Han, Y.; Xia, Y.; Li, N.; Fan, B.; Yuan, T.; Jiang, J.; Gao, P.O.; et al. Activation of anterior thalamic reticular nucleus GABAergic neurons promotes arousal from propofol anesthesia in mice. Acta Biochim. Biophys. Sin. 2021, 53, 883–892. [Google Scholar] [CrossRef]
- Wang, Y.L.; Wang, L.; Xu, W.; He, M.; Dong, H.; Shi, H.Y.; Chen, Y.Q.; Huang, Z.L. Paraventricular thalamus controls consciousness transitions during propofol anaesthesia in mice. Br. J. Anaesth. 2023, 130, 698–708. [Google Scholar] [CrossRef] [PubMed]
- Leung, L.S.; Ma, J.; Shen, B.; Nachim, I.; Luo, T. Medial septal lesion enhances general anesthesia response. Exp. Neurol. 2013, 247, 419–428. [Google Scholar] [CrossRef] [PubMed]
- Gelegen, C.; Miracca, G.; Ran, M.Z.; Harding, E.C.; Ye, Z.; Yu, X.; Tossell, K.; Houston, C.M.; Yustos, R.; Hawkins, E.D.; et al. Excitatory Pathways from the Lateral Habenula Enable Propofol-Induced Sedation. Curr. Biol. 2018, 28, 580–587.e5. [Google Scholar] [CrossRef]
- Hu, H.; Cui, Y.; Yang, Y. Circuits and functions of the lateral habenula in health and in disease. Nat. Rev. Neurosci. 2020, 21, 277–295. [Google Scholar] [CrossRef]
- Wagner, F.; French, L.; Veh, R.W. Transcriptomic-anatomic analysis of the mouse habenula uncovers a high molecular heterogeneity among neurons in the lateral complex, while gene expression in the medial complex largely obeys subnuclear boundaries. Brain Struct. Funct. 2016, 221, 39–58. [Google Scholar] [CrossRef]
- Flanigan, M.E.; Aleyasin, H.; Li, L.; Burnett, C.J.; Chan, K.L.; LeClair, K.B.; Lucas, E.K.; Matikainen-Ankney, B.; Durand-de Cuttoli, R.; Takahashi, A.; et al. Orexin signaling in GABAergic lateral habenula neurons modulates aggressive behavior in male mice. Nat. Neurosci. 2020, 23, 638–650. [Google Scholar] [CrossRef]
- Liu, C.; Liu, J.; Zhou, L.; He, H.; Zhang, Y.; Cai, S.; Yuan, C.; Luo, T.; Zheng, J.; Yu, T.; et al. Lateral Habenula Glutamatergic Neurons Modulate Isoflurane Anesthesia in Mice. Front. Mol. Neurosci. 2021, 14, 628996. [Google Scholar] [CrossRef]
- Bao, W.W.; Xu, W.; Pan, G.J.; Wang, T.X.; Han, Y.; Qu, W.M.; Li, W.X.; Huang, Z.L. Nucleus accumbens neurons expressing dopamine D1 receptors modulate states of consciousness in sevoflurane anesthesia. Curr. Biol. 2021, 31, 1893–1902.e5. [Google Scholar] [CrossRef]
- Gan, T.J.; Bertoch, T.; Habib, A.S.; Yan, P.; Zhou, R.; Lai, Y.L.; Liu, X.; Essandoh, M.; Daley, W.L.; Gelb, A.W. Comparison of the Efficacy of HSK3486 and Propofol for Induction of General Anesthesia in Adults: A Multicenter, Randomized, Double-Blind, Controlled, Phase 3 Noninferiority Trial. Anesthesiology, 2023; Online ahead of print. [Google Scholar] [CrossRef]
- Hu, J.; Gu, X.; Zhu, W.; Zhu, X.; Ji, F.; Luo, Y.; Liu, N. Comparison of anesthetic effects of different doses of alfentanil combined with ciprofol in elderly patients undergoing ERCP: A randomized controlled trial. BMC Anesthesiol. 2023, 23, 353. [Google Scholar] [CrossRef] [PubMed]
- Aizawa, H.; Yanagihara, S.; Kobayashi, M.; Niisato, K.; Takekawa, T.; Harukuni, R.; McHugh, T.J.; Fukai, T.; Isomura, Y.; Okamoto, H. The synchronous activity of lateral habenular neurons is essential for regulating hippocampal theta oscillation. J. Neurosci. 2013, 33, 8909–8921. [Google Scholar] [CrossRef] [PubMed]
- Zhang, L.; Hernández, V.S.; Swinny, J.D.; Verma, A.K.; Giesecke, T.; Emery, A.C.; Mutig, K.; Garcia-Segura, L.M.; Eiden, L.E. A GABAergic cell type in the lateral habenula links hypothalamic homeostatic and midbrain motivation circuits with sex steroid signaling. Transl. Psychiatry 2018, 8, 50. [Google Scholar] [CrossRef] [PubMed]
- Wallace, M.L.; Huang, K.W.; Hochbaum, D.; Hyun, M.; Radeljic, G.; Sabatini, B.L. Anatomical and single-cell transcriptional profiling of the murine habenular complex. eLife 2020, 9, e51271. [Google Scholar] [CrossRef] [PubMed]
- Aizawa, H.; Kobayashi, M.; Tanaka, S.; Fukai, T.; Okamoto, H. Molecular characterization of the subnuclei in rat habenula. J. Comp. Neurol. 2012, 520, 4051–4066. [Google Scholar] [CrossRef]
- Xu, Z.; Hu, S.W.; Zhou, Y.; Guo, Q.; Wang, D.; Gao, Y.H.; Zhao, W.N.; Tang, H.M.; Yang, J.X.; Yu, X.; et al. Corticotropin-releasing factor neurones in the paraventricular nucleus of the hypothalamus modulate isoflurane anaesthesia and its responses to acute stress in mice. Br. J. Anaesth. 2023, 130, 446–458. [Google Scholar] [CrossRef]
- Li, A.; Li, R.; Ouyang, P.; Li, H.; Wang, S.; Zhang, X.; Wang, D.; Ran, M.; Zhao, G.; Yang, Q.; et al. Dorsal raphe serotonergic neurons promote arousal from isoflurane anesthesia. CNS Neurosci. Ther. 2021, 27, 941–950. [Google Scholar] [CrossRef]
- Wang, D.; Guo, Y.; Li, H.; Li, J.; Ran, M.; Guo, J.; Yin, L.; Zhao, S.; Yang, Q.; Dong, H. Selective optogenetic activation of orexinergic terminals in the basal forebrain and locus coeruleus promotes emergence from isoflurane anaesthesia in rats. Br. J. Anaesth. 2021, 126, 279–292. [Google Scholar] [CrossRef]
- Zhou, F.; Wang, D.; Li, H.; Wang, S.; Zhang, X.; Li, A.; Tong, T.; Zhong, H.; Yang, Q.; Dong, H. Orexinergic innervations at GABAergic neurons of the lateral habenula mediates the anesthetic potency of sevoflurane. CNS Neurosci. Ther. 2023, 29, 1332–1344. [Google Scholar] [CrossRef]
- Stamatakis, A.M.; Stuber, G.D. Activation of lateral habenula inputs to the ventral midbrain promotes behavioral avoidance. Nat. Neurosci. 2012, 15, 1105–1107. [Google Scholar] [CrossRef]
- Brown, P.L.; Palacorolla, H.; Brady, D.; Riegger, K.; Elmer, G.I.; Shepard, P.D. Habenula-Induced Inhibition of Midbrain Dopamine Neurons Is Diminished by Lesions of the Rostromedial Tegmental Nucleus. J. Neurosci. 2017, 37, 217–225. [Google Scholar] [CrossRef] [PubMed]
- Huang, L.; Chen, X.; Tao, Q.; Wang, X.; Huang, X.; Fu, Y.; Yang, Y.; Deng, S.; Lin, S.; So, K.F.; et al. Bright light treatment counteracts stress-induced sleep alterations in mice, via a visual circuit related to the rostromedial tegmental nucleus. PLoS Biol. 2023, 21, e3002282. [Google Scholar] [CrossRef] [PubMed]
- Zhao, Y.N.; Jiang, J.B.; Tao, S.Y.; Zhang, Y.; Chen, Z.K.; Qu, W.M.; Huang, Z.L.; Yang, S.R. GABAergic neurons in the rostromedial tegmental nucleus are essential for rapid eye movement sleep suppression. Nat. Commun. 2022, 13, 7552. [Google Scholar] [CrossRef] [PubMed]
- Yang, S.R.; Hu, Z.Z.; Luo, Y.J.; Zhao, Y.N.; Sun, H.X.; Yin, D.; Wang, C.Y.; Yan, Y.D.; Wang, D.R.; Yuan, X.S.; et al. The rostromedial tegmental nucleus is essential for non-rapid eye movement sleep. PLoS Biol. 2018, 16, e2002909. [Google Scholar] [CrossRef] [PubMed]
- Taylor, N.E.; Van Dort, C.J.; Kenny, J.D.; Pei, J.; Guidera, J.A.; Vlasov, K.Y.; Lee, J.T.; Boyden, E.S.; Brown, E.N.; Solt, K. Optogenetic activation of dopamine neurons in the ventral tegmental area induces reanimation from general anesthesia. Proc. Natl. Acad. Sci. USA 2016, 113, 12826–12831. [Google Scholar] [CrossRef]
- Sego, C.; Gonçalves, L.; Lima, L.; Furigo, I.C.; Donato, J., Jr.; Metzger, M. Lateral habenula and the rostromedial tegmental nucleus innervate neurochemically distinct subdivisions of the dorsal raphe nucleus in the rat. J. Comp. Neurol. 2014, 522, 1454–1484. [Google Scholar] [CrossRef]
- Metzger, M.; Bueno, D.; Lima, L.B. The lateral habenula and the serotonergic system. Pharmacol. Biochem. Behav. 2017, 162, 22–28. [Google Scholar] [CrossRef] [PubMed]
- Yang, C.; Zhang, L.; Hao, H.; Ran, M.; Li, J.; Dong, H. Serotonergic neurons in the dorsal raphe nucleus mediate the arousal-promoting effect of orexin during isoflurane anesthesia in male rats. Neuropeptides 2019, 75, 25–33. [Google Scholar] [CrossRef]
- Ma, H.; Gu, L.; Wang, Y.; Xu, Q.; Zhang, Y.; Shao, W.; Yu, Q.; Lian, X.; Liu, L.; Gu, J.; et al. The States of Different 5-HT Receptors Located in the Dorsal Raphe Nucleus Are Crucial for Regulating the Awakening during General Anesthesia. Mol. Neurobiol. 2023, 60, 6931–6948. [Google Scholar] [CrossRef]
- Zhang, Z.; Wang, H.J.; Wang, D.R.; Qu, W.M.; Huang, Z.L. Red light at intensities above 10 lx alters sleep-wake behavior in mice. Light Sci. Appl. 2017, 6, e16231. [Google Scholar] [CrossRef]
- Dong, H.; Chen, Z.K.; Guo, H.; Yuan, X.S.; Liu, C.W.; Qu, W.M.; Huang, Z.L. Striatal neurons expressing dopamine D(1) receptor promote wakefulness in mice. Curr. Biol. 2022, 32, 600–613.e4. [Google Scholar] [CrossRef]
- Wang, T.X.; Xiong, B.; Xu, W.; Wei, H.H.; Qu, W.M.; Hong, Z.Y.; Huang, Z.L. Activation of Parabrachial Nucleus Glutamatergic Neurons Accelerates Reanimation from Sevoflurane Anesthesia in Mice. Anesthesiology 2019, 130, 106–118. [Google Scholar] [CrossRef] [PubMed]
- Guenthner, C.J.; Miyamichi, K.; Yang, H.H.; Heller, H.C.; Luo, L. Permanent genetic access to transiently active neurons via TRAP: Targeted recombination in active populations. Neuron 2013, 78, 773–784. [Google Scholar] [CrossRef] [PubMed]
- Yi, T.; Wang, N.; Huang, J.; Wang, Y.; Ren, S.; Hu, Y.; Xia, J.; Liao, Y.; Li, X.; Luo, F.; et al. A Sleep-Specific Midbrain Target for Sevoflurane Anesthesia. Adv. Sci. 2023, 10, e2300189. [Google Scholar] [CrossRef] [PubMed]
- Huang, Z.L.; Qu, W.M.; Eguchi, N.; Chen, J.F.; Schwarzschild, M.A.; Fredholm, B.B.; Urade, Y.; Hayaishi, O. Adenosine A2A, but not A1, receptors mediate the arousal effect of caffeine. Nat. Neurosci. 2005, 8, 858–859. [Google Scholar] [CrossRef] [PubMed]
- Luo, Y.J.; Li, Y.D.; Wang, L.; Yang, S.R.; Yuan, X.S.; Wang, J.; Cherasse, Y.; Lazarus, M.; Chen, J.F.; Qu, W.M.; et al. Nucleus accumbens controls wakefulness by a subpopulation of neurons expressing dopamine D(1) receptors. Nat. Commun. 2018, 9, 1576. [Google Scholar] [CrossRef]
- Bao, W.; Ding, J.; Jiang, S.; Yao, Z.; Qu, W.; Li, W.; Huang, Z.; Han, Y. Selective Activation of NAc D1R-VP/LH Circuits Promotes Reanimation from Sevoflurane Anesthesia in Mice. Anesth. Analg. 2023, 137, 87–97. [Google Scholar] [CrossRef]


Disclaimer/Publisher’s Note: The statements, opinions and data contained in all publications are solely those of the individual author(s) and contributor(s) and not of MDPI and/or the editor(s). MDPI and/or the editor(s) disclaim responsibility for any injury to people or property resulting from any ideas, methods, instructions or products referred to in the content. |
© 2024 by the authors. Licensee MDPI, Basel, Switzerland. This article is an open access article distributed under the terms and conditions of the Creative Commons Attribution (CC BY) license (https://creativecommons.org/licenses/by/4.0/).
Share and Cite
Zhou, K.; Zhang, L.-C.; Zhu, H.; Wen, B.; Tang, J.-L.; Yuan, P.-C.; Zhu, A.-F.; Huang, Y.-G. A Common Neuronal Ensemble in the Lateral Habenula Regulates Ciprofol Anesthesia in Mice. Pharmaceuticals 2024, 17, 363. https://doi.org/10.3390/ph17030363
Zhou K, Zhang L-C, Zhu H, Wen B, Tang J-L, Yuan P-C, Zhu A-F, Huang Y-G. A Common Neuronal Ensemble in the Lateral Habenula Regulates Ciprofol Anesthesia in Mice. Pharmaceuticals. 2024; 17(3):363. https://doi.org/10.3390/ph17030363
Chicago/Turabian StyleZhou, Kang, Lin-Chen Zhang, He Zhu, Bei Wen, Jia-Li Tang, Ping-Chuan Yuan, A-Fang Zhu, and Yu-Guang Huang. 2024. "A Common Neuronal Ensemble in the Lateral Habenula Regulates Ciprofol Anesthesia in Mice" Pharmaceuticals 17, no. 3: 363. https://doi.org/10.3390/ph17030363
APA StyleZhou, K., Zhang, L.-C., Zhu, H., Wen, B., Tang, J.-L., Yuan, P.-C., Zhu, A.-F., & Huang, Y.-G. (2024). A Common Neuronal Ensemble in the Lateral Habenula Regulates Ciprofol Anesthesia in Mice. Pharmaceuticals, 17(3), 363. https://doi.org/10.3390/ph17030363